Embed Size (px)
Citation preview

A new way to do optimizer troubleshooting in MariaDB 10.1
ANALYZE for executable statements
Sergei Petrunia, MariaDBPercona Live Santa ClaraApril 2015

2
Background
Optimizer troubleshooting workflow
2
3
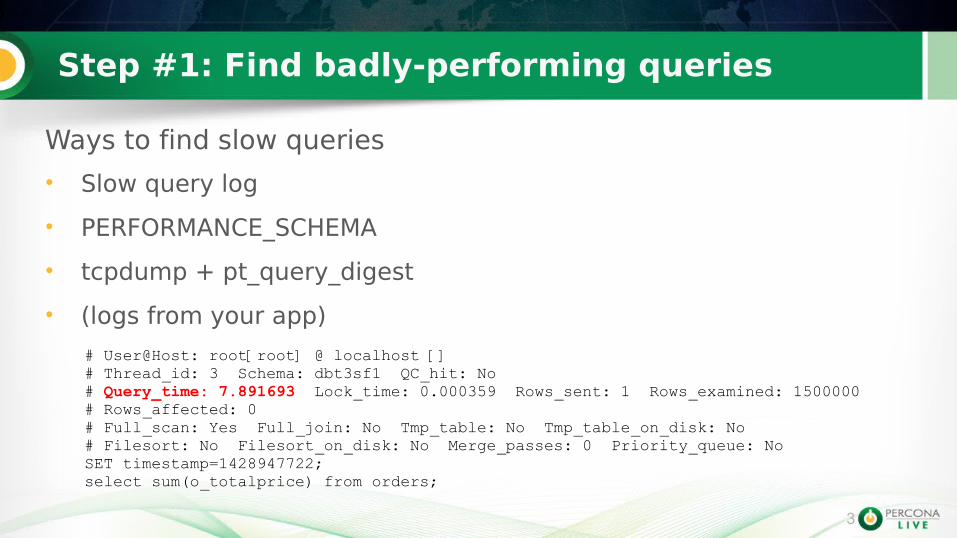
Step #1: Find badly-performing queries
Ways to find slow queries
• Slow query log
• PERFORMANCE_SCHEMA
• tcpdump + pt_query_digest
• (logs from your app)
3
# User@Host: root[root] @ localhost []# Thread_id: 3 Schema: dbt3sf1 QC_hit: No# Query_time: 7.891693 Lock_time: 0.000359 Rows_sent: 1 Rows_examined: 1500000# Rows_affected: 0# Full_scan: Yes Full_join: No Tmp_table: No Tmp_table_on_disk: No# Filesort: No Filesort_on_disk: No Merge_passes: 0 Priority_queue: NoSET timestamp=1428947722;select sum(o_totalprice) from orders;
4
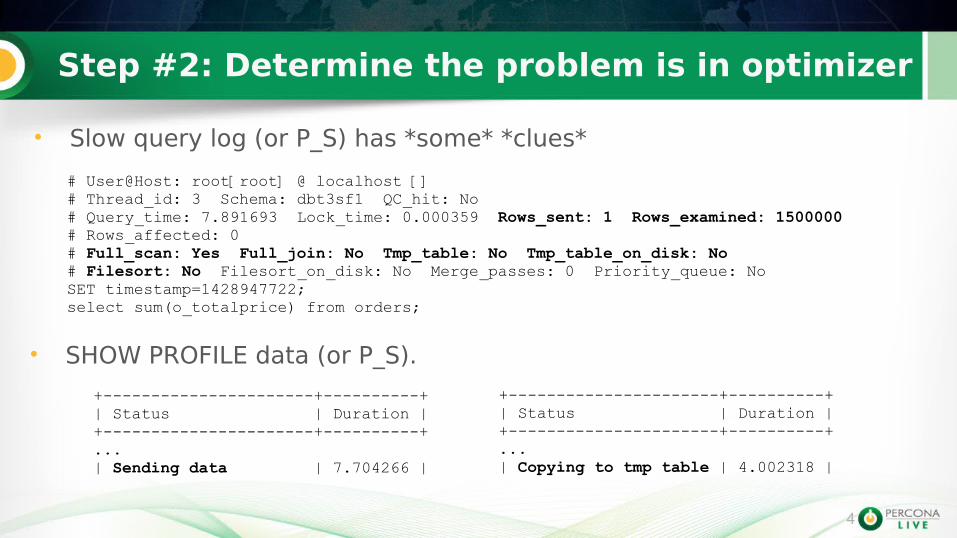
Step #2: Determine the problem is in optimizer
• Slow query log (or P_S) has *some* *clues*
4
# User@Host: root[root] @ localhost []# Thread_id: 3 Schema: dbt3sf1 QC_hit: No# Query_time: 7.891693 Lock_time: 0.000359 Rows_sent: 1 Rows_examined: 1500000# Rows_affected: 0# Full_scan: Yes Full_join: No Tmp_table: No Tmp_table_on_disk: No# Filesort: No Filesort_on_disk: No Merge_passes: 0 Priority_queue: NoSET timestamp=1428947722;select sum(o_totalprice) from orders;
+----------------------+----------+| Status | Duration |+----------------------+----------+...| Sending data | 7.704266 |
• SHOW PROFILE data (or P_S).
+----------------------+----------+| Status | Duration |+----------------------+----------+...| Copying to tmp table | 4.002318 |
5
5
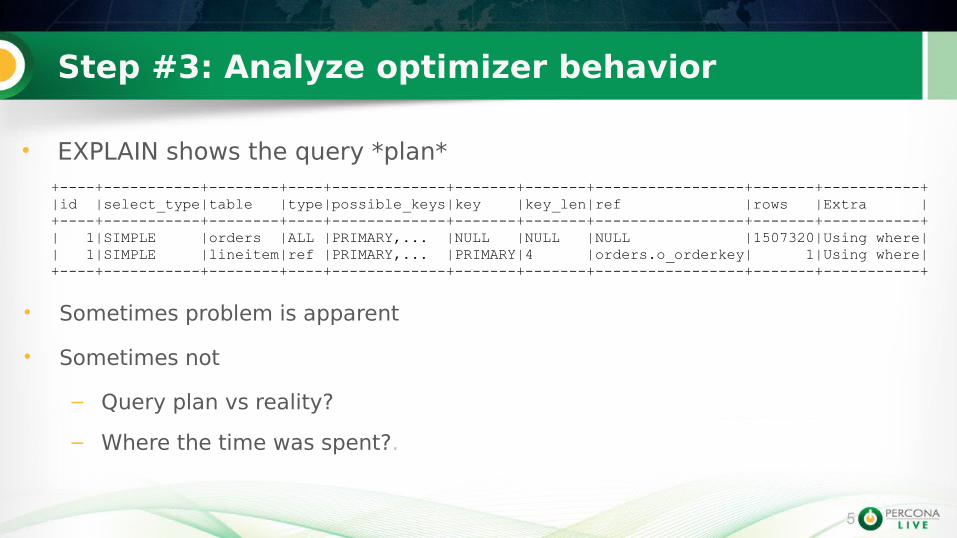
+----+-----------+--------+----+-------------+-------+-------+-----------------+-------+-----------+|id |select_type|table |type|possible_keys|key |key_len|ref |rows |Extra |+----+-----------+--------+----+-------------+-------+-------+-----------------+-------+-----------+| 1|SIMPLE |orders |ALL |PRIMARY,... |NULL |NULL |NULL |1507320|Using where|| 1|SIMPLE |lineitem|ref |PRIMARY,... |PRIMARY|4 |orders.o_orderkey| 1|Using where|+----+-----------+--------+----+-------------+-------+-------+-----------------+-------+-----------+
• Sometimes problem is apparent
• Sometimes not
– Query plan vs reality?
– Where the time was spent?.
Step #3: Analyze optimizer behavior
• EXPLAIN shows the query *plan*
6
6
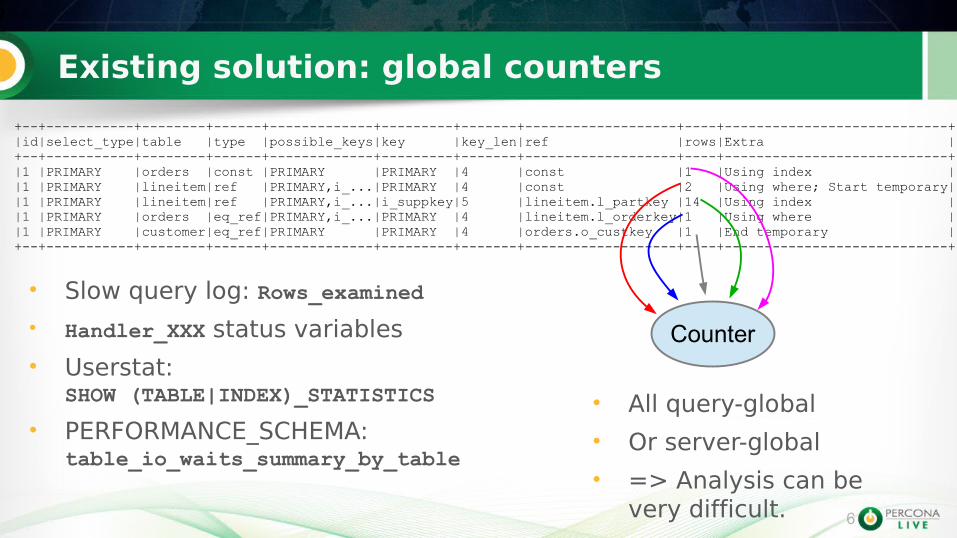
Existing solution: global counters
• Slow query log: Rows_examined
• Handler_XXX status variables
• Userstat:SHOW (TABLE|INDEX)_STATISTICS
• PERFORMANCE_SCHEMA: table_io_waits_summary_by_table
+--+-----------+--------+------+-------------+---------+-------+-------------------+----+----------------------------+|id|select_type|table |type |possible_keys|key |key_len|ref |rows|Extra |+--+-----------+--------+------+-------------+---------+-------+-------------------+----+----------------------------+|1 |PRIMARY |orders |const |PRIMARY |PRIMARY |4 |const |1 |Using index ||1 |PRIMARY |lineitem|ref |PRIMARY,i_...|PRIMARY |4 |const |2 |Using where; Start temporary||1 |PRIMARY |lineitem|ref |PRIMARY,i_...|i_suppkey|5 |lineitem.l_partkey |14 |Using index ||1 |PRIMARY |orders |eq_ref|PRIMARY,i_...|PRIMARY |4 |lineitem.l_orderkey|1 |Using where ||1 |PRIMARY |customer|eq_ref|PRIMARY |PRIMARY |4 |orders.o_custkey |1 |End temporary |+--+-----------+--------+------+-------------+---------+-------+-------------------+----+----------------------------+
Counter
• All query-global
• Or server-global
• => Analysis can bevery difficult.
7
A solution
ANALYZE command
7
Similar to
• PostgreSQL's EXPLAIN ANALYZE
• Oracle's V$SQL_PLAN_STATISTICS.
8
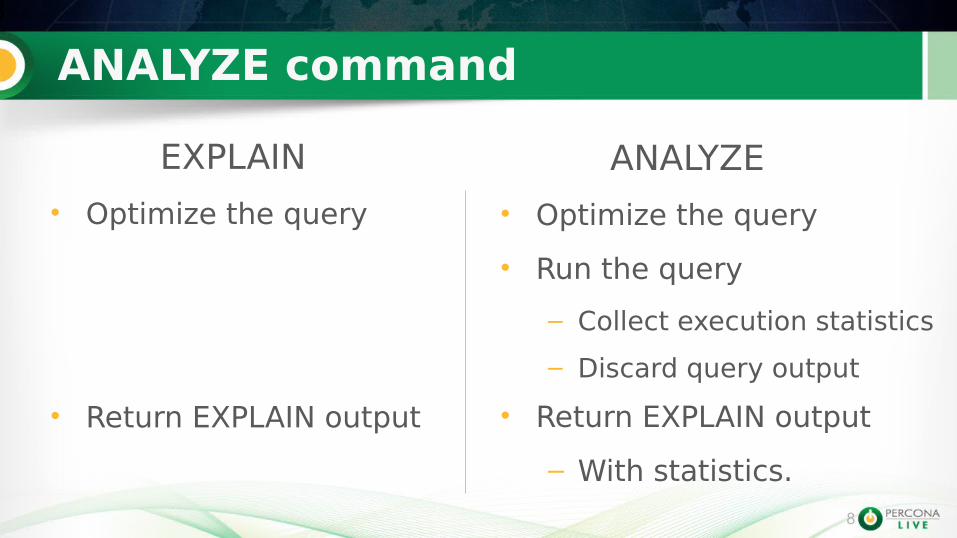
ANALYZE command
EXPLAIN
• Optimize the query
8
ANALYZE
• Optimize the query
• Run the query
– Collect execution statistics
– Discard query output
• Return EXPLAIN output
– With statistics.
• Return EXPLAIN output
9
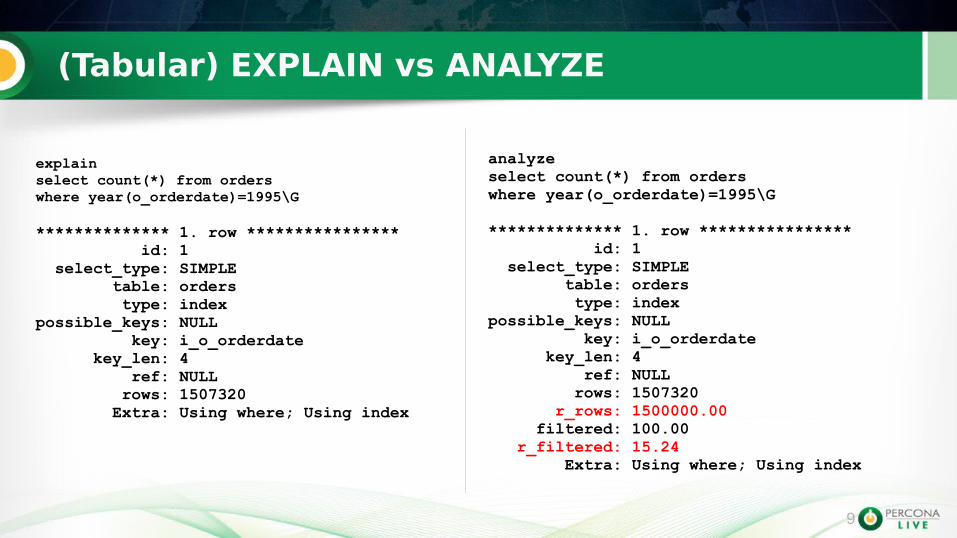
(Tabular) EXPLAIN vs ANALYZE
9
explain select count(*) from orders where year(o_orderdate)=1995\G
************** 1. row **************** id: 1 select_type: SIMPLE table: orders type: indexpossible_keys: NULL key: i_o_orderdate key_len: 4 ref: NULL rows: 1507320 Extra: Using where; Using index
analyze select count(*) from orders where year(o_orderdate)=1995\G
************** 1. row **************** id: 1 select_type: SIMPLE table: orders type: indexpossible_keys: NULL key: i_o_orderdate key_len: 4 ref: NULL rows: 1507320 r_rows: 1500000.00 filtered: 100.00 r_filtered: 15.24 Extra: Using where; Using index
10
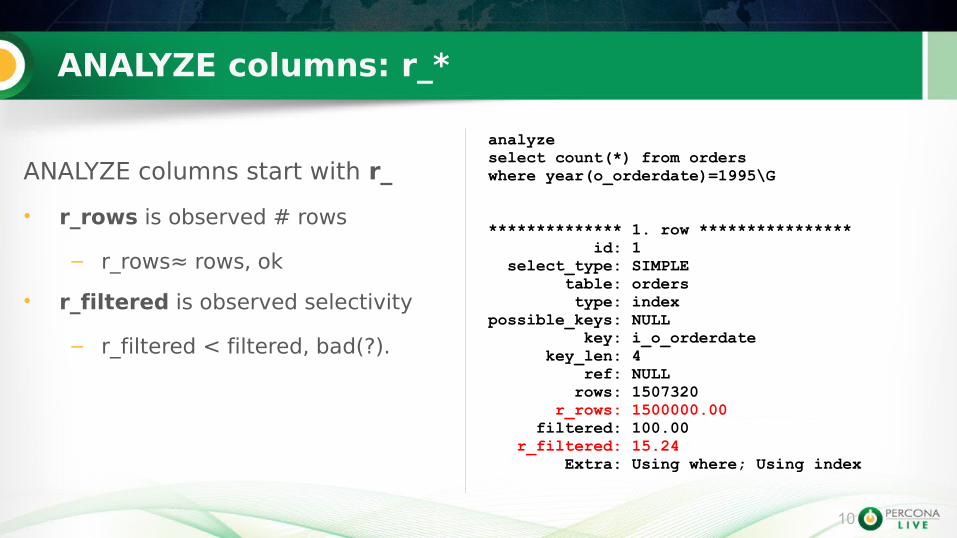
ANALYZE columns: r_*
ANALYZE columns start with r_
• r_rows is observed # rows
– r_rows≈ rows, ok
• r_filtered is observed selectivity
– r_filtered < filtered, bad(?).
analyze select count(*) from orders where year(o_orderdate)=1995\G
************** 1. row **************** id: 1 select_type: SIMPLE table: orders type: indexpossible_keys: NULL key: i_o_orderdate key_len: 4 ref: NULL rows: 1507320 r_rows: 1500000.00 filtered: 100.00 r_filtered: 15.24 Extra: Using where; Using index

11
Trying with better indexing
• r_rows is observed # rows
– r_rows = 0.5 * rows
– 2x difference is typical for innodb
• r_filtered is observed selectivity
– r_filtered=filtered
– r_filtered=100%, best possible.
analyze select count(*) from orders where o_orderdate between '1995-01-01' and '1995-12-31'
************** 1. row **************** id: 1 select_type: SIMPLE table: orders type: rangepossible_keys: i_o_orderdate key: i_o_orderdate key_len: 4 ref: NULL rows: 424048 r_rows: 228637.00 filtered: 100.00 r_filtered: 100.00 Extra: Using where; Using index
12
ANALYZE example #2
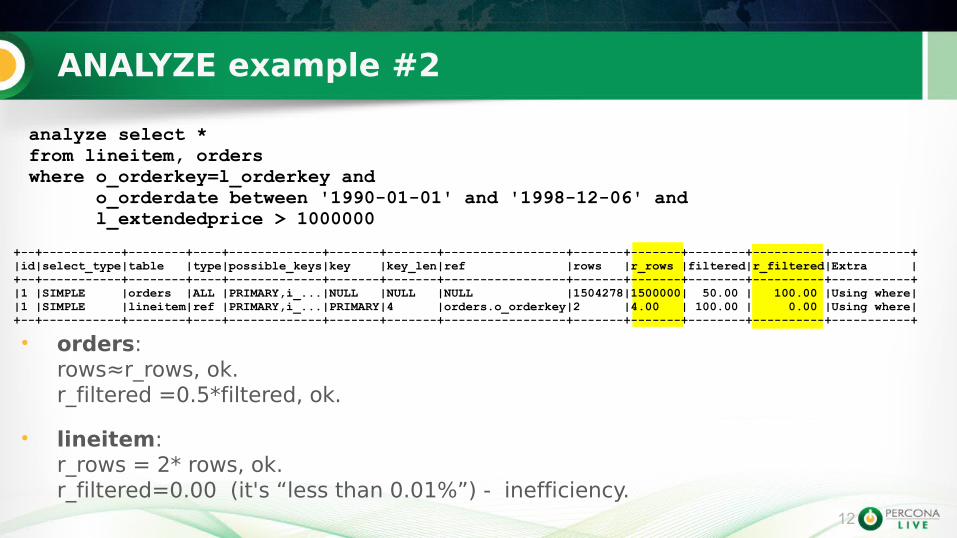
+--+-----------+--------+----+-------------+-------+-------+-----------------+-------+-------+--------+----------+-----------+|id|select_type|table |type|possible_keys|key |key_len|ref |rows |r_rows |filtered|r_filtered|Extra |+--+-----------+--------+----+-------------+-------+-------+-----------------+-------+-------+--------+----------+-----------+|1 |SIMPLE |orders |ALL |PRIMARY,i_...|NULL |NULL |NULL |1504278|1500000| 50.00 | 100.00 |Using where||1 |SIMPLE |lineitem|ref |PRIMARY,i_...|PRIMARY|4 |orders.o_orderkey|2 |4.00 | 100.00 | 0.00 |Using where|+--+-----------+--------+----+-------------+-------+-------+-----------------+-------+-------+--------+----------+-----------+
analyze select * from lineitem, orders where o_orderkey=l_orderkey and o_orderdate between '1990-01-01' and '1998-12-06' and l_extendedprice > 1000000
• orders: rows≈r_rows, ok. r_filtered =0.5*filtered, ok.
• lineitem: r_rows = 2* rows, ok.r_filtered=0.00 (it's “less than 0.01%”) - inefficiency.
13
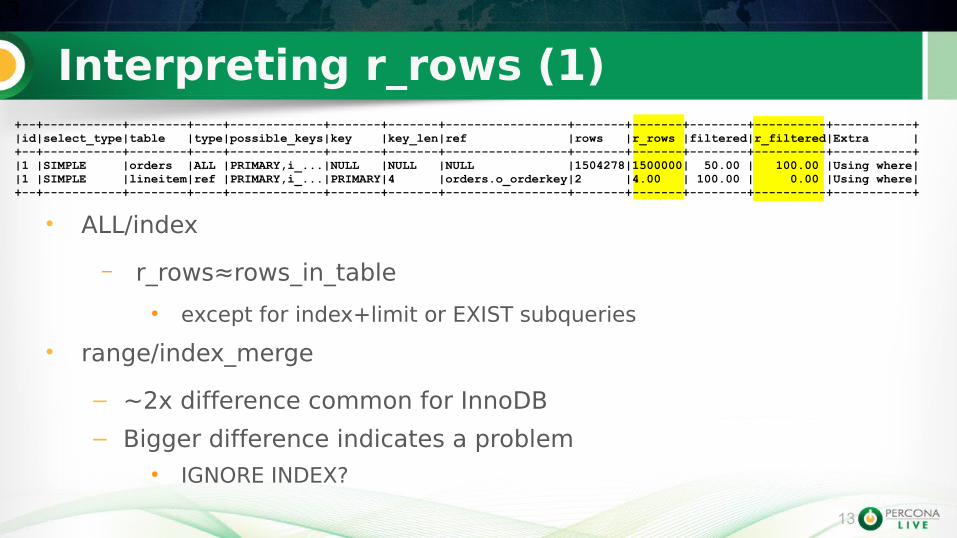
Interpreting r_rows (1)
• ALL/index
– r_rows≈rows_in_table
● except for index+limit or EXIST subqueries
• range/index_merge
– ~2x difference common for InnoDB
– Bigger difference indicates a problem● IGNORE INDEX?
13
+--+-----------+--------+----+-------------+-------+-------+-----------------+-------+-------+--------+----------+-----------+|id|select_type|table |type|possible_keys|key |key_len|ref |rows |r_rows |filtered|r_filtered|Extra |+--+-----------+--------+----+-------------+-------+-------+-----------------+-------+-------+--------+----------+-----------+|1 |SIMPLE |orders |ALL |PRIMARY,i_...|NULL |NULL |NULL |1504278|1500000| 50.00 | 100.00 |Using where||1 |SIMPLE |lineitem|ref |PRIMARY,i_...|PRIMARY|4 |orders.o_orderkey|2 |4.00 | 100.00 | 0.00 |Using where|+--+-----------+--------+----+-------------+-------+-------+-----------------+-------+-------+--------+----------+-----------+
14
Interpreting r_rows (2)
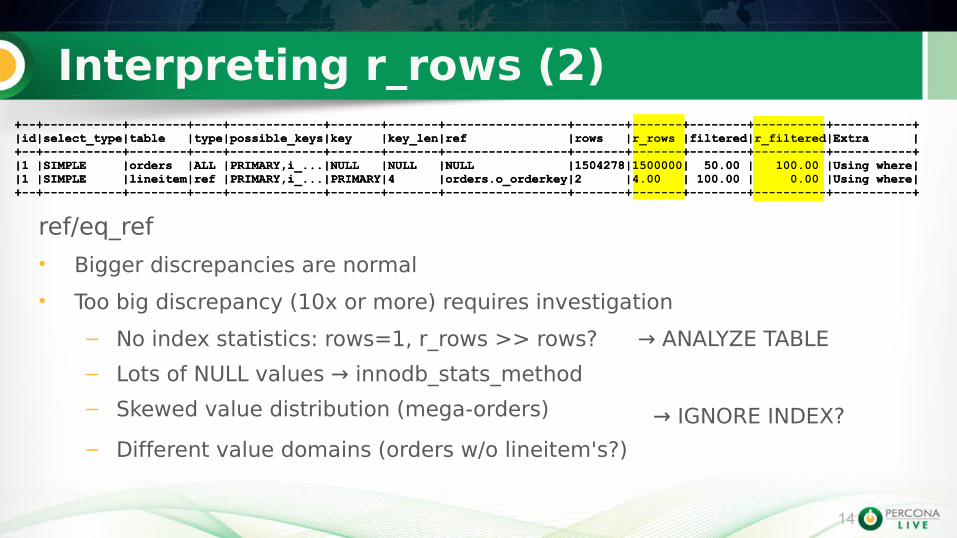
ref/eq_ref
• Bigger discrepancies are normal
• Too big discrepancy (10x or more) requires investigation
– No index statistics: rows=1, r_rows >> rows? → ANALYZE TABLE
– Lots of NULL values → innodb_stats_method
– Skewed value distribution (mega-orders)
– Different value domains (orders w/o lineitem's?)
14
+--+-----------+--------+----+-------------+-------+-------+-----------------+-------+-------+--------+----------+-----------+|id|select_type|table |type|possible_keys|key |key_len|ref |rows |r_rows |filtered|r_filtered|Extra |+--+-----------+--------+----+-------------+-------+-------+-----------------+-------+-------+--------+----------+-----------+|1 |SIMPLE |orders |ALL |PRIMARY,i_...|NULL |NULL |NULL |1504278|1500000| 50.00 | 100.00 |Using where||1 |SIMPLE |lineitem|ref |PRIMARY,i_...|PRIMARY|4 |orders.o_orderkey|2 |4.00 | 100.00 | 0.00 |Using where|+--+-----------+--------+----+-------------+-------+-------+-----------------+-------+-------+--------+----------+-----------+
+--+-----------+--------+----+-------------+-------+-------+-----------------+-------+-------+--------+----------+-----------+|id|select_type|table |type|possible_keys|key |key_len|ref |rows |r_rows |filtered|r_filtered|Extra |+--+-----------+--------+----+-------------+-------+-------+-----------------+-------+-------+--------+----------+-----------+|1 |SIMPLE |orders |ALL |PRIMARY,i_...|NULL |NULL |NULL |1504278|1500000| 50.00 | 100.00 |Using where||1 |SIMPLE |lineitem|ref |PRIMARY,i_...|PRIMARY|4 |orders.o_orderkey|2 |4.00 | 100.00 | 0.00 |Using where|+--+-----------+--------+----+-------------+-------+-------+-----------------+-------+-------+--------+----------+-----------+
→ IGNORE INDEX?
15
Interpreting r_filtered (1)15
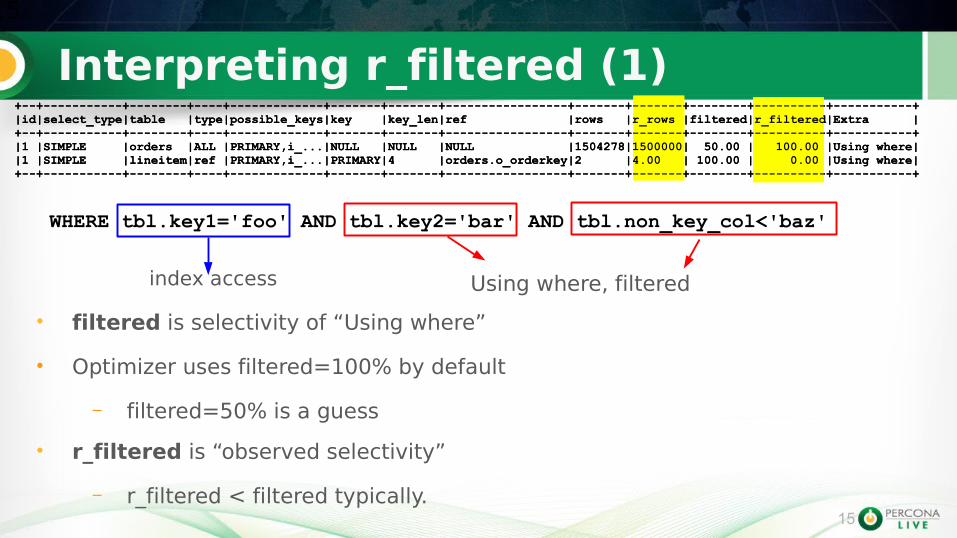
WHERE tbl.key1='foo' AND tbl.key2='bar' AND tbl.non_key_col<'baz'
• filtered is selectivity of “Using where”
• Optimizer uses filtered=100% by default
– filtered=50% is a guess
• r_filtered is “observed selectivity”
– r_filtered < filtered typically.
+--+-----------+--------+----+-------------+-------+-------+-----------------+-------+-------+--------+----------+-----------+|id|select_type|table |type|possible_keys|key |key_len|ref |rows |r_rows |filtered|r_filtered|Extra |+--+-----------+--------+----+-------------+-------+-------+-----------------+-------+-------+--------+----------+-----------+|1 |SIMPLE |orders |ALL |PRIMARY,i_...|NULL |NULL |NULL |1504278|1500000| 50.00 | 100.00 |Using where||1 |SIMPLE |lineitem|ref |PRIMARY,i_...|PRIMARY|4 |orders.o_orderkey|2 |4.00 | 100.00 | 0.00 |Using where|+--+-----------+--------+----+-------------+-------+-------+-----------------+-------+-------+--------+----------+-----------+
+--+-----------+--------+----+-------------+-------+-------+-----------------+-------+-------+--------+----------+-----------+|id|select_type|table |type|possible_keys|key |key_len|ref |rows |r_rows |filtered|r_filtered|Extra |+--+-----------+--------+----+-------------+-------+-------+-----------------+-------+-------+--------+----------+-----------+|1 |SIMPLE |orders |ALL |PRIMARY,i_...|NULL |NULL |NULL |1504278|1500000| 50.00 | 100.00 |Using where||1 |SIMPLE |lineitem|ref |PRIMARY,i_...|PRIMARY|4 |orders.o_orderkey|2 |4.00 | 100.00 | 0.00 |Using where|+--+-----------+--------+----+-------------+-------+-------+-----------------+-------+-------+--------+----------+-----------+
index access Using where, filtered
16
Interpreting r_filtered (2)16
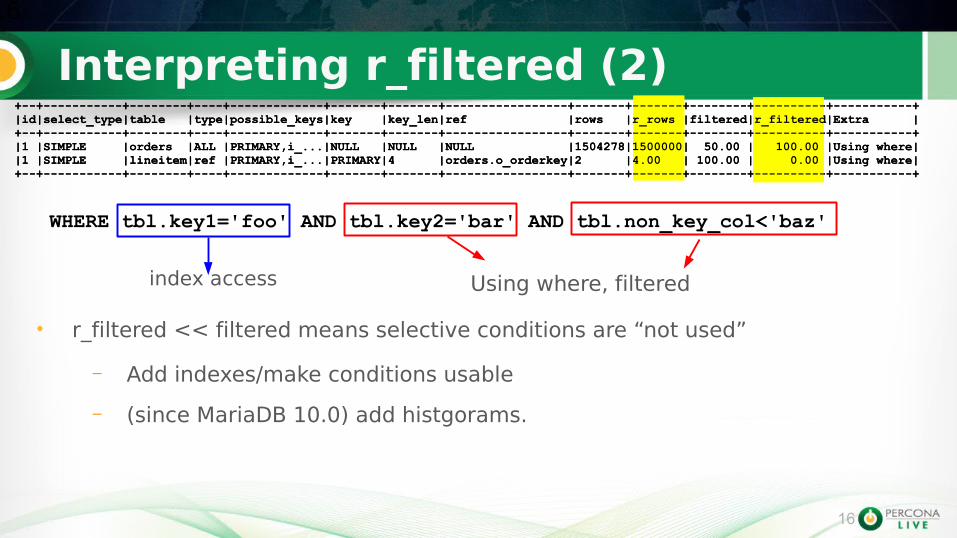
WHERE tbl.key1='foo' AND tbl.key2='bar' AND tbl.non_key_col<'baz'
• r_filtered << filtered means selective conditions are “not used”
– Add indexes/make conditions usable
– (since MariaDB 10.0) add histgorams.
+--+-----------+--------+----+-------------+-------+-------+-----------------+-------+-------+--------+----------+-----------+|id|select_type|table |type|possible_keys|key |key_len|ref |rows |r_rows |filtered|r_filtered|Extra |+--+-----------+--------+----+-------------+-------+-------+-----------------+-------+-------+--------+----------+-----------+|1 |SIMPLE |orders |ALL |PRIMARY,i_...|NULL |NULL |NULL |1504278|1500000| 50.00 | 100.00 |Using where||1 |SIMPLE |lineitem|ref |PRIMARY,i_...|PRIMARY|4 |orders.o_orderkey|2 |4.00 | 100.00 | 0.00 |Using where|+--+-----------+--------+----+-------------+-------+-------+-----------------+-------+-------+--------+----------+-----------+
+--+-----------+--------+----+-------------+-------+-------+-----------------+-------+-------+--------+----------+-----------+|id|select_type|table |type|possible_keys|key |key_len|ref |rows |r_rows |filtered|r_filtered|Extra |+--+-----------+--------+----+-------------+-------+-------+-----------------+-------+-------+--------+----------+-----------+|1 |SIMPLE |orders |ALL |PRIMARY,i_...|NULL |NULL |NULL |1504278|1500000| 50.00 | 100.00 |Using where||1 |SIMPLE |lineitem|ref |PRIMARY,i_...|PRIMARY|4 |orders.o_orderkey|2 |4.00 | 100.00 | 0.00 |Using where|+--+-----------+--------+----+-------------+-------+-------+-----------------+-------+-------+--------+----------+-----------+
index access Using where, filtered
17
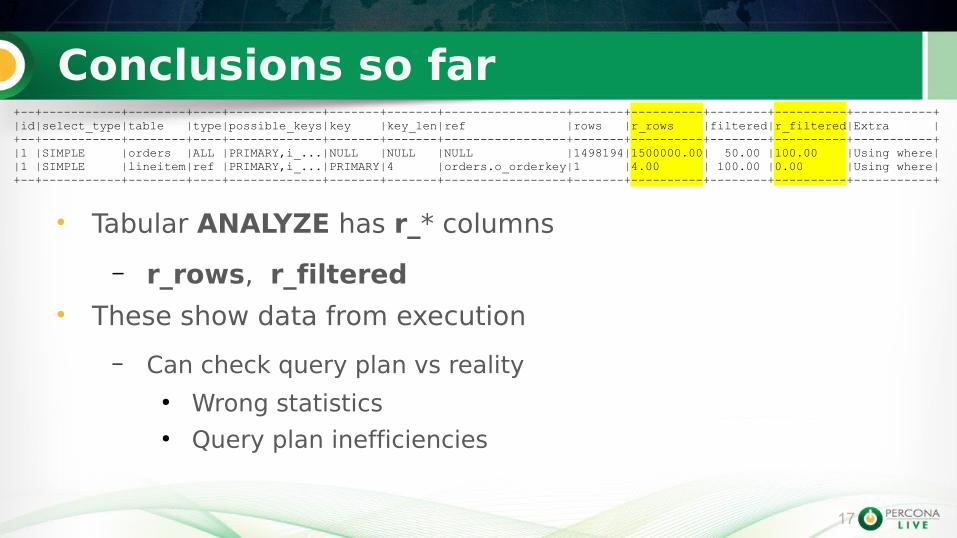
Conclusions so far17
+--+-----------+--------+----+-------------+-------+-------+-----------------+-------+----------+--------+----------+-----------+|id|select_type|table |type|possible_keys|key |key_len|ref |rows |r_rows |filtered|r_filtered|Extra |+--+-----------+--------+----+-------------+-------+-------+-----------------+-------+----------+--------+----------+-----------+|1 |SIMPLE |orders |ALL |PRIMARY,i_...|NULL |NULL |NULL |1498194|1500000.00| 50.00 |100.00 |Using where||1 |SIMPLE |lineitem|ref |PRIMARY,i_...|PRIMARY|4 |orders.o_orderkey|1 |4.00 | 100.00 |0.00 |Using where|+--+-----------+--------+----+-------------+-------+-------+-----------------+-------+----------+--------+----------+-----------+
• Tabular ANALYZE has r_* columns
– r_rows, r_filtered
• These show data from execution
– Can check query plan vs reality● Wrong statistics● Query plan inefficiencies
18
FORMAT=JSON
18

19
EXPLAIN FORMAT=JSON
MySQL 5.6 introduced EXPLAIN FORMAT=JSON
• Good! It shows more info (http://s.petrunia.net/blog/?p=83)
• But it has bugsBug#69567: EXPLAIN FORMAT=JSON lists subquery in optimized_away_subqueries, but it is runBug#69795: EXPLAIN FORMAT=JSON doesn't show Using filesort for UNIONBug#74462: EXPLAIN FORMAT=JSON produces ordering_operation when no ordering takes placeBug#74661: EXPLAIN FORMAT=JSON says two temptables are used, execution shows just oneBug#74744: EXPLAIN FORMAT=JSON produces duplicates_removal where there is none[no bug#]: EXPLAIN FORMAT=JSON shows the same subquery as two different subqueries…
• And we were not happy with output– Even MySQL Workbench choked on it (http://s.petrunia.net/blog/?p=93)– “JSON format” != “print tabular EXPLAIN in JSON”
19IN
SERT : E
XPLA
IN FO
RM
AT=
JSO
N
20
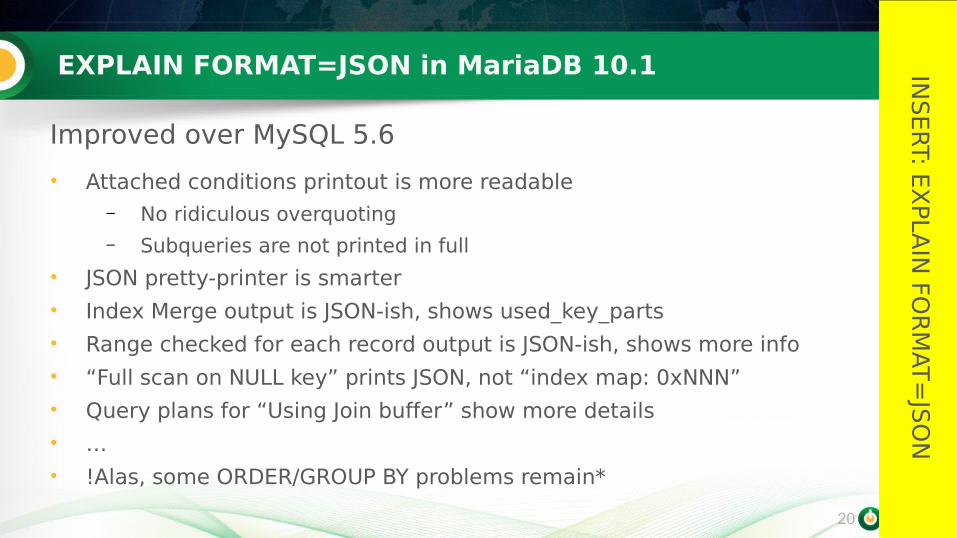
EXPLAIN FORMAT=JSON in MariaDB 10.1
Improved over MySQL 5.6
• Attached conditions printout is more readable– No ridiculous overquoting– Subqueries are not printed in full
• JSON pretty-printer is smarter
• Index Merge output is JSON-ish, shows used_key_parts
• Range checked for each record output is JSON-ish, shows more info
• “Full scan on NULL key” prints JSON, not “index map: 0xNNN”
• Query plans for “Using Join buffer” show more details
• …
• !Alas, some ORDER/GROUP BY problems remain*
20IN
SERT : E
XPL A
IN FO
RM
AT=
JSO
N
21
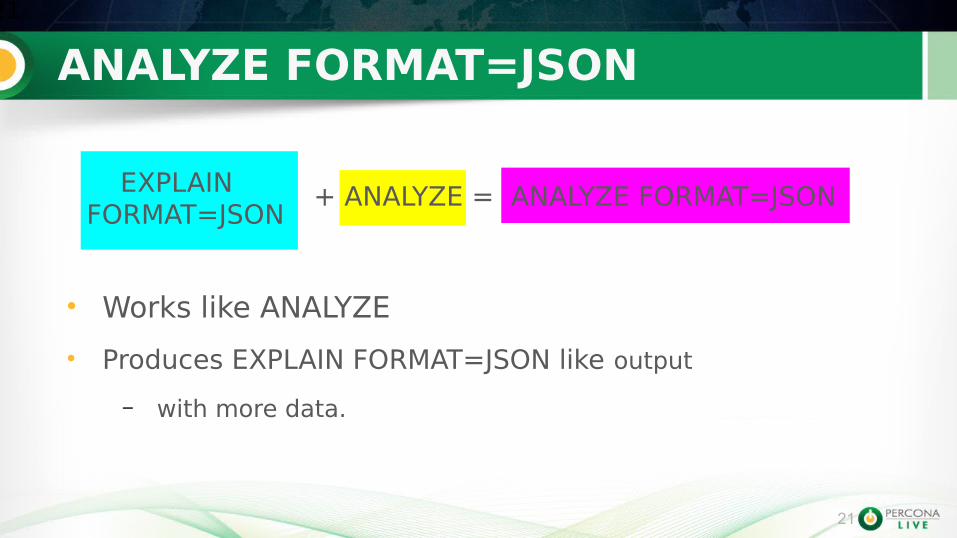
ANALYZE FORMAT=JSON21
• Works like ANALYZE
• Produces EXPLAIN FORMAT=JSON like output
– with more data.
EXPLAIN FORMAT=JSON
+ ANALYZE = ANALYZE FORMAT=JSON
22
ANALYZE FORMAT=JSON basics
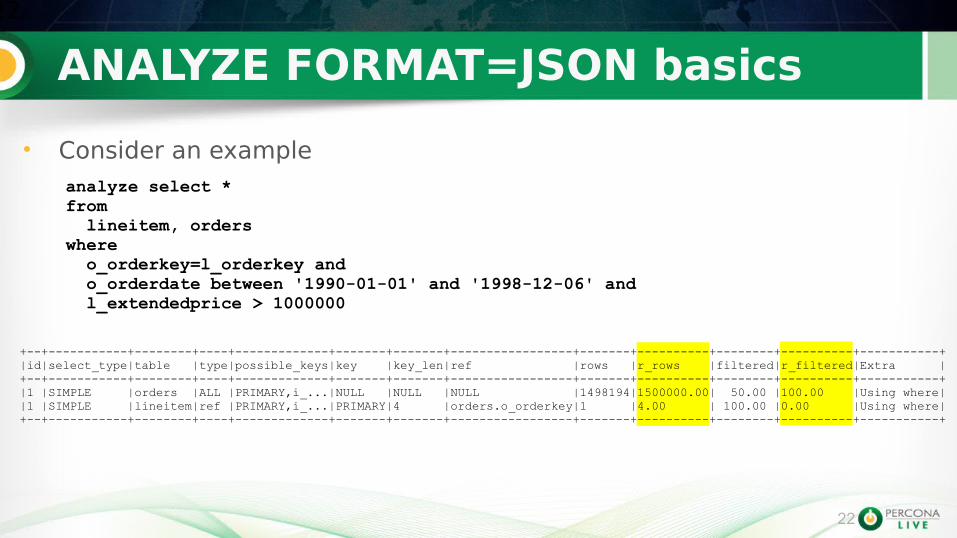
• Consider an example
22
analyze select * from lineitem, orders where o_orderkey=l_orderkey and o_orderdate between '1990-01-01' and '1998-12-06' and l_extendedprice > 1000000
+--+-----------+--------+----+-------------+-------+-------+-----------------+-------+----------+--------+----------+-----------+|id|select_type|table |type|possible_keys|key |key_len|ref |rows |r_rows |filtered|r_filtered|Extra |+--+-----------+--------+----+-------------+-------+-------+-----------------+-------+----------+--------+----------+-----------+|1 |SIMPLE |orders |ALL |PRIMARY,i_...|NULL |NULL |NULL |1498194|1500000.00| 50.00 |100.00 |Using where||1 |SIMPLE |lineitem|ref |PRIMARY,i_...|PRIMARY|4 |orders.o_orderkey|1 |4.00 | 100.00 |0.00 |Using where|+--+-----------+--------+----+-------------+-------+-------+-----------------+-------+----------+--------+----------+-----------+
23
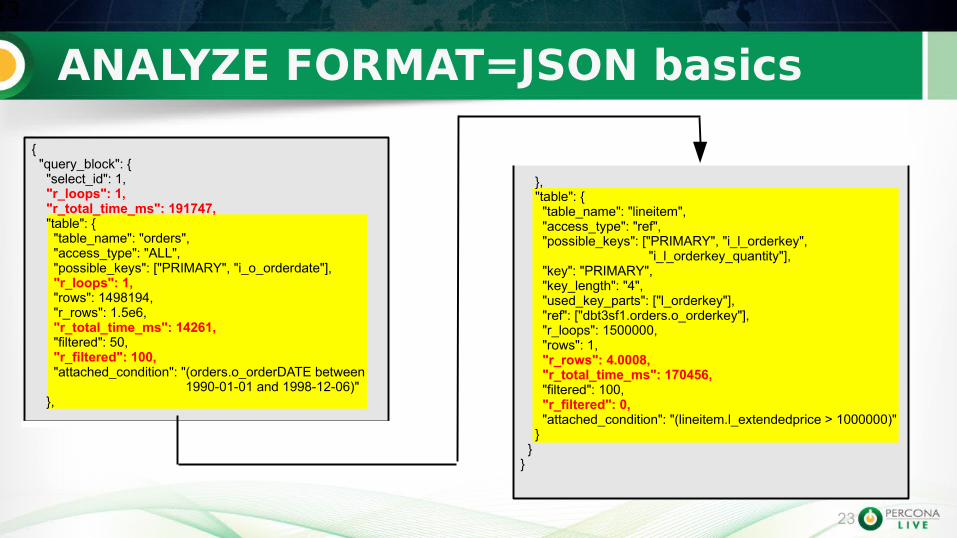
ANALYZE FORMAT=JSON basics23
{ "query_block": { "select_id": 1, "r_loops": 1, "r_total_time_ms": 191747, "table": { "table_name": "orders", "access_type": "ALL", "possible_keys": ["PRIMARY", "i_o_orderdate"], "r_loops": 1, "rows": 1498194, "r_rows": 1.5e6, "r_total_time_ms": 14261, "filtered": 50, "r_filtered": 100, "attached_condition": "(orders.o_orderDATE between 1990-01-01 and 1998-12-06)" },
}, "table": { "table_name": "lineitem", "access_type": "ref", "possible_keys": ["PRIMARY", "i_l_orderkey", "i_l_orderkey_quantity"], "key": "PRIMARY", "key_length": "4", "used_key_parts": ["l_orderkey"], "ref": ["dbt3sf1.orders.o_orderkey"], "r_loops": 1500000, "rows": 1, "r_rows": 4.0008, "r_total_time_ms": 170456, "filtered": 100, "r_filtered": 0, "attached_condition": "(lineitem.l_extendedprice > 1000000)" } }}
24
ANALYZE FORMAT=JSON basics
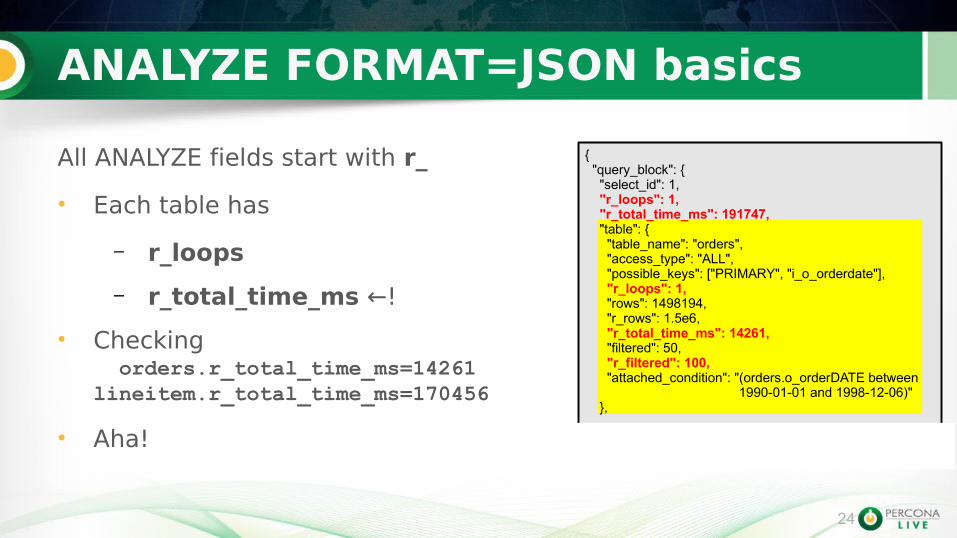
All ANALYZE fields start with r_
• Each table has
– r_loops
– r_total_time_ms ←!
• Checking orders.r_total_time_ms=14261lineitem.r_total_time_ms=170456
• Aha!
24
{ "query_block": { "select_id": 1, "r_loops": 1, "r_total_time_ms": 191747, "table": { "table_name": "orders", "access_type": "ALL", "possible_keys": ["PRIMARY", "i_o_orderdate"], "r_loops": 1, "rows": 1498194, "r_rows": 1.5e6, "r_total_time_ms": 14261, "filtered": 50, "r_filtered": 100, "attached_condition": "(orders.o_orderDATE between 1990-01-01 and 1998-12-06)" },
25
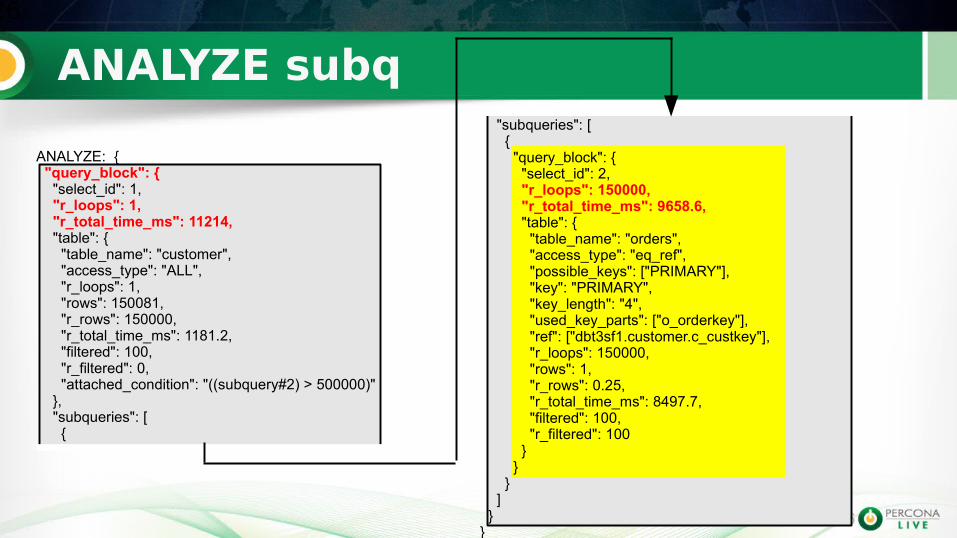
ANALYZE and subqueries25
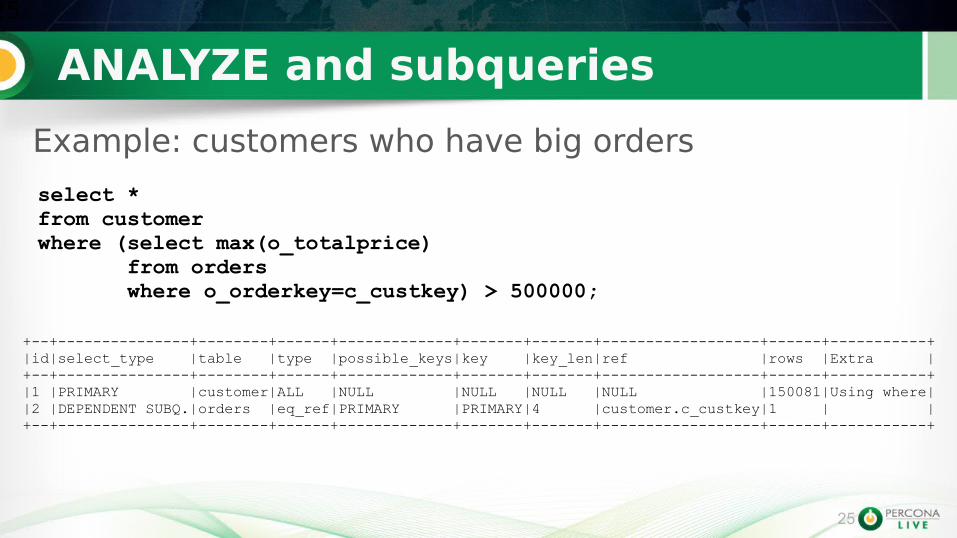
+--+---------------+--------+------+-------------+-------+-------+------------------+------+-----------+|id|select_type |table |type |possible_keys|key |key_len|ref |rows |Extra |+--+---------------+--------+------+-------------+-------+-------+------------------+------+-----------+|1 |PRIMARY |customer|ALL |NULL |NULL |NULL |NULL |150081|Using where||2 |DEPENDENT SUBQ.|orders |eq_ref|PRIMARY |PRIMARY|4 |customer.c_custkey|1 | |+--+---------------+--------+------+-------------+-------+-------+------------------+------+-----------+
select * from customer where (select max(o_totalprice) from orders where o_orderkey=c_custkey) > 500000;
Example: customers who have big orders
26
26
ANALYZE: { "query_block": { "select_id": 1, "r_loops": 1, "r_total_time_ms": 11214, "table": { "table_name": "customer", "access_type": "ALL", "r_loops": 1, "rows": 150081, "r_rows": 150000, "r_total_time_ms": 1181.2, "filtered": 100, "r_filtered": 0, "attached_condition": "((subquery#2) > 500000)" }, "subqueries": [ {
"subqueries": [ { "query_block": { "select_id": 2, "r_loops": 150000, "r_total_time_ms": 9658.6, "table": { "table_name": "orders", "access_type": "eq_ref", "possible_keys": ["PRIMARY"], "key": "PRIMARY", "key_length": "4", "used_key_parts": ["o_orderkey"], "ref": ["dbt3sf1.customer.c_custkey"], "r_loops": 150000, "rows": 1, "r_rows": 0.25, "r_total_time_ms": 8497.7, "filtered": 100, "r_filtered": 100 } } } ] }}
ANALYZE subq
27
ANALYZE and subqueries summary27
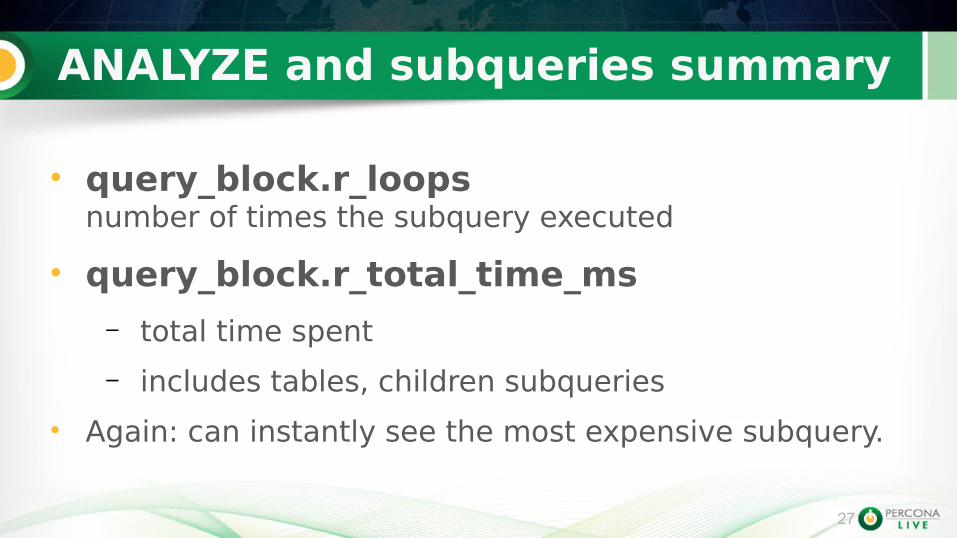
• query_block.r_loopsnumber of times the subquery executed
• query_block.r_total_time_ms– total time spent
– includes tables, children subqueries
• Again: can instantly see the most expensive subquery.

28
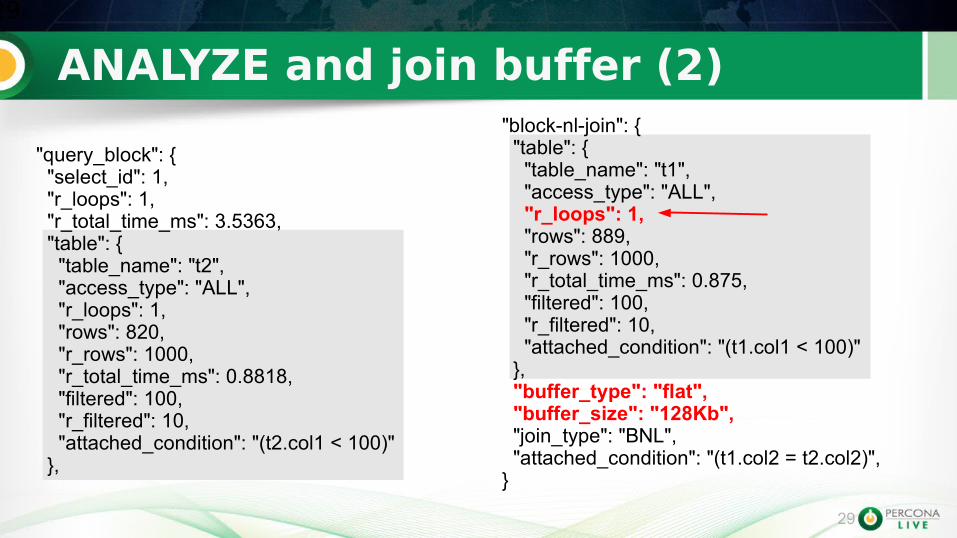
ANALYZE and join buffer28
• Join buffer optimization
– Reads rows into buffer, then sorts
– EXPLAIN somewhat misleading
– @@join_buffer_size?
+--+-----------+-----+----+-------------+----+-------+----+----+-----------------------------------------------+|id|select_type|table|type|possible_keys|key |key_len|ref |rows|Extra |+--+-----------+-----+----+-------------+----+-------+----+----+-----------------------------------------------+|1 |SIMPLE |t2 |ALL |NULL |NULL|NULL |NULL|820 |Using where ||1 |SIMPLE |t1 |ALL |NULL |NULL|NULL |NULL|889 |Using where; Using join buffer (flat, BNL join)|+--+-----------+-----+----+-------------+----+-------+----+----+-----------------------------------------------+
select * from t1, t2 where t1.col1<100 and t2.col1<100 and t1.col2=t2.col2
29
ANALYZE and join buffer (2)29
"query_block": { "select_id": 1, "r_loops": 1, "r_total_time_ms": 3.5363, "table": { "table_name": "t2", "access_type": "ALL", "r_loops": 1, "rows": 820, "r_rows": 1000, "r_total_time_ms": 0.8818, "filtered": 100, "r_filtered": 10, "attached_condition": "(t2.col1 < 100)" },
"block-nl-join": { "table": { "table_name": "t1", "access_type": "ALL", "r_loops": 1, "rows": 889, "r_rows": 1000, "r_total_time_ms": 0.875, "filtered": 100, "r_filtered": 10, "attached_condition": "(t1.col1 < 100)" }, "buffer_type": "flat", "buffer_size": "128Kb", "join_type": "BNL", "attached_condition": "(t1.col2 = t2.col2)", }
30
ORDER/GROUP BY optimization30
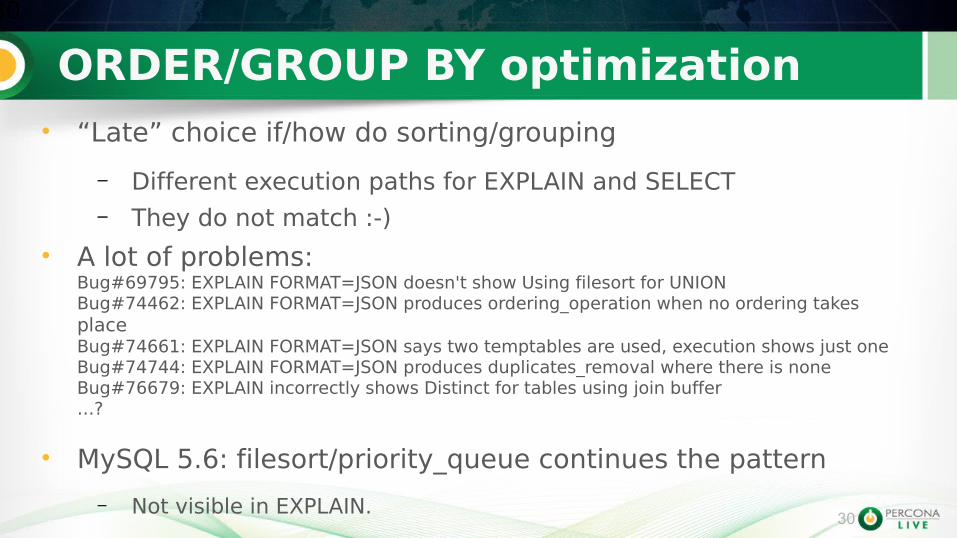
• “Late” choice if/how do sorting/grouping
– Different execution paths for EXPLAIN and SELECT– They do not match :-)
• A lot of problems:Bug#69795: EXPLAIN FORMAT=JSON doesn't show Using filesort for UNIONBug#74462: EXPLAIN FORMAT=JSON produces ordering_operation when no ordering takes placeBug#74661: EXPLAIN FORMAT=JSON says two temptables are used, execution shows just oneBug#74744: EXPLAIN FORMAT=JSON produces duplicates_removal where there is noneBug#76679: EXPLAIN incorrectly shows Distinct for tables using join buffer…?
• MySQL 5.6: filesort/priority_queue continues the pattern
– Not visible in EXPLAIN.
31
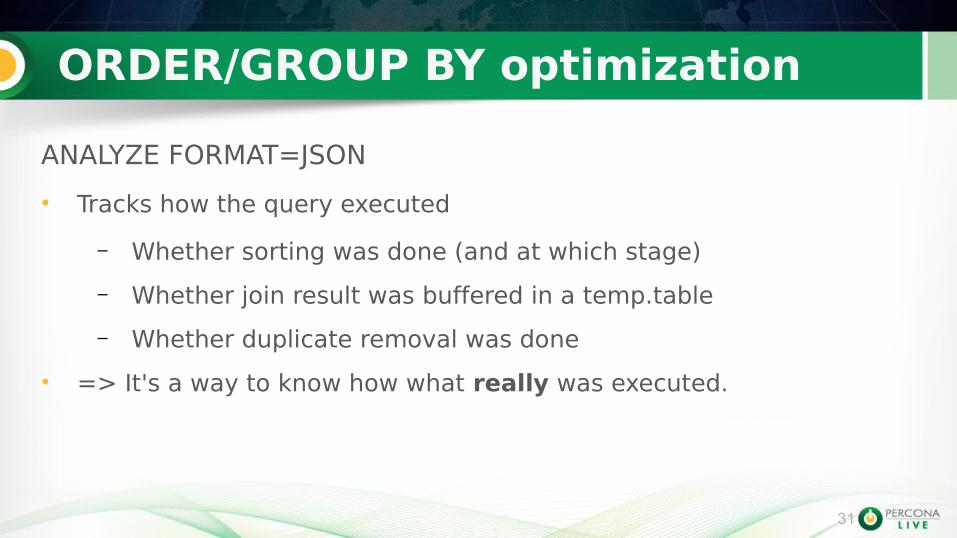
ORDER/GROUP BY optimization31
ANALYZE FORMAT=JSON
• Tracks how the query executed
– Whether sorting was done (and at which stage)
– Whether join result was buffered in a temp.table
– Whether duplicate removal was done
• => It's a way to know how what really was executed.
32
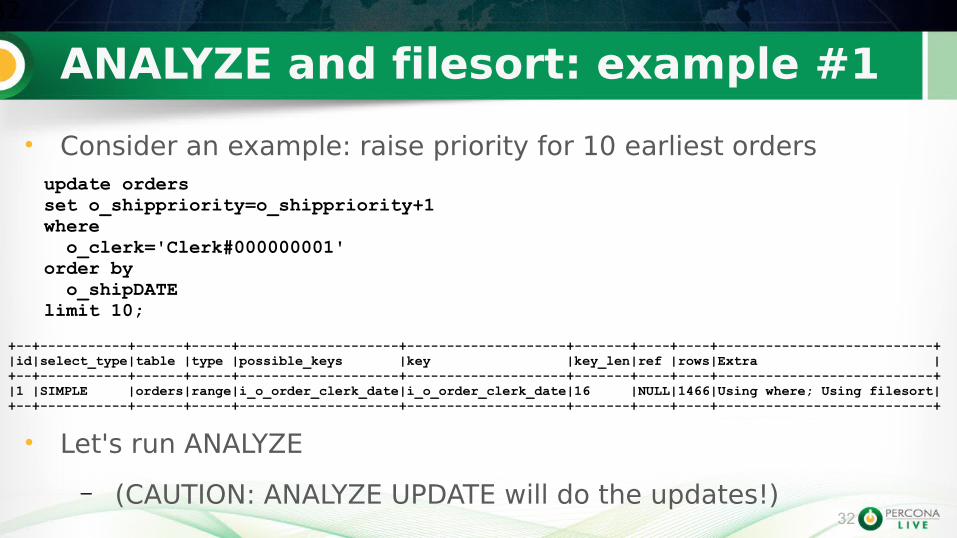
ANALYZE and filesort: example #132
• Consider an example: raise priority for 10 earliest ordersupdate orders set o_shippriority=o_shippriority+1where o_clerk='Clerk#000000001'order by o_shipDATE limit 10;
+--+-----------+------+-----+--------------------+--------------------+-------+----+----+---------------------------+|id|select_type|table |type |possible_keys |key |key_len|ref |rows|Extra |+--+-----------+------+-----+--------------------+--------------------+-------+----+----+---------------------------+|1 |SIMPLE |orders|range|i_o_order_clerk_date|i_o_order_clerk_date|16 |NULL|1466|Using where; Using filesort|+--+-----------+------+-----+--------------------+--------------------+-------+----+----+---------------------------+
• Let's run ANALYZE
– (CAUTION: ANALYZE UPDATE will do the updates!)
33
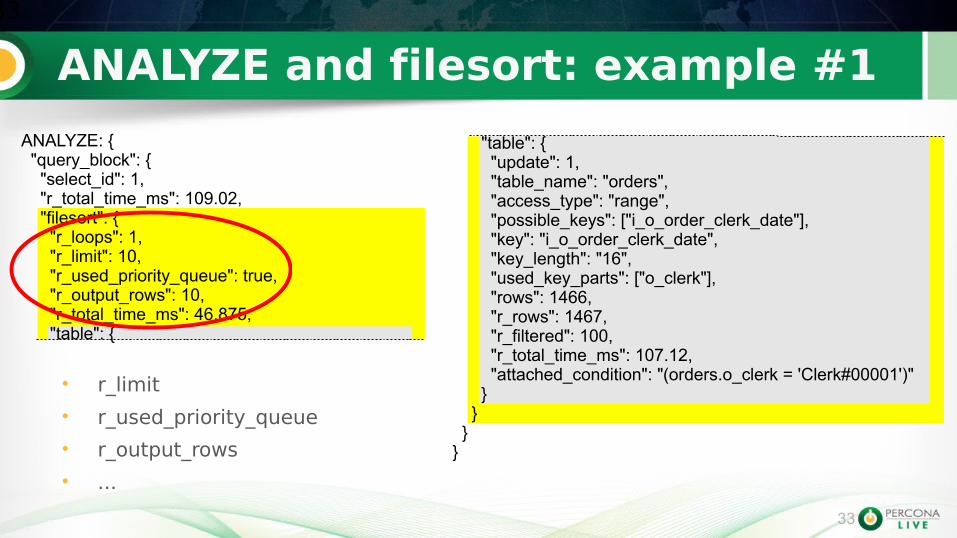
ANALYZE and filesort: example #133
• r_limit
• r_used_priority_queue
• r_output_rows
• ...
"table": { "update": 1, "table_name": "orders", "access_type": "range", "possible_keys": ["i_o_order_clerk_date"], "key": "i_o_order_clerk_date", "key_length": "16", "used_key_parts": ["o_clerk"], "rows": 1466, "r_rows": 1467, "r_filtered": 100, "r_total_time_ms": 107.12, "attached_condition": "(orders.o_clerk = 'Clerk#00001')" } } }}
ANALYZE: { "query_block": { "select_id": 1, "r_total_time_ms": 109.02, "filesort": { "r_loops": 1, "r_limit": 10, "r_used_priority_queue": true, "r_output_rows": 10, "r_total_time_ms": 46.875, "table": {
34
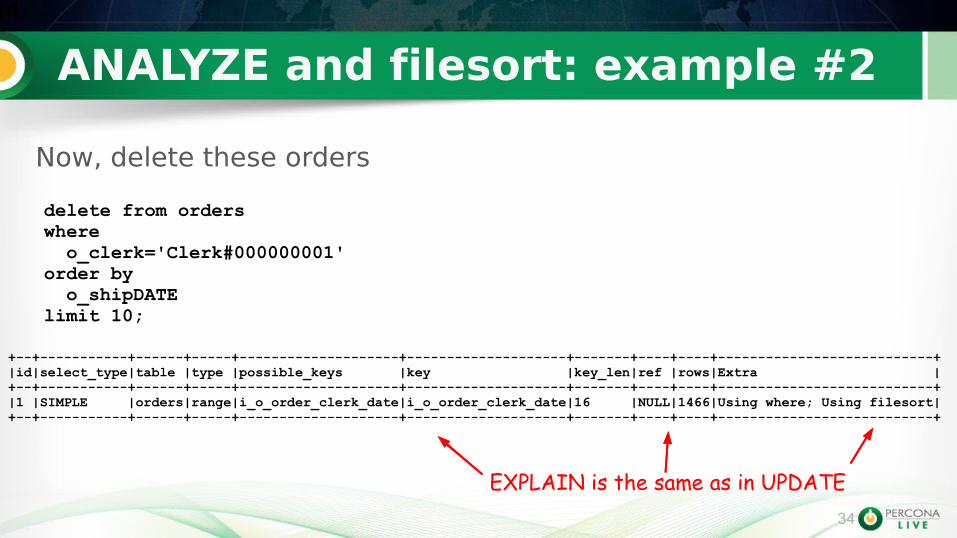
ANALYZE and filesort: example #234
Now, delete these orders
delete from orders where o_clerk='Clerk#000000001'order by o_shipDATE limit 10;
+--+-----------+------+-----+--------------------+--------------------+-------+----+----+---------------------------+|id|select_type|table |type |possible_keys |key |key_len|ref |rows|Extra |+--+-----------+------+-----+--------------------+--------------------+-------+----+----+---------------------------+|1 |SIMPLE |orders|range|i_o_order_clerk_date|i_o_order_clerk_date|16 |NULL|1466|Using where; Using filesort|+--+-----------+------+-----+--------------------+--------------------+-------+----+----+---------------------------+
EXPLAIN is the same as in UPDATE
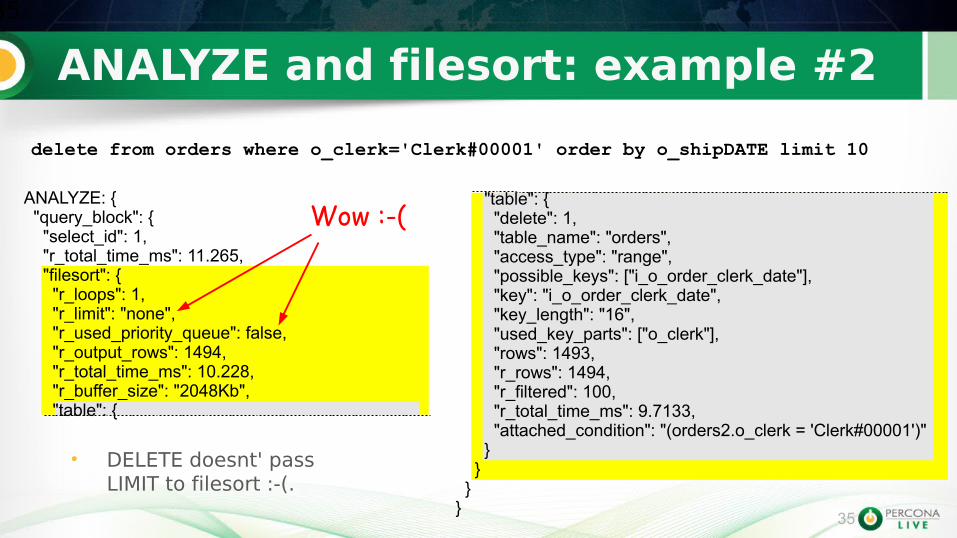
35
ANALYZE and filesort: example #235
• DELETE doesnt' pass LIMIT to filesort :-(.
ANALYZE: { "query_block": { "select_id": 1, "r_total_time_ms": 11.265, "filesort": { "r_loops": 1, "r_limit": "none", "r_used_priority_queue": false, "r_output_rows": 1494, "r_total_time_ms": 10.228, "r_buffer_size": "2048Kb", "table": {
"table": { "delete": 1, "table_name": "orders", "access_type": "range", "possible_keys": ["i_o_order_clerk_date"], "key": "i_o_order_clerk_date", "key_length": "16", "used_key_parts": ["o_clerk"], "rows": 1493, "r_rows": 1494, "r_filtered": 100, "r_total_time_ms": 9.7133, "attached_condition": "(orders2.o_clerk = 'Clerk#00001')" } } }}
delete from orders where o_clerk='Clerk#00001' order by o_shipDATE limit 10
Wow :-(
36
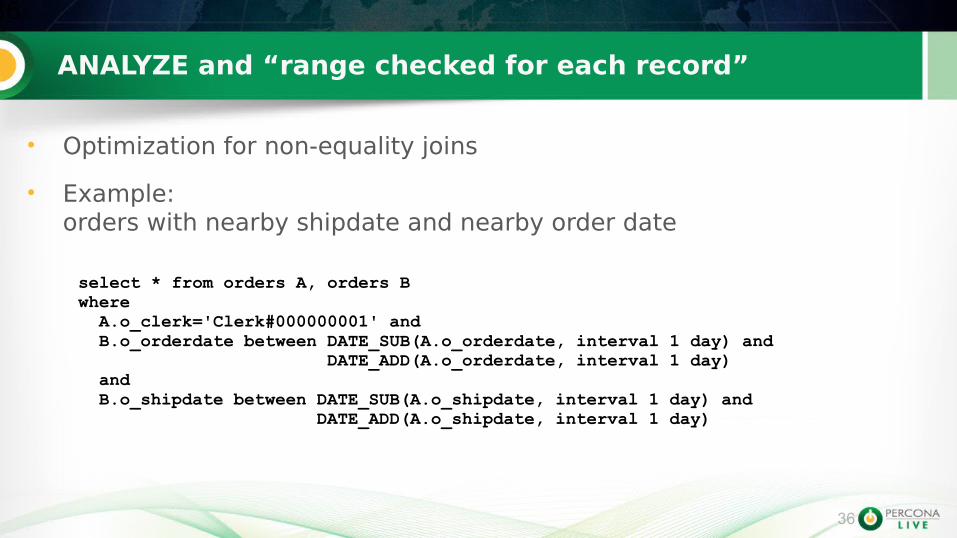
ANALYZE and “range checked for each record”
36
• Optimization for non-equality joins
• Example:orders with nearby shipdate and nearby order date
select * from orders A, orders Bwhere A.o_clerk='Clerk#000000001' and B.o_orderdate between DATE_SUB(A.o_orderdate, interval 1 day) and DATE_ADD(A.o_orderdate, interval 1 day) and B.o_shipdate between DATE_SUB(A.o_shipdate, interval 1 day) and DATE_ADD(A.o_shipdate, interval 1 day)
37
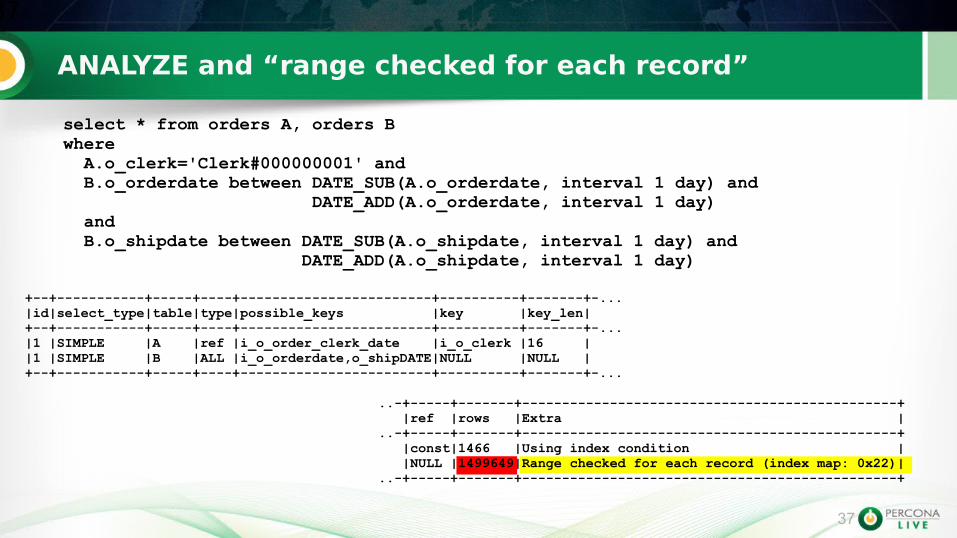
ANALYZE and “range checked for each record”
37
select * from orders A, orders Bwhere A.o_clerk='Clerk#000000001' and B.o_orderdate between DATE_SUB(A.o_orderdate, interval 1 day) and DATE_ADD(A.o_orderdate, interval 1 day) and B.o_shipdate between DATE_SUB(A.o_shipdate, interval 1 day) and DATE_ADD(A.o_shipdate, interval 1 day)
+--+-----------+-----+----+------------------------+----------+-------+-...|id|select_type|table|type|possible_keys |key |key_len|+--+-----------+-----+----+------------------------+----------+-------+-...|1 |SIMPLE |A |ref |i_o_order_clerk_date |i_o_clerk |16 ||1 |SIMPLE |B |ALL |i_o_orderdate,o_shipDATE|NULL |NULL |+--+-----------+-----+----+------------------------+----------+-------+-...
..-+-----+-------+-----------------------------------------------+ |ref |rows |Extra |..-+-----+-------+-----------------------------------------------+ |const|1466 |Using index condition | |NULL |1499649|Range checked for each record (index map: 0x22)|..-+-----+-------+-----------------------------------------------+

38
ANALYZE and “range checked for each record”
38
ANALYZE: { "query_block": { "select_id": 1, "r_loops": 1, "r_total_time_ms": 5769, "table": { "table_name": "A", "access_type": "ref", "possible_keys": ["i_o_order_clerk_date"], "key": "i_o_order_clerk_date", "key_length": "16", "used_key_parts": ["o_clerk"], "ref": ["const"], "r_loops": 1, "rows": 1466, "r_rows": 1467, "r_total_time_ms": 3.6642, "filtered": 100, "r_filtered": 100, "index_condition": "(A.o_clerk = 'Clerk#00001')" },
"range-checked-for-each-record": { "keys": ["i_o_orderdate", "o_shipDATE"], "r_keys": { "full_scan": 0, "index_merge": 0, "range": { "i_o_orderdate": 1467, "o_shipDATE": 0 } }, "table": { "table_name": "B", "access_type": "ALL", "possible_keys": ["i_o_orderdate", "o_shipDATE"], "r_loops": 1467, "rows": 1499649, "r_rows": 1871.2, "r_total_time_ms": 3649.9, "filtered": 100, "r_filtered": 100 } } }}.

39
Final bits39
• Target version: MariaDB 10.1
• Current status: BETA
– Good enough for joins
– Will add the missing bits.
• log_slow_verbosity=explain prints ANALYZE.
40
Conclusions40
• MariaDB 10.1 adds new commands– ANALYZE statement
– ANALYZE FORMAT=JSON statement
• Show details about query execution
• Help in diagnosing the optimizer.

41
Thanks41
Q & A