Embed Size (px)
DESCRIPTION
Analysis on land use land cover classification around mysuru and chamarajanagara district karnataka india using irs 1 d pan liss iii satellite data
Citation preview

International Journal of Civil Engineering and Technology (IJCIET), ISSN 0976 – 6308 (Print),
ISSN 0976 – 6316(Online), Volume 5, Issue 11, November (2014), pp. 79-96 © IAEME
79
ANALYSIS ON LAND USE/LAND COVER
CLASSIFICATION AROUND MYSURU AND
CHAMARAJANAGARA DISTRICT, KARNATAKA, INDIA,
USING IRS-1D PAN+LISS-III SATELLITE DATA
Basavarajappa H.T, Dinakar .S, Manjunatha M.C
Department of Studies in Earth Science, Centre for Advanced Studies in Precambrian Geology,
University of Mysore, Manasagangothri, Mysore-570006, India
ABSTRACT
Land is a non-renewable resource and mapping of LU/LC is essential for planning and
development of land and water resources in a region of engineering projects under progress. Land is
an area of the earth surface, which embraces all reasonable stable or predictably cyclic, attribute of
the biosphere including the atmosphere, soil and underlying geology. Hydrology, plant and animal
population are the results of the past and present human activity to the extent that significantly
influences on present and future LU/LC system. Proper management and development of these lands
should be initiated to increase the land productivity, restoration of soil degradation, reclamation of
wastelands, increase the environmental qualities and to meet the needs of rapidly growing population
of the country. Remote Sensing (RS) satellite data with its synoptic view and multispectral data
provides essential information in proper planning of LU/LC conditions of the larger areas. An
attempt have been made to delineate the level-1, level-2 and level-3 LU/LC classification system
through NRSC guidelines (1995) using both digital and visual image interpretation techniques by
Geographical Information Systems (GIS) software’s. The classification accuracy is found to be more
in case of digital technique as compared to that of visual technique in terms of area statistics. Efforts
have been made to classify the LU/LC patterns using False Color Composite (FCC) data of IRS-1D
PAN+LISS-III (Band: 2,3,4) through MapInfo v7.5, ArcView v3.2, Erdas Imagine v2011 and
ArcGIS v10. The final results highlight the potentiality of geomatics in classification of LU/LC
patterns around Chamarajanagara district, Karnataka, in natural resource mapping and its
management which is a suitable model for application to similar geological terrain.
INTERNATIONAL JOURNAL OF CIVIL ENGINEERING AND
TECHNOLOGY (IJCIET)
ISSN 0976 – 6308 (Print)
ISSN 0976 – 6316(Online)
Volume 5, Issue 11, November (2014), pp. 79-96
© IAEME: www.iaeme.com/Ijciet.asp
Journal Impact Factor (2014): 7.9290 (Calculated by GISI)
www.jifactor.com
IJCIET
©IAEME

International Journal of Civil Engineering and Technology (IJCIET), ISSN 0976 – 6308 (Print),
ISSN 0976 – 6316(Online), Volume 5, Issue 11, November (2014), pp. 79-96 © IAEME
80
Keywords: LU/LC Classification; Visual & digital interpretation; Chamarajanagara; Mysuru;
Satellite data.
1. INTRODUCTION
Land use systems need thorough systematic monitoring and management to maintain food
security, to minimize deforestation, conservation of biological diversity and protection of natural
resources. It is necessary to enhance human occupation to the changing social, economic and natural
environmental conditions. Rapid increase in population demands for more food, fodder and fuel
wood have led to large scale environment degradation and ecological imbalance. In order to use land
optimally, it is necessary to have firsthand information about the existing land use/land cover
(LU/LC) patterns. Jacks (1946) reviewed land classification as it relates to the grouping of land
according to their suitability for producing plants of economic importance. Land use refers to man’s
activities and the various uses which are carried on land (Clawson and Steward, 1983). Land cover
refers to natural vegetation, water bodies, rock/soils, artificial cover and other resulting due to land
transformation. Land use describes how a parcel of land is used such as agriculture, settlements or
industry, whereas land cover refers to the material such as vegetation, rocks or water bodies that are
present on the surface (Anderson et al., 1976). The term LU/LC is closely related and
interchangeable. LU/LC exposes considerable influence on the various hydrological aspects such as
interception, infiltration, catchment area, evaporation and surface flow (Sreenivasalu and Vijay
Kumar., 2000; Kumar et al., 1999). LU/LC provides a better understanding on the cropping pattern
and spatial distribution of fallow lands, forests, grazing lands, wastelands and surface water bodies,
which is vital for developmental planning (Philip and Gupta, 1990).
2. STUDY AREA
2.a Mysuru district: The study area include Cauvery and Kabini riverine plains flowing towards
south easterly and both joins at Tirumalakudu Narasipura. Most parts of Nanjungudu and Mysuru
taluks show gentle slope and plains with both cultivated seasonal crops such as irrigated and dry
seasonal crops. The southern parts of Mysuru district is traversed by 3 sets of joints-trending in N-S,
NE-SW and E-W direction & 4 sets of lineaments are noticed towards NNE-SSW, NNW-SSE, NE-
SW & E-W. The study area is subjected to F1, F2, and F3 Sargur type of structure, deformational
folds and joints formation in the past.
2.b Chamarajanagara district: The study area represents a part of Biligiri-Rangan Hill Ranges
which belong to an oldest Precambrian hard rock terrain in southern Karnataka (Basavarajappa H.T.,
1992). The eastern portion of the study area forms a hilly terrain with lofty mountains (Biligiri-
Rangan hill ranges) raising about 1677m above MSL, run approximately towards N-S direction with
thick vegetation. The western parts form a plain country with an average elevation of 686.25m with
minor undulations. Honattikal, Chikkangiri betta and Honnamatti betta are some of the important
tracts. The north western region is drained by major river Cauvery & Kabini which flow from west
to east and both the river conflicts at Tirumalkudalu Narsipura. Suvarnavathi and its tributary, Hebba
halla flows from south to north in the central part of the study area, in turn drain into river Cauvery
(Azadhe T. Hejabi and Basavarajappa H.T., 2011).

International Journal of Civil Engineering and Technology (IJCIET), ISSN 0976 – 6308 (Print),
ISSN 0976 – 6316(Online), Volume 5, Issue 11, November (2014), pp. 79-96 © IAEME
81
The land adjoining the banks of meandering course of the river forms the most fertile and
rich tracts of land, which is cultivated intensively for paddy and coconut. The paleo-channels of the
study are also mapped using satellite data which gives additional information regarding water
bearing zones like hidden aquifers, old river course, fractures and valley fills (Basavarajappa et al.,
2008; 2013; Dinakar S and Basavarajappa H.T., 2005; Satish et al., 2008).
3. LOCATION
The study area lies between 11°45’ to 12°15’N latitude and 76°45’ to 77°15’E longitude with
total areal extent of 3,011 Km2 (Fig.1). The study area includes parts of 9 taluks of Karnataka state
namely Yelandur, Kollegal, Chamarajanagara, Malavalli, Mysuru, Gundlupet, T. Narsipura,
Nanjungudu and small patches of Tamil Nadu region (Sathyamangalam) in the southern and
southeastern parts. Cauvery and Kabini are the two major rivers flowing in the study area in which
Kabini is one of the tributary of River Cauvery.

International Journal of Civil Engineering and Technology (IJCIET), ISSN 0976 – 6308 (Print),
ISSN 0976 – 6316(Online), Volume 5, Issue 11, November (2014), pp. 79-96 © IAEME
82
4. CLIMATE & RAINFALL
Generally weather is pleasant and the climate is divided into four seasons viz., pre-monsoon
(Jan-Feb), south-west monsoon (May-Sept), north-east monsoon (Oct-Dec) and summer (Mar-
April). The average annual rainfall is 786.8mm (2004) with a major contribution south-west
monsoon (44.45%). The annual minimum rainfall is recorded as 558.07mm (Kavalande rain-gauge
station) while the maximum is 1455.43mm (2010) (Biligiri-Rangan temple rain-gauge station). There
is a continuous rise in temperature attaining a maximum in the month of April and minimum during
December. Wind speed is moderate during south-west monsoon and relative humidity is high
(Dinakar S and Basavarajappa H.T., 2005).
6. METHODS & MATERIALS
6.1 Methodology: LU/LC maps are prepared using satellite image in conjunction with collateral data
like SoI topomaps on 1:50,000 scale by taking permanent features such as road, tanks, co-ordinates,
etc. Visual interpretation of IRS-1D PAN+LISS-III FCC of Band 2,3,4 on 1:50,000 scale is carried

International Journal of Civil Engineering and Technology (IJCIET), ISSN 0976 – 6308 (Print),
ISSN 0976 – 6316(Online), Volume 5, Issue 11, November (2014), pp. 79-96 © IAEME
83
out and various LU/LC categories are delineated. The satellite data of two seasons is acquired (Rabi
in December 2002 and Kharif in October 2003) to estimate the spatial distribution of LU/LC pattern.
These categorizations are done based on the classification scheme developed by National Remote
Sensing Agency (NRSA, 1995).
6.2 Materials used:
a. Topomaps: 57D/16, 57H/4, 58A/13 and 58E/1.
Source: (SoI, Dehradun).
b. Satellite Data: IRS-1D LISS-III of 23.5m Resolution (March & Nov-2001) and PAN+LISS-III of
5.8m, Date of pass 10-March-2003.
Source: (National Remote Sensing Agency (NRSA), Hyderabad.
c. GIS software’s: Mapinfo v7.5, Arc Info v3.2, Erdas Imagine v2011 and Arc GIS v10.
d. GPS: Garmin 12 is used during Ground Truth Check (GTC).
Fig.3. Flow chart showing the methodology adopted in the preparation of Land use/Land cover map
Classification analysis using Geomatics: Information on land use/land cover is of utmost
importance in hydrogeological investigation as the groundwater regime of a region is influenced by
the type of land use/land cover. Hence the satellite based data is very much useful in preparing the
precise land use/land cover maps in a very short time period as compared to the conventional
methods using Geomatics. LU/LC classes such as built-up land, agricultural land (crop land), fallow
land, plantation, forest (evergreen, deciduous, scrub, etc), wastelands (salt affected land, waterlogged
Satellite data IRS-1D,
LISS-III & PAN+LISS-III
of 2 Season Geocoded
Data Source Collateral data
• SoI toposheet
• Forest Map
Base Map
Image Analysis Classification System
Preliminary Interpreted Map
Image Interpretation
Ground Truth Check
Post Field
Correction/Modification
Final Land use/Land cover Map

International Journal of Civil Engineering and Technology (IJCIET), ISSN 0976 – 6308 (Print),
ISSN 0976 – 6316(Online), Volume 5, Issue 11, November (2014), pp. 79-96 © IAEME
84
land, gullied/ravinous land, barren rock/stony waste etc), water bodies (rivers, streams, canals, lakes,
etc) are delineated based on the image characteristics like tone, texture, shape, association,
background, etc. The level-1 classification consists of 5 major categories such as built-up land,
agricultural land, forest, wastelands, water bodies and others. These 5 major classes of level-1 are
further divided into sub-categories of level-2; keeping the area under investigation. Level-3
classification has been done in detail on agricultural and forest lands to study the cropping pattern.
Geomatics are the advent high-tech tool that can be used more effectively in natural resources
management using Survey of India (SoI) toposheet, Satellite image with limited Ground Truth Check
(GTC) using GIS software’s (Tiwari A and Rai B., 1996). This helps in analyzing, mapping and
integrating the information database to generate thematic maps for development and management of
natural resources (NRSA, 1995). Digital interpretation and post classification comparison techniques
are adopted to find out the changes among various land uses over a period (Rubee and Thie, 1978;
Likens and Maw, 1982; Priyakant et al., 2001). Lithological formations and geomorphological
landforms are derived by visual image interpretation of IRS-1D PAN+LISS-III of False Color
Composite (FCC) based on the image interpretation elements such as association, pattern, shadow,
shape, size, tone, texture etc., and verified during the field visits. Drainage and slope maps are
digitized using Survey of India (SoI) toposheets of 1:50,000 scale.
7. LEVEL-1 CLASSIFICATION
7.1 Built-up land: These are the land surfaces of man-made constructions due to non-agricultural
use including buildings, transportation network, communication, industrial, commercial complexes,
utilities and services in association with water, vegetation and vacant lands. Collectively, cities,
towns and habitations are included under this category. The total aerial extent of built-up land is
61.71 Km2 (2.05%).
7.1.1 Urban (Towns and Cities): Land used for human settlement of population more than 5000 of
which more than 80% of the work forces are involved in non-agricultural activities is termed as
urban land use. Most of the land covered by building structures is parks, institutions, playgrounds
and other open space within built up areas. The major urban settlements are noticed in
Chamarajanagara, Kollegal and Yelandur taluks. Urban land occupies an area of 9.2 Km2 (0.31%).
7.1.2 Rural (Villages): Land used for human settlement of size comparatively less than the urban
settlement of which more than 80% of people are involved in agricultural activities. Though the total
number of rural settlements in the study area is 601 as per the toposheet information, only 483
villages can be clearly noticed from the satellite data due to less number of houses (less than 10
houses) in a village, inter spread with trees and agriculture fields especially in South Eastern parts of
study area occupied by thick forest with hilly region. The area occupied by this class is about 52.4
Km2 (1.74%).
7.2 Agricultural land: These are the land primarily used for farming, production of food, fiber,
other commercial and horticultural crops. It includes land under crops (irrigated and unirrigated),
fallow, plantations, etc. The area under this category is 2043.21 Km2 (67.85%).
7.2.1 Crop Land: It includes those lands with standing crops as on the date of the satellite data
acquisition. The crops may be either Kharif/Rabi or Kharif and Rabi seasons or double cropped. It
includes land under crops (irrigated and unirrigated), fallow, plantation, etc (NRSA, 1989). The area
under crops have been identified in both during Kharif (June to September) & Rabi seasons (October
to February) are mapped. The land under double crop (land cultivated both during Kharif and Rabi
seasons) have also been mapped and digitized.

International Journal of Civil Engineering and Technology (IJCIET), ISSN 0976 – 6308 (Print),
ISSN 0976 – 6316(Online), Volume 5, Issue 11, November (2014), pp. 79-96 © IAEME
85
7.2.1.a Kharif: Kharif includes standing crops from June to September in associated with rainfed
crops under dry land farming and limited irrigation. Kharif crops include Jowar, Ragi, Horsegram
and others in the study area. The prospect of Kharif crops mainly depends upon the regularity of
monsoon to some extent on irrigation facilities. The cultivated land of Kharif season on FCC shows
bright red tone. The areas in single crop system with moderately deep to deep soil on nearly level to
very gently sloping with good to moderate groundwater potential/accessible surface water resources
or both can be put into intensive cropping system. This land occupies an area of 1160.64 Km2
(38.54%).
7.2.1.b Double Cropped: This category has been identified and mapped using the two season
satellite images. Most of the double crop areas are concentrated adjacent to the river Cauvery and
Kabini flowing in north-western parts of the study area. The cropping intensity is very high due to
physical factors such as flat terrain, fertile soil and irrigated from canal system. Paddy, Sugarcane,
Groundnut, Sunflower and others are grown in this region. On FCC, the double crop show a dark red
tone with square pattern representing soil covers with higher amount of moisture near the streams.
The water table is found to be at shallow level, indicating the good groundwater prospects. Higher
the growth of natural vegetation; higher will be the groundwater availability. The cultivated land at
elevated zones show bright red tone generally representing the less amount of moisture and deeper

International Journal of Civil Engineering and Technology (IJCIET), ISSN 0976 – 6308 (Print),
ISSN 0976 – 6316(Online), Volume 5, Issue 11, November (2014), pp. 79-96 © IAEME
86
levels of groundwater prospect indicates the moderate groundwater prospect zones. Intensive
agriculture is seen in north-western and central parts growing multiple crops in sequence on same
land. They are mostly confined to valleys, low lands, alluvial tracts where the groundwater potential
is good. The soils are deep, provide good groundwater yield with maximum nutrient holding
capacity. This category covers an area of 650.35 Km2
(21.60%).
International Journal of Civil Engineering and Technology (IJCIET), ISSN 0976 – 6308 (Print),
ISSN 0976 – 6316(Online), Volume 5, Issue 11, November (2014), pp. 79-96 © IAEME
87
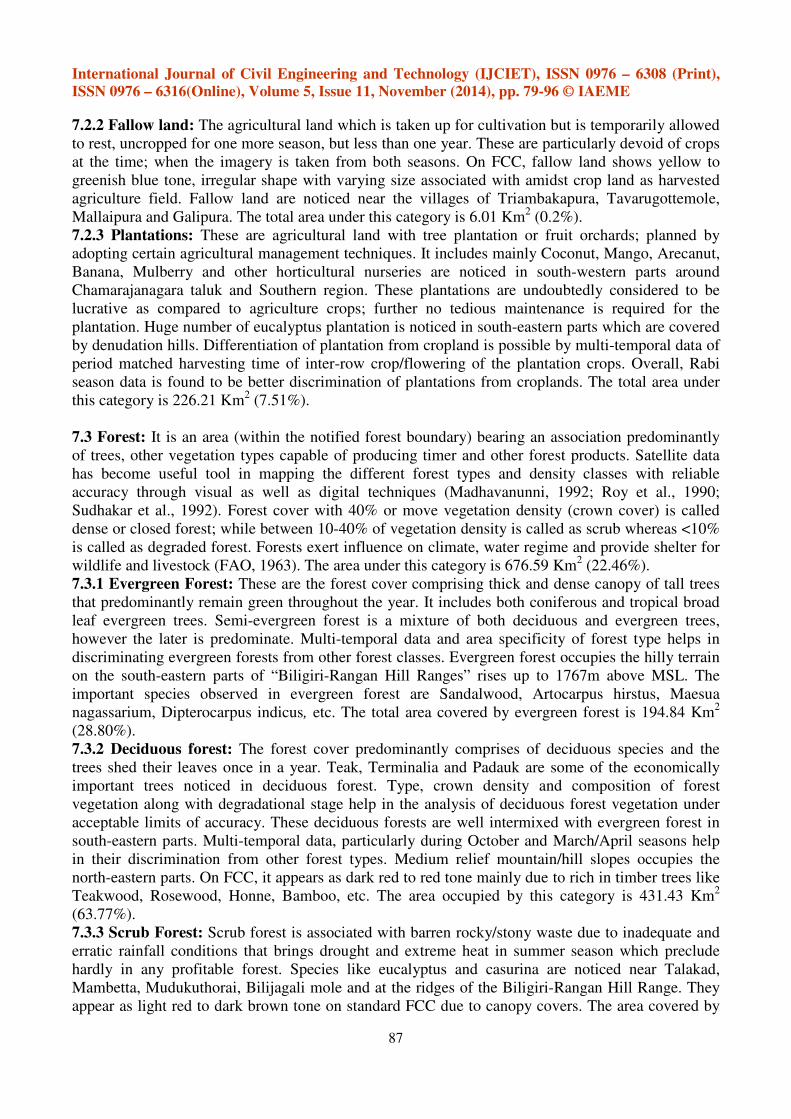
7.2.2 Fallow land: The agricultural land which is taken up for cultivation but is temporarily allowed
to rest, uncropped for one more season, but less than one year. These are particularly devoid of crops
at the time; when the imagery is taken from both seasons. On FCC, fallow land shows yellow to
greenish blue tone, irregular shape with varying size associated with amidst crop land as harvested
agriculture field. Fallow land are noticed near the villages of Triambakapura, Tavarugottemole,
Mallaipura and Galipura. The total area under this category is 6.01 Km2 (0.2%).
7.2.3 Plantations: These are agricultural land with tree plantation or fruit orchards; planned by
adopting certain agricultural management techniques. It includes mainly Coconut, Mango, Arecanut,
Banana, Mulberry and other horticultural nurseries are noticed in south-western parts around
Chamarajanagara taluk and Southern region. These plantations are undoubtedly considered to be
lucrative as compared to agriculture crops; further no tedious maintenance is required for the
plantation. Huge number of eucalyptus plantation is noticed in south-eastern parts which are covered
by denudation hills. Differentiation of plantation from cropland is possible by multi-temporal data of
period matched harvesting time of inter-row crop/flowering of the plantation crops. Overall, Rabi
season data is found to be better discrimination of plantations from croplands. The total area under
this category is 226.21 Km2 (7.51%).
7.3 Forest: It is an area (within the notified forest boundary) bearing an association predominantly
of trees, other vegetation types capable of producing timer and other forest products. Satellite data
has become useful tool in mapping the different forest types and density classes with reliable
accuracy through visual as well as digital techniques (Madhavanunni, 1992; Roy et al., 1990;
Sudhakar et al., 1992). Forest cover with 40% or move vegetation density (crown cover) is called
dense or closed forest; while between 10-40% of vegetation density is called as scrub whereas <10%
is called as degraded forest. Forests exert influence on climate, water regime and provide shelter for
wildlife and livestock (FAO, 1963). The area under this category is 676.59 Km2 (22.46%).
7.3.1 Evergreen Forest: These are the forest cover comprising thick and dense canopy of tall trees
that predominantly remain green throughout the year. It includes both coniferous and tropical broad
leaf evergreen trees. Semi-evergreen forest is a mixture of both deciduous and evergreen trees,
however the later is predominate. Multi-temporal data and area specificity of forest type helps in
discriminating evergreen forests from other forest classes. Evergreen forest occupies the hilly terrain
on the south-eastern parts of “Biligiri-Rangan Hill Ranges” rises up to 1767m above MSL. The
important species observed in evergreen forest are Sandalwood, Artocarpus hirstus, Maesua
nagassarium, Dipterocarpus indicus, etc. The total area covered by evergreen forest is 194.84 Km2
(28.80%).
7.3.2 Deciduous forest: The forest cover predominantly comprises of deciduous species and the
trees shed their leaves once in a year. Teak, Terminalia and Padauk are some of the economically
important trees noticed in deciduous forest. Type, crown density and composition of forest
vegetation along with degradational stage help in the analysis of deciduous forest vegetation under
acceptable limits of accuracy. These deciduous forests are well intermixed with evergreen forest in
south-eastern parts. Multi-temporal data, particularly during October and March/April seasons help
in their discrimination from other forest types. Medium relief mountain/hill slopes occupies the
north-eastern parts. On FCC, it appears as dark red to red tone mainly due to rich in timber trees like
Teakwood, Rosewood, Honne, Bamboo, etc. The area occupied by this category is 431.43 Km2
(63.77%).
7.3.3 Scrub Forest: Scrub forest is associated with barren rocky/stony waste due to inadequate and
erratic rainfall conditions that brings drought and extreme heat in summer season which preclude
hardly in any profitable forest. Species like eucalyptus and casurina are noticed near Talakad,
Mambetta, Mudukuthorai, Bilijagali mole and at the ridges of the Biligiri-Rangan Hill Range. They
appear as light red to dark brown tone on standard FCC due to canopy covers. The area covered by

International Journal of Civil Engineering and Technology (IJCIET), ISSN 0976 – 6308 (Print),
ISSN 0976 – 6316(Online), Volume 5, Issue 11, November (2014), pp. 79-96 © IAEME
88
this category is found to be 49.12 Km2 (7.26%).
7.3.4 Forest plantation: It is described as an area of trees with species of forestry and its importance
raised on notified forest lands. These are artificially planted areas with tree cover, either in the open
spaces or by clearing the existing forests for economically inferior species. The common indigenous
and exotic trees of forest plantations are Teak, Sal, Chir-pine, Deodar, Casuarina, Khair and Sisoo.
New and young plantations can be readily separated from contiguous forested areas. Few mass of
artificial planted medicinal plantations are noticed on foot hills of Biligiri-Rangan Hills, Yelandur
road. The area occupied by this class is about 1.20 Km2 (0.04%).
7.4 Wastelands: These are degraded lands which can be brought under vegetative cover with
reasonable effort. These are currently under utilized and deteriorating due to lack of appropriate
water & soil management or on account of natural causes. Wastelands can result from
inherent/imposed disabilities such as locations, environment, chemical and physical properties of the
soil/financial/management constraints (NWDB, 1987). The wasteland mapping is done using the
Survey of India (SoI) toposheet on 1:50,000 scale and Satellite Remote Sensing data (NRSA., 1995).
Thirteen types of wastelands are identified and digitized. The total aerial extent of wasteland covers
about 134.19 Km2
(4.46%).
7.4.1 Salt-affected area: The areas are delineated based on white to light blue tone and its situation.
These are found in river plains and in association with irrigated lands. These are mostly white
kankary soils generally showing high intensity of erosion. These areas are adversely effecting the
growth of most of the plants due to the action or presence of excess soluble or high exchangeable
sodium. These are well observed in the villages of Kudderu, Telukkuru, Ummattur, Heggavaddi,
Dasanapura, Dodda indavadi, Yelandur, Mole and Gumballi. The area occupied by this category is
8.61 Km2 (0.29%).
7.4.2 Gullied land: Gullies are narrow and deep channels developed as a result of weaving away of
soil by running water. Gullies develop from rills which are tiny channels of few centimeters deep,
formed by the impact of rainfall and weaving action of runoff. They are more common on sloping
land and developed by the action of concentrated runoff. In the study area, these lands are noticed in
eroded plains along streams, on sloping surface made of loose sediments adjacent to pediments and
residual hills which are well observed in the villages of Hyakanuru, Adibettalli, Hosahalli,
Vatalupura, Bagali, etc. These areas are having entrenched drainage system, good rainfall and
surface runoff. On FCC, they appears as light yellow to bluish green depending upon the surface
moisture and depth of erosion with varying size. These gullies and ravines contribute to soil erosion
and land degradation. The area under this class is 1.73 Km2 (0.06%).
7.4.3 Land with scrub: Scrub lands are observed along the ridges, valley complex, linear ridges and
steep slope areas. Most of these areas are characterized by the presence of thorny scrub, herb species,
many hillocks of steep and dombal shaped are associated with poor vegetal cover. As a consequence,
severe soil erosion frequently occurs during rainy seasons and later most of the hill tops become
barren/rocky. Large patches are noticed in Mudu betta, Badagalapura, Madumali, Karadi betta and
adjacent to the deciduous forests. These lands are mainly observed in North-Eastern parts of hilly
regions with an aerial extent of 113.29 Km2 (3.76%).
7.4.4 Land without scrub: Land under this class is generally prone to degradation/deterioration and
may not have scrub cover. It is confined to (relatively) higher topography such as uplands or high
grounds etc excluding the hills and mountainous terrain. On FCC, they appear as light yellow to
brown to greenish blue, varying in size associated with gentle relief with moderate slope in plain and
foothills surrounded by agricultural lands. They are observed in the villages of Honnegaudanahalli,
Kalibasavanhundi and Medini with an aerial extent of 3.14 Km2 (0.10%).

International Journal of Civil Engineering and Technology (IJCIET), ISSN 0976 – 6308 (Print),
ISSN 0976 – 6316(Online), Volume 5, Issue 11, November (2014), pp. 79-96 © IAEME
89
7.4.5 Sandy areas: Sandy areas are developed in situ or transported by Aeolian or fluvial processes.
These occur as a sandy plain in the form of sand dunes, beach sands and dune (wind blown) sands.
Patches of sand bars are noticed along the river Cauvery and meandering areas in the villages of
Kukkur, Talakad, Malingi and Hampapura. Very high reflectivity is observed in all the spectral
bands; particularly the infrared region provides very high confidence level as compared to salt
affected soils. The area occupied by this category is 1.70 Km2 (0.06%).
7.4.6 Stony Waste: These are the lands characterized by exposed massive rocks, sheet rocks, stony
pavements or land with excessive surface, accumulation of stones that render them unsuitable for
production of any green biomass. Such lands are easily discriminated from other categories of
wastelands due to their characteristic spectral response. On FCC, they appears as greenish blue to
yellow to brownish in tone with varying size associated with steep isolated hillocks, hill slopes and
eroded plains. They occurs as a linear form within the plain land mainly due to varying lithology
found in the villages of Maliyur, Kalipura, Jyothigaudanapura, Mariyalhundi and Masagapura. The
area occupied by this category is 5.72 Km2 (0.19%).
7.5 Water bodies: This class comprises areas of surface water, either impounded in the form of
ponds, lakes and reservoirs or flowing as streams, rivers, canal, etc. These are clearly observed on
standard FCC in different shades of blackish blue to light blue color depending on the depth of water
bodies. The area occupied by this category is 95.51 Km2 (3.17%).
7.5.1 River: It is the natural course of water flowing openly on the land surface along a definite
channel. It may be a seasonal or perennial river system. The major parts of the study area are drained
by river Cauvery and its tributaries Kabini, Suvarnavathi and Chikkahole. River Cauvery flows from
West to East in Northern parts of the study area. River Kabini flows towards easterly direction
joining the river Cauvery at Tiramalakudalu Narasipura. Rivers Suvarnavathi and Chikkahole flow
from south towards north at central parts and intern drain into river Cauvery at Hampapura village.
The area occupied by river Cauvery, Kabini, Suvarnavathi and Chikkahole is 25.22 Km2, 5.06 Km
2,
4.13 Km2, and 0.82 Km
2 respectively.
7.5.2 Reservoirs: A reservoir is an artificial lake created by construction of a dam across the river
specifically for the generation of hydro-electric power, irrigation, water supply for
domestic/industrial uses and flood control. The reservoir would affect the land around the reservoir
rim. The introduction of a huge reservoir would be disturbing the delicate balance between soil,
water and plants through rise in groundwater table (water-logging), (Piyoosh Rautela, 2002). The
study area is endowed with 3 reservoirs namely Suvarnavathi Reservoir, Gundal Reservoir and
Chikkahole Reservoir covering area of 4.51 Km2.
7.5.2.a Chikkhole reservoir: A masonry dam 894.05 m in length and 25 m in height has been
constructed across Chikkhole near Srirangapura about 12.8 Km southeast of Chamarajanagara-
Satyamangalam road. Two canals mainly right and left bank are constructed for irrigation purpose.
In addition to the above, two bunds have been constructed across Suvarnavathi on the downstream
side near Attgulipura and Hongalavadi where the channels are taken out for irrigation. These
channels also act as feeding channels to various tanks of Ramasamudram, Homma, Kempanapura,
etc. The area occupied by this category is 1.38 Km2
(0.05%).
7.5.2.b Gundal Reservoir: A rock filled earthen dam is constructed across the Gundal stream by
11.2 Km South-East of Kollegal town. The length of the dam is 40.23 m and height is 29.56 m. The
reservoir has been constructed in between two hillocks of Biligiri-Rangan Hills. The catchment of
the reservoir is highly undulating lofty mountains covered by evergreen and deciduous forest. The
area occupied by the Gundal reservoir is 1.41 Km2 (0.05%).

International Journal of Civil Engineering and Technology (IJCIET), ISSN 0976 – 6308 (Print),
ISSN 0976 – 6316(Online), Volume 5, Issue 11, November (2014), pp. 79-96 © IAEME
90
7.5.2.c Suvarnavathi Reservoir: The length of the dam is 1146.80 m and its height is 25.92 m
located at Attigalipura village, Chamarajanagara town covering an area of about 1.72 Km2 (0.06%).
The upstream of the reservoir is occupied by forest plantations, while the downstream sides are
occupied by agricultural lands. The reservoir is later divided into right and left bank canals. Right
bank canal runs about 19.5 Km, but only a small portion of the canal is useful for irrigation purpose
and the remaining portion of the canal runs in undulating terrain covered by plantations. Left bank
canal runs about 3.9 Km and benefits irrigation purposes.
Table.1: Land Use/Land Cover Classification Analysis of the study area LEVEL – 1 LEVEL – 2 LEVEL - 3
1 Built – up
land
1.1 Towns/Cities
1.2 Villages
2 Agricultural
Land
2.1 Crop land
2.1.1 Kharif
2.1.2 Tank irrigated kharif
2.1.3 Rabi
2.1.4 Kharif + Rabi (Double
cropped)
2.2 Fallow
2.3 Plantation
3 Forest
3.1 Evergreen/ Semi evergreen 3.1.1 Dense
3.2.2 Open
3.2 Deciduous (Moist & Dry) 3.2.1 Dense
3.2.2 Open
3.3 Scrub Forest
3.4 Forest Blank
3.5 Forest Plantations
3.6 Mangroves
4 Wastelands
4.1 Salt Affected Land
4.2 Waterlogged Land
4.3 Marshy / Swampy Land
4.4 Gullied / Ravinous Land
4.5 Land with scrub
4.6 Land without scrub
4.7 Sandy area (Coastal & Desertic)
4.8 Mining/ Industrial Wasteland
4.9 Barren Rocky / Stony Waste/ Sheet Rock
Area
5 Water Bodies
5.1 River / Stream
5.2 Canals
5.3 Lake / Reservoirs / Tanks
6 Others
6.1 Shifting Cultivation
6.2 Grassland/ Grazing land 6.2.1 Dense
6.2.2 Degraded
6.3 Salt Pans
6.4 Snow covered / Glacial Area

International Journal of Civil Engineering and Technology (IJCIET), ISSN 0976 – 6308 (Print),
ISSN 0976 – 6316(Online), Volume 5, Issue 11, November (2014), pp. 79-96 © IAEME
91
Table.2. Image Characteristics of various land use/land cover categories of the study area (as
seen in FCC)
LU/LC category Tone/ color Size Shape Texture Pattern
Built-up land Dark bluish green Small to big Irregular Coarse Clustered to Scattered
Crop land Bright red to red Varying in
size
Regular to
Irregular Medium to Smooth
Contiquous to Non-
Contiguous
Fallow land Yellow to greenish blue Small to big Reqular to
Irregular Medium to Smooth
Contiquous to Non-
Contiguous
Plantation Dark red to red Small to
large
Reqular to
Irregular Coarse to medium Dispersed contiguous
Evergreen forest Dark red Varying in
size
Irregular,
discontinous
Smooth to medium
(depends on crown
density)
Contiquous to Non-
Contiguous
Deciduous forest Red Varying in
size
Irregular,
discontinous
Smooth to medium
(depends on crown
density)
Contiquous to Non-
Contiguous
Scrub forest light red to brown (depends
on canopy cover)
Varying in
size
Irregular,
discontinous Coarse to mottled
Contiquous to Non-
Contiguous
Forest plantation Light red to red Varying in
size
Reqular to
Irregular Smooth to medium
Contiquous to Non-
Contiguous
Salt affected land White to light blue Small to
medium
Irregular,
discontinous Smooth to mottled
Dispersed, non-
contiguous
Gullied land Light yellow to bluish
green
Varying in
size Reqular, broken very coarse to coarse
Dendritic to sub-
dendritic
Land with scrub Light yellow to brown to
greenish blue
Varying in
size
Irregular,
discontinous Coarse to mottled Contiquous dispersed
Land without
scrub Light yellow to brown
Varying in
size
Irregular,
discontinous Coarse to mottled Contiquous dispersed
Sandy area White to light yellow Varying in
size Irregular, convex Coarse to mottled Dispersed contiguous
Stony waste Greenish blue to yellow to
brownish
Varying in
size
Irregular,
discontinous Coarse to medium
Linear to contiguous
and dispressed
River or stream Light blue to dark blue Long narrow
and wide
Irregular,
Sinuous Smooth to medium
Contiguous,
dendritic/sub-dendriti
Water bodies Light blue to dark blue
(Subject to depth, weeds)
Small,
medium,
large
regular to
Irregular Smooth to mottled
Non-contiquous
dispersed
Table.3: Level-1 Land Use/Land Cover Category in the Study Area
Sl. No Classification –level 1 Area in Km
2 Percentage
(%)
1. Built-up land 61.71 2.05
2. Agriculture land 2043.21 67.85
3. Wasteland 134.19 4.46
4. Forest class 676.59 22.47
5. Water body 95.51 3.17
Total 3011.21 100.00

International Journal of Civil Engineering and Technology (IJCIET), ISSN 0976 – 6308 (Print),
ISSN 0976 – 6316(Online), Volume 5, Issue 11, November (2014), pp. 79-96 © IAEME
92
Table.4: Level-2 land use/land cover categories in the study area
Level-1 Level-2 Area in Km2 Percentage (%)
1. Built-up land 1.1 Urban area 9.26 0.31
1.2 Rural area 52.45 1.74
2. Agricultural land 2.1 Kharif 1160.64 38.54
2.2 Double crop 650.35 21.60
2.3 Fallow 6.01 0.20
2.4 Plantation 226.21 7.51
3. Forest land 3.1 Evergreen forest 194.84 6.47
3.2 Deciduous forest 431.43 14.33
3.3 Scrub forest 49.12 1.63
3.4 Forest plantation 1.20 0.04
4. Wasteland 4.1 Salt affected land 8.61 0.29
4.2 Gullied land 1.73 0.06
4.3 Land with scrub 113.29 3.76
4.4 Land without scrub 3.14 0.10
4.5 Sandy area 1.70 0.06
4.6 Stony waste 5.72 0.19
5. Water body 5.1 Tank 52.38 1.74
5.2 Cauvery River 25.22 0.84
5.3 Chikka hole River 0.82 0.03
5.4 Chikka hole reservoir 1.38 0.05
5.5 Gundal reservoir 1.41 0.05
5.6 Kabani River 5.06 0.17
5.7 Stream 3.39 0.11
5.8 Suvarnavathi River 4.13 0.14
5.9 Suvarnavathi reservoir 1.72 0.06
Total area 3011.21 100.00

International Journal of Civil Engineering and Technology (IJCIET), ISSN 0976 – 6308 (Print),
ISSN 0976 – 6316(Online), Volume 5, Issue 11, November (2014), pp. 79-96 © IAEME
93
8. RESULTS & DISCUSSION
The impact of land use in prevailing surface and sub-surface hydrologic conditions is
remarkably high. Within the basin, the dynamics of hydrologic processes are governed partially by
the temporal and spatial characteristics of inputs, outputs and land use conditions (Shih, 1996). The
physiography and land characteristics have fabricated the existing land use with varying degree of
biodiversity. Change in land use is mainly due to the hydrological factors (Saraf and Choudhary.,
1998). In the present study, northwest and southwestern parts are almost flat in topography
representing agricultural fields, while eastern and southeastern parts are undulated hilly terrain
interspersed with cultivated lands confined along the valley. A large number of irrigation/recharge
tanks in the area contribute immensely in recharging the aquifers. Aquifers closer to these tanks have
much better prospects compare to those located away from the tanks. The water tanks are located
mostly along the drainage course within the pediplain, which are often structurally controlled terrain.
Kharif crops are dependent mainly of rainfall and occupy the maximum areal extent of 1160.64 Km2
that indirectly reflect that groundwater dependent crops are less. Double crops are noticed adjacent to
the perennial rivers Kabini and Cauvery which provide well developed canal system for irrigation
purpose. Small isolated hillocks found in gneissic terrain are covered by scrub lands due to lack of
water potential. Maximum extent of forest land occurs in Biligiri-Rangan Hill Ranges which are
thickly vegetated with evergreen and deciduous forest. Though it is thickly vegetated, groundwater
condition is very poor due to its topography, steep slope and high runoff conditions. Denudational
hills are covered by thick forest, residual hills and pediments are dominated by scrub forest or land
with rock exposure. Pediplains are single crops with sparse agriculture depends on availability of
water, while alluvial plains constitute double crops with thick vegetation. Wherever the
obstructions/voids are encountered, Ground Truth Checks (GTC) are undertaken to verify the LU/LC
patterns during the interpretation.

International Journal of Civil Engineering and Technology (IJCIET), ISSN 0976 – 6308 (Print),
ISSN 0976 – 6316(Online), Volume 5, Issue 11, November (2014), pp. 79-96 © IAEME
94
9. CONCLUSIONS
The level-1 classification consists of 5 major categories such as built-up land, agricultural
land, forest, wastelands, water bodies and others. These 5 major classes of level-1 are further divided
into sub-categories of level-2; keeping the area under investigation. Level-3 classification has been
done in detail on agricultural and forest lands to study the cropping pattern. Multidisciplinary
approach and research in identifying the specific land is very much needed for better utilization,
maintenance of soil fertility and rehabilitation of degraded lands. Land use/land cover provides an
idea of relative infiltration capacity of different land cover types. About 67.85% of land is occupied
by agricultural land, in which 38.54% of land is occupied by Kharif crops on pediplain region which
are rainfed crops. Double crops are noticed in alluvial plains, canal command and in tank command
areas. Wastelands such as stony waste and scrub lands are observed in uplands, all along the fringes
of the forest areas. Different classes of vegetation tend to slow down and intercept the surface flow
of runoff water leading to maximize infiltration. Large areas of watersheds are under protected
forest, besides intensive social forestry programme is evident through large patches of plantation,
discernible in satellite imagery. The valley fills are intensively cultivated which gives high
productivity due to better sediment deposit and soil moisture availability. Land-use is obviously
determined by environmental factors such as soil characteristics, climate, topography and vegetation
but also reflects the importance of land as a fundamental factor of production. Thus understanding
past changes on land use and projecting future land-use programmes require understanding the
interactions of basic human forces that motivate production and consumption. Land use/land cover in
the form of maps, statistical data helps in spatial planning, management, utilization of land for
agriculture, forestry, pasture, economic production, agricultural planning, settlement surveys,
environmental studies and operational planning based on agro-climatic zones etc.
ACKNOWLEDGEMENT
The authors are indepthly acknowledged Prof. S. Govindaiah, Chairman, Department of
Studies in Earth Science, CAS in Precambrian Geology, Manasagangothri, University of Mysore,
Mysore; Dr. M.V Satish, Rolta India Ltd, Mumbai, Nagesh, MGD, Govt. of Karnataka for their
support in GIS work and UGC, New Delhi for financial support.
REFERENCE
1. Anderson J.R., Hardy E.T., Roach J.T and Witmer R.E (1976). A land use and land cover
classification system for use with Remote Sensor data, USGS, Prof. Vol.446, Pp: 1-26.
2. Azadhe Taghinia Hejabi and Basavarajappa H.T (2011). Hevay metal pollution in water and
sediments in Kabini River, Karnataka, India, Environmental Monitoring Assessment, DOI
10.1007/s10661-010-1854-0, 8th Jan-2011, Pp:1-13.
3. Basavarajappa H.T (1992). Petrology, geochemistry and fluid inclusions studies of
charnockites and associated rocks around Biligiri-Rangan hills, Karnataka, India Unpub. PhD
thesis, University of Mysore, Mysore, Pp: 1-96.
4. Basavarajappa H.T, Dinakar S, Satish M.V and Honne Gowda H (2008). Morphometric
analysis of sub-watersheds of river Suvarnavathi Catchment, Chamarajanagara District,
Karnataka using GIS, Remote Sensing and GIS Applications, Edited Volume, University of
Mysore, Vol.1, No.1, Pp.45-53.

International Journal of Civil Engineering and Technology (IJCIET), ISSN 0976 – 6308 (Print),
ISSN 0976 – 6316(Online), Volume 5, Issue 11, November (2014), pp. 79-96 © IAEME
95
5. Basavarajappa H.T, Dinakar S, Satish M.V, Nagesh D, Balasubramanian A and Manjunatha
M.C (2013). Delineation of Groundwater Potential Zones in Hard Rock Terrain of Kollegal
Shear Zone (KSZ), South India, using Remote Sensing and GIS, International Journal of
Earth Sciences and Engineering (IJEE), Cafet-Innova, Hydrology & Water Resource
Management- special issue, Vol.6, No.5, Pp: 1185-1194.
6. Clawson M. (1965). Land use information committee on land use statistics resources for the
future, The Johns Hoppkins Press, Baltimore, USA.
7. Dinakar S. and Basavarajappa H.T (2005). Geological, Geomorphological and Landuse/cover
studies using Remote Sensing and GIS around Kollegal Shear Zone, South India, unpub.
Ph.D. thesis, Univ. of Mysore, Pp:1-191.
8. FAO, (1963). World Forest Inventory, Food and Agriculture Orgnisation of United Nations,
Rome.
9. Jacks G.V (1946). Land commission for land use planning, technical communication, No.43,
Imperial Bureau of Soil Science, Harpenden England, Pp:90.
10. Kumar A., Tomas S., and Prasad L.B (1999). Analysis of fracture inferred from DTM and
remotely sensed data for groundwater development potential zones through remote sensing
and a geographical information system, Int. J. Remote Sensing, Vol.26, No.2, Pp: 105-114.
11. Likens W and Maw K, (1982). Hierarchial modeling for image classification. Proc. Remote
Sensing with Special Emphasis on Output to Geographic Information System in the 1980’s,
PECORA VII, South Dakota, USA, Pp: 290-300.
12. Madhavanunni N.V (1992). Forest and ecology application of IRS-1A data. Natural resources
management – A new perspective, Publication and Public Relations Unit, ISRO-Hq,
Bangalore, Pp: 108-119.
13. NRSA (1989). Manual of Nationwide land use/land cover mapping using satellite imagery,
part-1, Balanagar, Hyderabad.
14. NRSA (1995). Integrated mission for sustainable development, Technical Guidelines,
National Remote Sensing Agency, Department of Space, Govt. of India, Hyderabad.
15. NWDB (1987). Description and Classification of Wastelands, National Wastelands
Development Board, Ministry of Environmental and Forest, Govt. of India, New Delhi.
16. Philip G and Gupta R.A., (1990). Channel migration studies in the middle Ganga basin, India
using Remote sensing data, Int. J.Remote Sensing, Vol.10, No.6, Pp: 1141-1149.
17. Piyoosh Rautela, Rahul Rakshit, Jha V.K., Rajesh Kumar Gupta and Ashish Munshi (2002).
GIS and Remote Sensing based study of the reservoir-induced land-use/land-cover changes in
the catchment of Tehri dam in Garhwal Himalaya, Uttaranchal (India), Current Science,
Vol.83, No.3, Pp: 309-311.
18. Priyakant G.S., Kanade A.S., Deshpande V.K., and Kondawar (2001). Application of Remote
Sensing data and Geographical Information Systems for land use/land cover changes analysis
in mining areas – A case study, Muralikrishna I.V., (Ed). ICORG Spatial Information
Technology: Remote Sensing and Geographical Systems, BS Publications, Hyderabad, India,
Vol.2, Pp: 520-525.
19. Roy P.S., Diwakar P.G., Vohra T.P.S and Bhan S.K (1990). Forest resources management
using Indian Remote Sensing Satellite data, Asian-Pacific Remote Sensing J., Vol.3, No.1,
Pp: 11-16.
20. Rubee C.D and Thie J, (1978). Land use monitoring with Landsat digital data in southwestern
Monitoba, Proc. 5th
Canadian Symp. on Remote Sensing of Environment, Victoria, British
Columbia, Pp: 136-149.
21. Saraf A.K and Choudhary P.Q (1998). Integrated Remote Sensing and GIS for Groundwater
exploration and identification of artificial recharge sites, Int. J.Remote Sensing, Vol.19,
No.10, Pp: 1825-1841.

International Journal of Civil Engineering and Technology (IJCIET), ISSN 0976 – 6308 (Print),
ISSN 0976 – 6316(Online), Volume 5, Issue 11, November (2014), pp. 79-96 © IAEME
96
22. Satish M.V, Dinakar S and Basavarajappa H.T (2008). Quantitative morphometric analysis of
sub-watersheds in and around Yelandur Taluk, Chamarajanagar District, using GIS, Remote
Sensing and GIS Applications, Edited Vol.01, No.1, Pp:156-164.
23. Shih S.F (1996). Integration of Remote Sensing and GIS for Hydrologic studies,
Geographical Information System in Hydrology, Kluwer Academic Publishers, The
Netherlands, Pp: 15-42.
24. Sreenivasalu V. and Vijay Kumar (2000). Land use/land cover mapping and change detection
using satellite data – A case study of Devak catchment, Jammu and Kashmir, Proc. of
ICORG, Vol.1, Feb, Hyderabad, Pp:520-525.
25. Sudhakar S., Krishnan N., Das P and Raha A.K (1992). Forest cover mapping of Midnapore
forest division using IRS-1A LISS-II data, Natural resources management – A new
perspective, Publication and Public Relations Unit, ISRO-Hq, Bangalore, Pp: 314-319.
26. Tiwari A and Rai B., (1996). Hydrogeomorphological mapping for groundwater prospecting
using Landsat MSS Images – A case study for part of Dhadabad district, J. Indian Soc.
Remote Sensing, Vol.24, No.4, Pp: 281-285.
27. Basavarajappa H.T, Parviz Tazdari and Manjunatha M.C (2013a). Integration of Soil and
Lineament on Suitable Landfill Site Selection and Environmental Appraisal around Mysore
City, Karnataka, India, using Remote Sensing and GIS Techniques, International Journal of
Civil Engineering and Technology (IJCIET), Chennai, Vol.4, Issue.6, Pp: 177-185.
28. A.N.Satyanarayana, Dr Y.Venkatarami Reddy and B.C.S.Rao, “Remote Sensing Satellite
Data Demodulation and Bit Synchronization” International Journal of Advanced Research in
Engineering & Technology (IJARET), Volume 4, Issue 3, 2014, pp. 1 - 12, ISSN Print: 0976-
6480, ISSN Online: 0976-6499, Published by IAEME.
29. Basavarajappa H.T, Manjunatha M.C and Jeevan L, “Sand Mining, Management and Its
Environmental Impact in Cauvery and Kabini River Basins of Mysore District, Karnataka,
India Using Geomatics Techniques” International Journal of Civil Engineering &
Technology (IJCIET), Volume 5, Issue 9, 2012, pp. 169 - 180, ISSN Print: 0976 – 6308,
ISSN Online: 0976 – 6316.
30. Basavarajappa H.T and Manjunatha M.C, “Geoinformatic Techniques on Mapping And
Reclamation Of Wastelands In Chitradurga District, Karnataka, India” International journal
of Computer Engineering & Technology (IJCET), Volume 5, Issue 7, 2014, pp. 99 - 110,
ISSN Print: 0976 – 6367, ISSN Online: 0976 – 6375.