Embed Size (px)
Citation preview
AN INTEGRATED APPROACH FOR POLLUTION MONITORING: SMART ACQUIREMENT AND SMART INFORMATION
E. Arcoa, P. Boccardoa, F. Gandinob, A. Linguac, F. Noardoc, M. Rebaudengob
a Politecnico di Torino, c.so Duca degli Abruzzi, 24 10129 Torino Italy - DIST ([email protected])b Politecnico di Torino, c.so Duca degli Abruzzi, 24 10129 Torino Italy – DAUIN (filippo.gandino,
maurizio.rebaudengo)@polito.it c Politecnico di Torino, c.so Duca degli Abruzzi, 24 10129 Torino Italy – DIATI (andrea.lingua, francesca.noardo)@polito.it
KEY WORDS: Pollution, Semantic web, Environmental monitoring, dynamic sensors, standard data models, internet of things
ABSTRACT:
Air quality is a factor of primary importance for the quality of life. The increase of the pollutants percentage in the air can cause serious problems to the human and environmental health. For this reason it is essential to monitor its values to prevent the consequences of an excessive concentration, to reduce the pollution production or to avoid the contact with major pollutant concentration through the available tools. Some recently developed tools for the monitoring and sharing of the data in an effective system permit to manage the information in a smart way, in order to improve the knowledge of the problem and, consequently, to take preventing measures in favour of the urban air quality and human health. In this paper, the authors describe an innovative solution that implements geomatics sensors (GNSS) and pollutant measurement sensors to develop a low cost sensor for the acquisition of pollutants dynamic data using a mobile platform based on bicycles. The acquired data can be analysed to evaluate the local distribution of pollutant density and shared through web platforms that use standard protocols for an effective smart use.
1. INTRODUCTION
Pollution is one of the major problems of our times and urban air quality has become a primary issue, acknowledged by the international community. The progress in technology can also give some response to the problem. Both the acquisition devices and communication technologies evolved in order to permit a smart management of the monitoring. The data can be effectively structured and shared for the produced information to be useful to reduce, prevent or avoid polluted areas, so that the human health and the environment can take advantage of that. In this study, a dynamic low cost sensor is produced and tested to be mounted on mobile supports. The measured data are managed and shared through the methods and technologies offered by the internet 3.0 to obtain a smart integrated system.
1.1. Urban air quality and pollutants
Many pollutants affect the air of a metropolis. In (Velasco A. et.al., 2015), ground-level ozone (O3) and fine particulates (PM10 and PM2.5) are identified as the most relevant pollutants for a pervasive air quality monitoring system, basing on their effects for human health and their variation of the concentration within short distances. Ground-level ozone is a threat for the respiratory system and for lung function. Long exposure to O3 can involve health problems such as asthma and bronchitis. Moreover, the respiratory diseases due to O3 can anticipate death. Many studies highlight the risks for human health due to exposure to O3, e.g (Lippmann M., 1989) shows a review on health effects of O3, (Bates, D. V et.al., 1972) investigates the short-term effects of O3, while (Spektor, D. M. et.al., 1988) analyses the effects of O3 on children. Particulate is very dangerous for human health. The inhalation of particulate can involve respiratory system problems such as asthma, lung cancer, respiratory disease, gestation problems (such as birth defects and premature delivery), and cardiovascular disease. Moreover, PM10 and PM2.5 can anticipate death, similarly to O3. The International Agency for Research on Cancer includes airborne particulates into the group
1 carcinogen, which includes the substances with evidence of carcinogenicity in humans. The risks for human health, due to PM10 and PM2.5, are analysed by many studies, e.g. (Pope III, C. A., Dockery, D. W, 1992) investigates the effects on PM10 on children. A study on the effects on health of PM2.5 and O3 in USA shows that in the most densely populated areas the percentage of deaths due to PM2.5 and ozone ranges from 3.5% in San Jose to 10% in Los Angeles (Fann N. et.al., 2012).
2. THE SMART DATA MANAGEMENT
2.1. The Internet Of Things
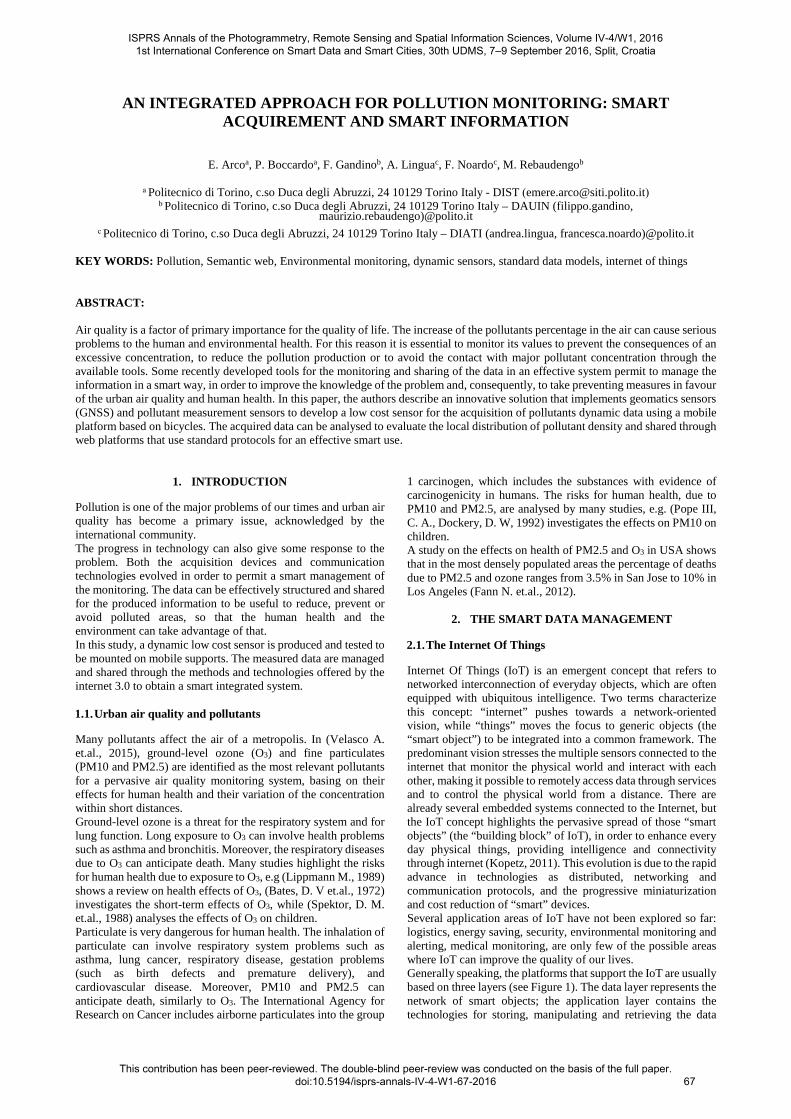
Internet Of Things (IoT) is an emergent concept that refers to networked interconnection of everyday objects, which are often equipped with ubiquitous intelligence. Two terms characterize this concept: “internet” pushes towards a network-oriented vision, while “things” moves the focus to generic objects (the “smart object”) to be integrated into a common framework. The predominant vision stresses the multiple sensors connected to the internet that monitor the physical world and interact with each other, making it possible to remotely access data through services and to control the physical world from a distance. There are already several embedded systems connected to the Internet, but the IoT concept highlights the pervasive spread of those “smart objects” (the “building block” of IoT), in order to enhance every day physical things, providing intelligence and connectivity through internet (Kopetz, 2011). This evolution is due to the rapid advance in technologies as distributed, networking and communication protocols, and the progressive miniaturization and cost reduction of “smart” devices. Several application areas of IoT have not been explored so far: logistics, energy saving, security, environmental monitoring and alerting, medical monitoring, are only few of the possible areas where IoT can improve the quality of our lives. Generally speaking, the platforms that support the IoT are usually based on three layers (see Figure 1). The data layer represents the network of smart objects; the application layer contains the technologies for storing, manipulating and retrieving the data
ISPRS Annals of the Photogrammetry, Remote Sensing and Spatial Information Sciences, Volume IV-4/W1, 2016 1st International Conference on Smart Data and Smart Cities, 30th UDMS, 7–9 September 2016, Split, Croatia
This contribution has been peer-reviewed. The double-blind peer-review was conducted on the basis of the full paper. doi:10.5194/isprs-annals-IV-4-W1-67-2016
67
from sensor networks; the client layer, is the level in which users reference the services deployed by the application layer, in order to design end-user applications across multiple application domains.
Figure 1. General architecture of an IoT platform
2.2. The Semantic Web
The effective exploiting of the Internet of Things needs the correct interpretation of the published data to be known by people and machines. Heterogeneous “things” must be integrated in a common frame in order to be understood, managed and retrieved. The definition of the meaning of the data for enabling interoperability and interchange of unambiguous knowledge is the main goal of the Semantic web. The Semantic web is the evolution of the World Wide Web that permits to manage the data themselves, instead of documents. The development of web technologies and artificial intelligence field makes today possible its realization. It is essential for an effective information structure, which could make the smart things a reality, in association with the internet of things (Barnaghi et al., 2012). A preliminary condition for the achievement of such an objective is the application of semantics to the managed data (Rowley, 2007). This data “upgrade” must happen in the application layer. The available tools to realize it are provided by the organizations involved in the Semantic web development, especially W3C (World Wide Web Consortium) (www.w3.org), which developed the semantic web technologies. Among these, essential tools are the ontologies and standard data models, which specify in a clear, unambiguous and “open” way what is the structure of the data and how they have to be interpreted. Data models and modelling languages have been developed in various fields. In particular, the Semantic Web actors developed XML-based languages for structuring and publishing structured data through the web. In the meantime, GML (Geography Markup Language), XML-based language has been published by OGC (Open Geospatial Consortium) (http://www.opengeospatial.org/) to structure and interchange spatial and geographical data. The geoinformation is fundamental for a smart data retrieving and analysis (Prandi et al. 2014). This is the reason why this kind of standard is also considered for the building of our system.
3. DYNAMIC SENSORS FOR THE AIR QUALITY MONITORING
The air quality in urban areas is of fundamental importance to support human life. However, human activities in densely populated areas involve the introduction of harmful materials in the air. Urban air quality is considered one of the greatest threat to human health (Ericson et al., 2008). One of the main sources of air pollutants is the fossil fuel combustion. In particular,
vehicle engines and heating systems spread pollutants in the residential areas, while power plants and industrial complexes emit high concentration of pollutants close to the urban area. Today, in the metropolitan areas, air quality is usually monitored by some fixed stations. However, the heterogeneous distribution of pollution sources does not allow a pervasive information about the air quality in the whole urban area to be obtained. A more accurate information about the spatial distribution of pollutants could help understand how they spread, and adopt targeted countermeasures. (Kheirbek et al., 2013) investigates the effects of PM2.5 and O3 within the different areas of New York City, USA. The results of this study highlight the importance of knowing spatially and temporally accurate data in local air quality. Wireless sensor networks (WSNs) are a well-known pervasive technology that allow multiple parameters to be monitored by deploying many low cost devices over the area of interest. In particular, the smart cities, which use information and communication technologies to improve the services and the quality of life, often employ WSNs. The use of WSNs for air quality monitoring has been considered and experimented in various studies. In (Postolache et al., 2010), the authors propose to use WiFi to transmit the collected data to a neural network to process the data and web pages to present the results. In (Khedo et al., 2010), an investigation on the application of WSNs to monitor the air pollution in Mauritius is presented. This study proposes, as a deployment method, to randomly spread out static sensors. Moreover, the paper discusses several characteristics of the system, such as an aggregation method for the data. The network is analysed through simulations. In order to increase the spatial density of the data, several mobility systems have been considered. The proposed devices communicate the collected data through Bluetooth connection. The goal of this system is to cover a large area with low cost devices. In (Ma et al., 2008), the authors propose a monitoring system that uses fixed and mobile sensors mounted on various vehicles such as buses, service vehicles and taxis. The data are transmitted wireless. The aim in such application is to cover the metropolitan area of London, UK. Moreover, a data mining technique is applied on the collected data. The system is analysed through simulations. In (Hasenfratz et al., 2015), the devices are deployed on top of public transport vehicles in the city of Zurich, Switzerland. A specific modeling system is proposed in order to improve the spatio-temporal resolution. In (Eisenman et al., 2009), a smart bicycle is proposed. Its goal is to monitor parameters of interest for cyclists, such as pollutants. An alternative method to collect dynamic data is represented by a participatory sensing system. In (Dutta et al., 2009), a monitoring system based on handheld devices is proposed. The goal of this system is to produce a participatory sensing system that allows individuals to measure their exposure to pollutants and the whole network to monitor an area. In (Hasenfratz et al., 2012), the authors propose a participatory sensing system in which the devices are connected to the smartphones of the users. The effects of human mobility on the accuracy of the sensed data are evaluated and a calibration routine is described. The calibration problem is also considered in (Tsujita et al., 2004). Here, the authors suggest to improve the accuracy by using sensors based on different approaches (e.g. quartz crystal microbalance, electrochemical and metal oxide) in order to monitor the same pollutant. Although many laboratory and field comparisons of sensors with reference methods are carried out, according to (Gerboles, 2012), the results are hardly repeatable and models that better describe the sensing processes are required to reach the expected data quality.
ISPRS Annals of the Photogrammetry, Remote Sensing and Spatial Information Sciences, Volume IV-4/W1, 2016 1st International Conference on Smart Data and Smart Cities, 30th UDMS, 7–9 September 2016, Split, Croatia
This contribution has been peer-reviewed. The double-blind peer-review was conducted on the basis of the full paper. doi:10.5194/isprs-annals-IV-4-W1-67-2016
68
3.1. Proposed monitoring system
An effective air quality monitoring system, able to support effective actions for the prevention of health problems and compliant with a great city context, should be able to: monitor a large area; collect pervasive data; guarantee a proper level of accuracy; involve limited costs. The selection of proper devices is fundamental for the implementation of an effective air quality monitoring system. According to the analysis of wireless sensor network platforms presented in (Velasco et al., 2015), Waspmote Plug & Sense from Libelium has been selected for the implementation of the monitoring system. The main advantages of that platform are: • compliance with ground level dust and ozone sensors,
identified as the core pollutants for urban air quality; • compliance with complementary sensors, as ammoniac,
nitrogen dioxide, atmospheric parameters and noise; • availability of various integrated wireless communication
systems (e.g., Zigbee, 802.15.4, WiFi, 3G/GPRS BLE), which are compliant with pervasive deployment;
• programmability with C language for Arduino, to reduce the learning time with respect to ad-hoc languages;
• effective development support; • international protection level IP65, compliant with outdoor
deployment; • low cost, required for a pervasive network composed by
many sensors. The Waspmote platform has been recently selected also for other researches on air quality, such as in (Anastasi et al, 2014) for the test of a monitoring system in Pisa, Italy, and in (Mansour et al., 2014) for the implementation of an air quality monitoring system for industrial and urban areas. The main goals of the proposed system is to collect pervasive data about the air quality within the urban area. Special attention has been paid on the deployment of the sensors. In order to cover a whole metropolitan area, the quantity of static sensors would be huge, so mobile stations have been preferred. Different vehicles were evaluated: they can be private (i.e. owned and daily used by citizens), or dedicated, (i.e. only used for the monitoring system). Moreover, public transport and sharing vehicles were considered. Focusing on the characteristics of the possible vehicles, the experimentation has been conducted on dedicated bicycles and private bicycles. The private bicycles do not require additional costs or dedicated human labour, and do not produce pollutants. Therefore, they represent a good solution for the air quality monitoring system. The dedicated bicycles are extremely suitable to the experimentation of the system, since they permit the execution of the desired tests and the production of results that can be easily extended to dedicated bicycles and bike sharing. The devices on the smart bicycles collect the data and then may transmit them via WiFi when they are within the communication range of an eligible access point. In order to integrate the hotspots freely available in the urban area, dedicated access points can be mounted at locations frequented by many users, such as schools, hospitals and plants. Other access points can be deployed close to the houses of selected users that transport the sensors on their private vehicles. The quantity of dedicated access points increases the cost of the system, but it improves also the frequency of data refresh. However, a WiFi network does not permit the implementation of a real time system. An alternative to WiFi is represented by 3G, which allows the communication with the central system from the majority of the urban locations. The advantage of this solution is the fast update, but an additional cost due to the use of 3G connection must be considered. Another solution is a Zigbee network. On the one hand, this connection requires dedicated gateways to transmit the collected data to a central server. On the other hand, with a large quantity of devices
densely deployed, it is possible to implement a multi-hop network in which the data are transmitted to the server in real time. For the experimentation of the monitoring network, the WiFi solution was selected, and all the bicycles started their rides where a WiFi access point has been installed. 3.2. Experimental analysis
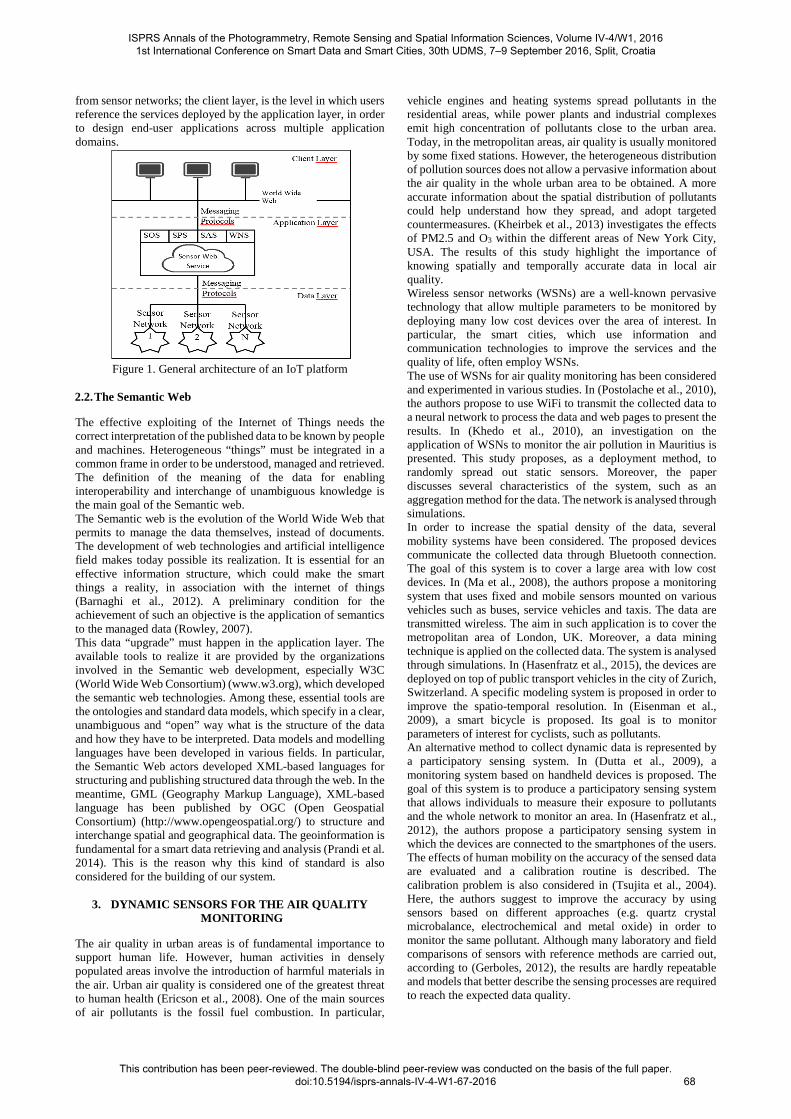
The calibration of the ozone and ground level dust sensors was the first task in the experiment. This activity was executed with the collaboration of the regional agency for the protection of the environment, ARPA Piemonte. The sensors were deployed in two air quality monitoring stations of ARPA Piemonte, and the collected data were used for the calibration. Figure 2 shows the data sensed by the Waspmote and by the ARPA station. It is possible to observe a strong correlation among the data. In particular, in the right part of the chart, both the sensors have detected a deep decrease and the subsequent sharp increase in the dust level. However, the low-cost mobile sensors do not provide a level of accuracy equal to the high-cost standard sensors. Moreover, the tests executed to calibrate the sensors have highlighted that the collected data are not so stable over time, so iterations of the calibration process are required. It is also possible to apply an auto-calibration technique, in which reliable data from fixed standard sensors, and the data from the already calibrated sensors are used to update the calibration of the network. The calibration issue for mobile sensors were already investigated in (Tsujita, 2004) and (Hasenfratz, 2012).
Figure 2. Calibration of the dust sensor.
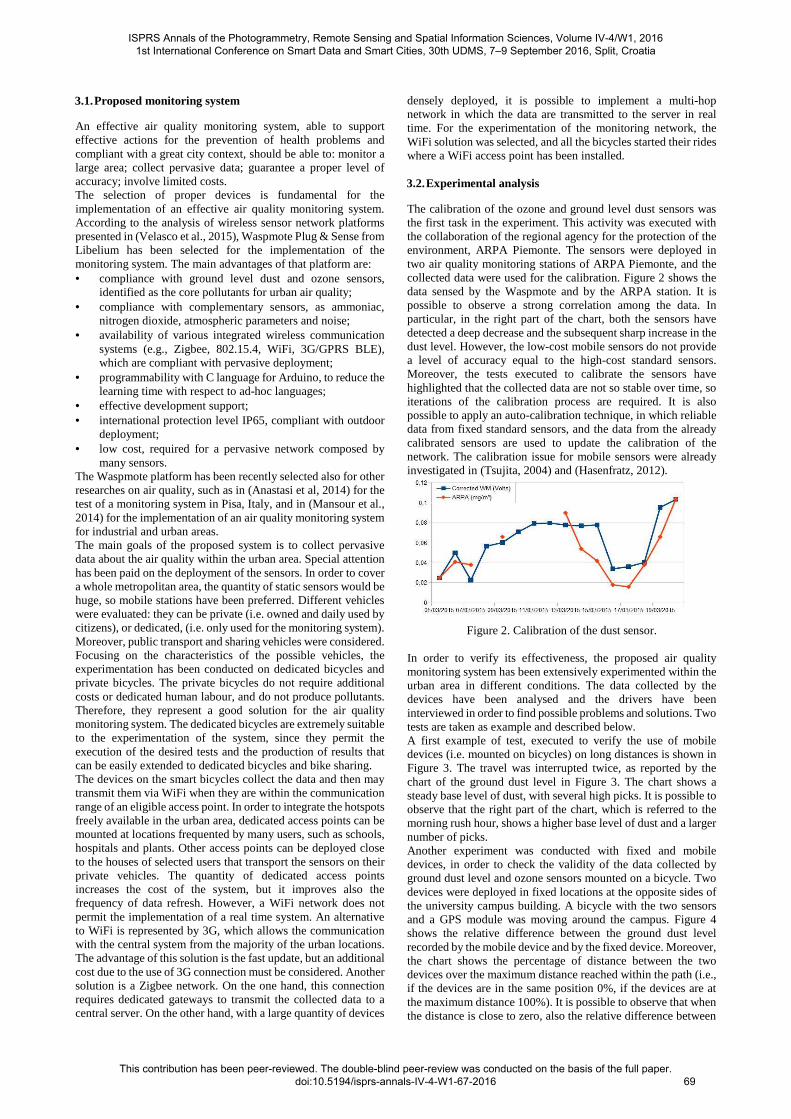
In order to verify its effectiveness, the proposed air quality monitoring system has been extensively experimented within the urban area in different conditions. The data collected by the devices have been analysed and the drivers have been interviewed in order to find possible problems and solutions. Two tests are taken as example and described below. A first example of test, executed to verify the use of mobile devices (i.e. mounted on bicycles) on long distances is shown in Figure 3. The travel was interrupted twice, as reported by the chart of the ground dust level in Figure 3. The chart shows a steady base level of dust, with several high picks. It is possible to observe that the right part of the chart, which is referred to the morning rush hour, shows a higher base level of dust and a larger number of picks. Another experiment was conducted with fixed and mobile devices, in order to check the validity of the data collected by ground dust level and ozone sensors mounted on a bicycle. Two devices were deployed in fixed locations at the opposite sides of the university campus building. A bicycle with the two sensors and a GPS module was moving around the campus. Figure 4 shows the relative difference between the ground dust level recorded by the mobile device and by the fixed device. Moreover, the chart shows the percentage of distance between the two devices over the maximum distance reached within the path (i.e., if the devices are in the same position 0%, if the devices are at the maximum distance 100%). It is possible to observe that when the distance is close to zero, also the relative difference between
ISPRS Annals of the Photogrammetry, Remote Sensing and Spatial Information Sciences, Volume IV-4/W1, 2016 1st International Conference on Smart Data and Smart Cities, 30th UDMS, 7–9 September 2016, Split, Croatia
This contribution has been peer-reviewed. The double-blind peer-review was conducted on the basis of the full paper. doi:10.5194/isprs-annals-IV-4-W1-67-2016
69
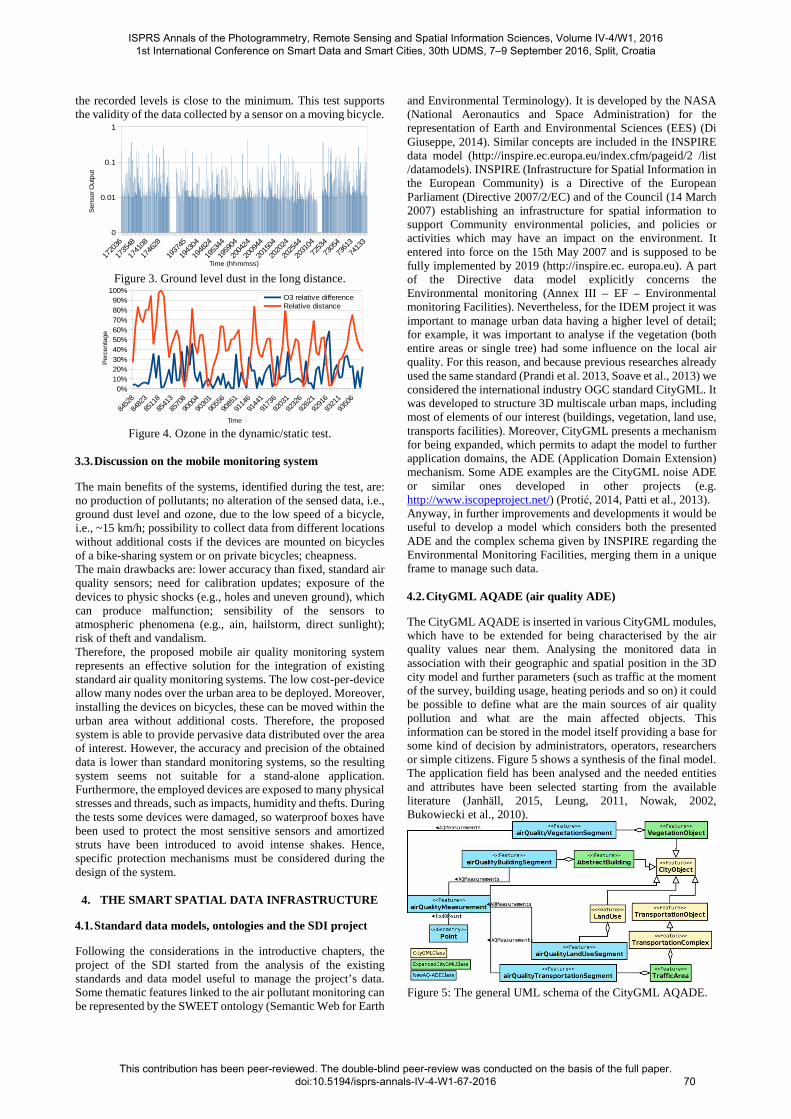
the recorded levels is close to the minimum. This test supports the validity of the data collected by a sensor on a moving bicycle.
1720
36
1735
48
1741
08
1746
28
1937
45
1943
04
1948
24
1953
44
1959
04
2004
24
2009
44
2015
04
2020
24
2025
44
2031
04
7253
4
7305
4
7361
3
7413
30
0.01
0.1
1
Time (hhmmss)
Senso
r O
utp
ut
Figure 3. Ground level dust in the long distance.
8452
8
8482
3
8511
8
8541
3
8570
8
9000
4
9030
1
9055
6
9085
1
9114
6
9144
1
9173
6
9203
1
9232
6
9262
1
9291
6
9321
1
9350
60%
10%20%30%40%50%60%70%80%90%
100%O3 relative differenceRelative distance
Time
Per
cent
age
Figure 4. Ozone in the dynamic/static test.
3.3. Discussion on the mobile monitoring system
The main benefits of the systems, identified during the test, are: no production of pollutants; no alteration of the sensed data, i.e., ground dust level and ozone, due to the low speed of a bicycle, i.e., ~15 km/h; possibility to collect data from different locations without additional costs if the devices are mounted on bicycles of a bike-sharing system or on private bicycles; cheapness. The main drawbacks are: lower accuracy than fixed, standard air quality sensors; need for calibration updates; exposure of the devices to physic shocks (e.g., holes and uneven ground), which can produce malfunction; sensibility of the sensors to atmospheric phenomena (e.g., ain, hailstorm, direct sunlight); risk of theft and vandalism. Therefore, the proposed mobile air quality monitoring system represents an effective solution for the integration of existing standard air quality monitoring systems. The low cost-per-device allow many nodes over the urban area to be deployed. Moreover, installing the devices on bicycles, these can be moved within the urban area without additional costs. Therefore, the proposed system is able to provide pervasive data distributed over the area of interest. However, the accuracy and precision of the obtained data is lower than standard monitoring systems, so the resulting system seems not suitable for a stand-alone application. Furthermore, the employed devices are exposed to many physical stresses and threads, such as impacts, humidity and thefts. During the tests some devices were damaged, so waterproof boxes have been used to protect the most sensitive sensors and amortized struts have been introduced to avoid intense shakes. Hence, specific protection mechanisms must be considered during the design of the system.
4. THE SMART SPATIAL DATA INFRASTRUCTURE
4.1. Standard data models, ontologies and the SDI project
Following the considerations in the introductive chapters, the project of the SDI started from the analysis of the existing standards and data model useful to manage the project’s data. Some thematic features linked to the air pollutant monitoring can be represented by the SWEET ontology (Semantic Web for Earth
and Environmental Terminology). It is developed by the NASA (National Aeronautics and Space Administration) for the representation of Earth and Environmental Sciences (EES) (Di Giuseppe, 2014). Similar concepts are included in the INSPIRE data model (http://inspire.ec.europa.eu/index.cfm/pageid/2 /list /datamodels). INSPIRE (Infrastructure for Spatial Information in the European Community) is a Directive of the European Parliament (Directive 2007/2/EC) and of the Council (14 March 2007) establishing an infrastructure for spatial information to support Community environmental policies, and policies or activities which may have an impact on the environment. It entered into force on the 15th May 2007 and is supposed to be fully implemented by 2019 (http://inspire.ec. europa.eu). A part of the Directive data model explicitly concerns the Environmental monitoring (Annex III – EF – Environmental monitoring Facilities). Nevertheless, for the IDEM project it was important to manage urban data having a higher level of detail; for example, it was important to analyse if the vegetation (both entire areas or single tree) had some influence on the local air quality. For this reason, and because previous researches already used the same standard (Prandi et al. 2013, Soave et al., 2013) we considered the international industry OGC standard CityGML. It was developed to structure 3D multiscale urban maps, including most of elements of our interest (buildings, vegetation, land use, transports facilities). Moreover, CityGML presents a mechanism for being expanded, which permits to adapt the model to further application domains, the ADE (Application Domain Extension) mechanism. Some ADE examples are the CityGML noise ADE or similar ones developed in other projects (e.g. http://www.iscopeproject.net/) (Protić, 2014, Patti et al., 2013). Anyway, in further improvements and developments it would be useful to develop a model which considers both the presented ADE and the complex schema given by INSPIRE regarding the Environmental Monitoring Facilities, merging them in a unique frame to manage such data. 4.2. CityGML AQADE (air quality ADE)
The CityGML AQADE is inserted in various CityGML modules, which have to be extended for being characterised by the air quality values near them. Analysing the monitored data in association with their geographic and spatial position in the 3D city model and further parameters (such as traffic at the moment of the survey, building usage, heating periods and so on) it could be possible to define what are the main sources of air quality pollution and what are the main affected objects. This information can be stored in the model itself providing a base for some kind of decision by administrators, operators, researchers or simple citizens. Figure 5 shows a synthesis of the final model. The application field has been analysed and the needed entities and attributes have been selected starting from the available literature (Janhäll, 2015, Leung, 2011, Nowak, 2002, Bukowiecki et al., 2010).
Figure 5: The general UML schema of the CityGML AQADE.
ISPRS Annals of the Photogrammetry, Remote Sensing and Spatial Information Sciences, Volume IV-4/W1, 2016 1st International Conference on Smart Data and Smart Cities, 30th UDMS, 7–9 September 2016, Split, Croatia
This contribution has been peer-reviewed. The double-blind peer-review was conducted on the basis of the full paper. doi:10.5194/isprs-annals-IV-4-W1-67-2016
70
Some specific tools were used in order to implement it. For the first modelling phase in UML (Unified Modeling Language) the Sparx Systems software Enterprise Architect was used. This software, notwithstanding its proprietary nature, is recommended by the same standards documents (for example in the INSPIRE practises). It implements some of the useful tools and plugins for managing the conceptual standard schemas and translating them in interoperable formats (XSD schemas, OWL formats, etc.). The CityGML models were modified using Enterprise Architect, and were exported as a GML schema (XSD – XML schema definition) which can be used to structure the data in compliance with the W3C recommendations. In this way, even if the translation still needs some improvement through the setting files or the manual editing of the output XSD, a useful open and machine-readable structure is generated. 4.3. The model implementation in GIS
Once the data structure is defined, it is possible to manage the data using different strategies. In particular, two alternatives can be considered. The first one is to use GML in order to represent and share the data; this can offer the advantage to maintain the object-oriented structure of the GML models and not to lose definition in the data complexity and interconnection. On the other hand, the tools to manage and analyse dynamic data in GML are still in a development phase, and the so-structured datasets could result computationally heavy. Moreover, the available open platforms to share geographic data on the web often do not include the possibility to manage data in GML. For this reason, a second strategy has been chosen: the translation of the model in an SQL database. The passage to an object-relational model permits to manage in an easier way the data, maintaining some important relations. The fundamental advantage is that a so-structured database can be shared by exchanging the SQL statement generated by a further software (ALTOVA XMLSpy) from the XSD file. The produced datasets can be therefore homogeneous and could constitute a unique knowledge repository to be analysed and inferred. For the management of the produced database PostgreSQL-PostGIS was used, and QGIS was used as a GIS software tool as a support for both a graphical interface and analysis tools. 4.4. The GIS: some results and analysis
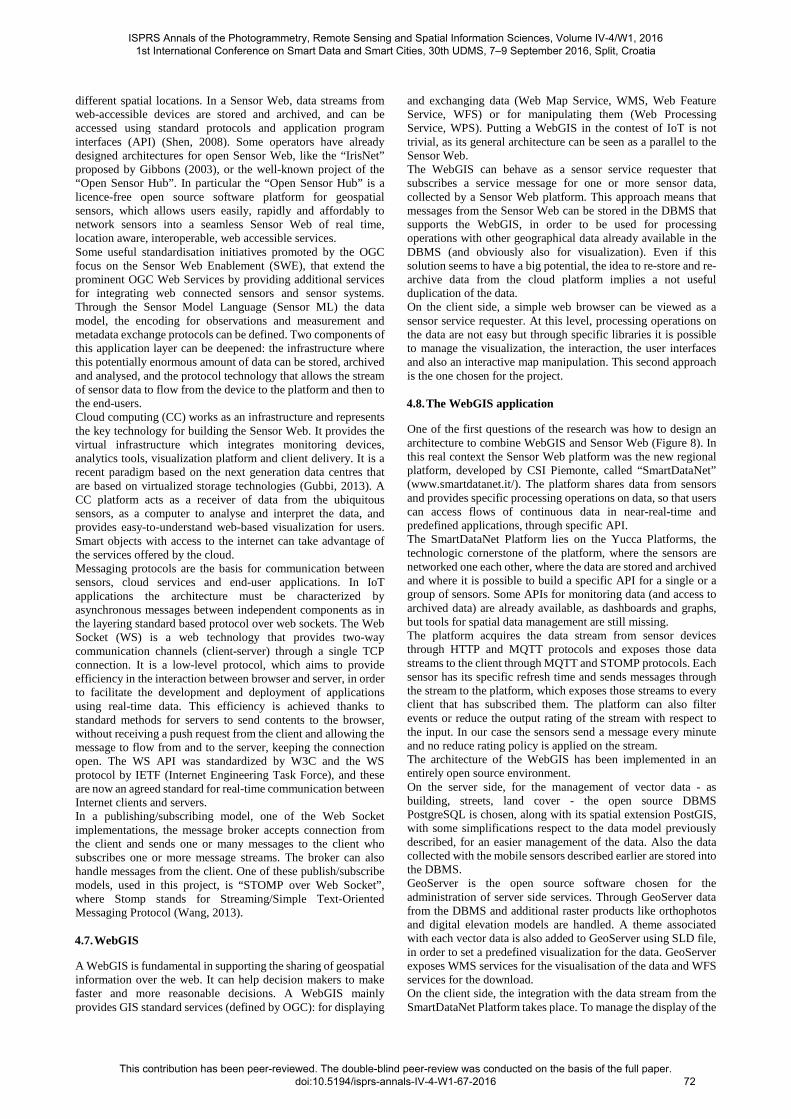
The generated tables can be managed, visualized and analysed in GIS for obtaining useful information (Figures 6-7).
Figure 6: GIS layout showing an example of possible spatial analysis of dynamic data in the area of the Politecnico in Turin: the average of the values measured in a 50 m buffer of a buildings can be calculated and associated to the selected building.
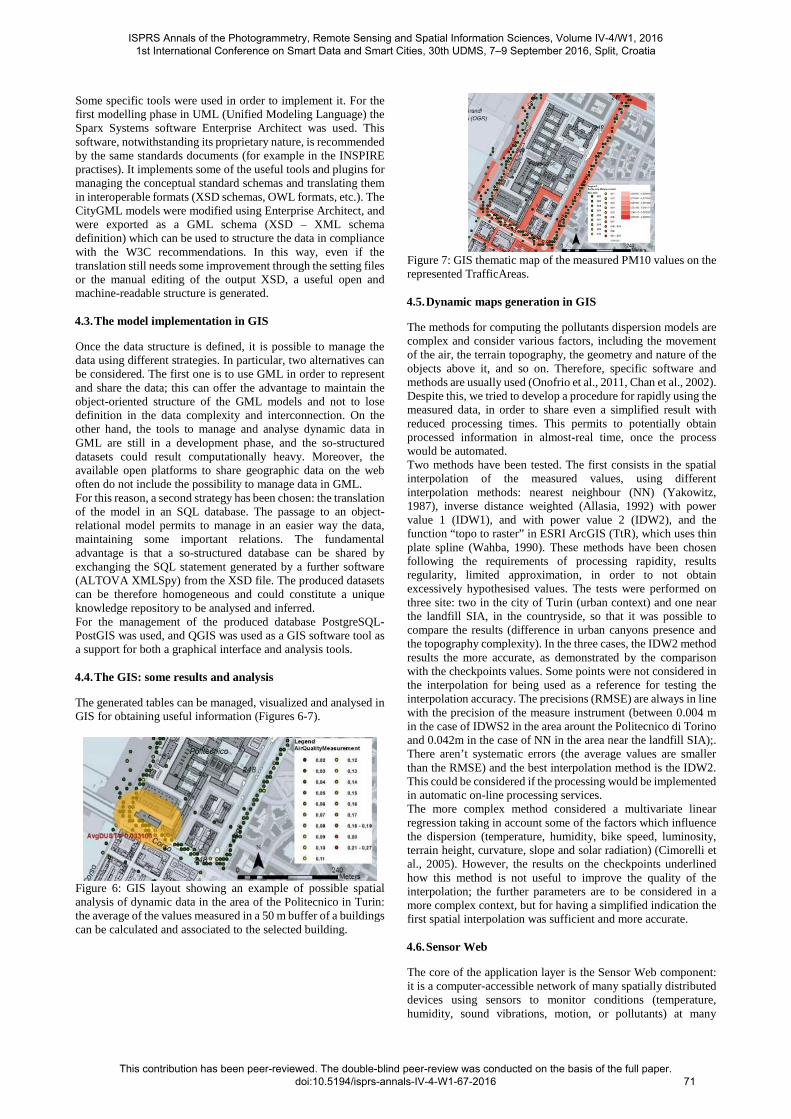
Figure 7: GIS thematic map of the measured PM10 values on the represented TrafficAreas.
4.5. Dynamic maps generation in GIS
The methods for computing the pollutants dispersion models are complex and consider various factors, including the movement of the air, the terrain topography, the geometry and nature of the objects above it, and so on. Therefore, specific software and methods are usually used (Onofrio et al., 2011, Chan et al., 2002). Despite this, we tried to develop a procedure for rapidly using the measured data, in order to share even a simplified result with reduced processing times. This permits to potentially obtain processed information in almost-real time, once the process would be automated. Two methods have been tested. The first consists in the spatial interpolation of the measured values, using different interpolation methods: nearest neighbour (NN) (Yakowitz, 1987), inverse distance weighted (Allasia, 1992) with power value 1 (IDW1), and with power value 2 (IDW2), and the function “topo to raster” in ESRI ArcGIS (TtR), which uses thin plate spline (Wahba, 1990). These methods have been chosen following the requirements of processing rapidity, results regularity, limited approximation, in order to not obtain excessively hypothesised values. The tests were performed on three site: two in the city of Turin (urban context) and one near the landfill SIA, in the countryside, so that it was possible to compare the results (difference in urban canyons presence and the topography complexity). In the three cases, the IDW2 method results the more accurate, as demonstrated by the comparison with the checkpoints values. Some points were not considered in the interpolation for being used as a reference for testing the interpolation accuracy. The precisions (RMSE) are always in line with the precision of the measure instrument (between 0.004 m in the case of IDWS2 in the area arount the Politecnico di Torino and 0.042m in the case of NN in the area near the landfill SIA);. There aren’t systematic errors (the average values are smaller than the RMSE) and the best interpolation method is the IDW2. This could be considered if the processing would be implemented in automatic on-line processing services. The more complex method considered a multivariate linear regression taking in account some of the factors which influence the dispersion (temperature, humidity, bike speed, luminosity, terrain height, curvature, slope and solar radiation) (Cimorelli et al., 2005). However, the results on the checkpoints underlined how this method is not useful to improve the quality of the interpolation; the further parameters are to be considered in a more complex context, but for having a simplified indication the first spatial interpolation was sufficient and more accurate. 4.6. Sensor Web
The core of the application layer is the Sensor Web component: it is a computer-accessible network of many spatially distributed devices using sensors to monitor conditions (temperature, humidity, sound vibrations, motion, or pollutants) at many
ISPRS Annals of the Photogrammetry, Remote Sensing and Spatial Information Sciences, Volume IV-4/W1, 2016 1st International Conference on Smart Data and Smart Cities, 30th UDMS, 7–9 September 2016, Split, Croatia
This contribution has been peer-reviewed. The double-blind peer-review was conducted on the basis of the full paper. doi:10.5194/isprs-annals-IV-4-W1-67-2016
71
different spatial locations. In a Sensor Web, data streams from web-accessible devices are stored and archived, and can be accessed using standard protocols and application program interfaces (API) (Shen, 2008). Some operators have already designed architectures for open Sensor Web, like the “IrisNet” proposed by Gibbons (2003), or the well-known project of the “Open Sensor Hub”. In particular the “Open Sensor Hub” is a licence-free open source software platform for geospatial sensors, which allows users easily, rapidly and affordably to network sensors into a seamless Sensor Web of real time, location aware, interoperable, web accessible services. Some useful standardisation initiatives promoted by the OGC focus on the Sensor Web Enablement (SWE), that extend the prominent OGC Web Services by providing additional services for integrating web connected sensors and sensor systems. Through the Sensor Model Language (Sensor ML) the data model, the encoding for observations and measurement and metadata exchange protocols can be defined. Two components of this application layer can be deepened: the infrastructure where this potentially enormous amount of data can be stored, archived and analysed, and the protocol technology that allows the stream of sensor data to flow from the device to the platform and then to the end-users. Cloud computing (CC) works as an infrastructure and represents the key technology for building the Sensor Web. It provides the virtual infrastructure which integrates monitoring devices, analytics tools, visualization platform and client delivery. It is a recent paradigm based on the next generation data centres that are based on virtualized storage technologies (Gubbi, 2013). A CC platform acts as a receiver of data from the ubiquitous sensors, as a computer to analyse and interpret the data, and provides easy-to-understand web-based visualization for users. Smart objects with access to the internet can take advantage of the services offered by the cloud. Messaging protocols are the basis for communication between sensors, cloud services and end-user applications. In IoT applications the architecture must be characterized by asynchronous messages between independent components as in the layering standard based protocol over web sockets. The Web Socket (WS) is a web technology that provides two-way communication channels (client-server) through a single TCP connection. It is a low-level protocol, which aims to provide efficiency in the interaction between browser and server, in order to facilitate the development and deployment of applications using real-time data. This efficiency is achieved thanks to standard methods for servers to send contents to the browser, without receiving a push request from the client and allowing the message to flow from and to the server, keeping the connection open. The WS API was standardized by W3C and the WS protocol by IETF (Internet Engineering Task Force), and these are now an agreed standard for real-time communication between Internet clients and servers. In a publishing/subscribing model, one of the Web Socket implementations, the message broker accepts connection from the client and sends one or many messages to the client who subscribes one or more message streams. The broker can also handle messages from the client. One of these publish/subscribe models, used in this project, is “STOMP over Web Socket”, where Stomp stands for Streaming/Simple Text-Oriented Messaging Protocol (Wang, 2013). 4.7. WebGIS
A WebGIS is fundamental in supporting the sharing of geospatial information over the web. It can help decision makers to make faster and more reasonable decisions. A WebGIS mainly provides GIS standard services (defined by OGC): for displaying
and exchanging data (Web Map Service, WMS, Web Feature Service, WFS) or for manipulating them (Web Processing Service, WPS). Putting a WebGIS in the contest of IoT is not trivial, as its general architecture can be seen as a parallel to the Sensor Web. The WebGIS can behave as a sensor service requester that subscribes a service message for one or more sensor data, collected by a Sensor Web platform. This approach means that messages from the Sensor Web can be stored in the DBMS that supports the WebGIS, in order to be used for processing operations with other geographical data already available in the DBMS (and obviously also for visualization). Even if this solution seems to have a big potential, the idea to re-store and re-archive data from the cloud platform implies a not useful duplication of the data. On the client side, a simple web browser can be viewed as a sensor service requester. At this level, processing operations on the data are not easy but through specific libraries it is possible to manage the visualization, the interaction, the user interfaces and also an interactive map manipulation. This second approach is the one chosen for the project. 4.8. The WebGIS application
One of the first questions of the research was how to design an architecture to combine WebGIS and Sensor Web (Figure 8). In this real context the Sensor Web platform was the new regional platform, developed by CSI Piemonte, called “SmartDataNet” (www.smartdatanet.it/). The platform shares data from sensors and provides specific processing operations on data, so that users can access flows of continuous data in near-real-time and predefined applications, through specific API. The SmartDataNet Platform lies on the Yucca Platforms, the technologic cornerstone of the platform, where the sensors are networked one each other, where the data are stored and archived and where it is possible to build a specific API for a single or a group of sensors. Some APIs for monitoring data (and access to archived data) are already available, as dashboards and graphs, but tools for spatial data management are still missing. The platform acquires the data stream from sensor devices through HTTP and MQTT protocols and exposes those data streams to the client through MQTT and STOMP protocols. Each sensor has its specific refresh time and sends messages through the stream to the platform, which exposes those streams to every client that has subscribed them. The platform can also filter events or reduce the output rating of the stream with respect to the input. In our case the sensors send a message every minute and no reduce rating policy is applied on the stream. The architecture of the WebGIS has been implemented in an entirely open source environment. On the server side, for the management of vector data - as building, streets, land cover - the open source DBMS PostgreSQL is chosen, along with its spatial extension PostGIS, with some simplifications respect to the data model previously described, for an easier management of the data. Also the data collected with the mobile sensors described earlier are stored into the DBMS. GeoServer is the open source software chosen for the administration of server side services. Through GeoServer data from the DBMS and additional raster products like orthophotos and digital elevation models are handled. A theme associated with each vector data is also added to GeoServer using SLD file, in order to set a predefined visualization for the data. GeoServer exposes WMS services for the visualisation of the data and WFS services for the download. On the client side, the integration with the data stream from the SmartDataNet Platform takes place. To manage the display of the
ISPRS Annals of the Photogrammetry, Remote Sensing and Spatial Information Sciences, Volume IV-4/W1, 2016 1st International Conference on Smart Data and Smart Cities, 30th UDMS, 7–9 September 2016, Split, Croatia
This contribution has been peer-reviewed. The double-blind peer-review was conducted on the basis of the full paper. doi:10.5194/isprs-annals-IV-4-W1-67-2016
72
geographic data within an HTML page the open source library LeafLet.js is chosen, through which GeoServer WMS and WFS are invoked.
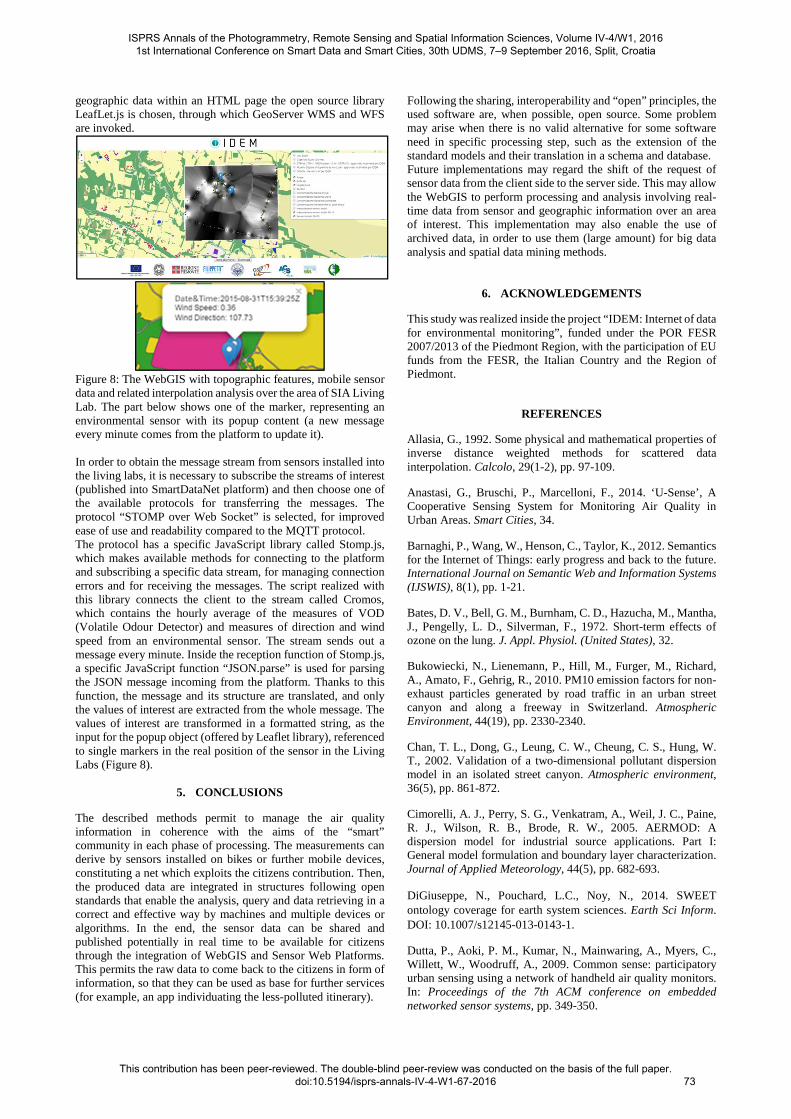
Figure 8: The WebGIS with topographic features, mobile sensor data and related interpolation analysis over the area of SIA Living Lab. The part below shows one of the marker, representing an environmental sensor with its popup content (a new message every minute comes from the platform to update it). In order to obtain the message stream from sensors installed into the living labs, it is necessary to subscribe the streams of interest (published into SmartDataNet platform) and then choose one of the available protocols for transferring the messages. The protocol “STOMP over Web Socket” is selected, for improved ease of use and readability compared to the MQTT protocol. The protocol has a specific JavaScript library called Stomp.js, which makes available methods for connecting to the platform and subscribing a specific data stream, for managing connection errors and for receiving the messages. The script realized with this library connects the client to the stream called Cromos, which contains the hourly average of the measures of VOD (Volatile Odour Detector) and measures of direction and wind speed from an environmental sensor. The stream sends out a message every minute. Inside the reception function of Stomp.js, a specific JavaScript function “JSON.parse” is used for parsing the JSON message incoming from the platform. Thanks to this function, the message and its structure are translated, and only the values of interest are extracted from the whole message. The values of interest are transformed in a formatted string, as the input for the popup object (offered by Leaflet library), referenced to single markers in the real position of the sensor in the Living Labs (Figure 8).
5. CONCLUSIONS
The described methods permit to manage the air quality information in coherence with the aims of the “smart” community in each phase of processing. The measurements can derive by sensors installed on bikes or further mobile devices, constituting a net which exploits the citizens contribution. Then, the produced data are integrated in structures following open standards that enable the analysis, query and data retrieving in a correct and effective way by machines and multiple devices or algorithms. In the end, the sensor data can be shared and published potentially in real time to be available for citizens through the integration of WebGIS and Sensor Web Platforms. This permits the raw data to come back to the citizens in form of information, so that they can be used as base for further services (for example, an app individuating the less-polluted itinerary).
Following the sharing, interoperability and “open” principles, the used software are, when possible, open source. Some problem may arise when there is no valid alternative for some software need in specific processing step, such as the extension of the standard models and their translation in a schema and database. Future implementations may regard the shift of the request of sensor data from the client side to the server side. This may allow the WebGIS to perform processing and analysis involving real-time data from sensor and geographic information over an area of interest. This implementation may also enable the use of archived data, in order to use them (large amount) for big data analysis and spatial data mining methods.
6. ACKNOWLEDGEMENTS
This study was realized inside the project “IDEM: Internet of data for environmental monitoring”, funded under the POR FESR 2007/2013 of the Piedmont Region, with the participation of EU funds from the FESR, the Italian Country and the Region of Piedmont.
REFERENCES
Allasia, G., 1992. Some physical and mathematical properties of inverse distance weighted methods for scattered data interpolation. Calcolo, 29(1-2), pp. 97-109.
Anastasi, G., Bruschi, P., Marcelloni, F., 2014. ‘U-Sense’, A Cooperative Sensing System for Monitoring Air Quality in Urban Areas. Smart Cities, 34.
Barnaghi, P., Wang, W., Henson, C., Taylor, K., 2012. Semantics for the Internet of Things: early progress and back to the future. International Journal on Semantic Web and Information Systems (IJSWIS), 8(1), pp. 1-21.
Bates, D. V., Bell, G. M., Burnham, C. D., Hazucha, M., Mantha, J., Pengelly, L. D., Silverman, F., 1972. Short-term effects of ozone on the lung. J. Appl. Physiol. (United States), 32.
Bukowiecki, N., Lienemann, P., Hill, M., Furger, M., Richard, A., Amato, F., Gehrig, R., 2010. PM10 emission factors for non-exhaust particles generated by road traffic in an urban street canyon and along a freeway in Switzerland. Atmospheric Environment, 44(19), pp. 2330-2340.
Chan, T. L., Dong, G., Leung, C. W., Cheung, C. S., Hung, W. T., 2002. Validation of a two-dimensional pollutant dispersion model in an isolated street canyon. Atmospheric environment, 36(5), pp. 861-872.
Cimorelli, A. J., Perry, S. G., Venkatram, A., Weil, J. C., Paine, R. J., Wilson, R. B., Brode, R. W., 2005. AERMOD: A dispersion model for industrial source applications. Part I: General model formulation and boundary layer characterization. Journal of Applied Meteorology, 44(5), pp. 682-693.
DiGiuseppe, N., Pouchard, L.C., Noy, N., 2014. SWEET ontology coverage for earth system sciences. Earth Sci Inform. DOI: 10.1007/s12145-013-0143-1.
Dutta, P., Aoki, P. M., Kumar, N., Mainwaring, A., Myers, C., Willett, W., Woodruff, A., 2009. Common sense: participatory urban sensing using a network of handheld air quality monitors. In: Proceedings of the 7th ACM conference on embedded networked sensor systems, pp. 349-350.
ISPRS Annals of the Photogrammetry, Remote Sensing and Spatial Information Sciences, Volume IV-4/W1, 2016 1st International Conference on Smart Data and Smart Cities, 30th UDMS, 7–9 September 2016, Split, Croatia
This contribution has been peer-reviewed. The double-blind peer-review was conducted on the basis of the full paper. doi:10.5194/isprs-annals-IV-4-W1-67-2016
73
Eisenman, S. B., Miluzzo, E., Lane, N. D., Peterson, R. A., Ahn, G. S., Campbell, A. T., 2009. BikeNet: A mobile sensing system for cyclist experience mapping. ACM Transactions on Sensor Networks (TOSN), 6(1).
Fann, N., Lamson, A. D., Anenberg, S. C., Wesson, K., Risley, D., Hubbell, B. J., 2012. Estimating the national public health burden associated with exposure to ambient PM2. 5 and ozone. Risk analysis, 32(1), pp. 81-95.
Gerboles, M., 2012. Developments and Applications of Sensor Technologies for Ambient Air Monitoring. In: Workshop “Current and Future Air Quality Monitoring”. Barcelona, Spain.
Gibbons, P.B., Karp, B., Ke, Y., Nath, S., Seshan, S., 2003. IrisNet: An Architecture for a Worldwide Sensor Web. Journal of Pervasive Computing, 2(4), pp. 22-33.
Gubbi, J., Buyya, R., Marusic, S., Palaniswami, M., 2013. Internet of Things (IoT): a vision, architecture elements and future directions. Future Generation Computer Systems, 29, pp.1645-1660.
Hasenfratz, D., Saukh, O., Sturzenegger, S., Thiele, L., 2012. Participatory air pollution monitoring using smartphones. Mobile Sensing.
Hasenfratz, D., Saukh, O., Walser, C., Hueglin, C., Fierz, M., Arn, T., Beutel, J. Thiele, L., 2015. Deriving high-resolution urban air pollution maps using mobile sensor nodes. Pervasive and Mobile Computing, 16, pp. 268-285.
Janhäll, S., 2015. Review on urban vegetation and particle air pollution–Deposition and dispersion. Atmospheric Environment, 105, pp. 130-137.
Kheirbek, I., Wheeler, K., Walters, S., Kass, D., Matte, T., 2013. PM2. 5 and ozone health impacts and disparities in New York City: sensitivity to spatial and temporal resolution. Air Quality, Atmosphere & Health, 6(2), pp. 473-486.
Khedo, K. K., Perseedoss, R., Mungur, A., 2010. A wireless sensor network air pollution monitoring system. International Journal of Wireless & Mobile Networks. 2(2), pp. 31-45.
Kopetz, H., 2011. Design Principles for Distributed Embedded Applications. II edition, Real Time Systems Series, Springer US, pp. 307 – 323.
Leung, D. Y., Tsui, J. K., Chen, F., Yip, W. K., Vrijmoed, L. L., Liu, C. H., 2011. Effects of urban vegetation on urban air quality. Landscape Research, 36(2), pp. 173-188.
Lippmann, M., 1989. Health effects of ozone a critical review. Japca, 39(5), pp. 672-695.
Ma, Y., Richards, M., Ghanem, M., Guo, Y., Hassard, J., 2008. Air pollution monitoring and mining based on sensor grid in London. Sensors, 8(6), pp. 3601-3623.
Mansour, S., Nasser, N., Karim, L., Ali, A., 2014. Wireless Sensor Network-based air quality monitoring system. In: Computing, Networking and Communications (ICNC), 2014 International Conference on, IEEE, pp. 545-550
Nowak, D. J., 2002. The effects of urban trees on air quality. USDA Forest Service, Syracuse, NY. http://www. fs. fed. us/ne/syracuse/gif/trees. pdf.
Onofrio, M., Spataro, R., Botta, S., 2011. The role of a steel plant in north-west Italy to the local air concentrations of PCDD/Fs. Chemosphere, 82(5), pp.708-717.
Patti, D., De Amicis, R., Prandi, F., D’Hont, E., Rudolf, H., Elisei, P., Saghin, I., 2013. I-SCOPE: Smart Cities and Citizens. REAL CORP.
Pope III, C. A., Dockery, D. W., 1992. Acute health effects of PM10 pollution on symptomatic and asymptomatic children. American Review of Respiratory Disease, 145(5), pp. 1123-1128.
Postolache, O., Pereira, M., Girao, P. M. B. S., 2005. Smart Sensor Network for Air Quality Monitoring Applications. In: Instrumentation and Measurement Technology Conference, 2005. IMTC 2005. Proceedings of the IEEE, IEEE, 1, pp. 537-542.
Prandi, F., Soave, M., Dev, F., Andreolli, M., De Amicis, R., 2014. Services oriented smart city platform based on 3D city model visualization. ISPRS Ann. Photogramm. Remote Sens. Spat. Inf. Sci.
Prandi, F., De Amicis, R., Piffer, S., Soavea, M., Cadzowb, S., Boix, E. G., D’Hondt, E., 2013. Using CityGML to deploy smart-city services for urban ecosystems. International Archives of the Photogrammetry, Remote Sensing and Spatial Information Sciences, 4, W1.
Protić, D., Nestorov, I., Vučetić, I., 2014. 3D Urban Information Models in making a “smart city”–the i-SCOPE project case study. Geonauka, 2(3), pp. 12-16.
Rowley, J. E., 2007. The wisdom hierarchy: representations of the DIKW hierarchy. Journal of information science.
Shen, S., Cheng, X., Gong, P., 2008. Sensor Web Oriented Web-Based. In: GIS Web and Wireless Geographical Information Systems. Proceedings of 8th International Symposium, W2GIS 2008, Shanghai, China, December 11-12, 2008, LNCS 5373, pp. 86 - 95.
Soave, M., Devigili, F., Prandi, F., de Amicis, R., 2013. Visualization and analysis of CityGML dataset within a client sever infrastructure. In: Proceedings of the 18th International Conference on 3D Web Technology, pp. 215-215.
Spektor, D. M., Lippmann, M., Lioy, P. J., Thurston, G. D., Citak, K., James, D. J., Hayes, C., 1988. Effects of ambient ozone on respiratory function in active, normal children. American Review of Respiratory Disease, 137(2), pp. 313-320.
Tsujita, W., Ishida, H., Moriizumi, T., 2004. Dynamic gas sensor network for air pollution monitoring and its auto-calibration. In: Sensors, 2004. Proceedings of IEEE, IEEE, pp. 56-59.
Velasco A.; Ferrero R.; Gandino F.; Montrucchio B.; Rebaudengo M., 2015. On the design of distributed air quality monitoring systems. In: 11th International Conference of Computational Methods in Sciences and Engineering (ICCMSE 2015), Athens (Greece), 20-23 March 2015.
Wahba, G., 1990. Spline models for observational data, 59, Siam.
Wang, V., Salim, F., Moskovits, P. 2013. The Definitive Guide to HTML5 Websocket. I edition, Apress US, pp. 85-87.
Yakowitz, S., 1987. Nearest‐neighbour methods for time series analysis. Journal of time series analysis, 8(2), pp. 235-247.
ISPRS Annals of the Photogrammetry, Remote Sensing and Spatial Information Sciences, Volume IV-4/W1, 2016 1st International Conference on Smart Data and Smart Cities, 30th UDMS, 7–9 September 2016, Split, Croatia
This contribution has been peer-reviewed. The double-blind peer-review was conducted on the basis of the full paper. doi:10.5194/isprs-annals-IV-4-W1-67-2016
74


![ARTICLE IN PRESS - UBICOMP Ouluubicomp.oulu.fi/files/cc16.pdf · as smart cities, smart homes, smart grid, digital health, and au- tomated environmental pollution control [1,2]. In](https://img.pdfslide.us/doc/110x75/5f63f7224197ef1ff3249476/article-in-press-ubicomp-as-smart-cities-smart-homes-smart-grid-digital-health.jpg)


![Target Habits And Routines Acquirement [ THARA ] Programme](https://img.pdfslide.us/doc/110x75/56814333550346895dafa689/target-habits-and-routines-acquirement-thara-programme.jpg)

