Embed Size (px)
Citation preview
LOGO
An Application of THEOS Data for the Encroachment of Agriculture on Forest Reserve in the Phu Luang Wildlife Sanctuary, Loei Province
Rasamee Suwanwerakamtorn
Regional Centre for Geo-Informatics and Sp
ace Technology,
Northeast Thailand, Khon Kaen University
Background1.
2.
Description of the Study Area3.
Objective
4. Data sources
Regional Centre for Geo-Informatics and Space Technology, Khon Kaen University, Northeast Thailand
5. Methodology
6. Result and Discussions
Topics
Although the controlling and preventive measures
are enforced rigidly to minimize the encroachment
on forest reserves in Phu Luang wildlife sanctuary
(PWLS) which is one of a form of maintaining forest
area for wildlife habitat.
The forest area is still continuously encroached
upon due to a population around wildlife sanctuary
increase.
Background
Regional Centre for Geo-Informatics and Space Technology, Khon Kaen University, Northeast Thailand
To enhance the efficiency of the protection,
regeneration and utilization of forest resources, the
information about the change is still needed.
These include an inventory periodical monitoring
and the causes of changes.
With the advent of high resolution satellite data,
the updated and multi-temporal information to detect
the changes can be obtained.
Background
Regional Centre for Geo-Informatics and Space Technology, Khon Kaen University, Northeast Thailand
The purpose of this study is
to monitor the change for the
encroachment of agriculture on forest
reserve with the use of multi - temporal
satellite data.
Regional Centre for Geo-Informatics and Space Technology, Northeast Thailand
Objective
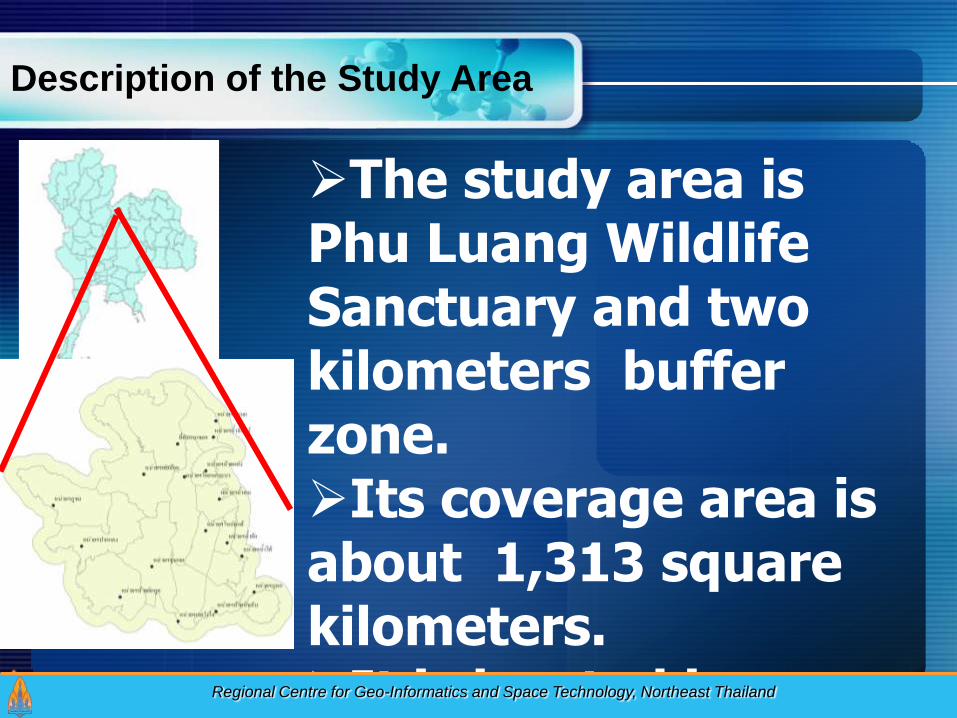
The study area is Phu Luang Wildlife Sanctuary and two kilometers buffer zone.Its coverage area is about 1,313 square kilometers.It is located in latitude 17
o3’ to 17
o
Regional Centre for Geo-Informatics and Space Technology, Northeast Thailand
Description of the Study Area
Description of the Study Area
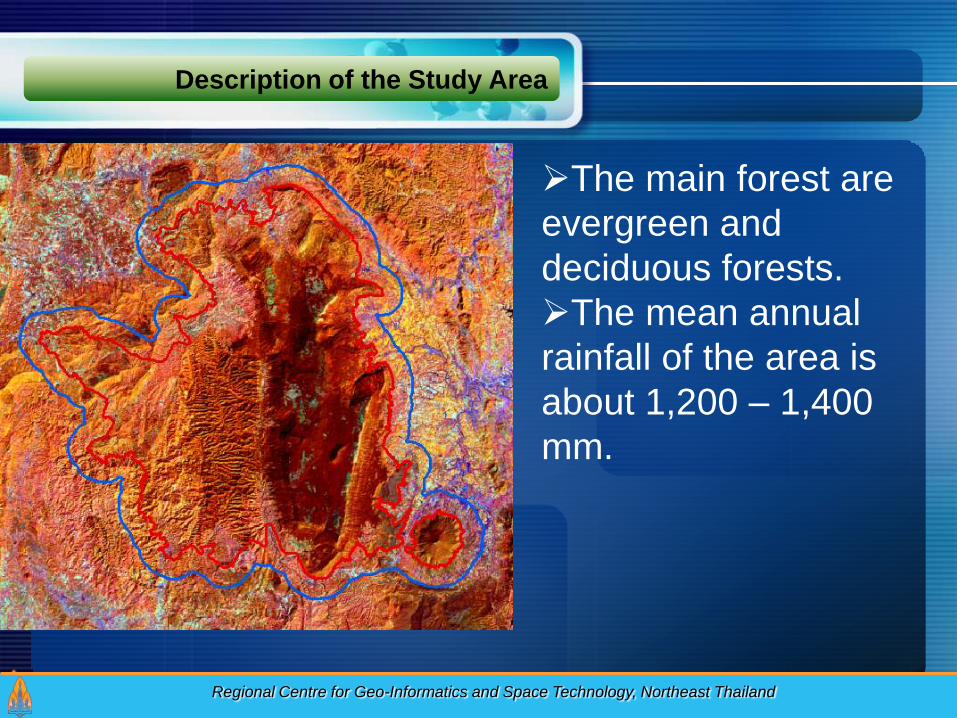
The main forest are
evergreen and
deciduous forests.
The mean annual
rainfall of the area is
about 1,200 – 1,400
mm.
Regional Centre for Geo-Informatics and Space Technology, Northeast Thailand
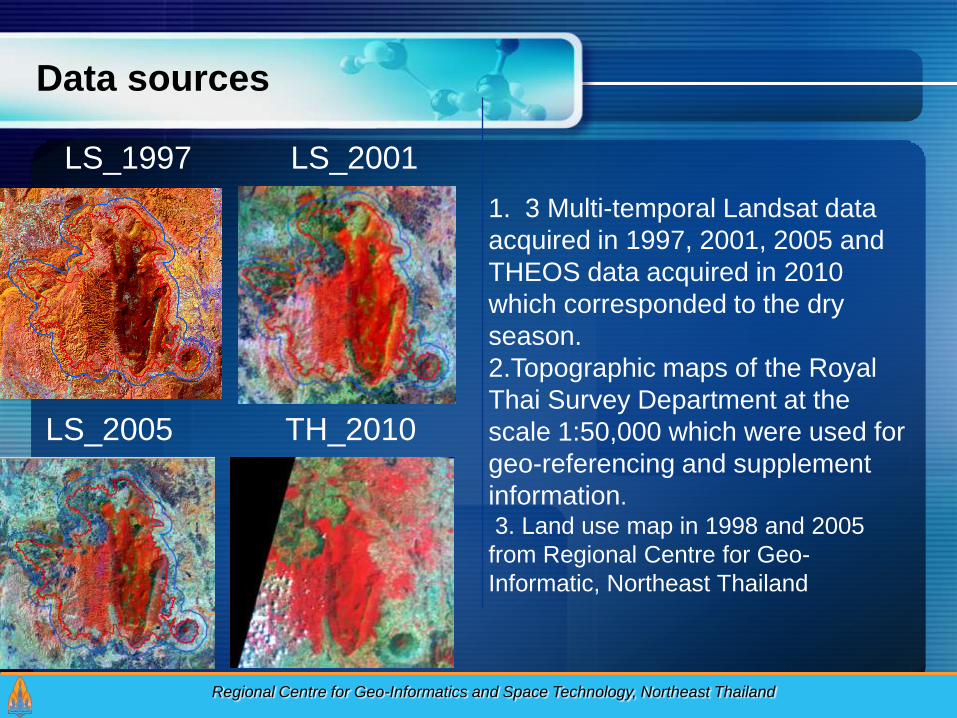
1. 3 Multi-temporal Landsat data
acquired in 1997, 2001, 2005 and
THEOS data acquired in 2010
which corresponded to the dry
season.
2.Topographic maps of the Royal
Thai Survey Department at the
scale 1:50,000 which were used for
geo-referencing and supplement
information.
3. Land use map in 1998 and 2005
from Regional Centre for Geo-
Informatic, Northeast Thailand
Regional Centre for Geo-Informatics and Space Technology, Northeast Thailand
Data sources
LS_1997
LS_2005
LS_2001
TH_2010
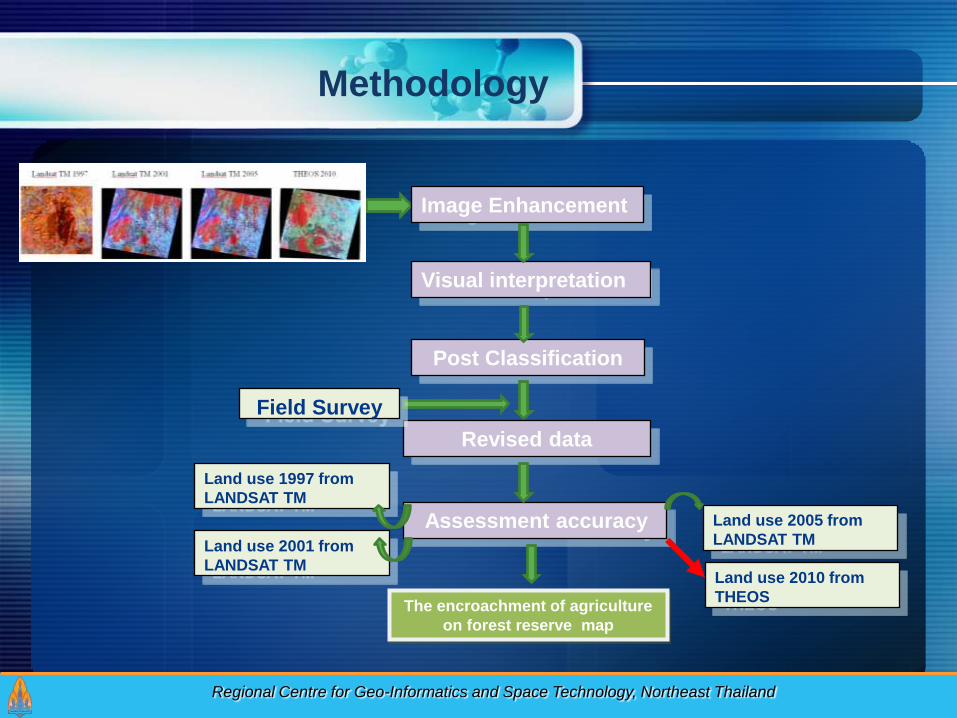
Methodology
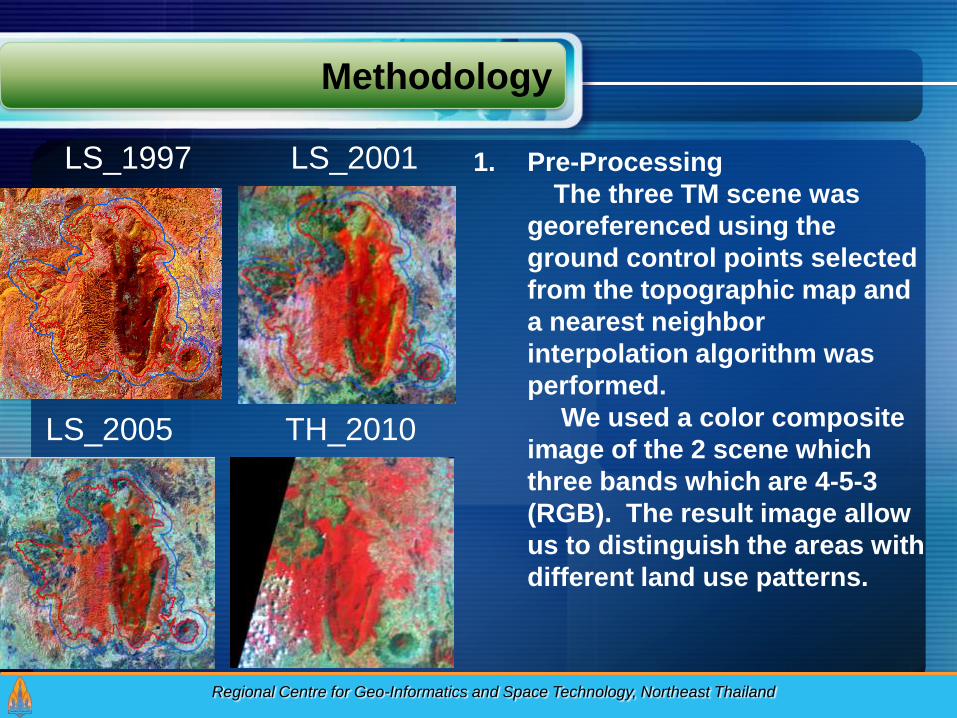
1. Pre-Processing
The three TM scene was
georeferenced using the
ground control points selected
from the topographic map and
a nearest neighbor
interpolation algorithm was
performed.
We used a color composite
image of the 2 scene which
three bands which are 4-5-3
(RGB). The result image allow
us to distinguish the areas with
different land use patterns.
Regional Centre for Geo-Informatics and Space Technology, Northeast Thailand
LS_1997
LS_2005
LS_2001
TH_2010
Methodology
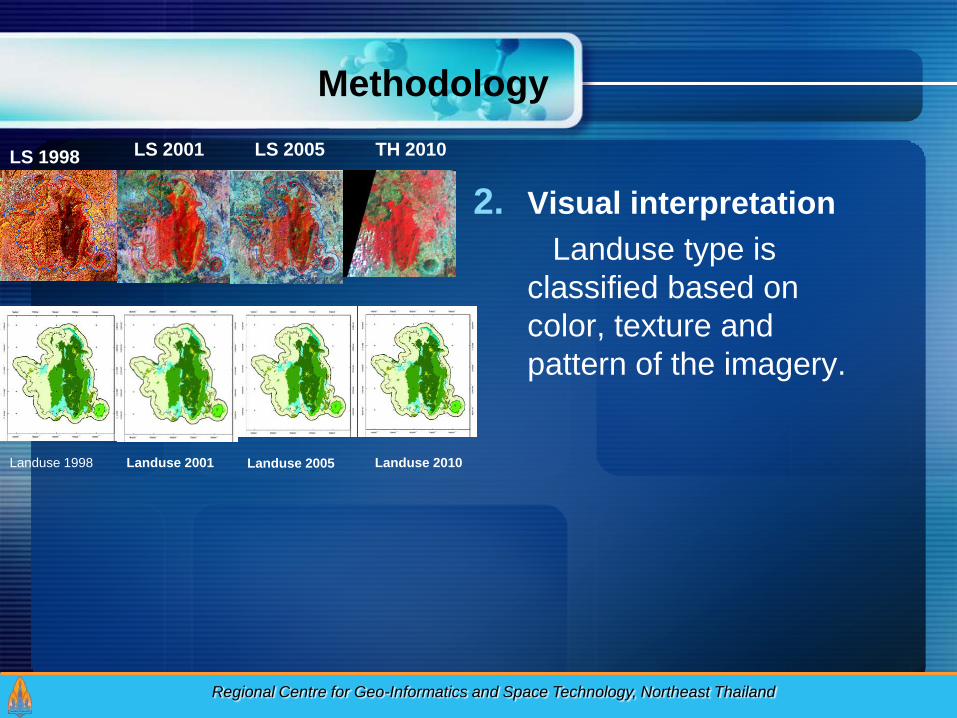
2. Visual interpretation
Landuse type is
classified based on
color, texture and
pattern of the imagery.
Regional Centre for Geo-Informatics and Space Technology, Northeast Thailand
Landuse 2001 Landuse 2005
LS 1998
Landuse 2010Landuse 1998
LS 2001 LS 2005 TH 2010
Methodology
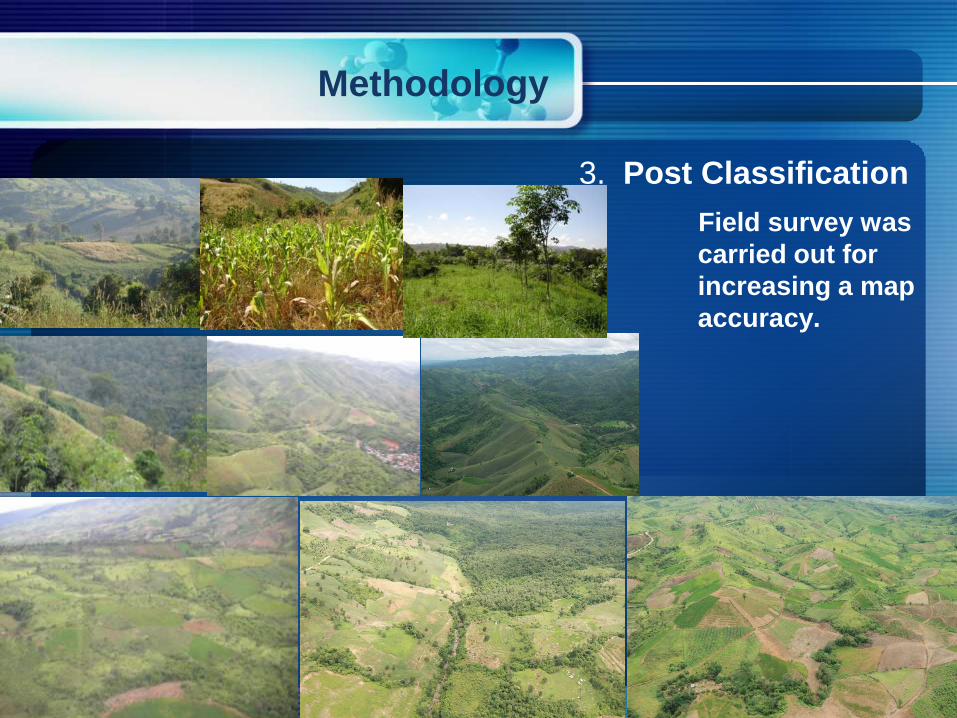
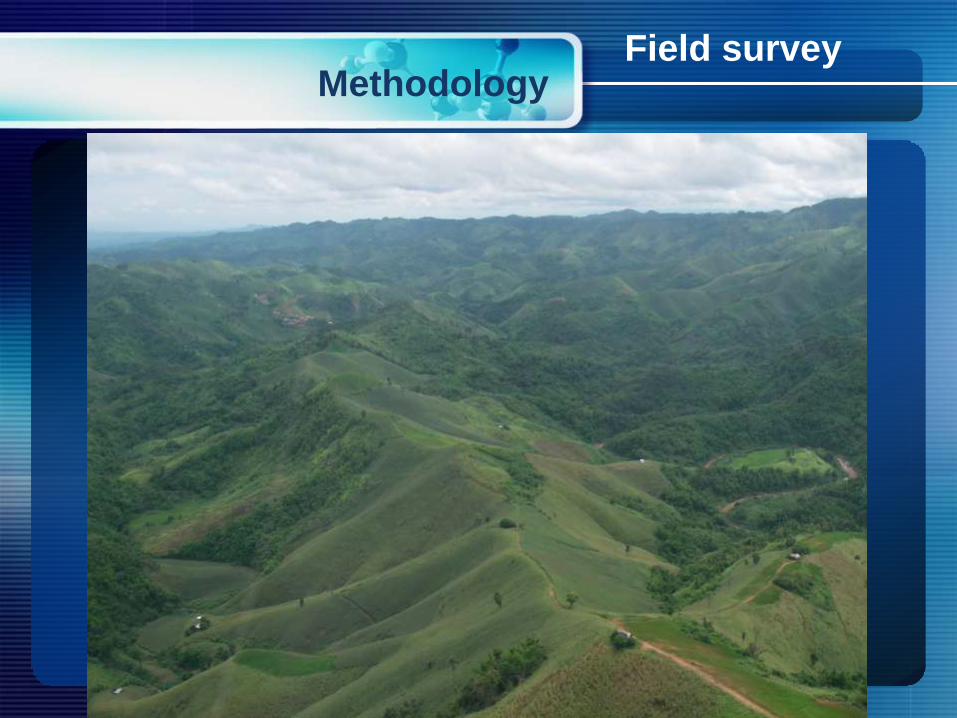
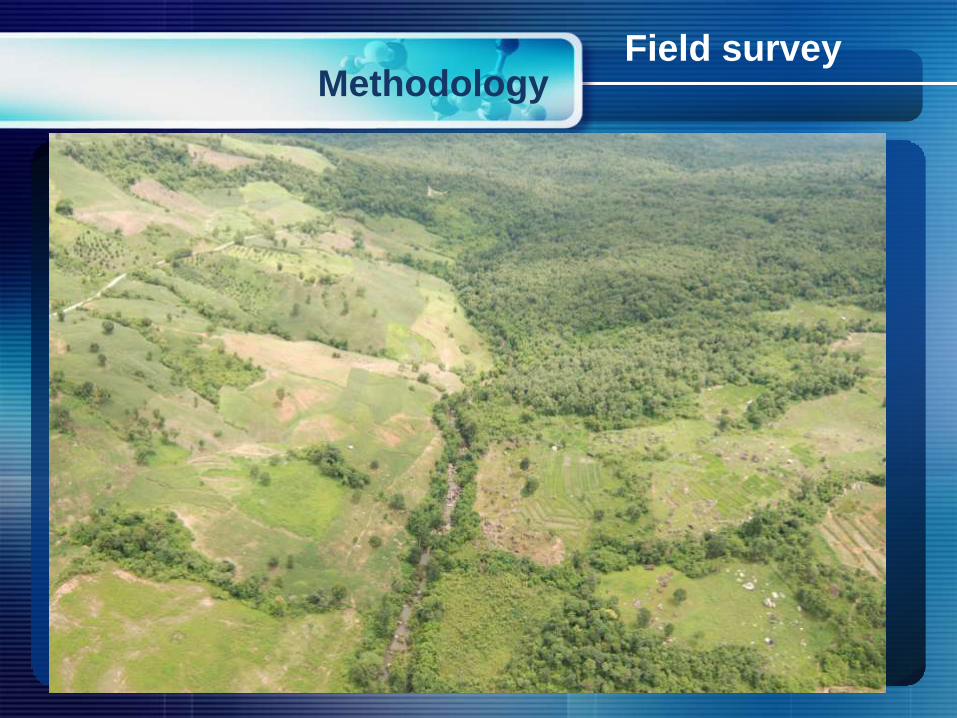
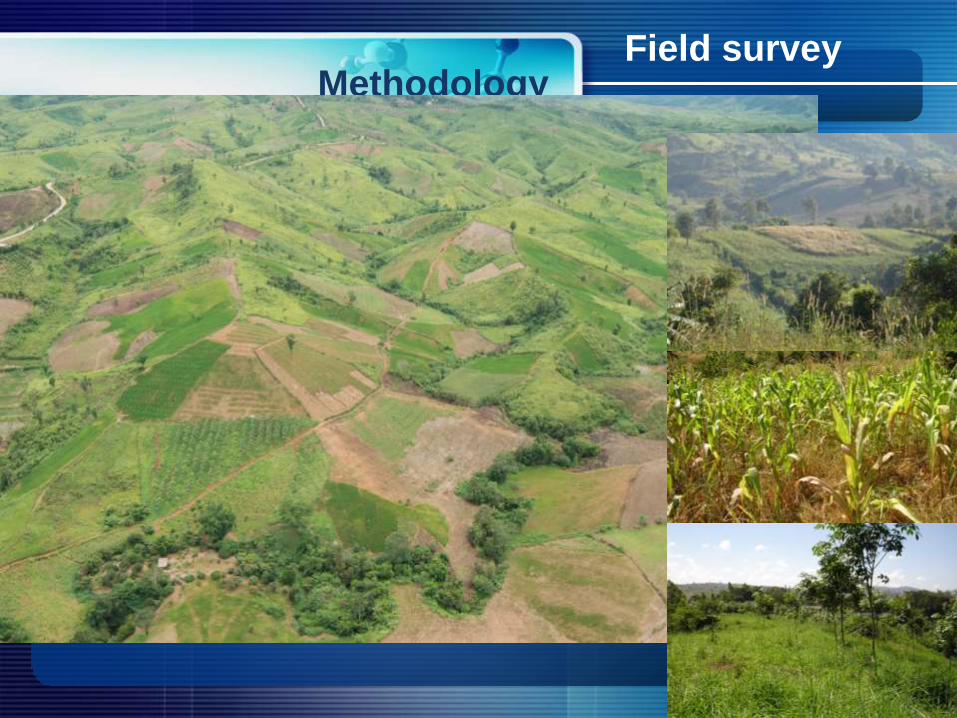
Field survey was
carried out for
increasing a map
accuracy.
3. Post Classification
MethodologyField survey
MethodologyField survey
MethodologyField survey
Methodology
Image Enhancement
Visual interpretation
Post Classification
Revised data
Land use 1997 from
LANDSAT TM
Assessment accuracy Land use 2005 from
LANDSAT TMLand use 2001 from
LANDSAT TM
The encroachment of agriculture
on forest reserve map
Field Survey
Regional Centre for Geo-Informatics and Space Technology, Northeast Thailand
Land use 2010 from
THEOS
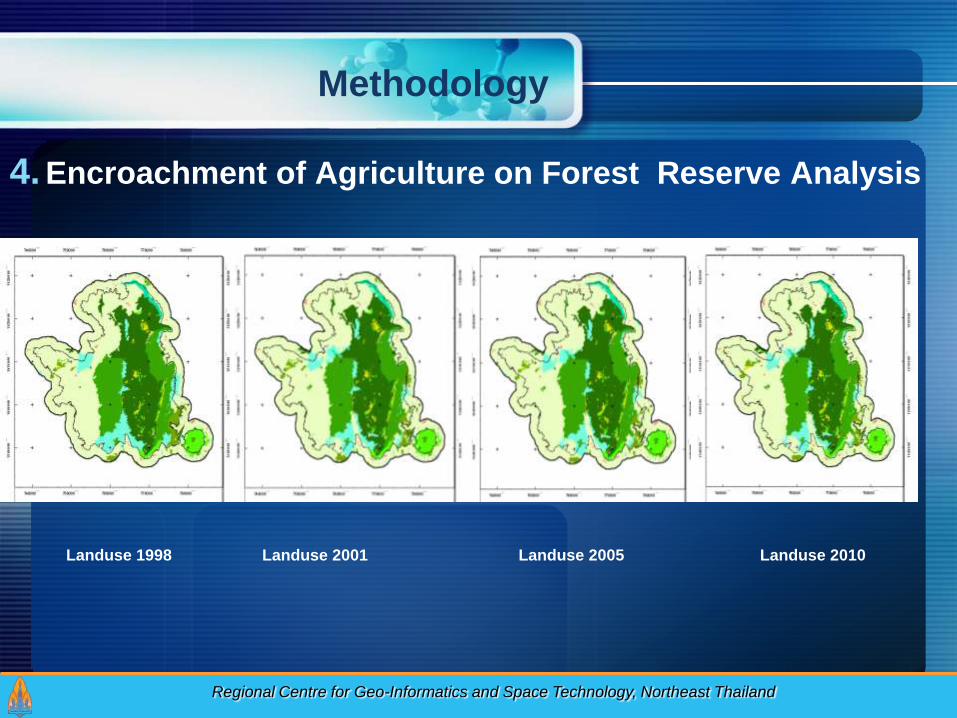
Methodology
4. Encroachment of Agriculture on Forest Reserve Analysis
Regional Centre for Geo-Informatics and Space Technology, Northeast Thailand
Landuse 2001 Landuse 2005 Landuse 2010Landuse 1998
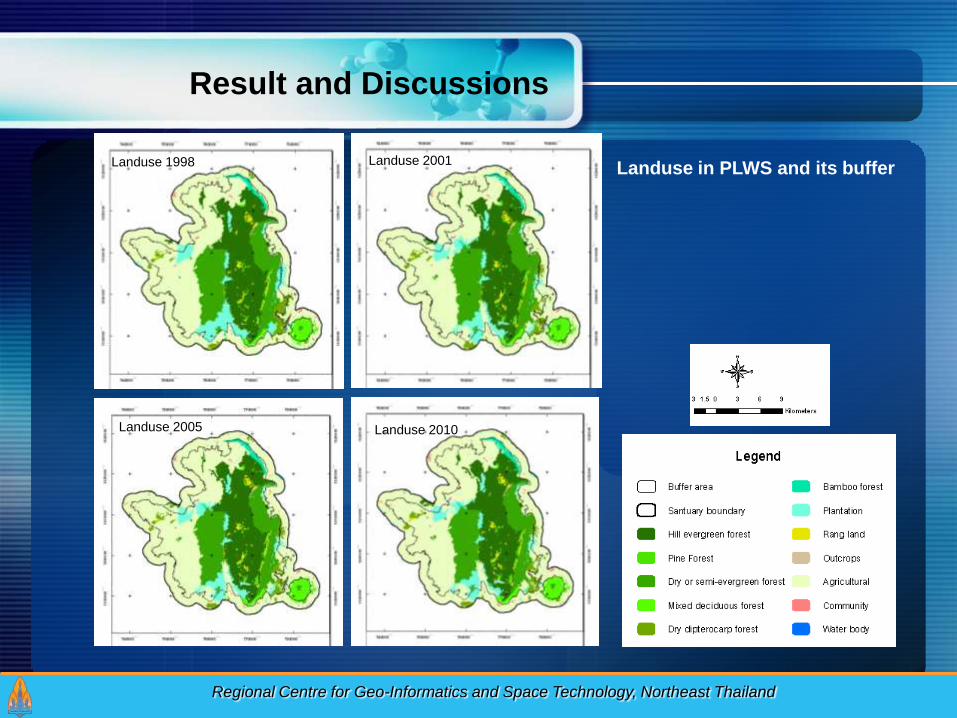
Result and Discussions
Landuse in PLWS and its buffer Landuse 2001
Landuse 2005
Landuse 1998
Landuse 2010
Regional Centre for Geo-Informatics and Space Technology, Northeast Thailand
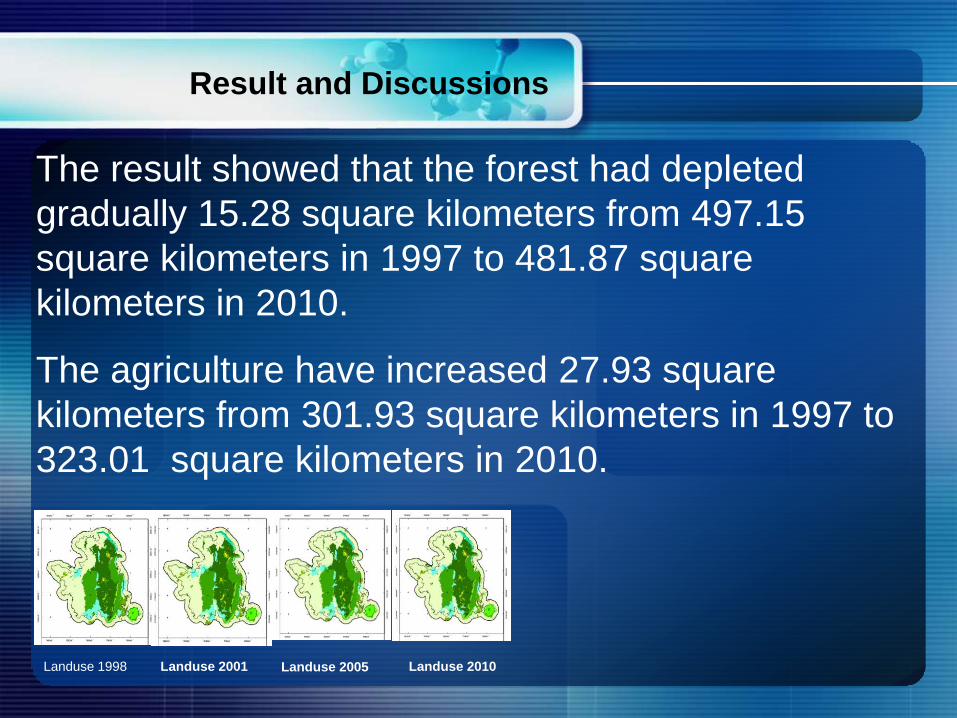
The result showed that the forest had depleted
gradually 15.28 square kilometers from 497.15
square kilometers in 1997 to 481.87 square
kilometers in 2010.
The agriculture have increased 27.93 square
kilometers from 301.93 square kilometers in 1997 to
323.01 square kilometers in 2010.
Landuse 2001 Landuse 2005 Landuse 2010Landuse 1998
Result and Discussions
Result and Discussions
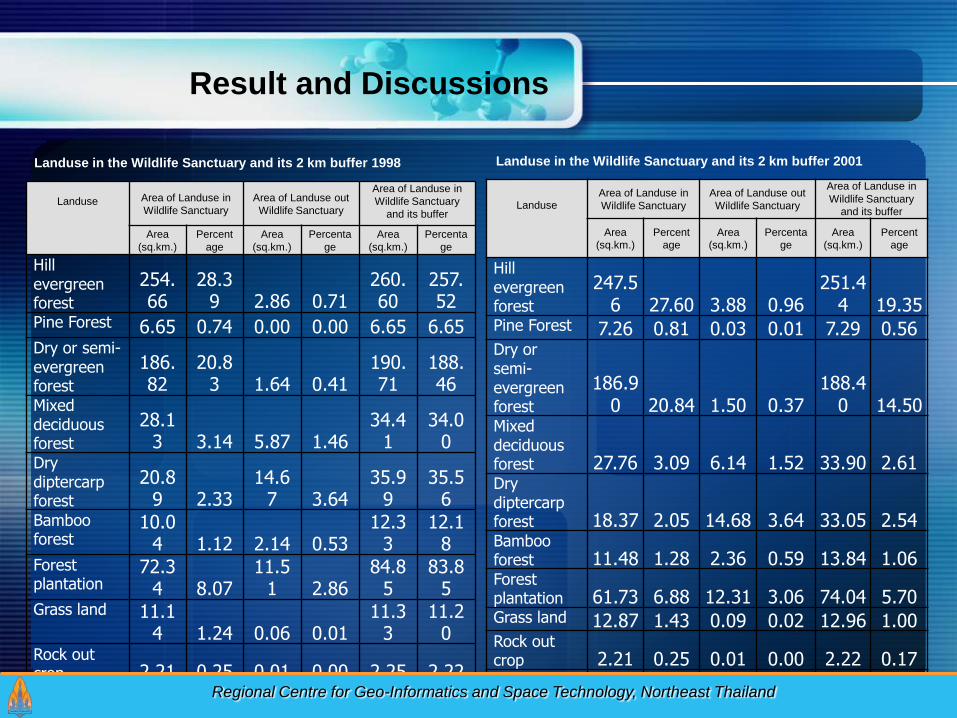
Landuse in the Wildlife Sanctuary and its 2 km buffer 1998
LanduseArea of Landuse in
Wildlife Sanctuary
Area of Landuse out
Wildlife Sanctuary
Area of Landuse in
Wildlife Sanctuary
and its buffer
Area
(sq.km.)
Percent
age
Area
(sq.km.)
Percenta
ge
Area
(sq.km.)
Percent
age
Hill evergreen forest
247.56 27.60 3.88 0.96
251.44 19.35
Pine Forest 7.26 0.81 0.03 0.01 7.29 0.56Dry or semi-evergreen forest
186.90 20.84 1.50 0.37
188.40 14.50
Mixed deciduous forest 27.76 3.09 6.14 1.52 33.90 2.61Dry diptercarp forest 18.37 2.05 14.68 3.64 33.05 2.54Bamboo forest 11.48 1.28 2.36 0.59 13.84 1.06Forest plantation 61.73 6.88 12.31 3.06 74.04 5.70Grass land 12.87 1.43 0.09 0.02 12.96 1.00Rock out crop 2.21 0.25 0.01 0.00 2.22 0.17Agricultural land
318.20 35.48
354.62 88.05
672.82 51.77
Urban and
Landuse in the Wildlife Sanctuary and its 2 km buffer 2001
Landuse Area of Landuse in
Wildlife Sanctuary
Area of Landuse out
Wildlife Sanctuary
Area of Landuse in
Wildlife Sanctuary
and its buffer
Area
(sq.km.)
Percent
age
Area
(sq.km.)
Percenta
ge
Area
(sq.km.)
Percenta
ge
Hill evergreen forest
254.66
28.39 2.86 0.71
260.60
257.52
Pine Forest 6.65 0.74 0.00 0.00 6.65 6.65Dry or semi-evergreen forest
186.82
20.83 1.64 0.41
190.71
188.46
Mixed deciduous forest
28.13 3.14 5.87 1.46
34.41
34.00
Dry diptercarp forest
20.89 2.33
14.67 3.64
35.99
35.56
Bamboo forest
10.04 1.12 2.14 0.53
12.33
12.18
Forest plantation
72.34 8.07
11.51 2.86
84.85
83.85
Grass land 11.14 1.24 0.06 0.01
11.33
11.20
Rock out crop 2.21 0.25 0.01 0.00 2.25 2.22Agricultural land
301.93
33.66
357.23
88.70
667.04
659.16
Regional Centre for Geo-Informatics and Space Technology, Northeast Thailand
Result and Discussions
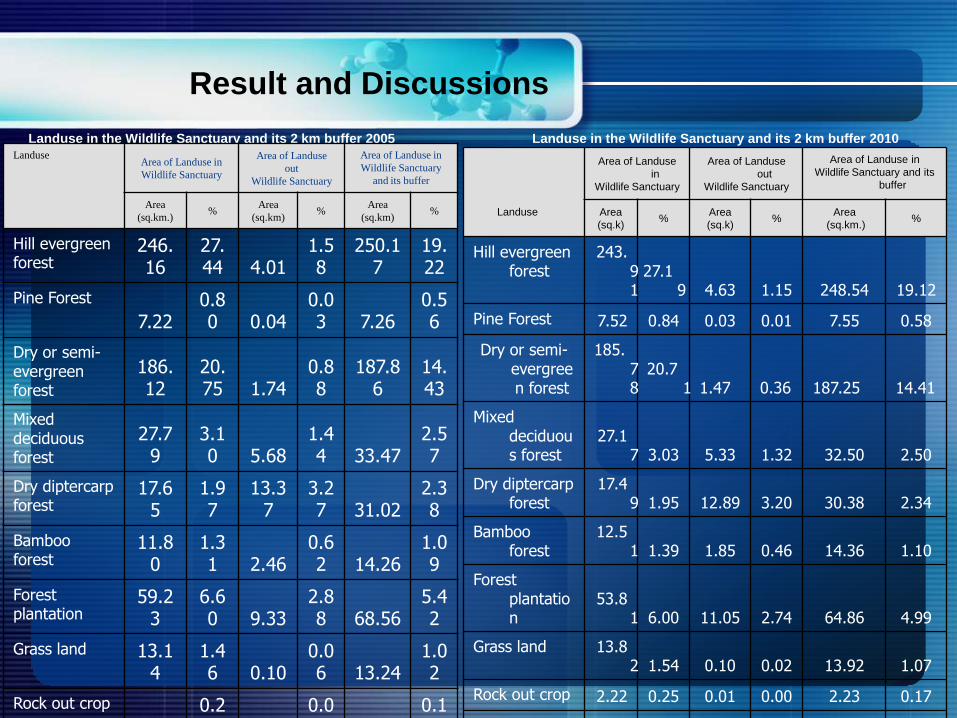
Landuse in the Wildlife Sanctuary and its 2 km buffer 2005
Landuse
Area of Landuse
in
Wildlife Sanctuary
Area of Landuse
out
Wildlife Sanctuary
Area of Landuse in
Wildlife Sanctuary and its
buffer
Area
(sq.k)%
Area
(sq.k)%
Area
(sq.km.)%
Hill evergreen forest
243.91
27.19 4.63 1.15 248.54 19.12
Pine Forest 7.52 0.84 0.03 0.01 7.55 0.58
Dry or semi-evergreen forest
185.78
20.71 1.47 0.36 187.25 14.41
Mixed deciduous forest
27.17 3.03 5.33 1.32 32.50 2.50
Dry diptercarp forest
17.49 1.95 12.89 3.20 30.38 2.34
Bamboo forest
12.51 1.39 1.85 0.46 14.36 1.10
Forest plantation
53.81 6.00 11.05 2.74 64.86 4.99
Grass land 13.82 1.54 0.10 0.02 13.92 1.07
Rock out crop 2.22 0.25 0.01 0.00 2.23 0.17
Agricultural 329.
Landuse in the Wildlife Sanctuary and its 2 km buffer 2010
LanduseArea of Landuse in
Wildlife Sanctuary
Area of Landuse
out
Wildlife Sanctuary
Area of Landuse in
Wildlife Sanctuary
and its buffer
Area
(sq.km.)%
Area
(sq.km)%
Area
(sq.km)%
Hill evergreen forest
246.16
27.44 4.01
1.58
250.17
19.22
Pine Forest
7.220.80 0.04
0.03 7.26
0.56
Dry or semi-evergreen forest
186.12
20.75 1.74
0.88
187.86
14.43
Mixed deciduous forest
27.79
3.10 5.68
1.44 33.47
2.57
Dry diptercarp forest
17.65
1.97
13.37
3.27 31.02
2.38
Bamboo forest
11.80
1.31 2.46
0.62 14.26
1.09
Forest plantation
59.23
6.60 9.33
2.88 68.56
5.42
Grass land 13.14
1.46 0.10
0.06 13.24
1.02
Rock out crop
2.210.25 0.01
0.01 2.22
0.17
Result and Discussions
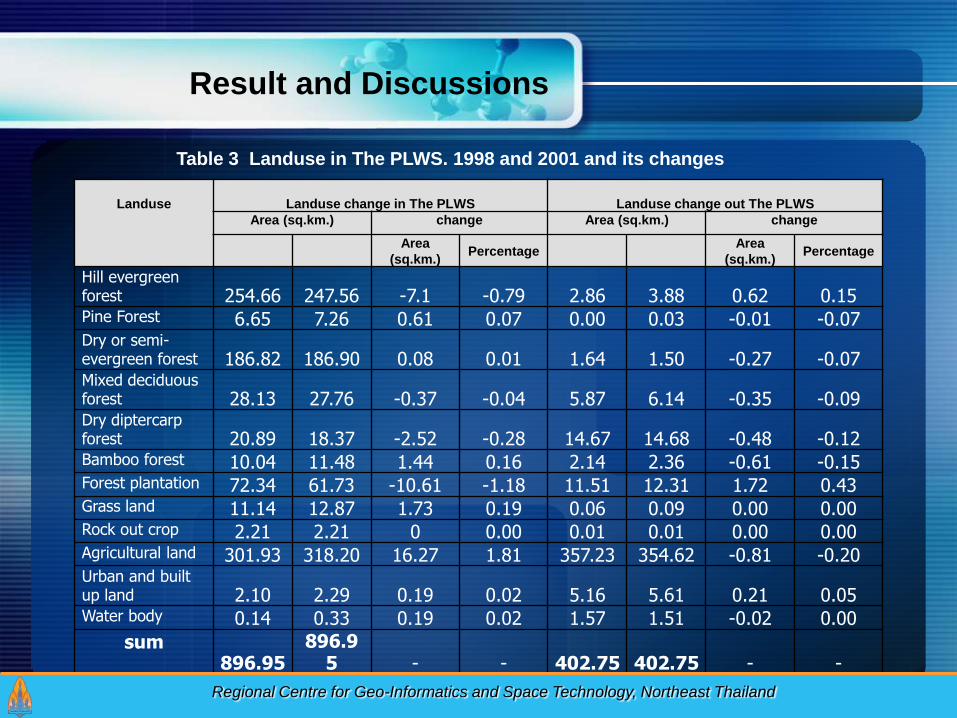
Table 3 Landuse in The PLWS. 1998 and 2001 and its changes
Landuse Landuse change in The PLWS Landuse change out The PLWS
Area (sq.km.) change Area (sq.km.) change
Area
(sq.km.)Percentage
Area
(sq.km.)Percentage
Hill evergreen forest 254.66 247.56 -7.1 -0.79 2.86 3.88 0.62 0.15Pine Forest 6.65 7.26 0.61 0.07 0.00 0.03 -0.01 -0.07Dry or semi-evergreen forest 186.82 186.90 0.08 0.01 1.64 1.50 -0.27 -0.07Mixed deciduous forest 28.13 27.76 -0.37 -0.04 5.87 6.14 -0.35 -0.09Dry diptercarp forest 20.89 18.37 -2.52 -0.28 14.67 14.68 -0.48 -0.12Bamboo forest 10.04 11.48 1.44 0.16 2.14 2.36 -0.61 -0.15Forest plantation 72.34 61.73 -10.61 -1.18 11.51 12.31 1.72 0.43Grass land 11.14 12.87 1.73 0.19 0.06 0.09 0.00 0.00Rock out crop 2.21 2.21 0 0.00 0.01 0.01 0.00 0.00Agricultural land 301.93 318.20 16.27 1.81 357.23 354.62 -0.81 -0.20Urban and built up land 2.10 2.29 0.19 0.02 5.16 5.61 0.21 0.05Water body 0.14 0.33 0.19 0.02 1.57 1.51 -0.02 0.00
sum896.95
896.95 - - 402.75 402.75 - -
Regional Centre for Geo-Informatics and Space Technology, Northeast Thailand
Result and Discussions
Landuse Landuse change in The PLWS Landuse change out The PLWS
Area (sq.km.) change Area (sq.km.) change
Area
(sq.km.)Percentage
Area
(sq.km.)Percentage
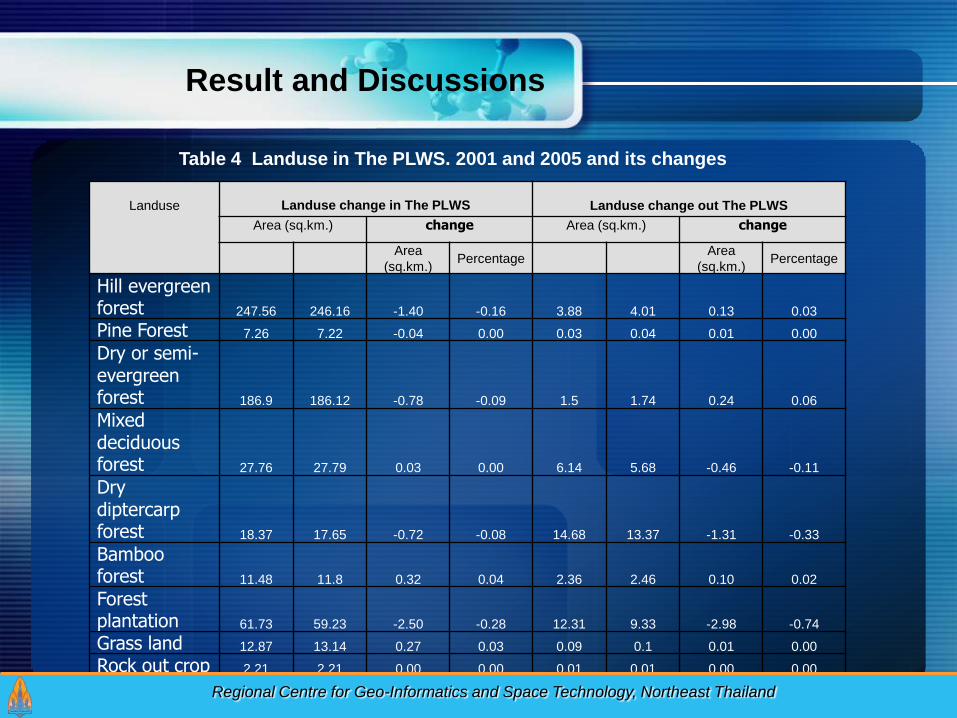
Hill evergreen forest 247.56 246.16 -1.40 -0.16 3.88 4.01 0.13 0.03
Pine Forest 7.26 7.22 -0.04 0.00 0.03 0.04 0.01 0.00
Dry or semi-evergreen forest 186.9 186.12 -0.78 -0.09 1.5 1.74 0.24 0.06
Mixed deciduous forest 27.76 27.79 0.03 0.00 6.14 5.68 -0.46 -0.11
Dry diptercarp forest 18.37 17.65 -0.72 -0.08 14.68 13.37 -1.31 -0.33
Bamboo forest 11.48 11.8 0.32 0.04 2.36 2.46 0.10 0.02
Forest plantation 61.73 59.23 -2.50 -0.28 12.31 9.33 -2.98 -0.74
Grass land 12.87 13.14 0.27 0.03 0.09 0.1 0.01 0.00
Rock out crop 2.21 2.21 0.00 0.00 0.01 0.01 0.00 0.00
Agricultural land 318.2 322.92 4.72 0.53 354.62 358.73 4.11 1.02
Urban and
Table 4 Landuse in The PLWS. 2001 and 2005 and its changes
Regional Centre for Geo-Informatics and Space Technology, Northeast Thailand

Result and Discussions
Landuse Landuse change in The PLWS Landuse change out The PLWS
Area (sq.km.) change Area (sq.km.) change
Area
(sq.km.)Percentage
Area
(sq.km.)Percentage
Hill evergreen
forest 247.56 246.16 -1.40 -0.16 3.88 4.01 0.13 0.03
Pine Forest 7.26 7.22 -0.04 0.00 0.03 0.04 0.01 0.00
Dry or semi-
evergreen forest186.9 186.12 -0.78 -0.09 1.5 1.74 0.24 0.06
Mixed deciduous
forest27.76 27.79 0.03 0.00 6.14 5.68 -0.46 -0.11
Dry diptercarp
forest18.37 17.65 -0.72 -0.08 14.68 13.37 -1.31 -0.33
Bamboo forest 11.48 11.8 0.32 0.04 2.36 2.46 0.10 0.02
Forest plantation 61.73 59.23 -2.50 -0.28 12.31 9.33 -2.98 -0.74
Grass land 12.87 13.14 0.27 0.03 0.09 0.1 0.01 0.00
Rock out crop 2.21 2.21 0.00 0.00 0.01 0.01 0.00 0.00
Agricultural land 318.2 322.92 4.72 0.53 354.62 358.73 4.11 1.02
Urban and built
up land2.29 2.39 0.10 0.01 5.61 5.8 0.19 0.05
Water body 0.33 0.31 -0.02 0.00 1.51 1.48 -0.03 -0.01
sum896.95 896.95 - - 402.75 402.75 - -
Table 5 Landuse in The PLWS. 2005 and 2010 and its changes
Regional Centre for Geo-Informatics and Space Technology, Northeast Thailand
Result and Discussions
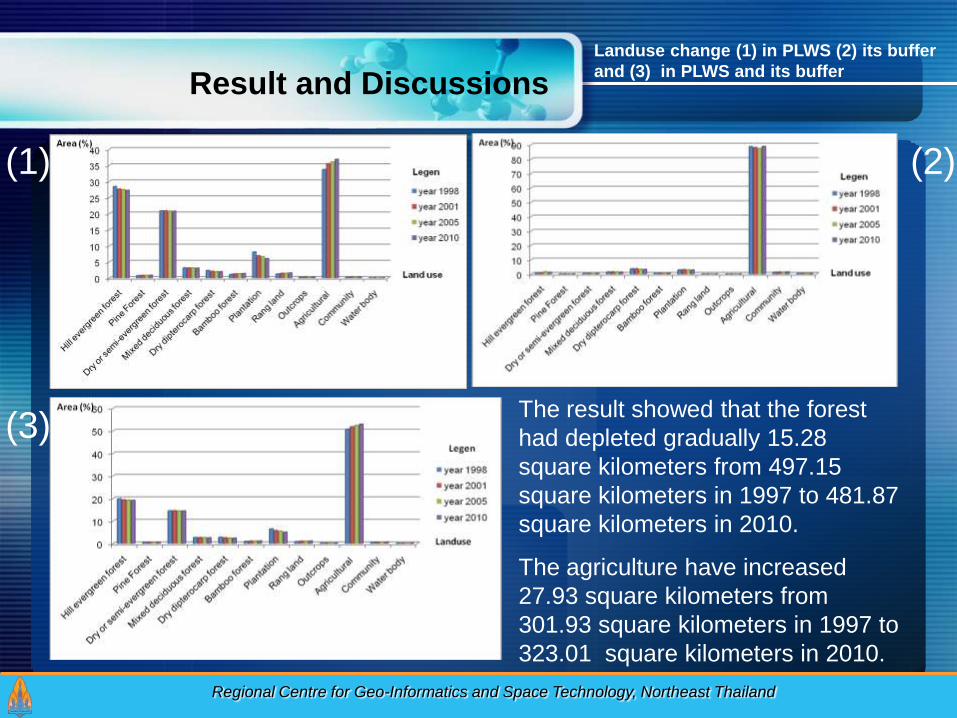
Landuse change (1) in PLWS (2) its buffer
and (3) in PLWS and its buffer
Regional Centre for Geo-Informatics and Space Technology, Northeast Thailand
(1) (2)
(3)The result showed that the forest
had depleted gradually 15.28
square kilometers from 497.15
square kilometers in 1997 to 481.87
square kilometers in 2010.
The agriculture have increased
27.93 square kilometers from
301.93 square kilometers in 1997 to
323.01 square kilometers in 2010.
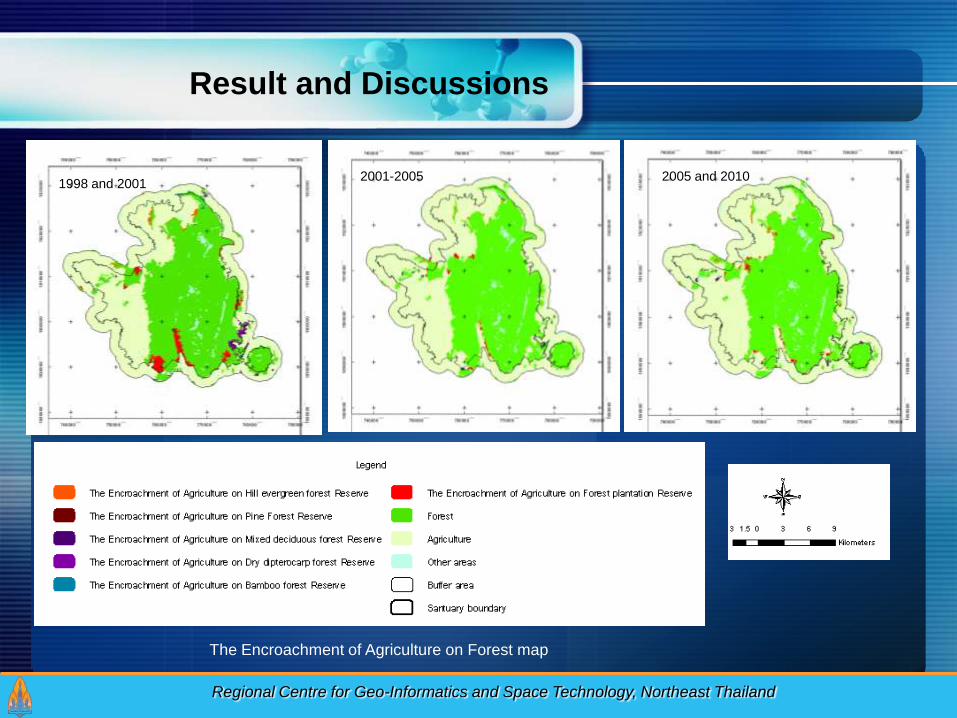
Result and Discussions
1998 and 2001
1998 and 20012001-2005 2005 and 2010
Regional Centre for Geo-Informatics and Space Technology, Northeast Thailand
The Encroachment of Agriculture on Forest map
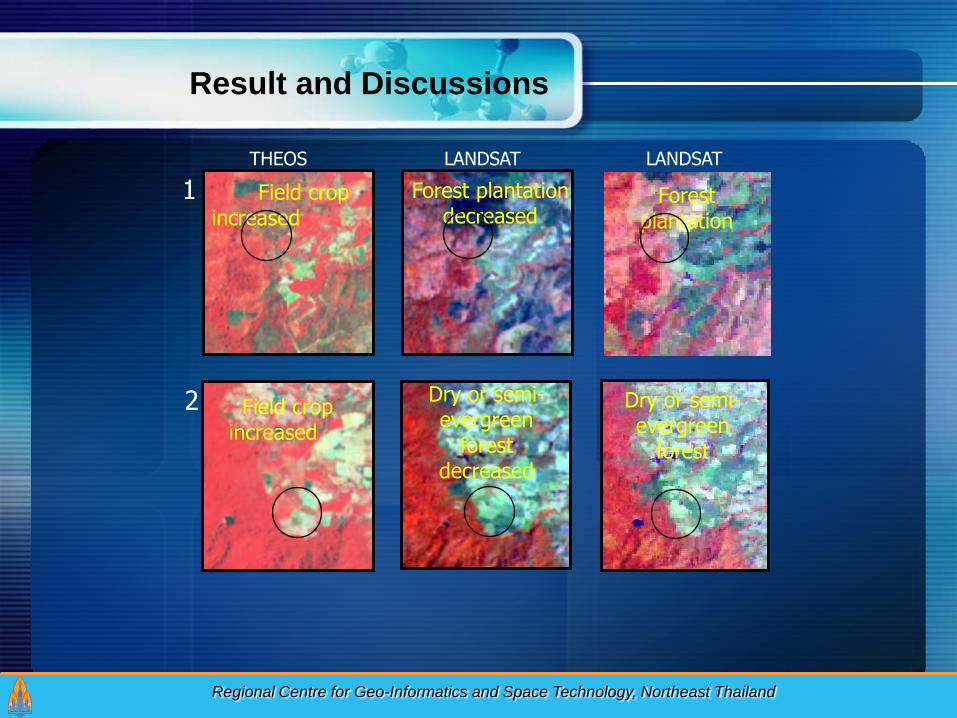
Result and Discussions
THEOS 2010
LANDSAT 2005
LANDSAT 2001Forest plantation
decreasedField crop
increasedForest
plantation
Field crop increased
Dry or semi-evergreen
forest decreased
Dry or semi-evergreen
forest
1
2
Regional Centre for Geo-Informatics and Space Technology, Northeast Thailand
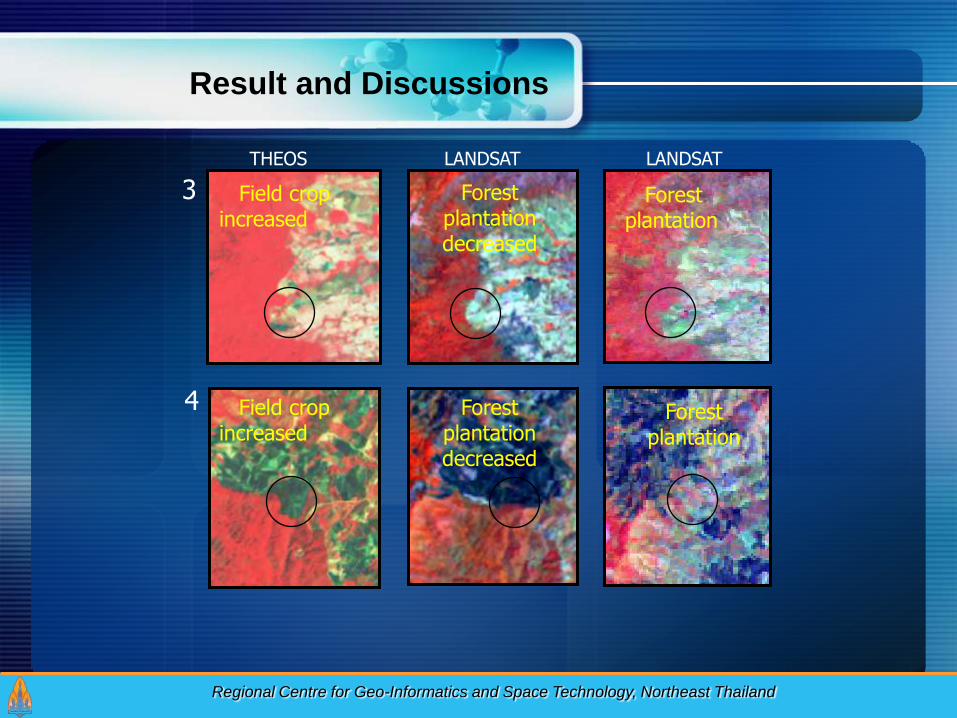
Result and Discussions
THEOS 2010
LANDSAT 2005
LANDSAT 20013
4
Field crop increased
Forest plantation decreased
Forest plantation
Field crop increased
Forest plantation decreased
Forest plantation
Regional Centre for Geo-Informatics and Space Technology, Northeast Thailand
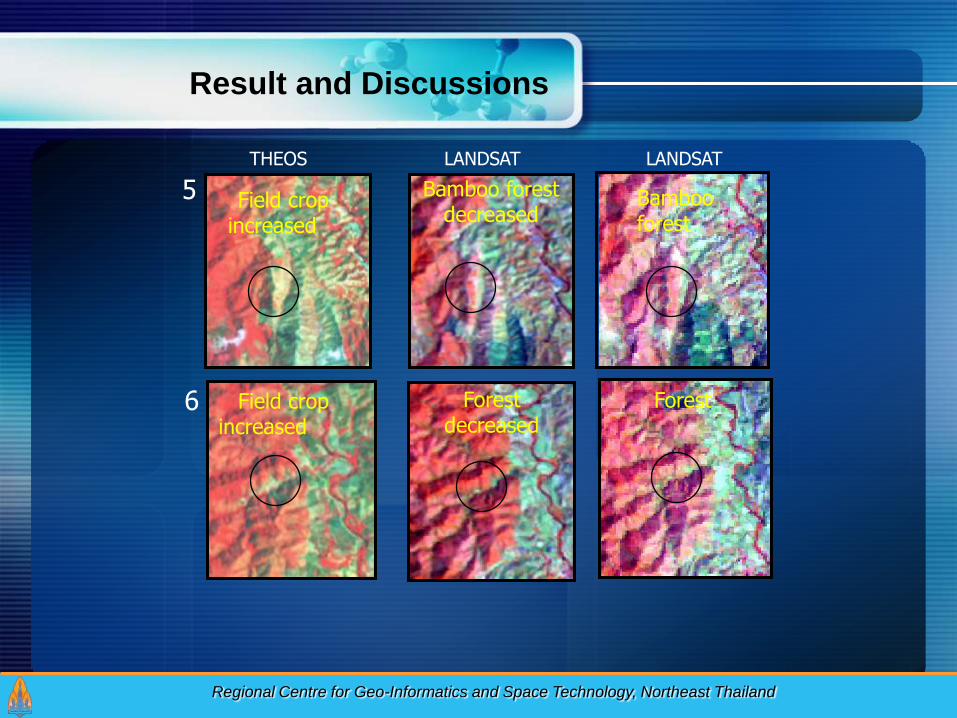
Result and Discussions
THEOS 2010
LANDSAT 2005
LANDSAT 20015
6
Regional Centre for Geo-Informatics and Space Technology, Northeast Thailand
Field crop increased
Bamboo forest decreased
Bamboo forest
Field crop increased
Forest decreased
Forest
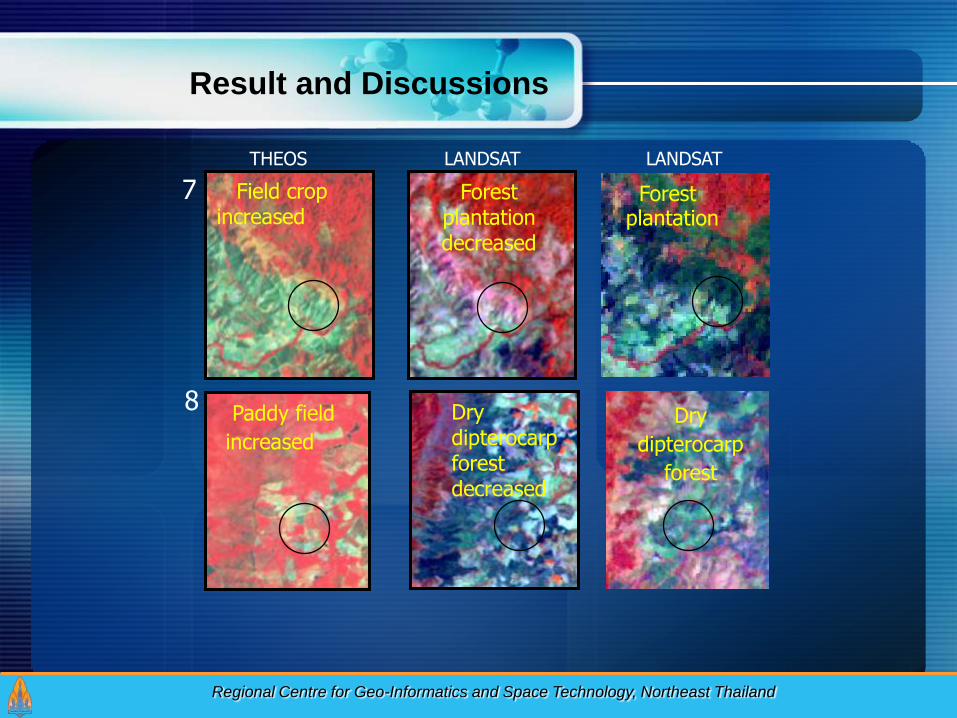
Result and Discussions
THEOS 2010
LANDSAT 2005
LANDSAT 20017
8
Regional Centre for Geo-Informatics and Space Technology, Northeast Thailand
Field crop increased
Forest plantation decreased
Forest plantation
Paddy field
increased
Dry dipterocarp forest decreased
Dry
dipterocarp
forest

Thank you for your
attention