Embed Size (px)
Citation preview
1
EFITA Conference 2017
AgriBigCAT: An Online Platform for
Estimating the Impact of Livestock
Agriculture on the Environment
Andreas Kamilaris
4th July, 2017
Montpelier, France
Problem
2
Intensive farming linked to excessive accumulation
of nutrients and contaminants in the soil.
Significant groundwater pollution with nitrates.
Emission of acidifying greenhouse gases.
Catalonia is one of the European regions with the
highest livestock density.
Need to assess environmental impact of
agriculture and potential risks
Motivation
3
Need for a common body of knowledge.
Effective monitoring of cropping and animal
production systems, fertilization and water demands.
Estimations of impacts, including climate change.
Focus on sustainability and protection of the physical
environment.
Decision-making assistant tool for policymakers
Research Questions
4
How can we accurately measure the
environmental impact of agriculture in Catalunya
using big data analysis?
Which solutions can we find to avoid the negative
effects of animal manure on the environment?
5
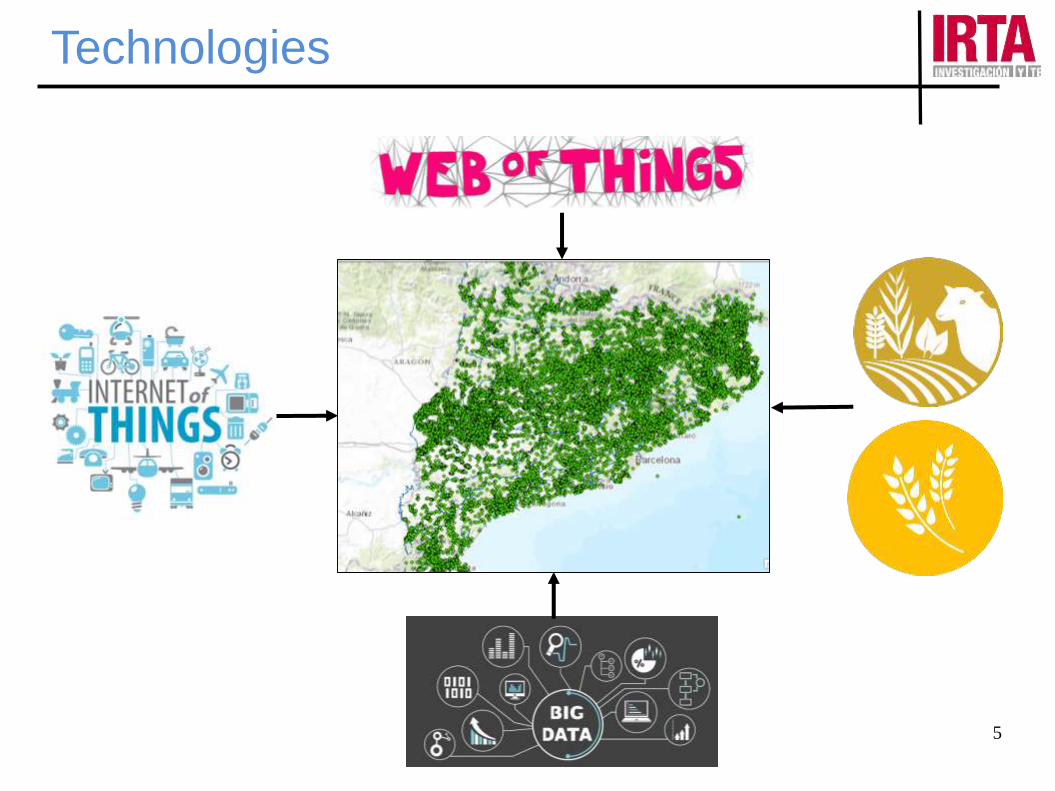
Technologies
Methodology
6
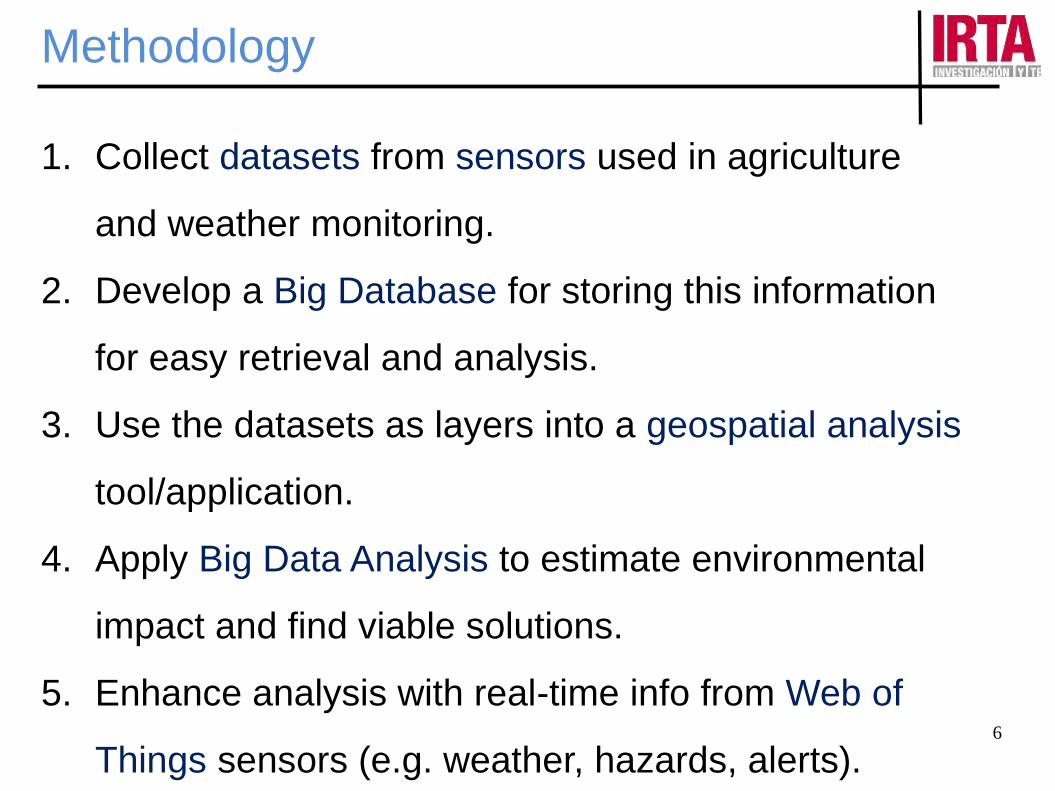
1. Collect datasets from sensors used in agriculture
and weather monitoring.
2. Develop a Big Database for storing this information
for easy retrieval and analysis.
3. Use the datasets as layers into a geospatial analysis
tool/application.
4. Apply Big Data Analysis to estimate environmental
impact and find viable solutions.
5. Enhance analysis with real-time info from Web of
Things sensors (e.g. weather, hazards, alerts).
7
Data Sources
• GPS sensors
• Physical sensors
• Weather stations
• Web data from online web services
• Crowdsourcing-based techniques from mobile phones
• Static historical information: databases and statistics
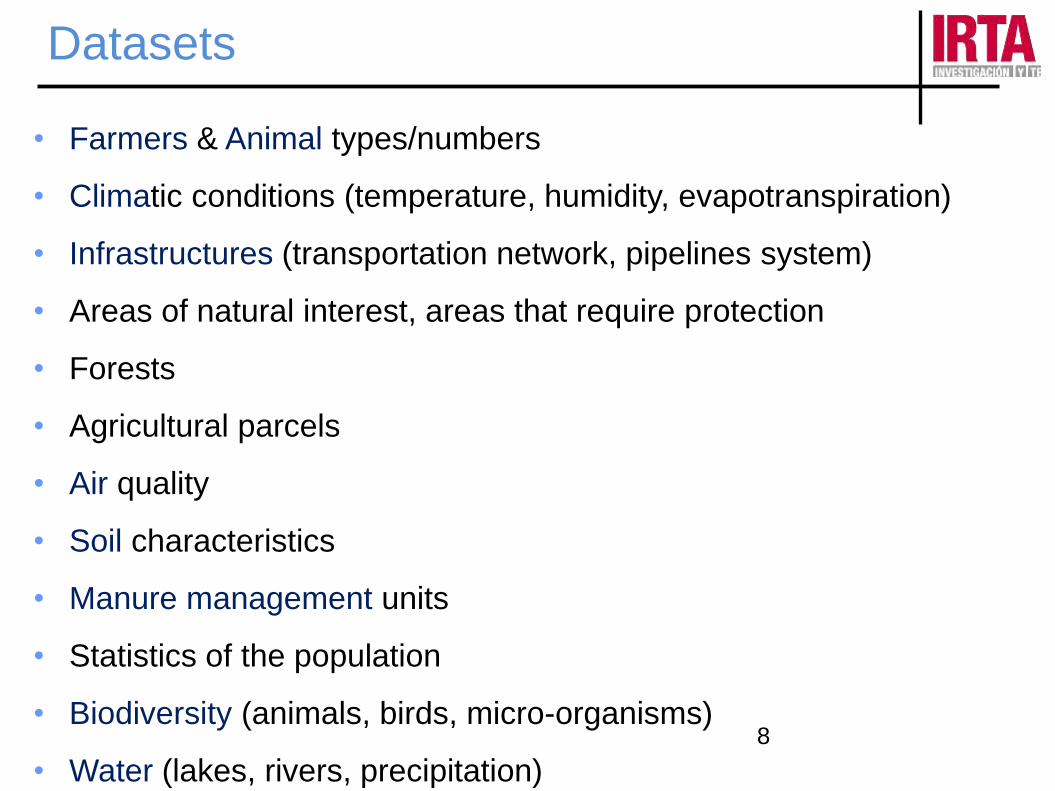
Datasets
8
• Farmers & Animal types/numbers
• Climatic conditions (temperature, humidity, evapotranspiration)
• Infrastructures (transportation network, pipelines system)
• Areas of natural interest, areas that require protection
• Forests
• Agricultural parcels
• Air quality
• Soil characteristics
• Manure management units
• Statistics of the population
• Biodiversity (animals, birds, micro-organisms)
• Water (lakes, rivers, precipitation)
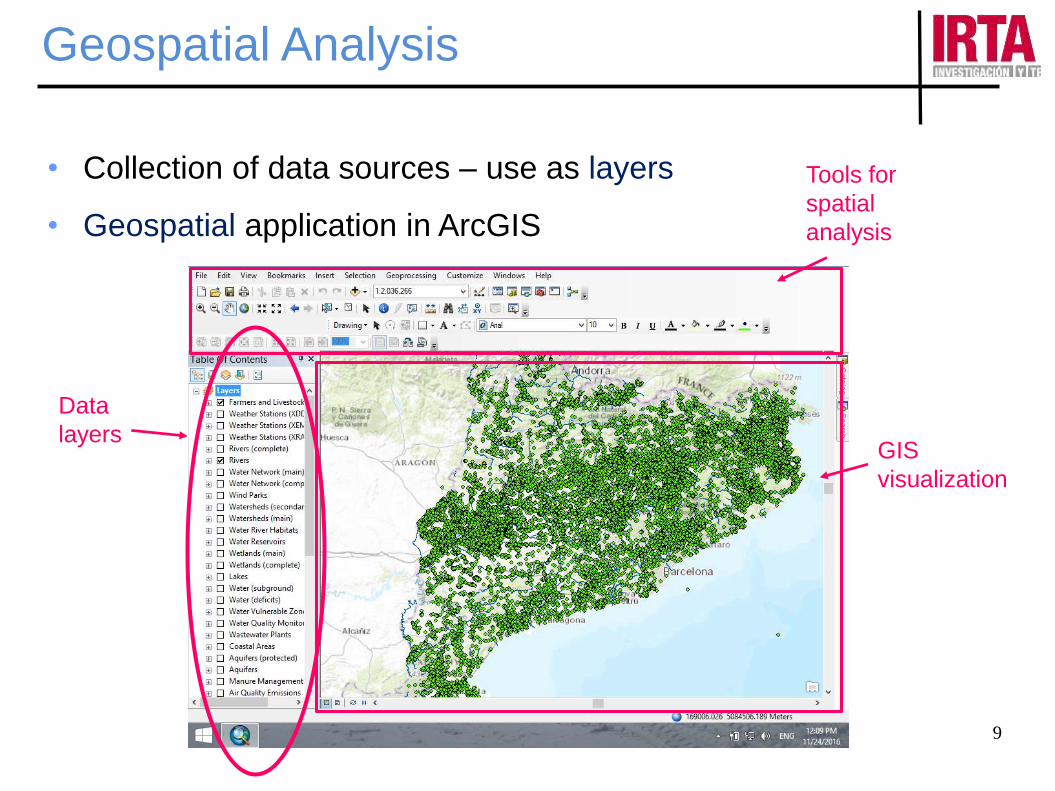
Geospatial Analysis
9
• Collection of data sources – use as layers
• Geospatial application in ArcGIS
Data
layers
Tools for
spatial
analysis
GIS
visualization
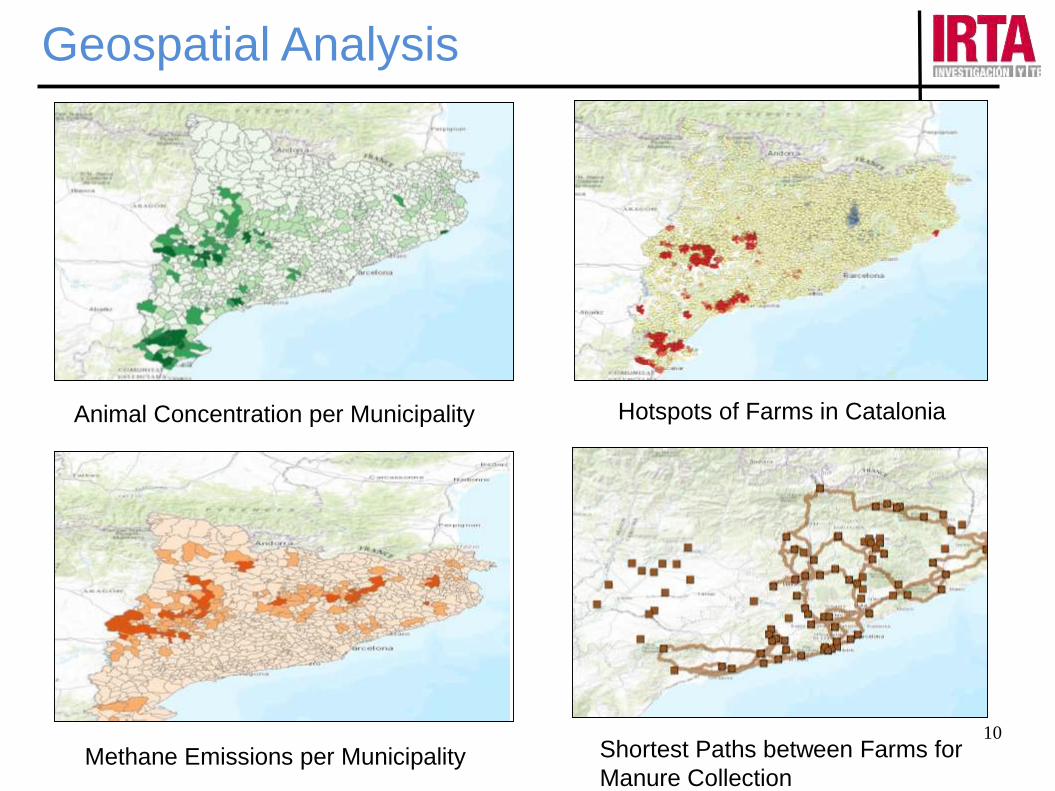
10
Animal Concentration per Municipality Hotspots of Farms in Catalonia
Shortest Paths between Farms for
Manure CollectionMethane Emissions per Municipality
Geospatial Analysis
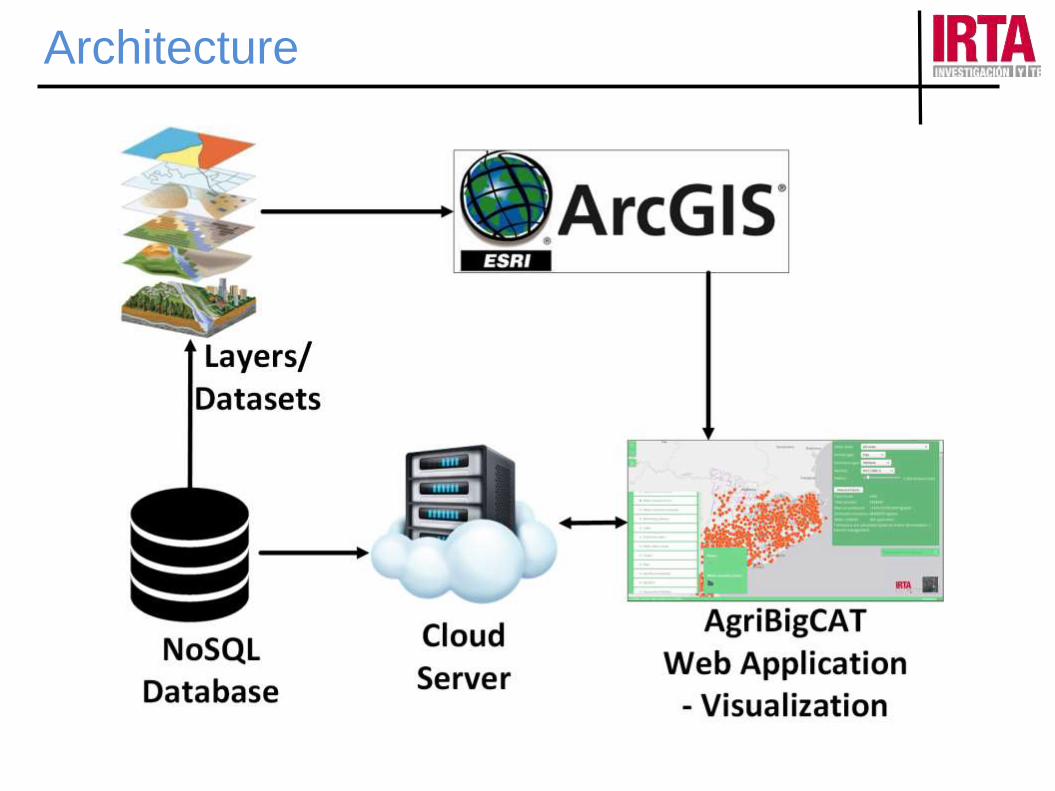
Architecture
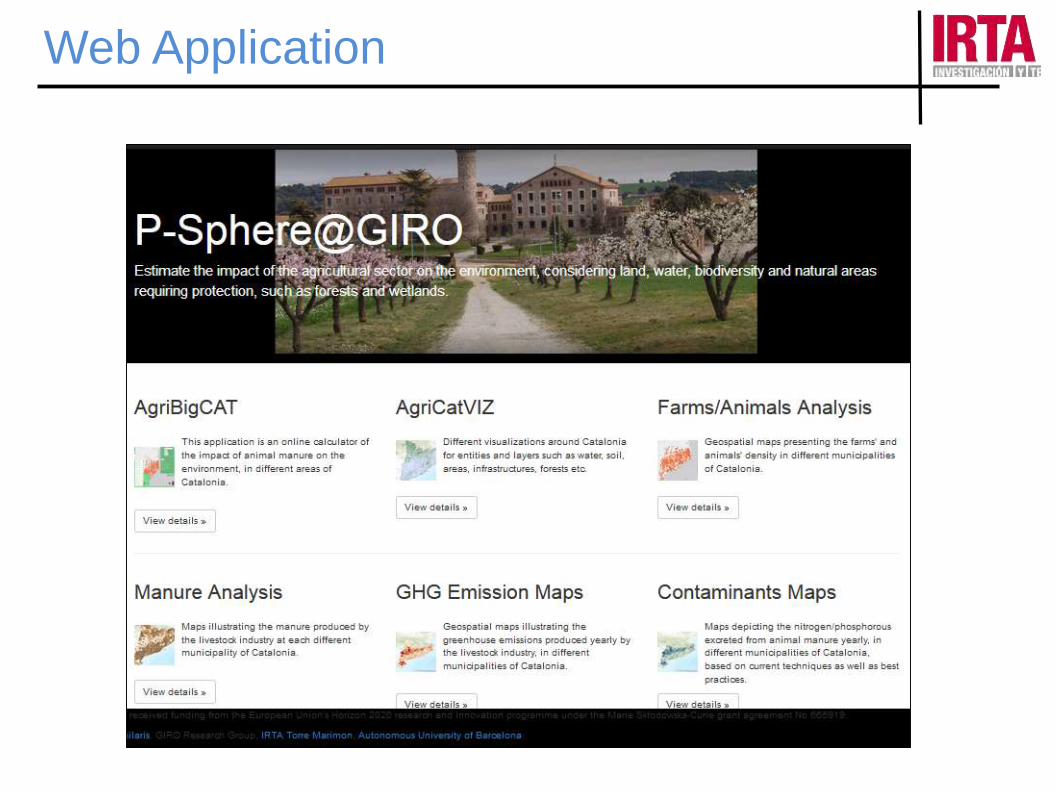
Web Application
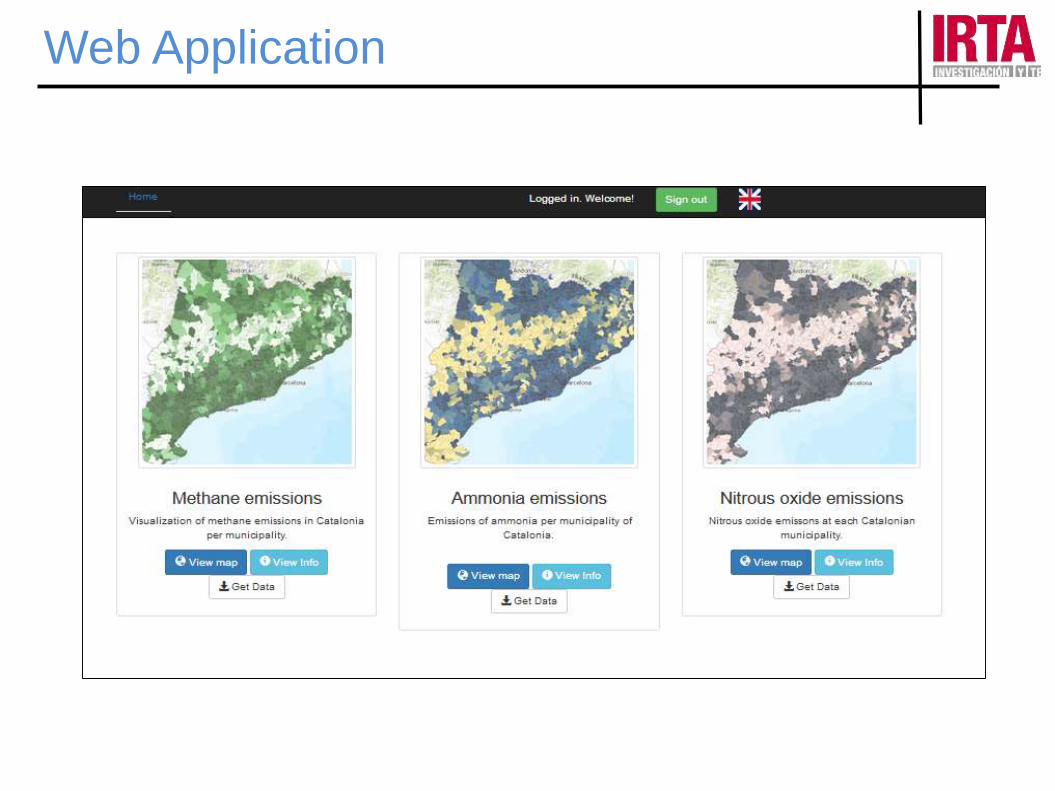
Web Application
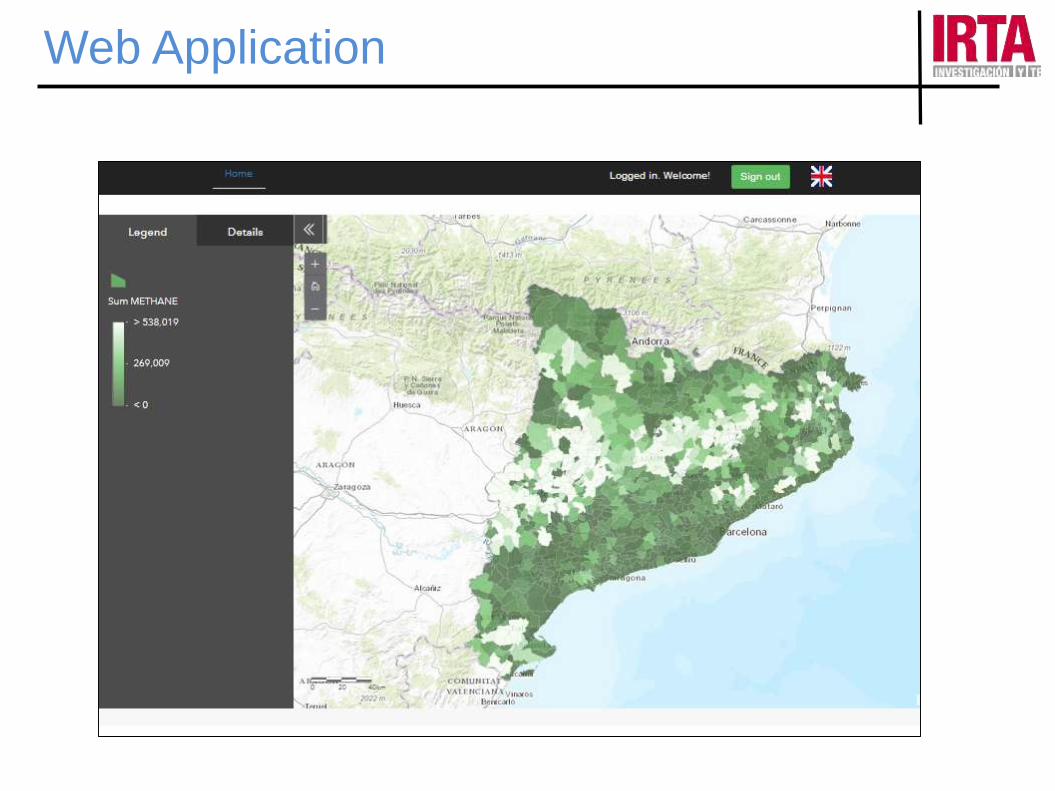
Web Application
15
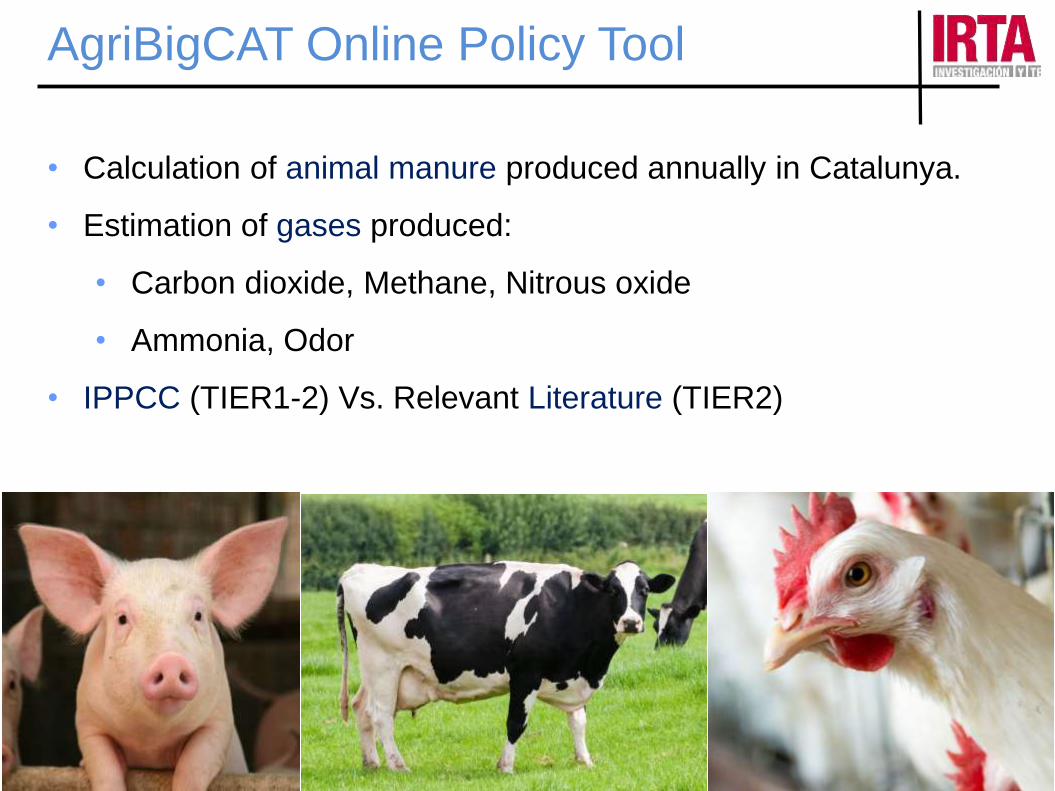
• Calculation of animal manure produced annually in Catalunya.
• Estimation of gases produced:
• Carbon dioxide, Methane, Nitrous oxide
• Ammonia, Odor
• IPPCC (TIER1-2) Vs. Relevant Literature (TIER2)
AgriBigCAT Online Policy Tool
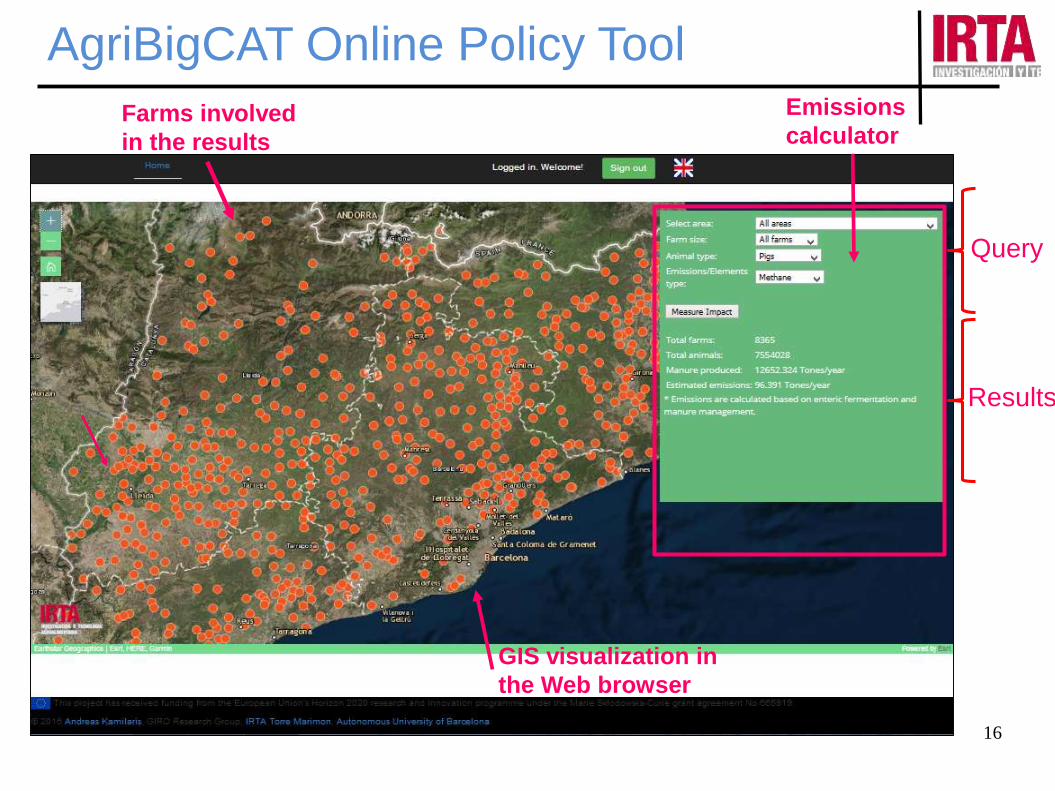
AgriBigCAT Online Policy Tool
16
Emissions
calculator
GIS visualization in
the Web browser
Farms involved
in the results
Query
Results
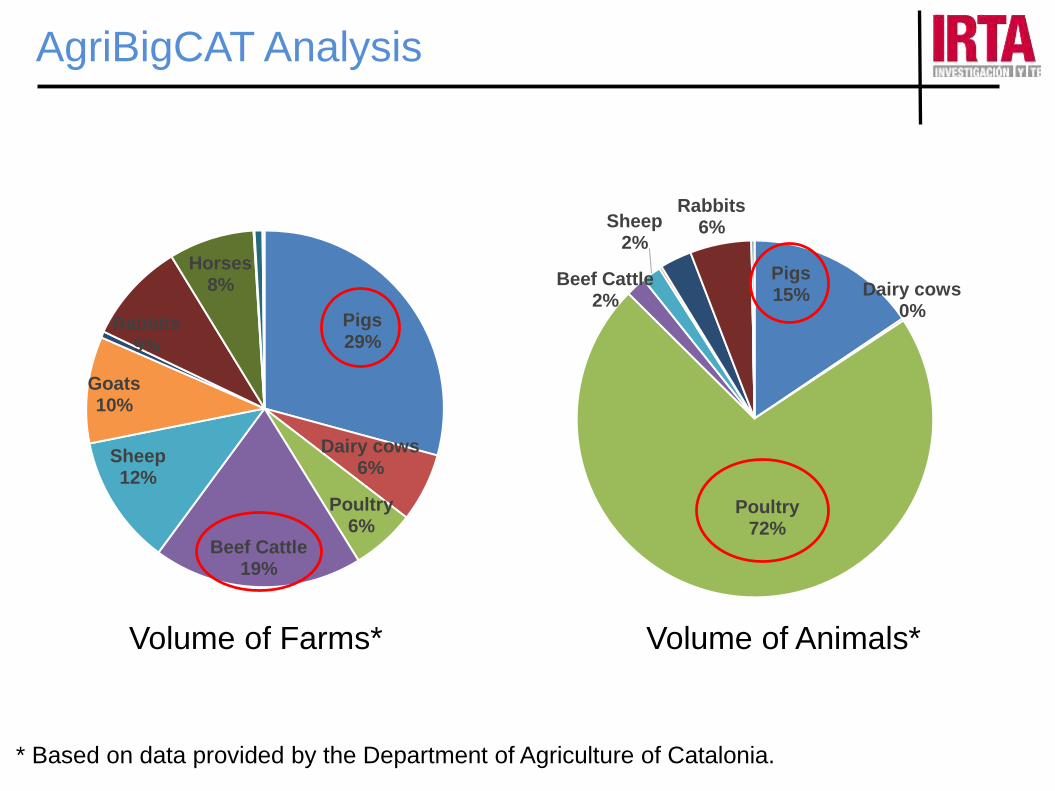
Pigs29%
Dairy cows6%
Poultry6%
Beef Cattle19%
Sheep12%
Goats10%
Rabbits9%
Horses8%
Pigs15% Dairy cows
0%
Poultry72%
Beef Cattle2%
Sheep2%
Rabbits6%
Volume of Farms* Volume of Animals*
* Based on data provided by the Department of Agriculture of Catalonia.
AgriBigCAT Analysis
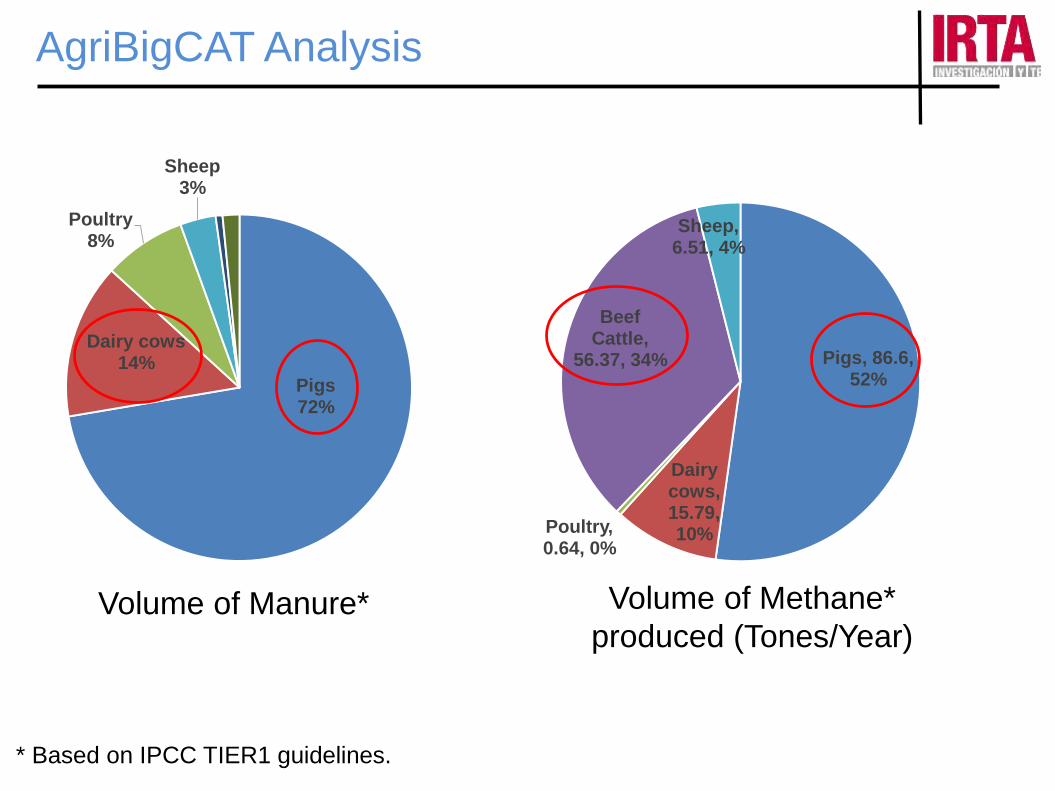
Pigs, 86.6, 52%
Dairy cows, 15.79, 10%Poultry,
0.64, 0%
Beef Cattle,
56.37, 34%
Sheep, 6.51, 4%
AgriBigCAT Analysis
Volume of Methane*
produced (Tones/Year)
Pigs72%
Dairy cows14%
Poultry8%
Sheep3%
Volume of Manure*
* Based on IPCC TIER1 guidelines.
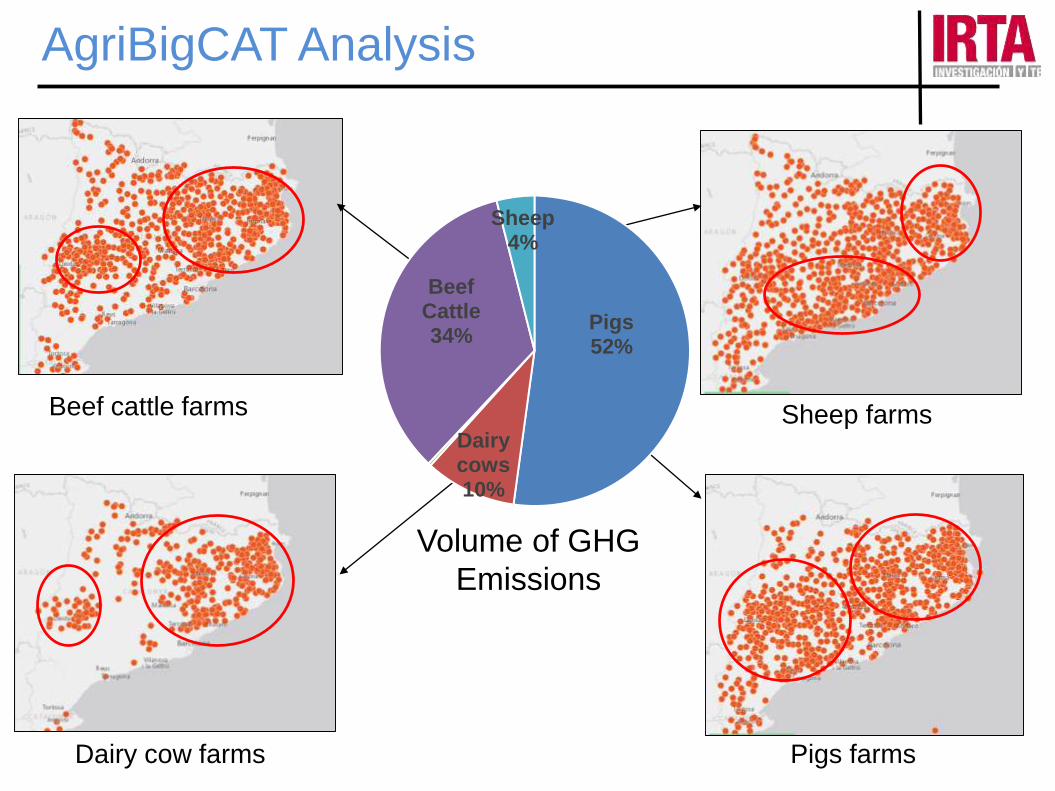
Volume of GHG
Emissions
Beef cattle farms Sheep farms
Dairy cow farms Pigs farms
Pigs52%
Dairy cows10%
Beef Cattle34%
Sheep4%
AgriBigCAT Analysis
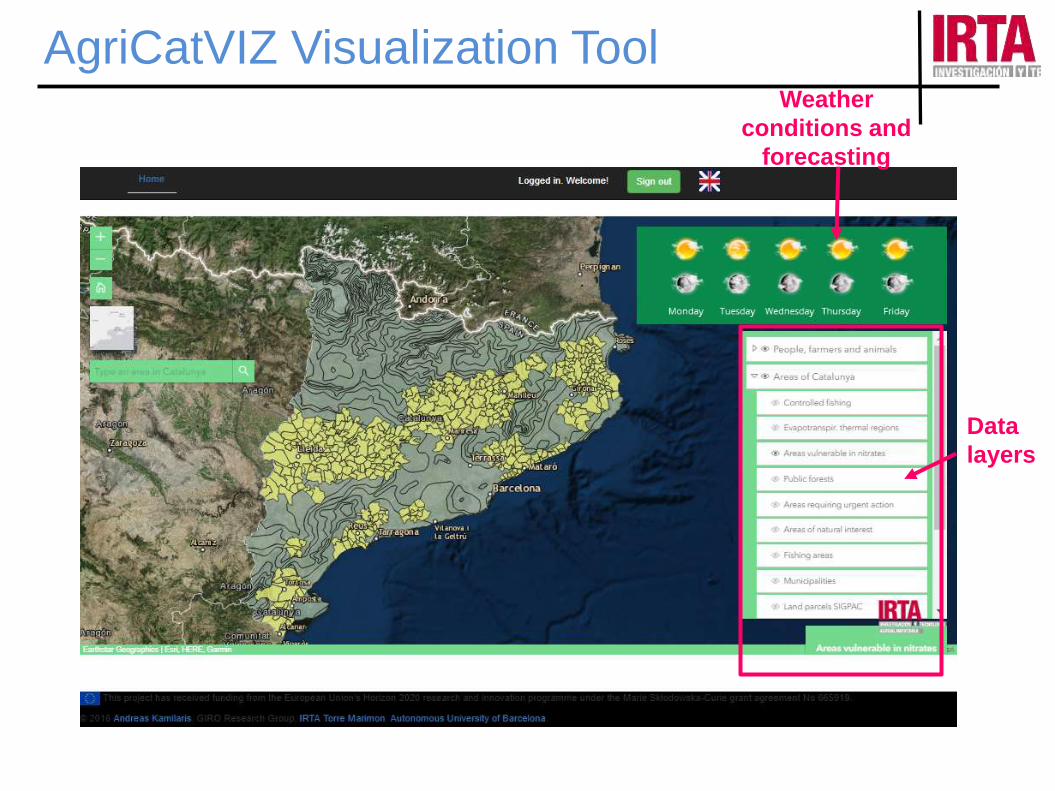
AgriCatVIZ Visualization Tool
Data
layers
Weather
conditions and
forecasting
21
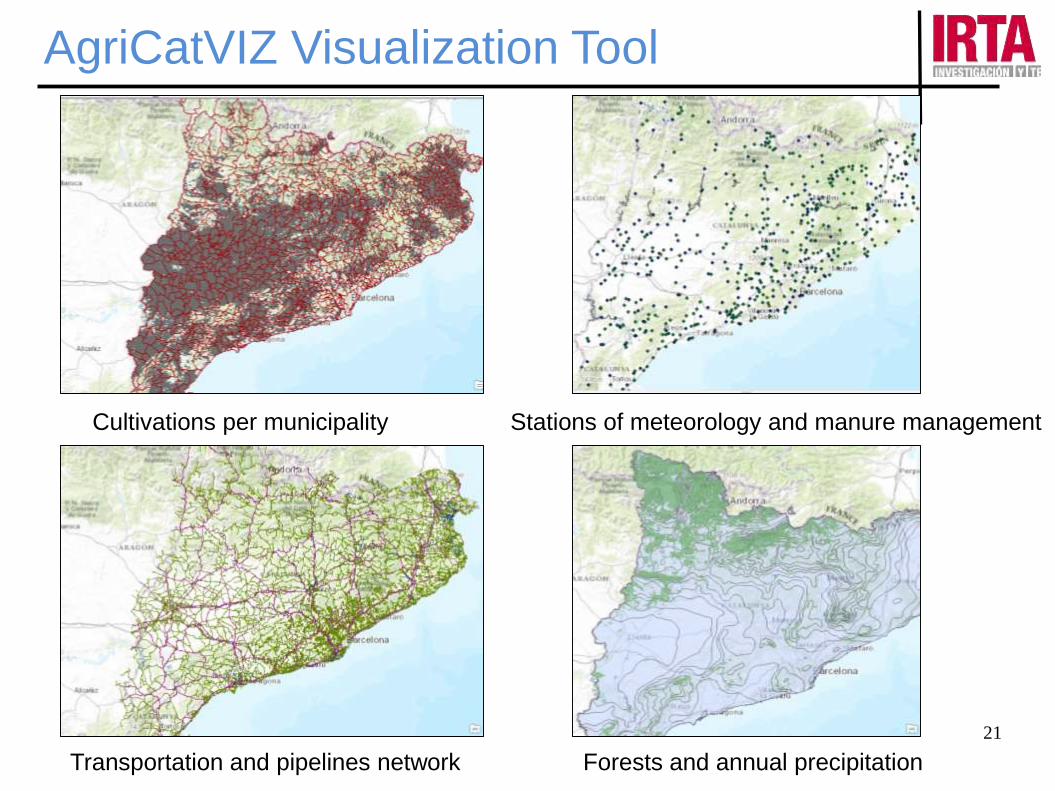
Cultivations per municipality Stations of meteorology and manure management
Forests and annual precipitationTransportation and pipelines network
AgriCatVIZ Visualization Tool
22
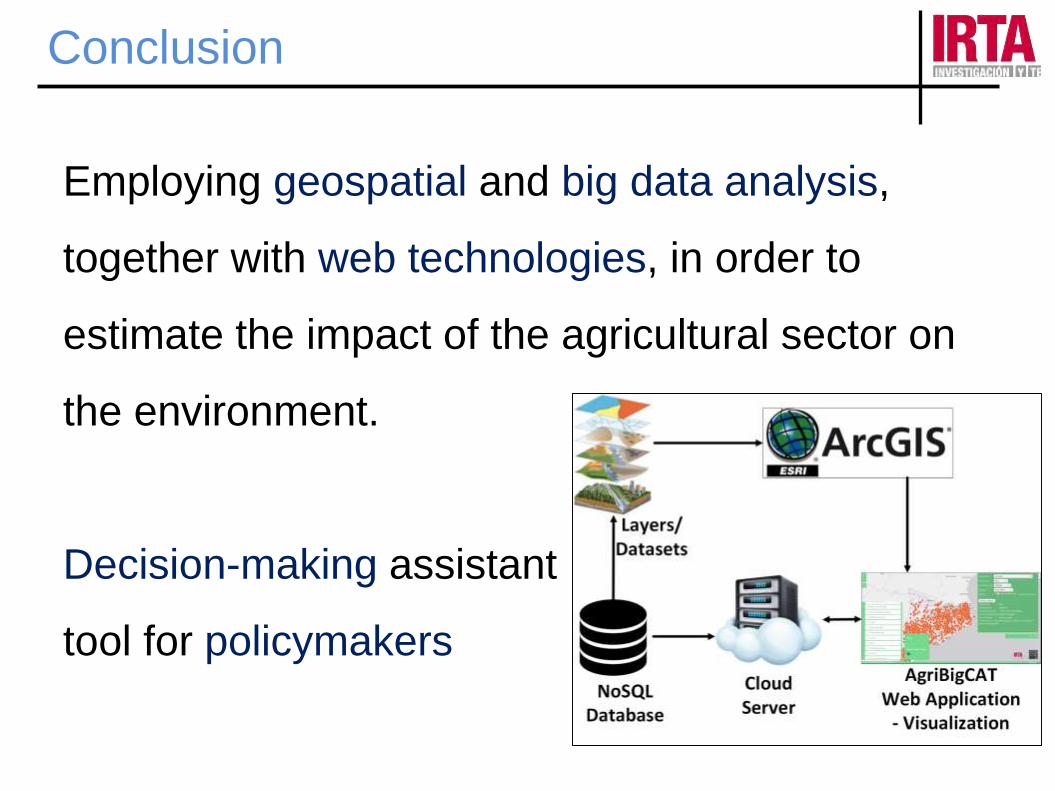
Conclusion
Employing geospatial and big data analysis,
together with web technologies, in order to
estimate the impact of the agricultural sector on
the environment.
Decision-making assistant
tool for policymakers
23
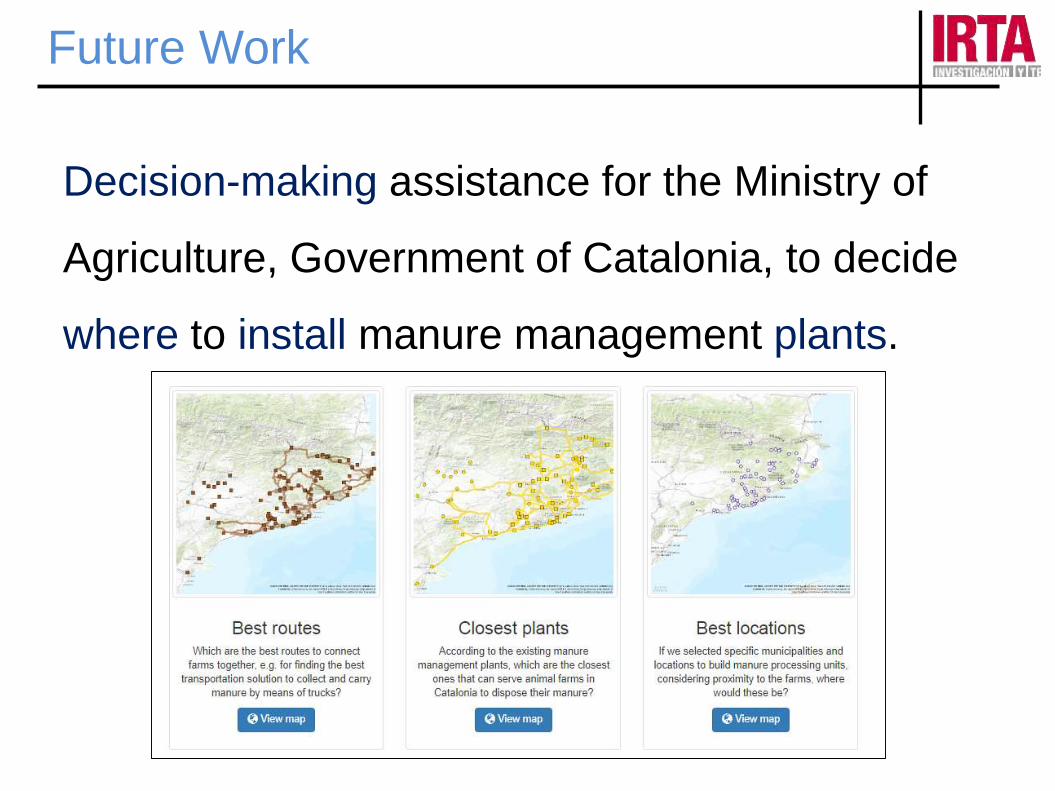
Future Work
Decision-making assistance for the Ministry of
Agriculture, Government of Catalonia, to decide
where to install manure management plants.
24
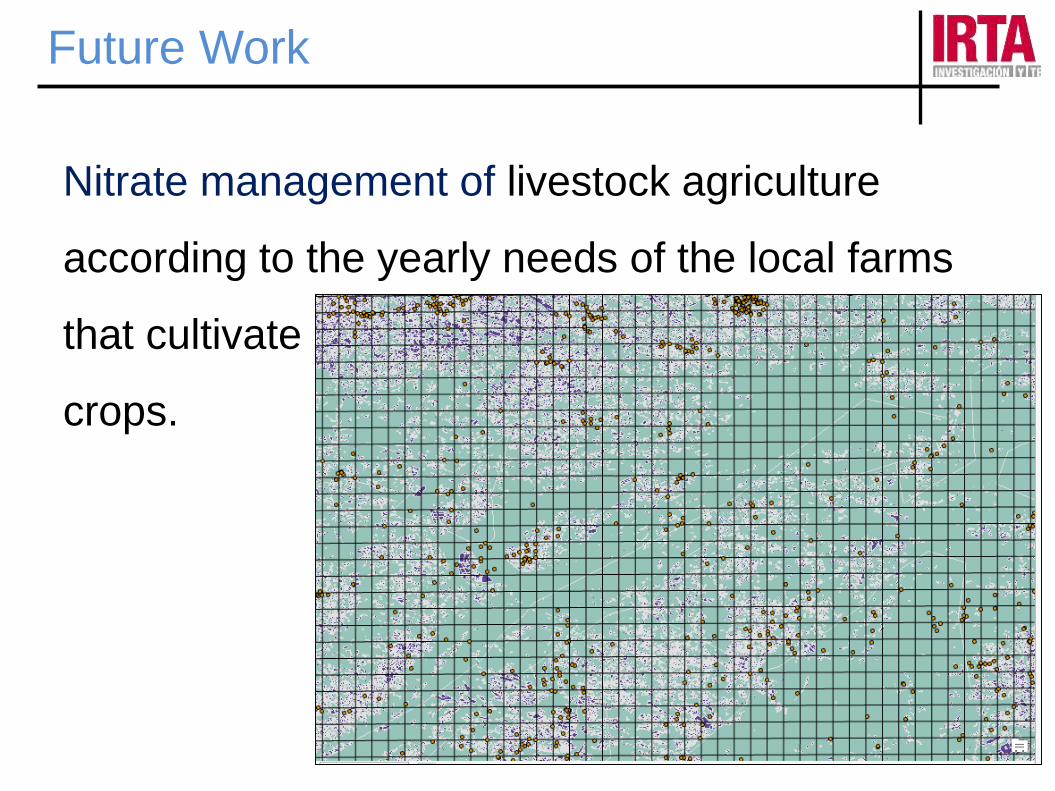
Future Work
Nitrate management of livestock agriculture
according to the yearly needs of the local farms
that cultivate
crops.
25
Future Work
Open-source code of the AgriBigCAT software:
• How to create geospatial layers
• How to perform geospatial analysis
• How to publish geospatial maps
• How to create web-based visualizations
• How to connect maps with web interfaces
• How to get authentication, access control, privacy
• How to perform big data analysis and visualize results
27
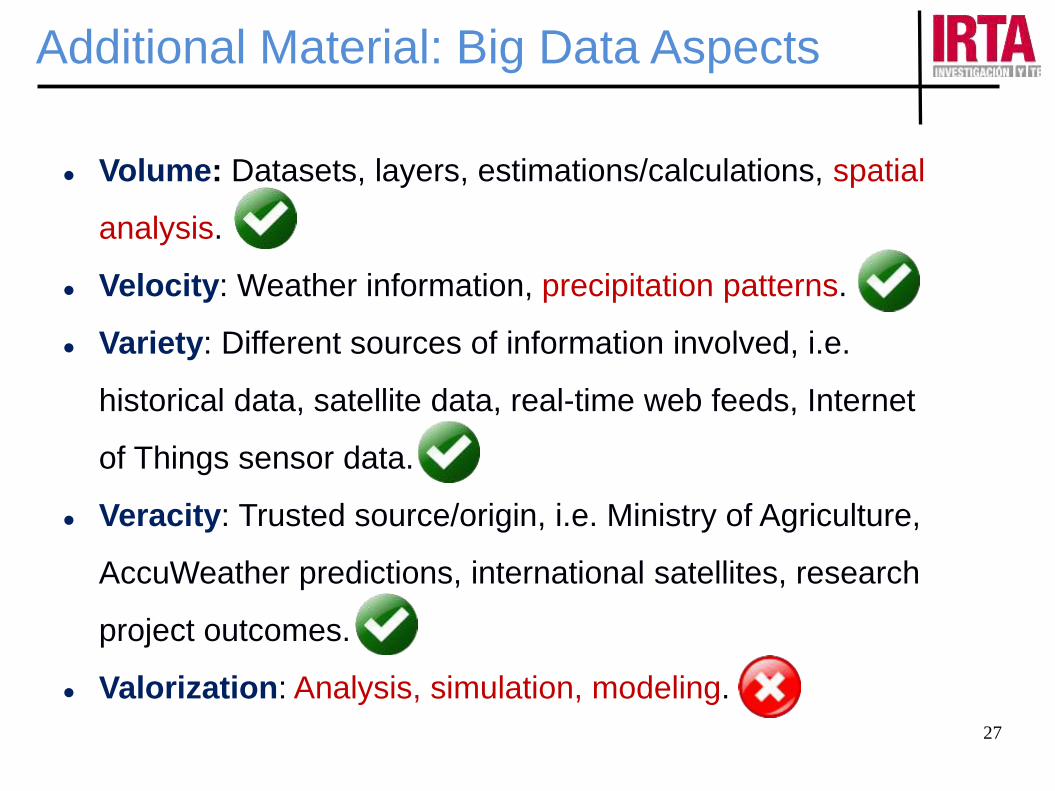
Additional Material: Big Data Aspects
Volume: Datasets, layers, estimations/calculations, spatial
analysis.
Velocity: Weather information, precipitation patterns.
Variety: Different sources of information involved, i.e.
historical data, satellite data, real-time web feeds, Internet
of Things sensor data.
Veracity: Trusted source/origin, i.e. Ministry of Agriculture,
AccuWeather predictions, international satellites, research
project outcomes.
Valorization: Analysis, simulation, modeling.