Embed Size (px)
DESCRIPTION
Citation preview
Geological Society of America Special Papers
doi: 10.1130/2011.2477(01) 2011;477;1-51Geological Society of America Special Papers
H. Hiesinger, J.W. Head III, U. Wolf, R. Jaumann and G. Neukum Ages and stratigraphy of lunar mare basalts: A synthesis
Email alerting servicescite this article
to receive free e-mail alerts when new articleswww.gsapubs.org/cgi/alertsclick
SubscribeAmerica Special Papers
to subscribe to Geological Society ofwww.gsapubs.org/subscriptions/click
Permission request to contact GSAhttp://www.geosociety.org/pubs/copyrt.htm#gsaclick
viewpoint. Opinions presented in this publication do not reflect official positions of the Society.positions by scientists worldwide, regardless of their race, citizenship, gender, religion, or politicalarticle's full citation. GSA provides this and other forums for the presentation of diverse opinions and articles on their own or their organization's Web site providing the posting includes a reference to thescience. This file may not be posted to any Web site, but authors may post the abstracts only of their unlimited copies of items in GSA's journals for noncommercial use in classrooms to further education andto use a single figure, a single table, and/or a brief paragraph of text in subsequent works and to make
GSA,employment. Individual scientists are hereby granted permission, without fees or further requests to Copyright not claimed on content prepared wholly by U.S. government employees within scope of their
Notes
© 2011 Geological Society of America
on August 28, 2011specialpapers.gsapubs.orgDownloaded from
1
The Geological Society of AmericaSpecial Paper 477
2011
Ages and stratigraphy of lunar mare basalts: A synthesis
H. Hiesinger*Institut für Planetologie, Westfälische Wilhelms-Universität, 48149 Münster, Germany, and
Department of Geological Sciences, Brown University, Providence, Rhode Island 02912, USA
J.W. Head IIIDepartment of Geological Sciences, Brown University, Providence, Rhode Island 02912, USA
U. WolfR. Jaumann
Institute of Planetary Exploration, German Aerospace Center (DLR), 12489 Berlin, Germany
G. NeukumInstitut für Geologie, Geophysik, und Geoinformatik, Freie Universität Berlin, 12249 Berlin, Germany
ABSTRACT
The chronology of lunar volcanism is based on radiometric ages determined from Apollo and Luna landing site samples, regional stratigraphic relationships, and crater degradation and size-frequency distribution data for units largely defi ned prior to the end of the Apollo program. Accurate estimates of mare basalt ages are necessary to place constraints on the duration and the fl ux of lunar volcanism, as well as on the petrogenesis of lunar mare basalts and their relationship to the thermal evolution of the Moon. Here, we report on ages derived from crater size-frequency distribution measurements for exposed mare basalt units on the lunar nearside hemisphere. Cra-ter size-frequency distribution measurements provide a statistically robust and accu-rate method to derive absolute model ages of unsampled regions on the Moon and other planetary surfaces. This paper summarizes and synthesizes results from our crater-counting efforts over more than 10 yr. We have dated basalts in Oceanus Pro-cellarum, Imbrium, Serenitatis, Tranquillitatis, Humboldtianum, Australe, Humo-rum, Nubium, Cognitum, Nectaris, Frigoris, and numerous smaller occurrences like impact craters and sinus and lacus areas. Our investigations show that (1) in the inves-tigated basins, lunar volcanism was active for almost 3 b.y., starting at ~3.9–4.0 b.y. ago and ceasing at ~1.2 b.y. ago, (2) most basalts erupted during the late Imbrian Period at ~3.6–3.8 b.y. ago, (3) signifi cantly fewer basalts were emplaced during the Eratosthenian Period, and (4) basalts of possible Copernican age have been found only in limited areas in Oceanus Procellarum. Our results confi rm and extend the general distribution of ages of mare basalt volcanism and further underscore the
Hiesinger, H., Head, J.W., III, Wolf, U., Jaumann, R., and Neukum, G., 2011, Ages and stratigraphy of lunar mare basalts: A synthesis, in Ambrose, W.A., and Williams, D.A., eds., Recent Advances and Current Research Issues in Lunar Stratigraphy: Geological Society of America Special Paper 477, p. 1–51, doi:10.1130/2011.2477(01). For permission to copy, contact [email protected]. © 2011 The Geological Society of America. All rights reserved.
on August 28, 2011specialpapers.gsapubs.orgDownloaded from
2 Hiesinger et al.
INTRODUCTION
One of the major goals of stratigraphic investigations is to date geologic units, integrate them into a stratigraphic column that is applicable over the whole planet, and to calibrate this column with absolute ages. In preparation for and following the American and Russian lunar missions, extensive work on the lunar stratigraphy was conducted, for example, by Wilhelms (1970, 1987), Shoemaker and Hackman (1962), and Wilhelms and McCauley (1971). Based on this early work, we know that the lunar highlands are generally older than the mare regions (e.g., Wilhelms, 1987), that mare volcanism did not occur within a short time interval but instead shows a substantial range in ages (e.g., Shoemaker and Hackman, 1962; Carr, 1966), and that there is signifi cant variation in the mineralogy of basalts of different ages (e.g., Soderblom et al., 1977; Pieters et al., 1980). Compared to Earth, we only have a small number of samples of the Moon that can help us to decipher its geologic history and evolution. For example, accurate radiometric ages for lunar mare basalts, which cover ~17% of the lunar surface (Head, 1976; Head and Wilson, 1992), are available only for the spatially very limited regions around the Apollo and Luna landing sites (e.g., BVSP, 1981; Stöffl er and Ryder, 2001, and references therein). Because most lunar mare basalts remain unsampled, even after the Apollo and Luna missions (e.g., Pieters, 1978; Giguere et al., 2000), absolute radiometric age data for the majority of basalts are still lacking. Consequently, on the basis of the samples alone, the onset and extent of mare volcanism are not well understood (summarized by Nyquist et al., 2001). The returned samples indicate that mare volcanism was active at least between ca. 3.9 and 3.1 Ga (Head, 1976; Nyquist and Shih, 1992). Ages of some basaltic clasts in older breccias point to an onset of mare volcanism prior to 3.9 Ga (Ryder and Spudis, 1980), perhaps as early as 4.2–4.3 Ga in the Apollo 14 region (Nyquist et al., 2001; Taylor et al., 1983; Dasch et al., 1987). Fortunately, we can derive relative and absolute model ages for unsampled regions with remote-sensing tech-niques. For example, inspection and interpretation of superposi-tion of geologic units onto each other, embayment, and cross-cutting relationships within high-resolution Apollo and Lunar Orbiter images have been used to obtain relative ages for lunar surface units (e.g., Shoemaker and Hackman, 1962). In addition, it has been shown that crater degradation stages and crater size-frequency distribution measurements, calibrated to the landing sites, are useful to derive relative and absolute model ages (e.g.,
Hartmann, 1966; Greeley and Gault, 1970; Neukum et al., 1975a; Neukum and Horn, 1976; Boyce, 1976; Boyce and Johnson, 1978; Wilhelms, 1987; Neukum and Ivanov, 1994; Hiesinger et al., 2000, 2001, 2002, 2003, 2010; Morota et al., 2008; Har-uyama et al., 2009).
The internal thermal history and evolution of a planetary body are refl ected in the timing and extent of volcanism on its surface (Head and Wilson, 1992). Thus, investigations of the ages and compositions of volcanic products on the surface provide clues to the geologic and thermal evolution of a planet. Samples, remote-sensing data, and lunar meteorites indicate that volcanism was active early in lunar history. For example, dark-halo craters have been interpreted as impacts into basaltic deposits that are now buried underneath a veneer of basin or crater ejecta (e.g., Schultz and Spudis, 1979; Hawke and Bell, 1981; Antonenko et al., 1995). These underlying cryptomare basalts might be among the oldest basalts on the Moon, implying that volcanism was active prior to ~3.9 b.y. ago. Terada et al. (2007) argued that the lunar meteorite Kalahari 009 might represent a very low-Ti cryp-tomare basalt. Radiometric U-Pb age dating of phosphate grains associated with basaltic clasts in the lunar meteorite Kalahari 009 revealed that volcanism was already active at least 4.35 b.y. ago (Terada et al., 2007).
On the basis of crater degradation stages, Boyce (1976) and Boyce and Johnson (1978) derived absolute model ages that indicate volcanism might have lasted from 3.85 ± 0.05 b.y. until 2.5 ± 0.5 b.y. ago. Support for such young basalt ages comes from the lunar meteorite Northwest Africa (NWA) 032, which shows an Ar-Ar whole-rock age of ca. 2.8 Ga (Borg et al., 2007; Fagan et al., 2002). In addition, similar young ages for basal-tic meteorites NWA 479 and several fragments of Lapaz Icefi eld (LAP) (02205, 02224, 02226, 02436, 03632, 04841) have been reported by Fernandes and Burgess (2006) and Fernandes et al. (2003). The 40Ar-39Ar plateau dating for NWA 479 yielded ages of 2.734 Ga (Fernandes and Burgess, 2006). Various techniques (Ar-Ar, Rb-Sr, Sm-Nd, U-Pb) applied to radiometrically date the LAP meteorites have revealed ages of 2.915–3.02 Ga (Shih et al., 2005; Fernandes and Burgess, 2006; Anand et al., 2006; Ran-kenburg et al., 2007), indicating that lunar volcanism was active later in lunar history than is documented in the Apollo and Luna sample collection.
Schultz and Spudis (1983) performed crater size-frequency distribution measurements for basalts embaying the Copernican crater Lichtenberg and concluded that these basalts might even
predominance of older mare basalt ages in the eastern and southern nearside and in patches of maria peripheral to the larger maria, in contrast to the younger basalt ages on the western nearside, i.e., in Oceanus Procellarum. New data from the recent international armada of lunar spacecraft will provide mineralogical, geochemical, morphological, topographic, and age data that will further refi ne our understanding of the fl ux of lunar mare basalts and their relation to petrogenetic trends and lunar thermal evolution.
on August 28, 2011specialpapers.gsapubs.orgDownloaded from
Ages and stratigraphy of lunar mare basalts 3
be younger than 1 b.y. old. However, on the basis of crater counts on Lunar Orbiter IV images, Hiesinger et al. (2003) derived older ages for the Lichtenberg basalts of 1.68 Ga, and even older ages of 2.20 Ga resulted from crater counts on SELENE Terrain Cam-era images (Morota et al., 2008).
Crater size-frequency ages for mare basalts on the lunar far-side were derived, for example, by Haruyama et al. (2009). Har-uyama et al. (2009) concluded that the majority of mare volca-nism on the lunar farside ceased ~3.0 b.y. ago. However, they also identifi ed mare deposits in several locations on the lunar farside (i.e., Antoniadi, Apollo N, Apollo S, Nishina, Mare Moscovi-ense) that show much younger ages, clustering at ca. 2.5 b.y. ago. Haruyama et al. (2009) argued that these young ages indicate that mare volcanism on the lunar farside lasted longer than was previ-ously considered (e.g., Stuart-Alexander, 1978; Wilhelms et al., 1979; Walker and El-Baz, 1982; Wilhelms, 1987) and may have occurred episodically.
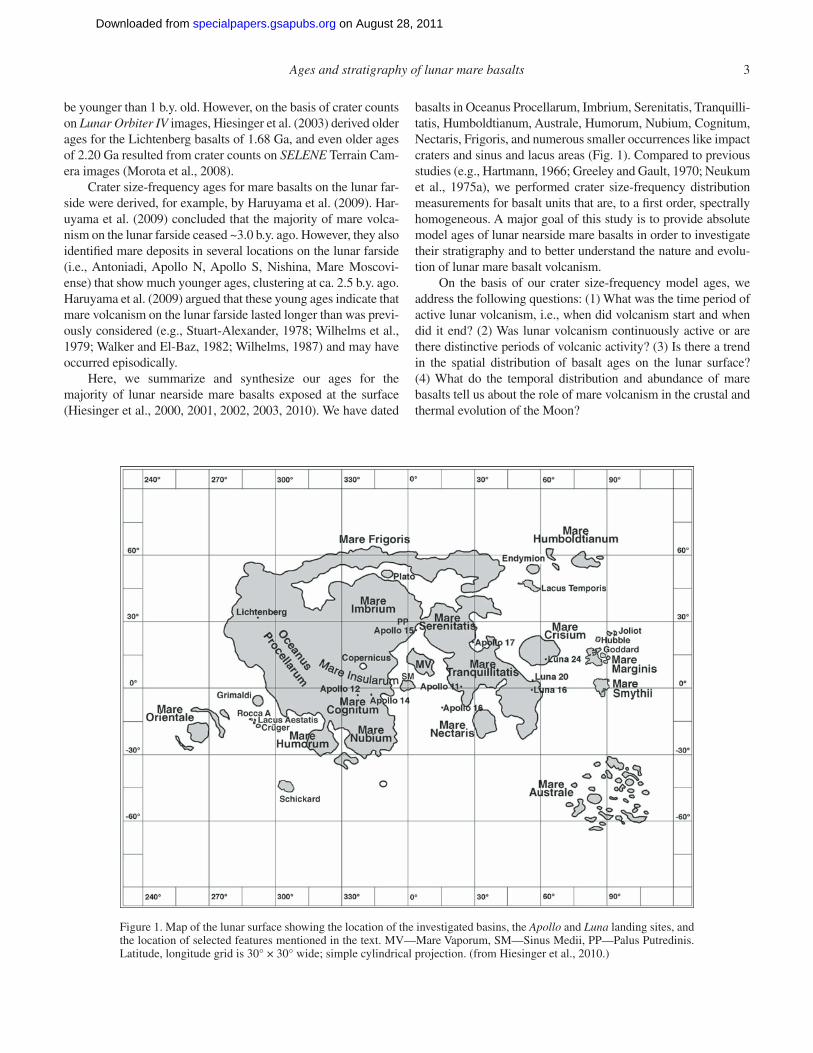
Here, we summarize and synthesize our ages for the majority of lunar nearside mare basalts exposed at the surface (Hiesinger et al., 2000, 2001, 2002, 2003, 2010). We have dated
basalts in Oceanus Procellarum, Imbrium, Serenitatis, Tranquilli-tatis, Humboldtianum, Australe, Humorum, Nubium, Cognitum, Nectaris, Frigoris, and numerous smaller occurrences like impact craters and sinus and lacus areas (Fig. 1). Compared to previous studies (e.g., Hartmann, 1966; Greeley and Gault, 1970; Neukum et al., 1975a), we performed crater size-frequency distribution measurements for basalt units that are, to a fi rst order, spectrally homogeneous. A major goal of this study is to provide absolute model ages of lunar nearside mare basalts in order to investigate their stratigraphy and to better understand the nature and evolu-tion of lunar mare basalt volcanism.
On the basis of our crater size-frequency model ages, we address the following questions: (1) What was the time period of active lunar volcanism, i.e., when did volcanism start and when did it end? (2) Was lunar volcanism continuously active or are there distinctive periods of volcanic activity? (3) Is there a trend in the spatial distribution of basalt ages on the lunar surface? (4) What do the temporal distribution and abundance of mare basalts tell us about the role of mare volcanism in the crustal and thermal evolution of the Moon?
Figure 1. Map of the lunar surface showing the location of the investigated basins, the Apollo and Luna landing sites, and the location of selected features mentioned in the text. MV—Mare Vaporum, SM—Sinus Medii, PP—Palus Putredinis. Latitude, longitude grid is 30° × 30° wide; simple cylindrical projection. (from Hiesinger et al., 2010.)
on August 28, 2011specialpapers.gsapubs.orgDownloaded from
4 Hiesinger et al.
TECHNIQUE, APPROACH, AND THE DEFINITION OF UNITS
Four methods have been used to derive the ages of lunar mare basalts, (1) radiometric investigations of lunar samples (e.g., Papanastassiou and Wasserburg, 1971; Tera and Wasser-burg, 1974a, 1974b; Husain, 1974; Nunes et al., 1974; Schaefer and Husain, 1974; Maurer et al., 1978; Guggisberg et al., 1979; Ryder and Spudis, 1980; BVSP, 1981; Taylor et al., 1983; Dasch et al., 1987; Nyquist and Shih, 1992; Nyquist et al., 2001; Gaff-ney et al., 2008), (2) studies of crater degradation stages (e.g., Soderblom, 1972; Boyce, 1976; Boyce and Johnson, 1978), (3) stratigraphic approaches (e.g., Shoemaker and Hackman, 1962; Wilhelms, 1970; Wilhelms, 1987), and (4) crater size-frequency distribution measurements (e.g., Hartmann, 1966; Greeley and Gault, 1970; Neukum et al., 1975b; Neukum, 1977; Hiesinger et al., 2000, 2003, 2010).
Radiometric investigations of lunar rocks in the laboratory are restricted to a relatively small number of returned samples and provide ages only for the close vicinity of the Luna and Apollo landing sites. Data derived from crater degradation stages can give us ages for the entire lunar surface, but numerous endo-genic and exogenic processes can infl uence the appearance of lunar impact craters, decreasing the certainty of age assignments. In addition, there are some discrepancies between crater degra-dation ages and radiometric ages for specifi c landing sites. Bur-gess and Turner (1998), for example, reported young radiometric 40Ar -39Ar ages (3.2–3.3 Ga) for the Luna 24 landing site, which are in disagreement with ages derived from crater degradation measurements (3.5 ± 0.1 Ga) by Boyce and Johnson (1978). For the Luna 24 landing site, Burgess and Turner (1998) concluded that crater degradation ages have to be reassessed in light of the new expanded radiometric age data. Using the ejecta blankets of impact craters as a stratigraphic marker horizon, Wilhelms (1987) was able to construct a moonwide relative stratigraphy by investigating superposition of ejecta blankets on each other. Additional application of the superposition criteria to mare basalt units (e.g., Head, 1976; Whitford-Stark, 1979; Whitford-Stark and Head, 1980) provided relative ages for the entire lunar sur-face and is one of the most important tools in geologic mapping and the interpretation of geologic processes on the Moon.
Crater size-frequency distribution measurements are a pow-erful remote-sensing technique to derive relative and absolute model ages of unsampled planetary surfaces. Since this technique is described elsewhere (e.g., Neukum and Ivanov, 1994; Hiesinger et al., 2000, 2003, 2010; Stöffl er and Ryder, 2001; Neukum et al., 2001; Ivanov, 2001; Hartmann and Neukum, 2001; Stöffl er et al., 2006; and references therein), we will only briefl y outline how crater size-frequency distribution measurements can be used to date surfaces. The technique of crater size-frequency distribution measurements on spectrally homogeneous regions, including a discussion of model assumptions, strengths, and shortcomings, and an error analysis, has been described in detail by Hiesinger et al. (2000). In short, in order to obtain the age of a photogeologi-
TABLE 1. COEFFICIENTS IN EQUATION 1*
Coefficient “Old” N(D) (Neukum, 1983)
“New” N(D)(Ivanov et al., 2001; Neukum et al., 2001)
8670.3– 0a –3.0876 9626.3– 1a –3.557528
a2 +0.4366 +0.781027a3 +0.7935 +1.021521a4 +0.0865 –0.156012a5 –0.2649 –0.444058a6 –0.0664 +0.019977a7 +0.0379 +0.086850a8 +0.0106 –0.005874a9 –0.0022 –0.006809a10 –5.18 × 10⁻⁴ +8.25 × 10⁻⁴
a11 +3.97 × 10⁻⁵ +5.54 × 10⁻⁵
*From Neukum et al. (2001).
cal unit, one has to (1) measure the surface area of the unit, and (2) measure the diameters of each primary impact crater within this unit. Obtained crater diameters are sorted into 18 bins per diameter decade (i.e., in the interval 1 ≤ D ≤ 10, we have the steps 1.0, 1.1, 1.2, 1.3, 1.4, 1.5, 1.7, 2.0, 2.5, 3.0, 3.5, 4.0, 4.5, 5.0, 6.0, 7.0, 8.0, 9.0, 10.0) and plotted as cumulative distributions (e.g., Arvidson et al., 1979), which give the number of craters larger than or equal to a certain diameter per area measured.
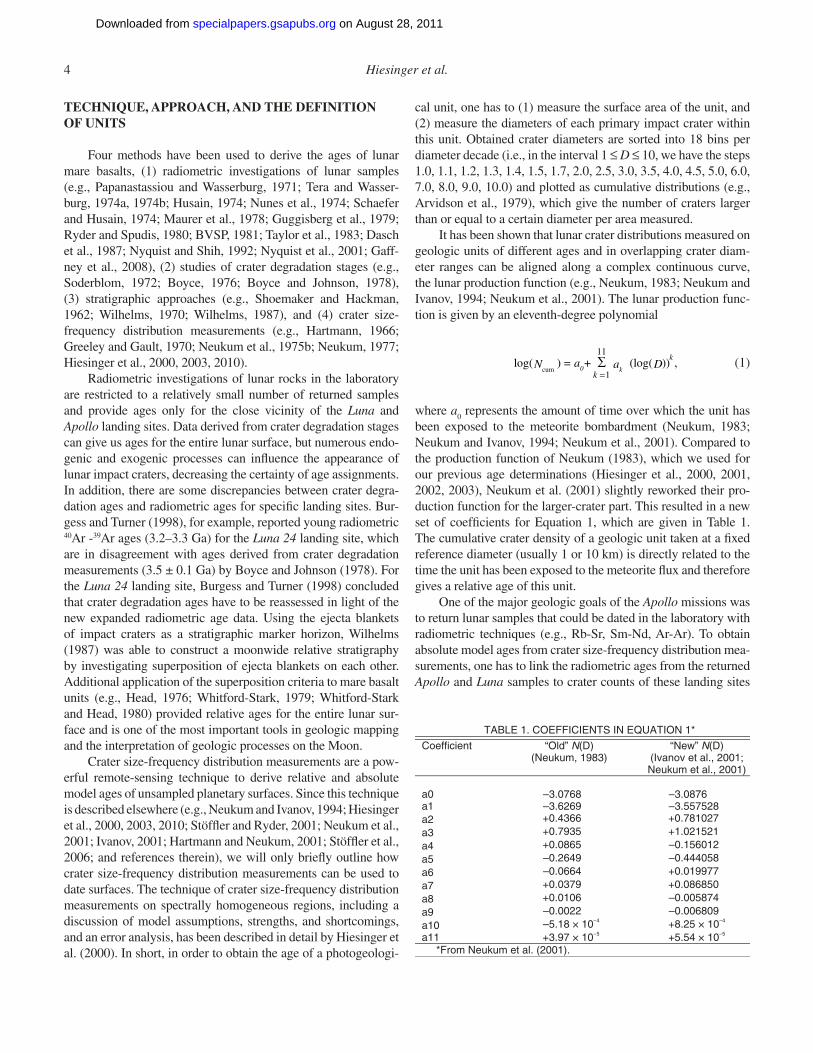
It has been shown that lunar crater distributions measured on geologic units of different ages and in overlapping crater diam-eter ranges can be aligned along a complex continuous curve, the lunar production function (e.g., Neukum, 1983; Neukum and Ivanov, 1994; Neukum et al., 2001). The lunar production func-tion is given by an eleventh-degree polynomial
11
log( ) = (log( ))1
ka
k DN
cumk∑=
a0+ , (1)
where a0 represents the amount of time over which the unit has
been exposed to the meteorite bombardment (Neukum, 1983; Neukum and Ivanov, 1994; Neukum et al., 2001). Compared to the production function of Neukum (1983), which we used for our previous age determinations (Hiesinger et al., 2000, 2001, 2002, 2003), Neukum et al. (2001) slightly reworked their pro-duction function for the larger-crater part. This resulted in a new set of coeffi cients for Equation 1, which are given in Table 1. The cumulative crater density of a geologic unit taken at a fi xed reference diameter (usually 1 or 10 km) is directly related to the time the unit has been exposed to the meteorite fl ux and therefore gives a relative age of this unit.
One of the major geologic goals of the Apollo missions was to return lunar samples that could be dated in the laboratory with radiometric techniques (e.g., Rb-Sr, Sm-Nd, Ar-Ar). To obtain absolute model ages from crater size-frequency distribution mea-surements, one has to link the radiometric ages from the returned Apollo and Luna samples to crater counts of these landing sites
on August 28, 2011specialpapers.gsapubs.orgDownloaded from
Ages and stratigraphy of lunar mare basalts 5
in order to establish the lunar cratering chronology (e.g., BVSP, 1981; Neukum, 1983; Strom and Neukum, 1988; Neukum and Ivanov, 1994; Stöffl er and Ryder, 2001). For this purpose, cra-ter counts for the Apollo 11, 12, 14, 15, 16, 17, and the Luna 16 and 24 landing sites were performed and correlated with the corresponding radiometric ages of these sites (e.g., BVSP, 1981; Neukum, 1983; Strom and Neukum, 1988; Neukum and Ivanov, 1994; Stöffl er and Ryder, 2001). However, this is not a trivial task and has led to several more or less different chronologies (e.g., BVSP, 1981; Neukum, 1983; Neukum and Ivanov, 1994; Stöffl er and Ryder, 2001; Stöffl er et al., 2006; and references therein). It is well known that lunar samples of each landing site show a range of radiometric ages, which is due to an unknown combina-tion of vertical and horizontal mixing (BVSP, 1981). For exam-ple, if the investigated sample is a breccia, the individual par-ticles can refl ect very different geologic histories and reset ages. For breccia 73215, Jessberger et al. (1977) reported variations in the K-Ar ages of up to 300 m.y., and this raises the issue of which radiometric age should be assigned to the corresponding crater size-frequency distribution. In principle, there are two pos-sibilities for correlating crater size-frequency distributions with radiometric ages, i.e., the correlation with the most frequently measured age (e.g., Neukum and Ivanov, 1994; Neukum, 1983; Neukum et al., 1975a) or with the youngest age (e.g., Jessberger et al., 1974; BVSP, 1981; Wilhelms, 1987). Neukum (1983) and Neukum and Ivanov (1994) argued that the “peak age” is the age that most likely refl ects the major event/impact that reset the radiometric clocks of most samples, whereas the youngest age might only represent smaller local impacts that occurred after the main impact. The reasoning for adopting the peak age is dis-cussed in greater detail by Neukum and Ivanov (1994).
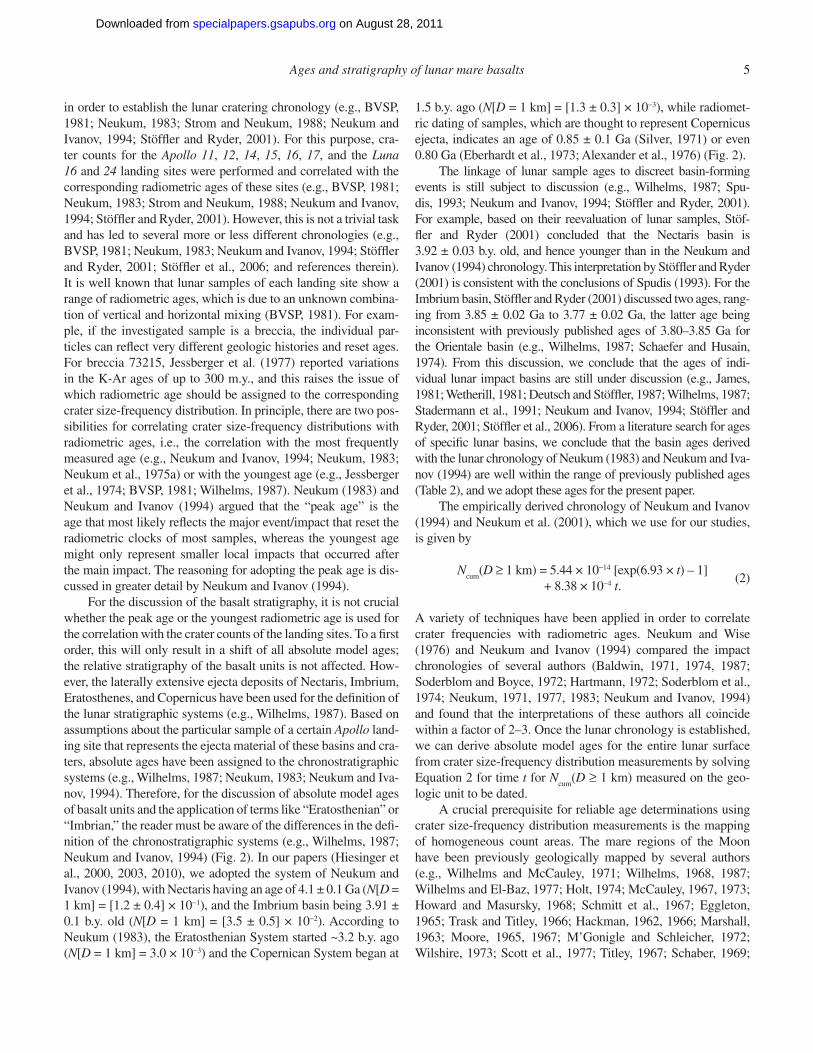
For the discussion of the basalt stratigraphy, it is not crucial whether the peak age or the youngest radiometric age is used for the correlation with the crater counts of the landing sites. To a fi rst order, this will only result in a shift of all absolute model ages; the relative stratigraphy of the basalt units is not affected. How-ever, the laterally extensive ejecta deposits of Nectaris, Imbrium, Eratosthenes, and Copernicus have been used for the defi nition of the lunar stratigraphic systems (e.g., Wilhelms, 1987). Based on assumptions about the particular sample of a certain Apollo land-ing site that represents the ejecta material of these basins and cra-ters, absolute ages have been assigned to the chronostratigraphic systems (e.g., Wilhelms, 1987; Neukum, 1983; Neukum and Iva-nov, 1994). Therefore, for the discussion of absolute model ages of basalt units and the application of terms like “Eratosthenian” or “Imbrian,” the reader must be aware of the differences in the defi -nition of the chronostratigraphic systems (e.g., Wilhelms, 1987; Neukum and Ivanov, 1994) (Fig. 2). In our papers (Hiesinger et al., 2000, 2003, 2010), we adopted the system of Neukum and Ivanov (1994), with Nectaris having an age of 4.1 ± 0.1 Ga (N[D = 1 km] = [1.2 ± 0.4] × 10−1), and the Imbrium basin being 3.91 ± 0.1 b.y. old (N[D = 1 km] = [3.5 ± 0.5] × 10−2). According to Neukum (1983), the Eratosthenian System started ~3.2 b.y. ago (N[D = 1 km] = 3.0 × 10⁻³) and the Copernican System began at
1.5 b.y. ago (N[D = 1 km] = [1.3 ± 0.3] × 10−3), while radiomet-ric dating of samples, which are thought to represent Copernicus ejecta, indicates an age of 0.85 ± 0.1 Ga (Silver, 1971) or even 0.80 Ga (Eberhardt et al., 1973; Alexander et al., 1976) (Fig. 2).
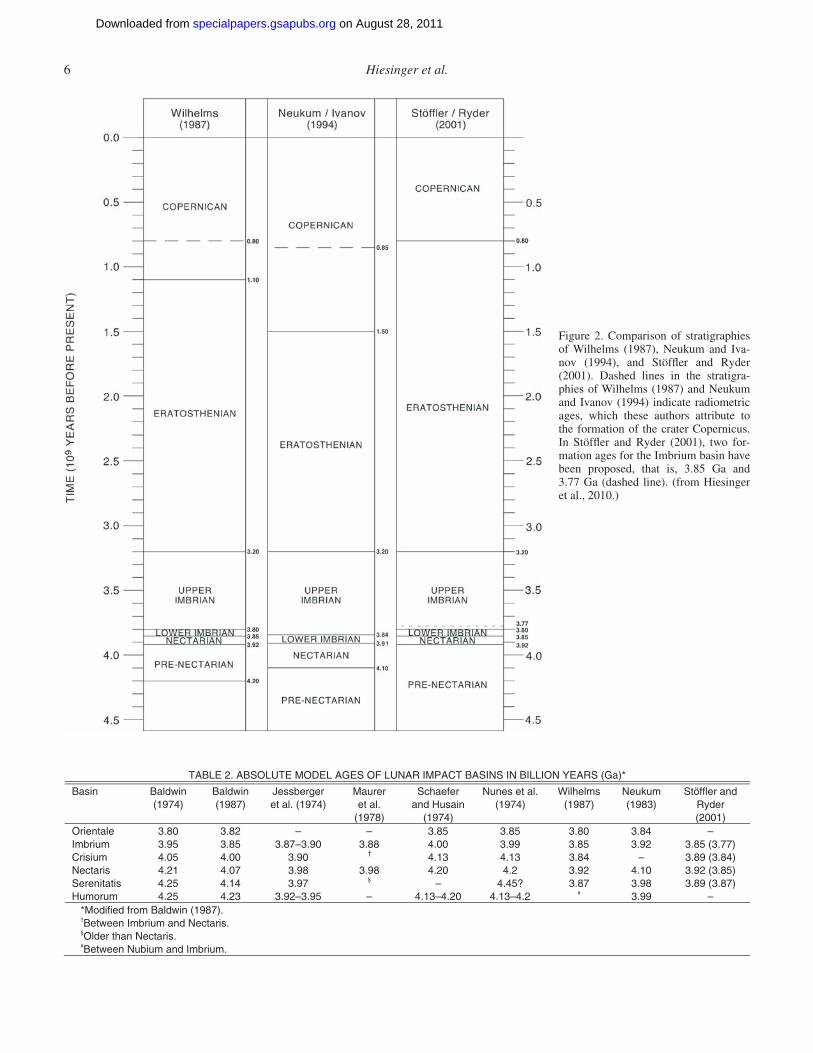
The linkage of lunar sample ages to discreet basin-forming events is still subject to discussion (e.g., Wilhelms, 1987; Spu-dis, 1993; Neukum and Ivanov, 1994; Stöffl er and Ryder, 2001). For example, based on their reevaluation of lunar samples, Stöf-fl er and Ryder (2001) concluded that the Nectaris basin is 3.92 ± 0.03 b.y. old, and hence younger than in the Neukum and Ivanov (1994) chronology. This interpretation by Stöffl er and Ryder (2001) is consistent with the conclusions of Spudis (1993). For the Imbrium basin, Stöffl er and Ryder (2001) discussed two ages, rang-ing from 3.85 ± 0.02 Ga to 3.77 ± 0.02 Ga, the latter age being inconsistent with previously published ages of 3.80–3.85 Ga for the Orientale basin (e.g., Wilhelms, 1987; Schaefer and Husain, 1974). From this discussion, we conclude that the ages of indi-vidual lunar impact basins are still under discussion (e.g., James, 1981; Wetherill, 1981; Deutsch and Stöffl er, 1987; Wilhelms, 1987; Stadermann et al., 1991; Neukum and Ivanov, 1994; Stöffl er and Ryder, 2001; Stöffl er et al., 2006). From a literature search for ages of specifi c lunar basins, we conclude that the basin ages derived with the lunar chronology of Neukum (1983) and Neukum and Iva-nov (1994) are well within the range of previously published ages (Table 2), and we adopt these ages for the present paper.
The empirically derived chronology of Neukum and Ivanov (1994) and Neukum et al. (2001), which we use for our studies, is given by
Ncum
(D ≥ 1 km) = 5.44 × 10⁻¹⁴ [exp(6.93 × t) – 1] + 8.38 × 10⁻⁴ t.
(2)
A variety of techniques have been applied in order to correlate crater frequencies with radiometric ages. Neukum and Wise (1976) and Neukum and Ivanov (1994) compared the impact chronologies of several authors (Baldwin, 1971, 1974, 1987; Soderblom and Boyce, 1972; Hartmann, 1972; Soderblom et al., 1974; Neukum, 1971, 1977, 1983; Neukum and Ivanov, 1994) and found that the interpretations of these authors all coincide within a factor of 2–3. Once the lunar chronology is established, we can derive absolute model ages for the entire lunar surface from crater size-frequency distribution measurements by solving Equation 2 for time t for N
cum(D ≥ 1 km) measured on the geo-
logic unit to be dated.A crucial prerequisite for reliable age determinations using
crater size-frequency distribution measurements is the mapping of homogeneous count areas. The mare regions of the Moon have been previously geologically mapped by several authors (e.g., Wilhelms and McCauley, 1971; Wilhelms, 1968, 1987; Wilhelms and El-Baz, 1977; Holt, 1974; McCauley, 1967, 1973; Howard and Masursky, 1968; Schmitt et al., 1967; Eggleton, 1965; Trask and Titley, 1966; Hackman, 1962, 1966; Marshall, 1963; Moore, 1965, 1967; M’Gonigle and Schleicher, 1972; Wilshire, 1973; Scott et al., 1977; Titley, 1967; Schaber, 1969;
on August 28, 2011specialpapers.gsapubs.orgDownloaded from
6 Hiesinger et al.
Figure 2. Comparison of stratigraphies of Wilhelms (1987), Neukum and Iva-nov (1994), and Stöffl er and Ryder (2001). Dashed lines in the stratigra-phies of Wilhelms (1987) and Neukum and Ivanov (1994) indicate radiometric ages, which these authors attribute to the formation of the crater Copernicus. In Stöffl er and Ryder (2001), two for-mation ages for the Imbrium basin have been proposed, that is, 3.85 Ga and 3.77 Ga (dashed line). (from Hiesinger et al., 2010.)
TABLE 2. ABSOLUTE MODEL AGES OF LUNAR IMPACT BASINS IN BILLION YEARS (Ga)*
Basin Baldwin (1974)
Baldwin (1987)
Jessberger et al. (1974)
Maurer et al.
(1978)
Schaefer and Husain
(1974)
Nunes et al. (1974)
Wilhelms (1987)
Neukum (1983)
Stöffler and Ryder (2001)
Orientale 3.80 3.82 – – 3.85 3.85 3.80 3.84 – Imbrium 3.95 3.85 3.87–3.90 3.88 4.00 3.99 3.85 3.92 3.85 (3.77) Crisium 4.05 4.00 3.90 † 4.13 4.13 3.84 – 3.89 (3.84) Nectaris 4.21 4.07 3.98 3.98 4.20 4.2 3.92 4.10 3.92 (3.85) Serenitatis 4.25 4.14 3.97 § – 4.45? 3.87 3.98 3.89 (3.87) Humorum 4.25 4.23 3.92–3.95 – 4.13–4.20 4.13–4.2 # 3.99 – *Modified from Baldwin (1987). †Between Imbrium and Nectaris. §Older than Nectaris. #Between Nubium and Imbrium.
on August 28, 2011specialpapers.gsapubs.orgDownloaded from
Ages and stratigraphy of lunar mare basalts 7
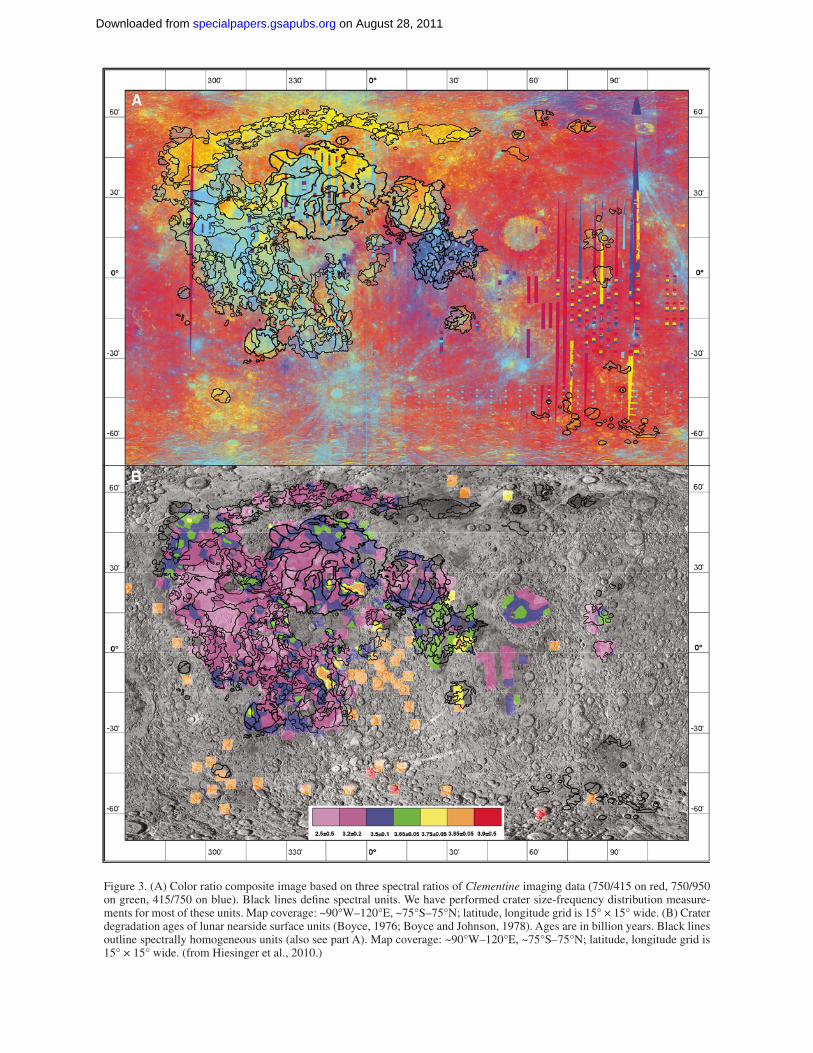
Ulrich, 1969; Scott and Eggleton, 1973; Lucchitta, 1972, 1978; Karlstrom, 1974; Scott et al., 1977). However, because the defi ni-tion of geologic units in these maps was based mainly on albedo differences, morphology, and qualitative crater densities on tele-scopic and Lunar Orbiter images, these maps are not detailed enough to ensure homogeneity of the investigated basalts. It is known that regional spectral differences of surface materials can be mapped by using ratios of various spectral bands to bring out diagnostic spectral features (e.g., Whitaker, 1972; McCord et al., 1976; Johnson et al., 1977a, 1977b; Pieters, 1978; Head et al., 1993). Regions where the spectral signature is homogeneous can be interpreted as surface mare units that are relatively uniform in surface composition, and thus may plausibly be interpreted to represent single eruptive episodes. Thus, we used a multi-spectral high-resolution Clementine color ratio composite (e.g., 750/415 ratio as red, 750/950 ratio as green, and 415/750 ratio as blue) in order to map the distribution of distinctive basalt units (Fig. 3A). In this color scheme, variations in the extended vis-ible continuum slope are shown as red (high 750/415) to blue (high 415/750) variations. These ratios are interpreted to refl ect variations in soil or surface material maturity (e.g., Pieters, 1993, and references therein). Variations in the 1 µm region of the electromagnetic spectrum add yellow and green hues for larger 750/950 values. This implies stronger 1 µm absorptions, fl atter continuum slope, or both. The depth of the 1 µm absorption band is correlated with the Fe abundance (e.g., Pieters, 1993, and ref-erences therein). Thus, most of the spectral variation within an image is captured by this color ratio composite (Pieters et al., 1994). Because this color ratio emphasizes subtle spectral dif-ferences, it was used to visually determine the boundaries of our spectrally homogeneous units. We did not apply stringent statisti-cal techniques to ensure accurate outlines of these spectral units because this is not too critical for our study since our count areas are usually only subsets of each spectral unit, i.e., the count areas are located somewhere within the spectral units. For our count areas, we selected only regions with visually homogeneous color. For the defi nition of our spectral units, we also used the informa-tion from U.S. Geological Survey (USGS) geologic maps (e.g., Wilhelms and McCauley, 1971), as well as other previously pub-lished maps (e.g., Schaber, 1973; Schaber et al., 1976; Pieters, 1978; Whitford-Stark and Head, 1980; Whitford-Stark, 1990), in order to incorporate all relevant information for our unit defi ni-tion. Visually, these older morphologic and spectral maps cor-relate well with our defi nition of spectral units. However, we expanded on these previous studies by defi ning many more units in previously uncharted regions. We assume that because of the spectral homogeneity, each of our spectrally defi ned units repre-sents a single eruptive phase. We defi ne “single eruptive phase” as consisting of all deposits that were emplaced within a rea-sonably short period of time with similar composition. Such a single eruptive phase may consist of a single basalt fl ow or of several breakout fl ows forming during the same eruption. Having defi ned such units in Clementine images, we transferred the unit boundaries to high-resolution Lunar Orbiter IV images in order
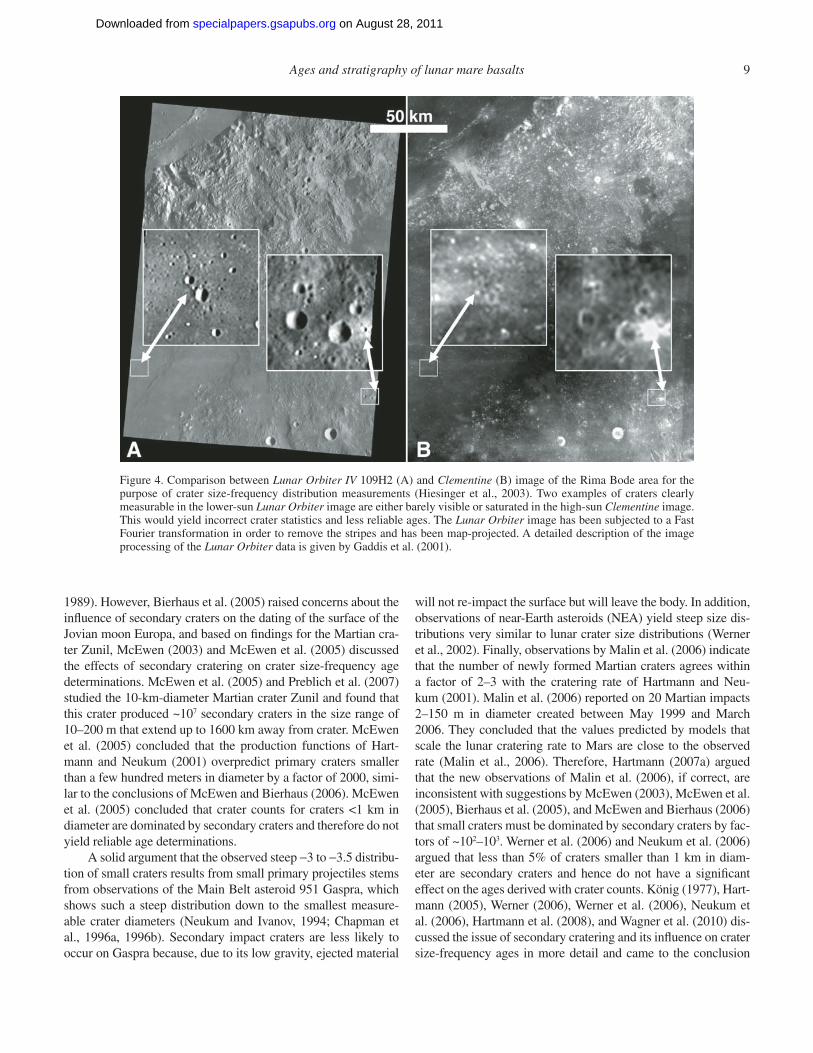
to measure the crater size-frequency distribution. This was neces-sary because Clementine images are not very well suited for cra-ter counts due to their high sun angles. Figure 4 is a comparison of a Lunar Orbiter image and a Clementine image, and it illus-trates the differences in the ability to detect small craters in these two data sets. The detailed views show that some craters that are clearly visible in the Lunar Orbiter image are barely detectable and certainly not countable in the Clementine image. Because miscounting certain craters has profound effects on the quality of the crater size-frequency distribution measurement, and hence the age of an investigated unit, we chose not to perform crater counts on Clementine material. Despite their excellent quality, we also chose not to count on Apollo metric camera or panoramic images because only Lunar Orbiter images provide a systematic coverage of all investigated mare areas. Compared to previous age determinations, our data fi t spectral and lithological units and represent a major improvement in accuracy.
The method of crater size-frequency measurements is gen-erally dependent on the quality, i.e., the spatial resolution and the illumination conditions, of the images on which the crater counts are performed. Contrast, brightness, and resolution of the images used for crater counts are important parameters because all can have infl uence on the detectability of craters, especially on dark mantle deposits. In our studies, we relied on high-resolution imaging data provided by the Lunar Orbiter IV mission in 1967 to determine lunar surface ages. Even more than 40 years after the Lunar Orbiter IV mission, its images, with a spatial resolu-tion of 60–150 m, an incidence angle of 10°–30°, and excellent contrast, are still extremely well suited and useful for the acquisi-tion of crater size-frequency distributions. However, new images from the American Lunar Reconnaissance Orbiter, the Chinese Chang’e, the Japanese SELENE/Kaguya, and the Indian Chan-drayaan missions will soon supersede the Lunar Orbiter images in spatial resolution, coverage, and illumination geometry, allow-ing us to globally perform highly accurate crater counts.
Potential errors in the determination of relative ages using crater size-frequency distribution measurements can be caused by several factors. Errors in the determination of the size of the measured area, errors in the determination of crater diameters on monoscopic images, and errors caused by volcanic craters are negligible (Neukum et al., 1975b; Engel, 1986). Errors introduced by different crater sizes due to differences in target material are irrelevant because we dated only lunar mare basalts. Therefore, it is reasonable to assume that the physical properties (i.e., density) that might infl uence the crater size are very similar for all these basalts. Neukum et al. (1975b) discussed the infl uence of factors such as fl ooding, blanketing, secondary cratering, superposition, infi lling, abrasion, mass wasting, and volcanic craters in great detail. Secondary craters form from ejected material of a primary crater and hence are not correlated to the impact rate. Most of those secondary craters can be readily identifi ed and excluded from crater counts by their appearance in clusters, crater chains, elongated or irregular outline, and the herringbone pattern of their ejecta (Oberbeck and Morrison, 1973; Pike, 1980; Melosh,
on August 28, 2011specialpapers.gsapubs.orgDownloaded from
8 Hiesinger et al.
Figure 3. (A) Color ratio composite image based on three spectral ratios of Clementine imaging data (750/415 on red, 750/950 on green, 415/750 on blue). Black lines defi ne spectral units. We have performed crater size-frequency distribution measure-ments for most of these units. Map coverage: ~90°W–120°E, ~75°S–75°N; latitude, longitude grid is 15° × 15° wide. (B) Crater degradation ages of lunar nearside surface units (Boyce, 1976; Boyce and Johnson, 1978). Ages are in billion years. Black lines outline spectrally homogeneous units (also see part A). Map coverage: ~90°W–120°E, ~75°S–75°N; latitude, longitude grid is 15° × 15° wide. (from Hiesinger et al., 2010.)
on August 28, 2011specialpapers.gsapubs.orgDownloaded from
Ages and stratigraphy of lunar mare basalts 9
1989). However, Bierhaus et al. (2005) raised concerns about the infl uence of secondary craters on the dating of the surface of the Jovian moon Europa, and based on fi ndings for the Martian cra-ter Zunil, McEwen (2003) and McEwen et al. (2005) discussed the effects of secondary cratering on crater size-frequency age determinations. McEwen et al. (2005) and Preblich et al. (2007) studied the 10-km-diameter Martian crater Zunil and found that this crater produced ~107 secondary craters in the size range of 10–200 m that extend up to 1600 km away from crater. McEwen et al. (2005) concluded that the production functions of Hart-mann and Neukum (2001) overpredict primary craters smaller than a few hundred meters in diameter by a factor of 2000, simi-lar to the conclusions of McEwen and Bierhaus (2006). McEwen et al. (2005) concluded that crater counts for craters <1 km in diameter are dominated by secondary craters and therefore do not yield reliable age determinations.
A solid argument that the observed steep −3 to −3.5 distribu-tion of small craters results from small primary projectiles stems from observations of the Main Belt asteroid 951 Gaspra, which shows such a steep distribution down to the smallest measure-able crater diameters (Neukum and Ivanov, 1994; Chapman et al., 1996a, 1996b). Secondary impact craters are less likely to occur on Gaspra because, due to its low gravity, ejected material
will not re-impact the surface but will leave the body. In addition, observations of near-Earth asteroids (NEA) yield steep size dis-tributions very similar to lunar crater size distributions (Werner et al., 2002). Finally, observations by Malin et al. (2006) indicate that the number of newly formed Martian craters agrees within a factor of 2–3 with the cratering rate of Hartmann and Neu-kum (2001). Malin et al. (2006) reported on 20 Martian impacts 2–150 m in diameter created between May 1999 and March 2006. They concluded that the values predicted by models that scale the lunar cratering rate to Mars are close to the observed rate (Malin et al., 2006). Therefore, Hartmann (2007a) argued that the new observations of Malin et al. (2006), if correct, are inconsistent with suggestions by McEwen (2003), McEwen et al. (2005), Bierhaus et al. (2005), and McEwen and Bierhaus (2006) that small craters must be dominated by secondary craters by fac-tors of ~102–103. Werner et al. (2006) and Neukum et al. (2006) argued that less than 5% of craters smaller than 1 km in diam-eter are secondary craters and hence do not have a signifi cant effect on the ages derived with crater counts. König (1977), Hart-mann (2005), Werner (2006), Werner et al. (2006), Neukum et al. (2006), Hartmann et al. (2008), and Wagner et al. (2010) dis-cussed the issue of secondary cratering and its infl uence on crater size-frequency ages in more detail and came to the conclusion
Figure 4. Comparison between Lunar Orbiter IV 109H2 (A) and Clementine (B) image of the Rima Bode area for the purpose of crater size-frequency distribution measurements (Hiesinger et al., 2003). Two examples of craters clearly measurable in the lower-sun Lunar Orbiter image are either barely visible or saturated in the high-sun Clementine image. This would yield incorrect crater statistics and less reliable ages. The Lunar Orbiter image has been subjected to a Fast Fourier transformation in order to remove the stripes and has been map-projected. A detailed description of the image processing of the Lunar Orbiter data is given by Gaddis et al. (2001).
on August 28, 2011specialpapers.gsapubs.orgDownloaded from
10 Hiesinger et al.
that secondary cratering does not pose a signifi cant problem for dating of planetary surfaces using crater size-frequency distribu-tion measurements. While the effect of secondary impact cra-tering on the production function of small craters is a matter of ongoing debate (e.g., Hartmann, 2007a, 2007b), it is of lesser importance for our crater counts because the spatial resolution of the Lunar Orbiter IV images of 60–100 m (Wilhelms, 1987) only allowed us to count craters larger than ~300–400 m, and these smallest craters were not even used for the determination of our ages.
The level of uncertainty of the crater retention age of a given count is given by the following equation:
(1) (1)
logN
N N
A
⎡ ⎤±±σ = ⎢ ⎥⎣ ⎦
, (3)
in which N(1) is the crater retention age calculated for craters of 1 km diameter, and A is the size of the counted area. The ±σ
N value gives the upper and lower limits of the error bar
of the crater retention age, which are used for estimating the uncertainty of the absolute crater model age from the cratering chronology. We principally assumed that the cratering chronol-ogy is free of errors. Therefore, errors in our absolute model ages are only caused by errors in the determination of crater frequencies (Neukum, 1983). Neukum et al. (1975a) estimated the systematic uncertainty of the standard distribution curve or the measurement to be <10% for 0.8 km ≤ D ≤ 3 km (this is the diameter range of most of our crater counts) and up to 25% for 0.8 km ≤ D ≤ 10 km.
In order to facilitate the discussion of our model ages, we avoided assigning type locality names to each unit. Instead, we rely on a simple letter/number system. The letter indicates the basin (A—Australe, H—Humorum, Hu—Humboldtianum, I—Imbrium, S—Serenitatis, T—Tranquillitatis, P—Oceanus Pro-cellarum, N—Mare Nubium, C—Mare Cognitum, IN—Mare Insularum, F—Mare Frigoris, V—Mare Vaporum, Ma—Mare Marginis, Sy—Mare Smythii, SM—Sinus Medii, LT—Lacus Temporis, LA—Lacus Aestatis, PP—Palus Putredinis, CGr—Grimaldi, CCr—Crüger, CRo—Rocca A, CSc—Schickard, CHu—Hubble, CJo—Joliot, CGo—Goddard), and the number describes the unit within a basin. In a style similar to the geologic maps of the Moon, lower numbers refl ect older units, and higher numbers indicate a younger age.
RESULTS
Oceanus Procellarum
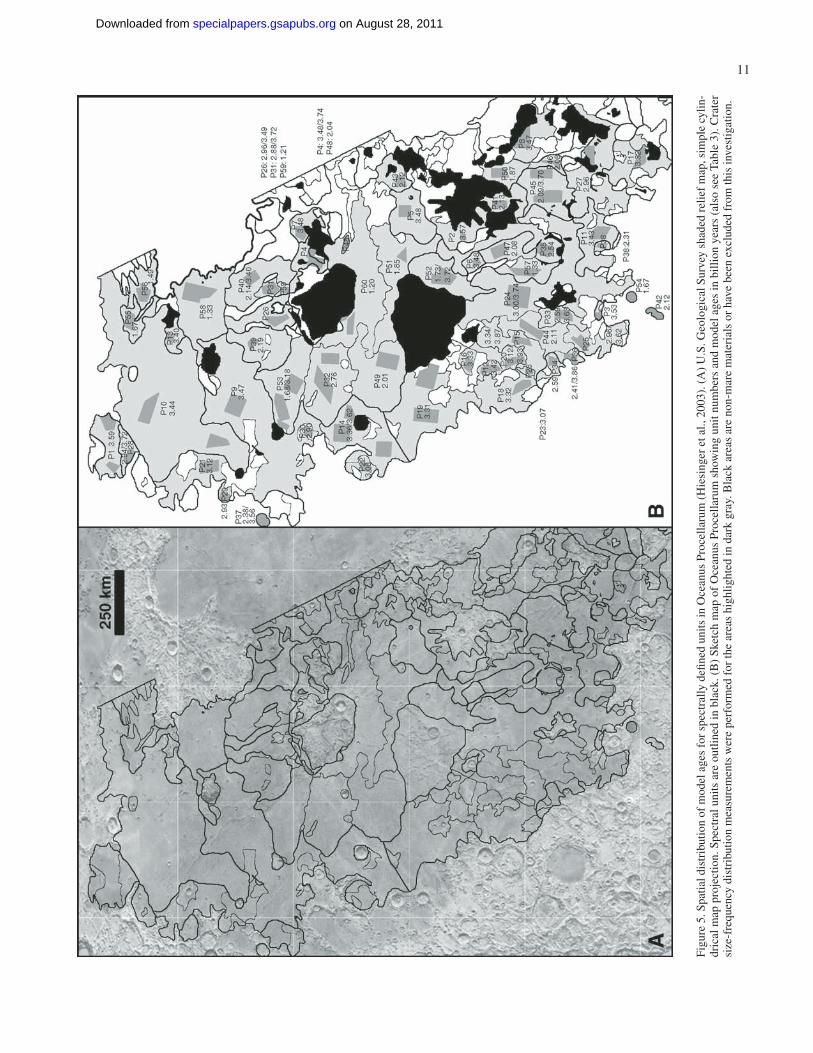
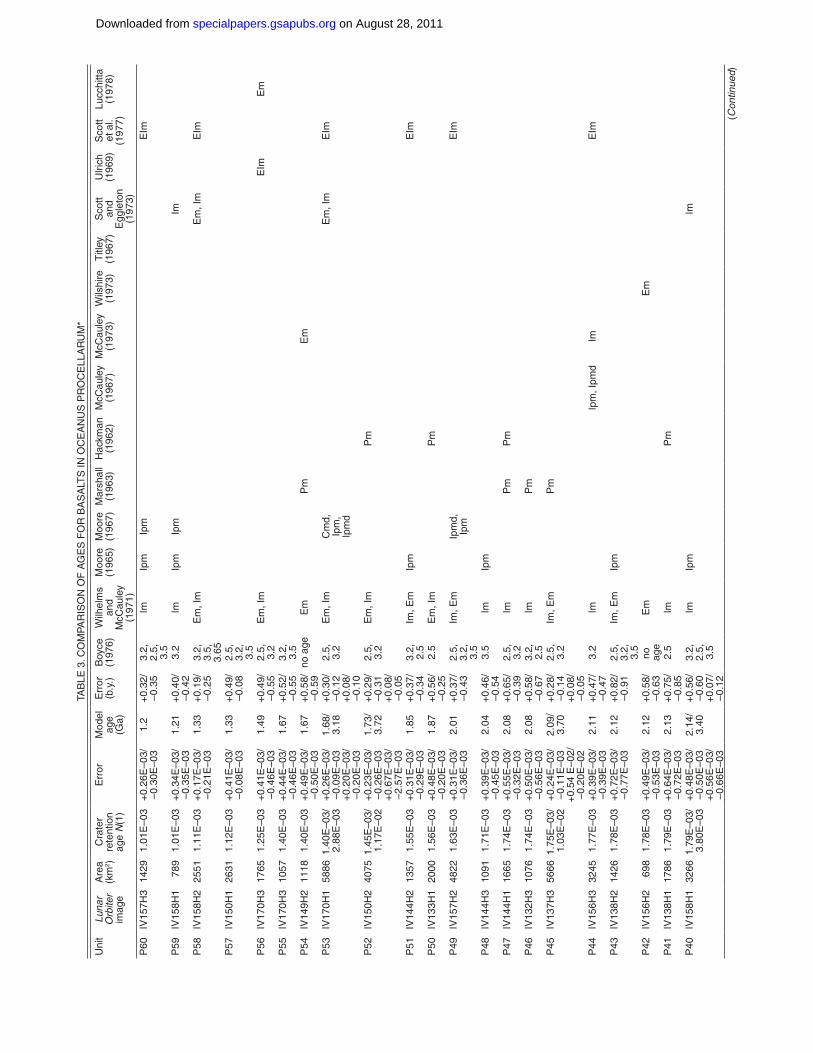
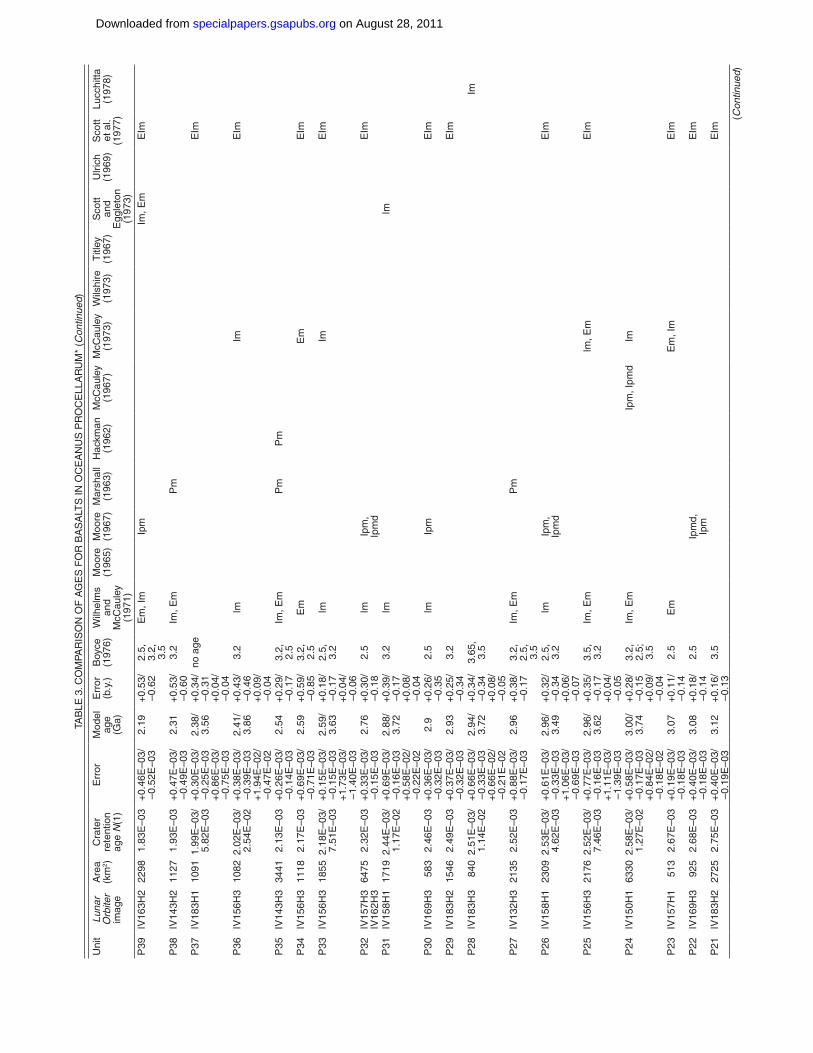
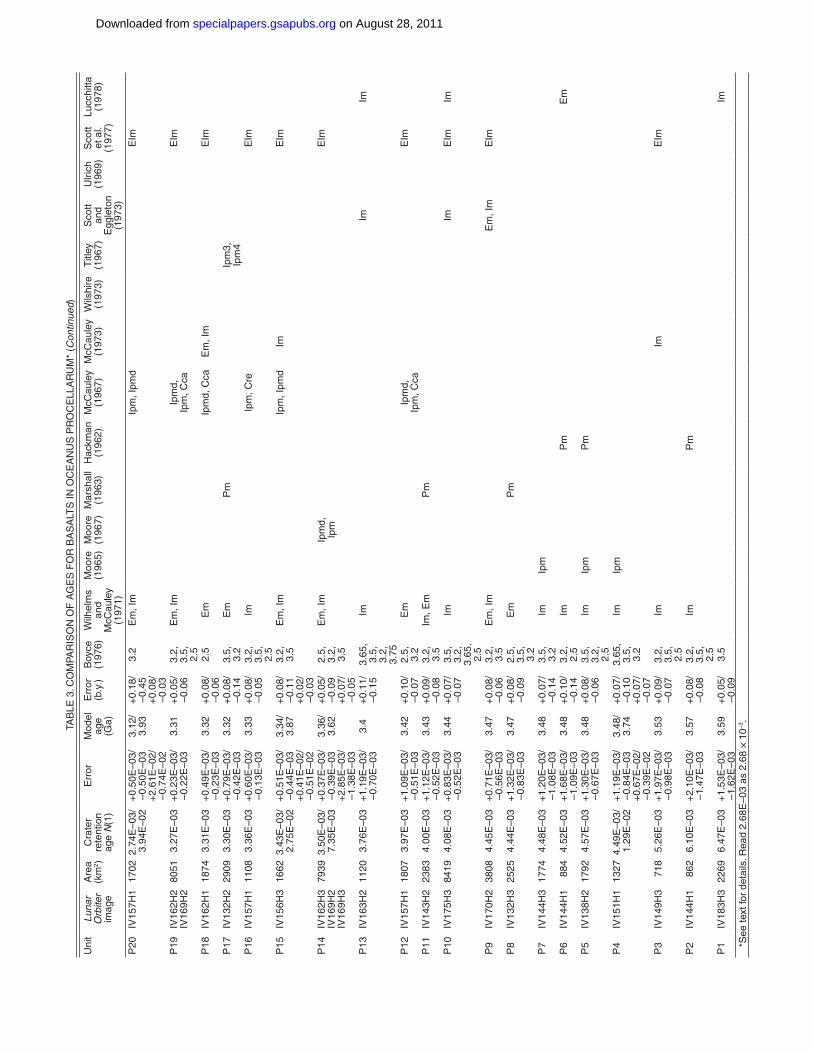
Based on our crater size-frequency distributions, we con-clude that basalt model ages in Oceanus Procellarum range from ca. 1.2 to ca. 3.93 Ga (Hiesinger et al., 2003) (Fig. 5; Table 3). Sixteen units, that is ~25% of all dated units, show characteris-tic kinks in their crater size-frequency distributions, which have
been interpreted by Neukum and Horn (1976) to indicate resur-facing, i.e., fl ooding with subsequent lavas.
In Oceanus Procellarum, we dated 60 units. Using the chro-nostratigraphic system of Neukum and Ivanov (1994), basalts of 19 units are Imbrian in age. For three of these 19 units, we were able to detect late-stage fl ooding events during the Imbrian Period. Thirty-six units in Oceanus Procellarum are Eratos-thenian in age, and 13 of them also show older Imbrian ages. Finally, if we apply the chronostratigraphic system of Neukum and Ivanov (1994), fi ve basalt units are of Copernican age. If one uses the chronostratigraphic system of Wilhelms (1987) or Stöf-fl er and Ryder (2001), these basalts would be of Eratosthenian age (Fig. 2).
Earlier attempts to measure the ages of surface units relied on crater degradation stages (e.g., Boyce, 1976; Boyce and John-son, 1978). Crater degradation ages of Boyce (1976) and Boyce and Johnson (1978) were performed for 1/4° squares (~8 km), were interpolated by spatial fi ltering into a continuous image, and do not necessarily fi t lithological or spectral units (Fig. 3B). While units P1, P18, P20, P21, P22, P23, P29, P30, P31, P32, P36, P38, P41, P44, P48, P50, and P59 exhibit a single degrada-tion age, all other units show at least two, and some units (P10, P13) show up to four different ages in the map of Boyce and Johnson (1978). The implication is that ages derived from the map of Boyce and Johnson (1978) can vary up to 1.25 b.y. for a single spectral unit. In numerous cases (P2, P3, P4, P8, P9, P11, P13, P14, P17, P24, P26, P27, P34, P35), the ages of Boyce (1976) and Boyce and Johnson (1978) give us an upper and lower boundary, and our ages are either right in between or close to one or the other boundary (Table 3). In other cases (P1, P5, P7, P10, P15, P16, P19, P33), the spatially most abundant age of Boyce (1976) and Boyce and Johnson (1978) is similar to our age of a particular unit. Generally, we fi nd a good agreement of our ages with ages of Boyce (1976) and Boyce and Johnson (1978) for units of Imbrian age. Only units P6 and P12 appear to be older than in the maps of Boyce (1976) and Boyce and Johnson (1978). Ages of units that are young according to our data are systemati-cally overestimated in age (older) in the Boyce map (P25, P28, P39, P43, P46, P47, P49, P51, P55, P56, P57, P58, P60), and we fi nd less agreement for younger units, i.e., late Eratosthenian and Copernican units. Units P40, P45, P52, and P53 show evidence for resurfacing, with both ages bracketing or being similar to the Boyce ages. Finally, units P37, P42, and P54 are not covered in the Boyce map.
Units P1, P2, P3, P4, P5, and P7 were mapped as Imbrian in age in the geologic maps of Wilhelms and McCauley (1971), Moore (1965), McCauley (1967), and Lucchitta (1978). Our data confi rm an Imbrian age for these units and also confi rm Wilhelms and McCauley’s Imbrian ages for units P10, P14, and P16. Luc-chitta (1978) mapped unit P6 as Eratosthenian, and Scott et al. (1977) mapped several units (P3, P9, P10, P12, P14, P15, P16, P18, P19) as Imbrian and/or Eratosthenian in age. Our data only show Imbrian ages and no Eratosthenian ages for these units. For unit P8, P9, P11, P12, P14, P15, P17, P18, and P19, Eratosthenian
on August 28, 2011specialpapers.gsapubs.orgDownloaded from
Ages and stratigraphy of lunar mare basalts 11
Figu
re 5
. Spa
tial d
istr
ibut
ion
of m
odel
age
s fo
r sp
ectr
ally
defi
ned
uni
ts in
Oce
anus
Pro
cella
rum
(H
iesi
nger
et a
l., 2
003)
. (A
) U
.S. G
eolo
gica
l Sur
vey
shad
ed r
elie
f m
ap, s
impl
e cy
lin-
dric
al m
ap p
roje
ctio
n. S
pect
ral u
nits
are
out
lined
in b
lack
. (B
) Sk
etch
map
of
Oce
anus
Pro
cella
rum
sho
win
g un
it nu
mbe
rs a
nd m
odel
age
s in
bill
ion
year
s (a
lso
see
Tabl
e 3)
. Cra
ter
size
-fre
quen
cy d
istr
ibut
ion
mea
sure
men
ts w
ere
perf
orm
ed f
or th
e ar
eas
high
light
ed in
dar
k gr
ay. B
lack
are
as a
re n
on-m
are
mat
eria
ls o
r ha
ve b
een
excl
uded
fro
m th
is in
vest
igat
ion.
on August 28, 2011specialpapers.gsapubs.orgDownloaded from
12 Hiesinger et al.TA
BLE
3. C
OM
PAR
ISO
N O
F A
GE
S F
OR
BA
SA
LTS
IN O
CE
AN
US
PR
OC
ELL
AR
UM
*
Uni
tLu
nar
Orb
iter
imag
e
Are
a(k
m2 )
Cra
ter
rete
ntio
n ag
e N
(1)
Err
orM
odel
ag
e (G
a)
Err
or(b
.y.)
Boy
ce(1
976)
Wilh
elm
s an
d M
cCau
ley
(197
1)
Moo
re(1
965)
Moo
re(1
967)
Mar
shal
l(1
963)
Hac
kman
(196
2)M
cCau
ley
(196
7)M
cCau
ley
(197
3)W
ilshi
re(1
973)
Titl
ey(1
967)
Sco
tt an
d E
ggle
ton
(197
3)
Ulri
ch(1
969)
Sco
tt et
al.
(197
7)
Lucc
hitta
(197
8)
P60
IV15
7H3
1429
1.01
E–0
3+
0.26
E–0
3/–0
.30E
–03
1.2
+0.
32/
–0.3
53.
2,
2.5,
3.
5
ImIp
mIp
mE
Im
P59
IV15
8H1
789
1.01
E–0
3+
0.34
E–0
3/–0
.35E
–03
1.21
+0.
40/
–0.4
23.
2Im
Ipm
Ipm
Im
P58
IV15
8H2
2551
1.11
E–0
3+
0.17
E–0
3/–0
.21E
–03
1.33
+0.
19/
–0.2
53.
2,
3.5,
3.
65
Em
, Im
Em
, Im
EIm
P57
IV15
0H1
2631
1.12
E–0
3+
0.41
E–0
3/–0
.08E
–03
1.33
+0.
49/
–0.0
82.
5,
3.2,
3.
5P
56IV
170H
317
651.
25E
–03
+0.
41E
–03/
–0.4
6E–0
31.
49+
0.49
/–0
.55
2.5,
3.
2E
m, I
mE
ImE
m
P55
IV17
0H3
1057
1.40
E–0
3+
0.44
E–0
3/–0
.46E
–03
1.67
+0.
52/
–0.5
53.
2,
3.5
P54
IV14
9H2
1118
1.40
E–0
3+
0.49
E–0
3/–0
.50E
–03
1.67
+0.
58/
–0.5
9no
age
Em
Pm
Em
P53
IV17
0H1
5886
1.40
E–0
3/2.
88E
–03
+0.
26E
–03/
–0.0
9E–0
3 +
0.20
E–0
3/–0
.20E
–03
1.68
/3.
18+
0.30
/–0
.12
+0.
08/
–0.1
0
2.5,
3.
2E
m, I
mC
md,
Ip
m,
Ipm
d
Em
, Im
EIm
P52
IV15
0H2
4075
1.45
E–0
3/1.
17E
–02
+0.
23E
–03/
–0.2
6E–0
3 +
0.67
E–0
3/–2
.57E
–03
1.73
/3.
72+
0.29
/–0
.31
+0.
08/
–0.0
5
2.5,
3.
2E
m, I
mP
m
P51
IV14
4H2
1357
1.55
E–0
3+
0.31
E–0
3/–0
.29E
–03
1.85
+0.
37/
–0.3
43.
2,
2.5
Im, E
mIp
mE
Im
P50
IV13
3H1
2000
1.56
E–0
3+
0.48
E–0
3/–0
.20E
–03
1.87
+0.
56/
–0.2
52.
5E
m, I
mP
m
P49
IV15
7H2
4822
1.63
E–0
3+
0.31
E–0
3/–0
.36E
–03
2.01
+0.
37/
–0.4
32.
5,
3.2,
3.
5
Im, E
mIp
md,
Ip
mE
Im
P48
IV14
4H3
1091
1.71
E–0
3+
0.39
E–0
3/–0
.45E
–03
2.04
+0.
46/
–0.5
43.
5Im
Ipm
P47
IV14
4H1
1665
1.74
E–0
3+
0.55
E–0
3/–0
.32E
–03
2.08
+0.
65/
–0.3
92.
5,
3.2
ImP
mP
m
P46
IV13
2H3
1076
1.74
E–0
3+
0.50
E–0
3/–0
.56E
–03
2.08
+0.
58/
–0.6
73.
2,
2.5
ImP
m
P45
IV13
7H3
5666
1.75
E–0
3/1.
03E
–02
+0.
24E
–03/
–0.1
1E–0
3 +
0.54
E–0
2/–0
.20E
–02
2.09
/3.
70+
0.28
/–0
.14
+0.
08/
–0.0
5
2.5,
3.
2Im
, Em
Pm
P44
IV15
6H3
3245
1.77
E–0
3+
0.39
E–0
3/–0
.39E
–03
2.11
+0.
47/
–0.4
73.
2Im
Ipm
, Ipm
dIm
EIm
P43
IV13
8H2
1426
1.78
E–0
3+
0.72
E–0
3/–0
.77E
–03
2.12
+0.
82/
–0.9
12.
5,
3.2,
3.
5
Im, E
mIp
m
P42
IV15
6H2
698
1.78
E–0
3+
0.49
E–0
3/–0
.53E
–03
2.12
+0.
58/
–0.6
3no
ag
eE
mE
m
P41
IV13
8H1
1786
1.79
E–0
3+
0.64
E–0
3/–0
.72E
–03
2.13
+0.
75/
–0.8
52.
5Im
Pm
P40
IV15
8H1
3266
1.79
E–0
3/3.
80E
–03
+0.
48E
–03/
–0.5
0E–0
3 +
0.56
E–0
3/–0
.66E
–03
2.14
/3.
40+
0.56
/–0
.60
+0.
07/
–0.1
2
3.2,
2.
5,
3.5
ImIp
mIm
(Con
tinue
d)
on August 28, 2011specialpapers.gsapubs.orgDownloaded from
Ages and stratigraphy of lunar mare basalts 13TA
BLE
3. C
OM
PAR
ISO
N O
F A
GE
S F
OR
BA
SA
LTS
IN O
CE
AN
US
PR
OC
ELL
AR
UM
* (C
ontin
ued)
Uni
tLu
nar
Orb
iter
imag
e
Are
a(k
m2 )
Cra
ter
rete
ntio
n ag
e N
(1)
Err
orM
odel
ag
e (G
a)
Err
or(b
.y.)
Boy
ce(1
976)
Wilh
elm
s an
d M
cCau
ley
(197
1)
Moo
re(1
965)
Moo
re(1
967)
Mar
shal
l(1
963)
Hac
kman
(196
2)M
cCau
ley
(196
7)M
cCau
ley
(197
3)W
ilshi
re(1
973)
Titl
ey(1
967)
Sco
tt an
d E
ggle
ton
(197
3)
Ulri
ch(1
969)
Sco
tt et
al.
(197
7)
Lucc
hitta
(197
8)
P39
IV16
3H2
2298
1.83
E–0
3+
0.46
E–0
3/–0
.52E
–03
2.19
+0.
53/
–0.6
22.
5,
3.2,
3.
5
Em
, Im
Ipm
Im, E
mE
Im
P38
IV14
3H2
1127
1.93
E–0
3+
0.47
E–0
3/–0
.49E
–03
2.31
+0.
53/
–0.6
03.
2Im
, Em
Pm
P37
IV18
3H1
1091
1.99
E–0
3/5.
82E
–03
+0.
30E
–03/
–0.2
5E–0
3 +
0.86
E–0
3/–0
.75E
–03
2.38
/3.
56+
0.34
/–0
.31
+0.
04/
–0.0
4
no a
geE
Im
P36
IV15
6H3
1082
2.02
E–0
3/2.
54E
–02
+0.
38E
–03/
–0.3
9E–0
3 +
1.94
E–0
2/–0
.47E
–02
2.41
/3.
86+
0.43
/–0
.46
+0.
09/
–0.0
4
3.2
ImIm
EIm
P35
IV14
3H3
3441
2.13
E–0
3+
0.26
E–0
3/–0
.14E
–03
2.54
+0.
29/
–0.1
73.
2,
2.5
Im, E
mP
mP
m
P34
IV15
6H3
1118
2.17
E–0
3+
0.69
E–0
3/–0
.71E
–03
2.59
+0.
59/
–0.8
53.
2,
2.5
Em
Em
EIm
P33
IV15
6H3
1855
2.18
E–0
3/7.
51E
–03
+0.
15E
–03/
–0.1
5E–0
3 +
1.73
E–0
3/–1
.40E
–03
2.59
/3.
63+
0.18
/–0
.17
+0.
04/
–0.0
6
2.5,
3.
2Im
ImE
Im
P32
IV15
7H3
IV16
2H3
6475
2.32
E–0
3+
0.33
E–0
3/–0
.15E
–03
2.76
+0.
30/
–0.1
82.
5Im
Ipm
, Ip
md
EIm
P31
IV15
8H1
1719
2.44
E–0
3/1.
17E
–02
+0.
69E
–03/
–0.1
6E–0
3 +
0.58
E–0
2/–0
.22E
–02
2.88
/3.
72+
0.39
/–0
.17
+0.
08/
–0.0
4
3.2
ImIm
P30
IV16
9H3
583
2.46
E–0
3+
0.36
E–0
3/–0
.32E
–03
2.9
+0.
26/
–0.3
52.
5Im
Ipm
EIm
P29
IV18
3H2
1546
2.49
E–0
3+
0.37
E–0
3/–0
.32E
–03
2.93
+0.
25/
–0.3
43.
2E
Im
P28
IV18
3H3
840
2.51
E–0
3/1.
14E
–02
+0.
66E
–03/
–0.3
3E–0
3 +
0.66
E–0
2/–0
.21E
–02
2.94
/3.
72+
0.34
/–0
.34
+0.
08/
–0.0
5
3.65
, 3.
5Im
P27
IV13
2H3
2135
2.52
E–0
3+
0.88
E–0
3/–0
.17E
–03
2.96
+0.
38/
–0.1
73.
2,
2.5,
3.
5
Im, E
mP
m
P26
IV15
8H1
2309
2.53
E–0
3/4.
62E
–03
+0.
61E
–03/
–0.3
3E–0
3 +
1.06
E–0
3/–0
.69E
–03
2.96
/3.
49+
0.32
/–0
.34
+0.
06/
–0.0
7
2.5,
3.
2Im
Ipm
, Ip
md
EIm
P25
IV15
6H3
2176
2.52
E–0
3/7.
46E
–03
+0.
77E
–03/
–0.1
6E–0
3 +
1.11
E–0
3/–1
.39E
–03
2.96
/3.
62+
0.35
/–0
.17
+0.
04/
–0.0
5
3.5,
3.
2Im
, Em
Im, E
mE
Im
P24
IV15
0H1
6330
2.58
E–0
3/1.
27E
–02
+0.
58E
–03/
–0.1
7E–0
3 +
0.84
E–0
2/–0
.18E
–02
3.00
/3.
74+
0.28
/–0
.15
+0.
09/
–0.0
4
3.2,
2.
5;
3.5
Im, E
mIp
m, I
pmd
Im
P23
IV15
7H1
513
2.67
E–0
3+
0.19
E–0
3/–0
.18E
–03
3.07
+0.
11/
–0.1
42.
5E
mE
m, I
mE
Im
P22
IV16
9H3
925
2.68
E–0
3+
0.40
E–0
3/–0
.18E
–03
3.08
+0.
18/
–0.1
42.
5Ip
md,
Ip
mE
Im
P21
IV18
3H2
2725
2.75
E–0
3+
0.40
E–0
3/–0
.19E
–03
3.12
+0.
16/
–0.1
33.
5E
Im
(Con
tinue
d)
on August 28, 2011specialpapers.gsapubs.orgDownloaded from
14 Hiesinger et al.TA
BLE
3. C
OM
PAR
ISO
N O
F A
GE
S F
OR
BA
SA
LTS
IN O
CE
AN
US
PR
OC
ELL
AR
UM
* (C
ontin
ued)
Uni
tLu
nar
Orb
iter
imag
e
Are
a(k
m2 )
Cra
ter
rete
ntio
n ag
e N
(1)
Err
orM
odel
ag
e (G
a)
Err
or(b
.y.)
Boy
ce(1
976)
Wilh
elm
s an
d M
cCau
ley
(197
1)
Moo
re(1
965)
Moo
re(1
967)
Mar
shal
l(1
963)
Hac
kman
(196
2)M
cCau
ley
(196
7)M
cCau
ley
(197
3)W
ilshi
re(1
973)
Titl
ey(1
967)
Sco
tt an
d E
ggle
ton
(197
3)
Ulri
ch(1
969)
Sco
tt et
al.
(197
7)
Lucc
hitta
(197
8)
P20
IV15
7H1
1702
2.74
E–0
3/3.
94E
–02
+0.
50E
–03/
–0.5
0E–0
3 +
2.61
E–0
2/–0
.74E
–02
3.12
/3.
93+
0.18
/–0
.45
+0.
08/
–0.0
3
3.2
Em
, Im
Ipm
, Ipm
dE
Im
P19
IV16
2H2
IV16
9H2
8051
3.27
E–0
3+
0.23
E–0
3/–0
.22E
–03
3.31
+0.
05/
–0.0
63.
2,
3.5,
2.
5
Em
, Im
Ipm
d,
Ipm
, Cca
EIm
P18
IV16
2H1
1874
3.31
E–0
3+
0.49
E–0
3/–0
.23E
–03
3.32
+0.
08/
–0.0
62.
5E
mIp
md,
Cca
Em
, Im
EIm
P17
IV13
2H2
2909
3.30
E–0
3+
0.79
E–0
3/–0
.42E
–03
3.32
+0.
08/
–0.1
43.
5,
3.2
Em
Pm
Ipm
3,
Ipm
4P
16IV
157H
111
083.
36E
–03
+0.
60E
–03/
–0.1
3E–0
33.
33+
0.08
/–0
.05
3.2,
3.
5,
2.5
ImIp
m, C
reE
Im
P15
IV15
6H3
1662
3.43
E–0
3/2.
75E
–02
+0.
51E
–03/
–0.4
4E–0
3 +
0.41
E–0
2/–0
.51E
–02
3.34
/3.
87+
0.08
/–0
.11
+0.
02/
–0.0
3
3.2,
3.
5E
m, I
mIp
m, I
pmd
ImE
Im
P14
IV16
2H3
IV16
9H2
IV16
9H3
7939
3.50
E–0
3/7.
35E
–03
+0.
37E
–03/
–0.3
9E–0
3 +
2.85
E–0
3/–1
.38E
–03
3.36
/3.
62+
0.05
/–0
.09
+0.
07/
–0.0
5
2.5,
3.
2,
3.5
Em
, Im
Ipm
d,
Ipm
EIm
P13
IV16
3H2
1120
3.76
E–0
3+
1.19
E–0
3/–0
.70E
–03
3.4
+0.
11/
–0.1
53.
65,
3.5,
3.
2,
3.75
ImIm
Im
P12
IV15
7H1
1807
3.97
E–0
3+
1.09
E–0
3/–0
.51E
–03
3.42
+0.
10/
–0.0
72.
5,
3.2
Em
Ipm
d,
Ipm
, Cca
EIm
P11
IV14
3H2
2383
4.00
E–0
3+
1.12
E–0
3/–0
.52E
–03
3.43
+0.
09/
–0.0
83.
2,
3.5
Im, E
mP
m
P10
IV17
5H3
8419
4.08
E–0
3+
0.83
E–0
3/–0
.52E
–03
3.44
+0.
07/
–0.0
73.
5,
3.2,
3.
65,
2.5
ImIm
EIm
Im
P9
IV17
0H2
3808
4.45
E–0
3+
0.71
E–0
3/–0
.56E
–03
3.47
+0.
08/
–0.0
63.
2,
3.5
Em
, Im
Em
, Im
EIm
P8
IV13
2H3
2525
4.44
E–0
3+
1.32
E–0
3/–0
.83E
–03
3.47
+0.
08/
–0.0
92.
5,
3.5,
3.
2
Em
Pm
P7
IV14
4H3
1774
4.48
E–0
3+
1.20
E–0
3/–1
.08E
–03
3.48
+0.
07/
–0.1
43.
5,
3.2
ImIp
m
P6
IV14
4H1
884
4.52
E–0
3+
1.68
E–0
3/–1
.09E
–03
3.48
+0.
10/
–0.1
43.
2,
2.5
ImP
mE
m
P5
IV13
8H2
1792
4.57
E–0
3+
1.30
E–0
3/–0
.67E
–03
3.48
+0.
08/
–0.0
63.
5,
3.2,
2.
5
ImIp
mP
m
P4
IV15
1H1
1327
4.49
E–0
3/1.
29E
–02
+1.
19E
–03/
–0.8
4E–0
3 +
0.67
E–0
2/–0
.39E
–02
3.48
/3.
74+
0.07
/–0
.10
+0.
07/
–0.0
7
3.65
, 3.
5,
3.2
ImIp
m
P3
IV14
9H3
718
5.26
E–0
3+
1.97
E–0
3/–0
.98E
–03
3.53
+0.
09/
–0.0
73.
2,
3.5,
2.
5
ImIm
EIm
P2
IV14
4H1
862
6.10
E–0
3+
2.10
E–0
3/–1
.47E
–03
3.57
+0.
08/
–0.0
83.
2,
3.5,
2.
5
ImP
m
P1
IV18
3H3
2269
6.47
E–0
3+
1.53
E–0
3/–1
.62E
–03
3.59
+0.
05/
–0.0
93.
5Im
*See
text
for
deta
ils. R
ead
2.68
E–0
3 as
2.6
8 ×
10–3
.
on August 28, 2011specialpapers.gsapubs.orgDownloaded from
Ages and stratigraphy of lunar mare basalts 15
or Eratosthenian/Imbrian ages are shown in the map of Wilhelms and McCauley (1971). However, our data indicate that these units are Imbrian in age, consistent with the mapping of McCauley (1967, 1973), Moore (1967), Titley (1967), Scott and Eggleton (1973), and Lucchitta (1978). Our crater counts do not confi rm an Eratosthenian age for parts of unit P9, as shown in the map of Scott and Eggleton (1973). Our data do not agree with the map of McCauley (1967) that units P12, P16, P18, and P19 are partially of Copernican age, nor with the map of McCauley (1973), which shows that unit P18 is partially of Eratosthenian age.
Several units for which we determined an Eratosthenian age (P23, P34, P42, P54) are also mapped as Eratosthenian in age in the map of Wilhelms and McCauley (1971). Numerous units exhibit Eratosthenian and Imbrian ages in this map, and using our crater size-frequency distribution measurements, we obtained Eratosthenian ages for all these units (P20, P24, P25, P27, P35, P38, P39, P43, P45, P49, P50, P51, P52, P53). Wilhelms and McCauley (1971) mapped 12 units as Imbrian in age, but our data indicate an Eratosthenian age for these units (P26, P30, P31, P32, P33, P36, P40, P41, P44, P46, P47, P48). The geologic map of Scott et al. (1977) attributes Eratosthenian and/or Imbrian ages to units that we found to be of Eratosthenian age (P20, P21, P22, P23, P25, P26, P29, P30, P32, P33, P34, P36, P37, P39, P44, P49, P51, P53). Several other geologic maps show Imbrian ages for the units that, according to our crater counts, are Eratosthenian in age, i.e., units P20–P55. For example, Moore (1965) found Imbrian ages for units P40, P43, P48, and P51, and in the map of Moore (1967), six units (P22, P26, P30, P32, P39, P49) show Imbrian ages, and one unit (P53) is partially Imbrian and Coper-nican in age. Imbrian ages are also indicated for units P20, P24, and P44 in the map of McCauley (1967), and for unit P28 (Luc-chitta, 1978), as well as for units P31, P39, P40, and P53 (Scott and Eggleton, 1973). However, signifi cant parts of units P39 and P53 were also mapped as Eratosthenian in age, consistent with our dating. Finally, in the map of McCauley (1973), units P24, P33, P36, and P44 are Imbrian and units P23 and P25 are Imbrian and Eratosthenian in age. Our crater counts confi rm an Eratosthe-nian age for unit P34 and unit P54. The map of Wilshire (1973) indicates an Eratosthenian age for unit P42, consistent with our age for this unit.
As mentioned earlier, for the application of terms like “Copernican” or “Eratosthenian” in an absolute sense, the reader must be aware that there is no formal defi nition of the Coper-nican system (Wilhelms, 1987) and that the chronostratigraphic systems of different authors vary in the beginning of the Coper-nican system (e.g., Wilhelms, 1987; Neukum and Ivanov, 1994; Stöffl er and Ryder, 2001; Hawke et al., 2004). These differences are reviewed elsewhere (e.g., Hiesinger et al., 2000; Stöffl er and Ryder, 2001). For our studies, we adopted the chronostrati-graphic system of Neukum and Ivanov (1994). According to this chronostratigraphic system, our crater counts revealed Coperni-can ages for fi ve units (P56, P57, P58, P59, P60). Application of the Wilhelms (1987) and the Stöffl er and Ryder (2001) models would indicate Eratosthenian ages for these units. These units
were mapped partially as Eratosthenian and Imbrian (P56, P58) or as Imbrian (P59, P60) by Wilhelms and McCauley (1971). Imbrian ages for units P59 and P60 are also shown in the maps of Moore (1965, 1967) and for units P58 and P59 in the map of Scott and Eggleton (1973). This map also shows an Eratosthe-nian age for unit P58. Ulrich (1969) and Lucchitta (1978) found Eratosthenian ages for unit P56, and Scott et al. (1977) mapped units P58 and P60 as Eratosthenian and/or Imbrian in age. A summary of this discussion of our units in the context of the geo-logical maps of the U.S. Geological Survey and the Boyce ages is given in Table 3.
Mare Imbrium
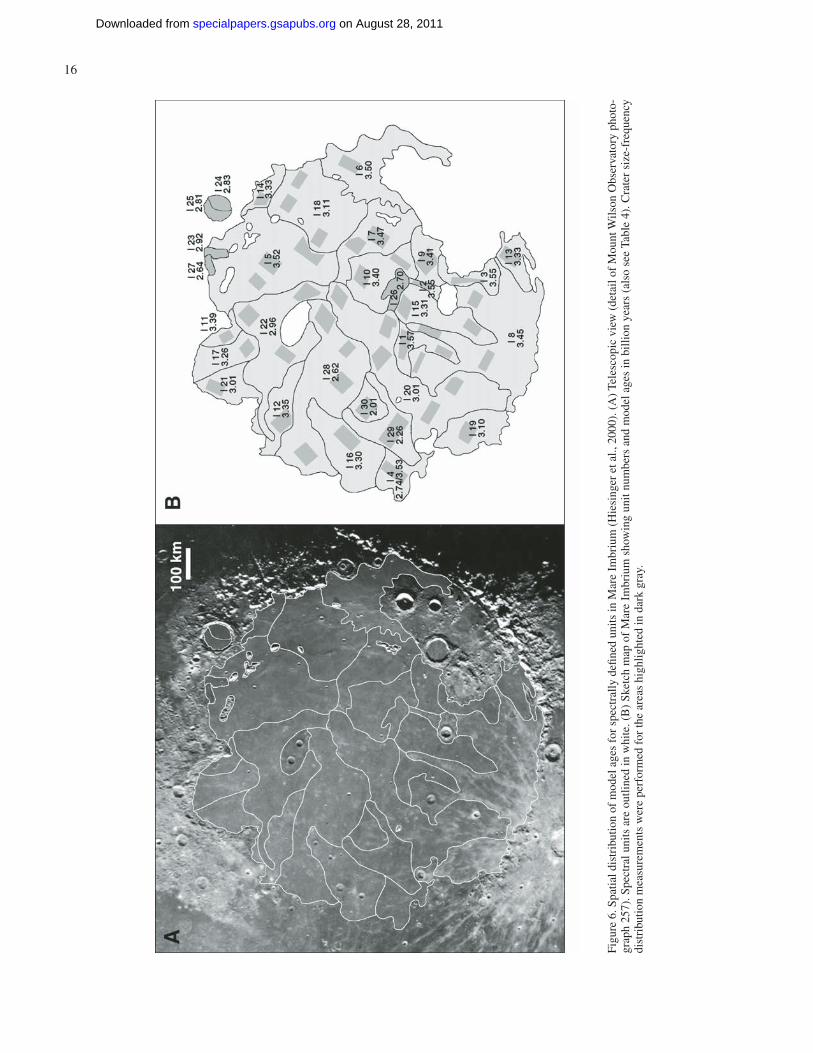
In the Imbrium basin (1160 km in diameter; Spudis, 1993), we dated 30 spectrally defi ned units showing basalt ages between 2.01 and 3.57 Ga (Hiesinger et al., 2000). In our data, we observed a trend showing western basalts in Mare Imbrium slightly younger than eastern basalts. As in Mare Serenitatis, we observed a broad range of ages varying at least 1.5 Ga, which indicates an extremely long period of volcanic activity in these two basins (Fig. 6). On the basis of their crater size-frequency counts (for diameters >500 m), Bugiolacchi and Guest (2008) reported that for most of their mare basalts, crater count ages range between 3.5 and 5.5 × 10⁻² per km2, or 2.3–3.3 Ga.
In our data, ~52% of all units in Mare Imbrium exhibit ages of 3.3–3.6 Ga, with all other units younger than 3.3 Ga but older than 2.6 Ga, except unit I29, which is 2.26 Ga, and unit I30, which is 2.01 Ga. We conclude that the largest number of basalts erupted in the period 3.3–3.6 b.y. ago and that volcanism went on with a signifi cantly lower intensity until ca. 2.6 Ga. We observed a weak bimodal distribution of basalt ages with peaks at 3.3–3.4 Ga and 3.5–3.6 Ga, thus indicating that volcanism was not continuously active with equal intensity over longer periods of time but shows phases with higher and lower levels of activity. During each of those periods with intensifi ed volcanic activity, 20% of the dated basalt units were emplaced.
Young lava fl ows, originating near Euler β and fl owing northward across the Imbrium basin for 1200 km, were studied by Schaber (1973). These youngest lava fl ows in central Imbrium consist of three distinctive phases and were previously mapped as Eratosthenian in age by Schaber (1973). However, our data show that at least one of those basalts (unit I7) is of Imbrian age, consistent with observations of Wilhelms (1987).
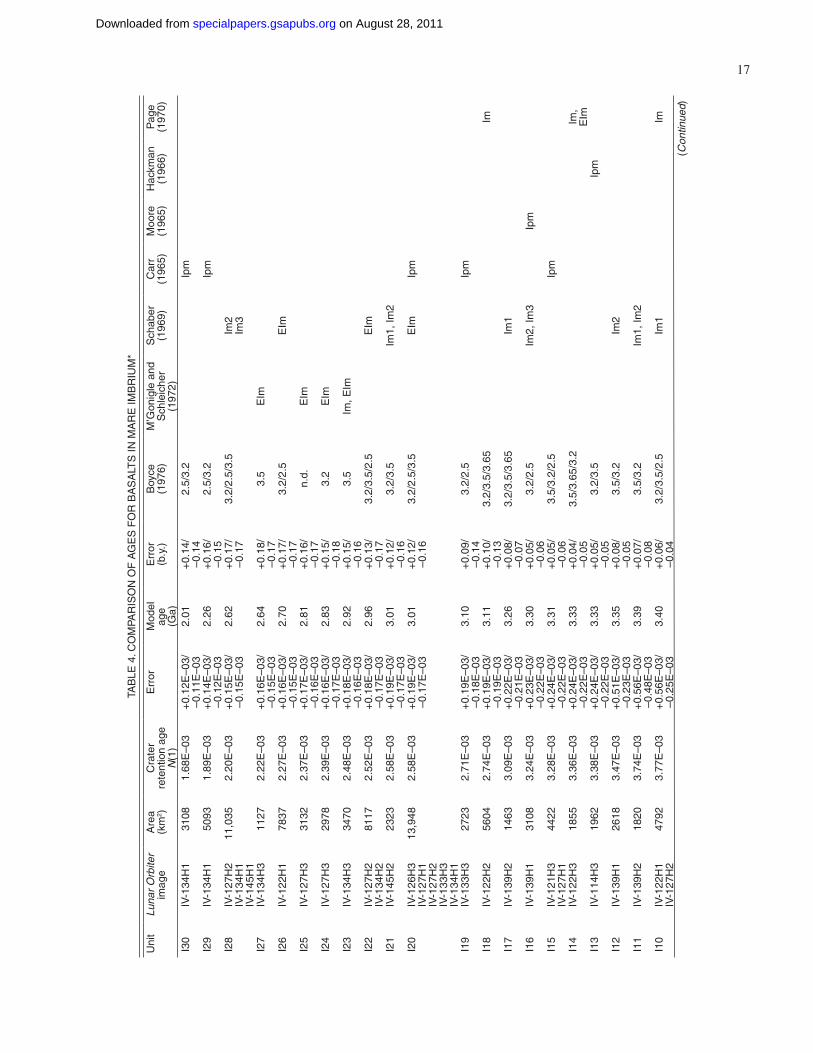
Table 4 shows that for a single spectrally defi ned unit, a broad variety of crater degradation ages (Boyce, 1976; Boyce and Johnson, 1978) can be extracted. Only three units (I23, I24, I27) exhibit only one age in the Boyce data, whereas all other units are characterized by two or more ages. In four units (I5, I6, I8, I17), our data match the most abundant Boyce ages. In 12 other units (I3, I7, I9, I10, I11, I12, I13, I15, I19, I20, I26, I28), the crater degradation ages of Boyce and Johnson (1978) mark an upper and lower boundary, with our data in between. Unit I28, mapped by Schaber (1969), and units I19, I20, I29, and
on August 28, 2011specialpapers.gsapubs.orgDownloaded from
16 Hiesinger et al.
Figu
re 6
. Spa
tial d
istr
ibut
ion
of m
odel
age
s fo
r sp
ectr
ally
defi
ned
uni
ts in
Mar
e Im
briu
m (
Hie
sing
er e
t al.,
200
0). (
A)
Tele
scop
ic v
iew
(de
tail
of M
ount
Wils
on O
bser
vato
ry p
hoto
-gr
aph
257)
. Spe
ctra
l uni
ts a
re o
utlin
ed in
whi
te. (
B)
Sket
ch m
ap o
f M
are
Imbr
ium
sho
win
g un
it nu
mbe
rs a
nd m
odel
age
s in
bill
ion
year
s (a
lso
see
Tabl
e 4)
. Cra
ter
size
-fre
quen
cy
dist
ribu
tion
mea
sure
men
ts w
ere
perf
orm
ed f
or th
e ar
eas
high
light
ed in
dar
k gr
ay.
on August 28, 2011specialpapers.gsapubs.orgDownloaded from
Ages and stratigraphy of lunar mare basalts 17
TAB
LE 4
. CO
MPA
RIS
ON
OF
AG
ES
FO
R B
AS
ALT
S IN
MA
RE
IMB
RIU
M*
Uni
tLu
nar
Orb
iter
imag
eA
rea
(km
2 )C
rate
r re
tent
ion
age
N(1
)
Err
orM
odel
ag
e (G
a)
Err
or(b
.y.)
Boy
ce(1
976)
M’G
onig
le a
nd
Sch
leic
her
(197
2)
Sch
aber
(196
9)C
arr
(196
5)M
oore
(196
5)H
ackm
an(1
966)
Pag
e(1
970)
I30
IV-1
34H
131
081.
68E
–03
+0.
12E
–03/
–0.1
1E–0
32.
01+
0.14
/–0
.14
2.5/
3.2
Ipm
I29
IV-1
34H
150
931.
89E
–03
+0.
14E
–03/
–0.1
2E–0
32.
26+
0.16
/–0
.15
2.5/
3.2
Ipm
I28
IV-1
27H
2IV
-134
H1
IV-1
45H
1
11,0
352.
20E
–03
+0.
15E
–03/
–0.1
5E–0
32.
62+
0.17
/–0
.17
3.2/
2.5/
3.5
Im2
Im3
I27
IV-1
34H
311
272.
22E
–03
+0.
16E
–03/
–0.1
5E–0
32.
64+
0.18
/–0
.17
3.5
EIm
I26
IV-1
22H
178
372.
27E
–03
+0.
16E
–03/
–0.1
5E–0
32.
70+
0.17
/–0
.17
3.2/
2.5
EIm
I25
IV-1
27H
331
322.
37E
–03
+0.
17E
–03/
–0.1
6E–0
32.
81+
0.16
/–0
.17
n.d.
EIm
I24
IV-1
27H
329
782.
39E
–03
+0.
16E
–03/
–0.1
7E–0
32.
83+
0.15
/–0
.18
3.2
EIm
I23
IV-1
34H
334
702.
48E
–03
+0.
18E
–03/
–0.1
6E–0
32.
92+
0.15
/–0
.16
3.5
Im, E
Im
I22
IV-1
27H
2IV
-134
H2
8117
2.52
E–0
3+
0.18
E–0
3/–0
.17E
–03
2.96
+0.
13/
–0.1
73.
2/3.
5/2.
5E
Im
I21
IV-1
45H
223
232.
58E
–03
+0.
19E
–03/
–0.1
7E–0
33.
01+
0.12
/–0
.16
3.2/
3.5
Im1,
Im2
I20
IV-1
26H
3IV
-127
H1
IV-1
27H
2IV
-133
H3
IV-1
34H
1
13,9
482.
58E
–03
+0.
19E
–03/
–0.1
7E–0
33.
01+
0.12
/–0
.16
3.2/
2.5/
3.5
EIm
Ipm
I19
IV-1
33H
327
232.
71E
–03
+0.
19E
–03/
–0.1
8E–0
33.
10+
0.09
/–0
.14
3.2/
2.5
Ipm
I18
IV-1
22H
256
042.
74E
–03
+0.
19E
–03/
–0.1
9E–0
33.
11+
0.10
/–0
.13
3.2/
3.5/
3.65
Im
I17
IV-1
39H
214
633.
09E
–03
+0.
22E
–03/
–0.2
1E–0
33.
26+
0.08
/–0
.07
3.2/
3.5/
3.65
Im1
I16
IV-1
39H
131
083.
24E
–03
+0.
23E
–03/
–0.2
2E–0
33.
30+
0.05
/–0
.06
3.2/
2.5
Im2,
Im3
Ipm
I15
IV-1
21H
3IV
-127
H1
4422
3.28
E–0
3+
0.24
E–0
3/–0
.22E
–03
3.31
+0.
05/
–0.0
63.
5/3.
2/2.
5Ip
m
I14
IV-1
22H
318
553.
36E
–03
+0.
24E
–03/
–0.2
2E–0
33.
33+
0.04
/–0
.05
3.5/
3.65
/3.2
Im,
EIm
I13
IV-1
14H
319
623.
38E
–03
+0.
24E
–03/
–0.2
2E–0
33.
33+
0.05
/–0
.05
3.2/
3.5
Ipm
I12
IV-1
39H
126
183.
47E
–03
+0.
51E
–03/
–0.2
3E–0
33.
35+
0.08
/–0
.05
3.5/
3.2
Im2
I11
IV-1
39H
218
203.
74E
–03
+0.
56E
–03/
–0.4
8E–0
33.
39+
0.07
/–0
.08
3.5/
3.2
Im1,
Im2
I10
IV-1
22H
1IV
-127
H2
4792
3.77
E–0
3+
0.56
E–0
3/–0
.25E
–03
3.40
+0.
06/
–0.0
43.
2/3.
5/2.
5Im
1Im
(Con
tinue
d)
on August 28, 2011specialpapers.gsapubs.orgDownloaded from
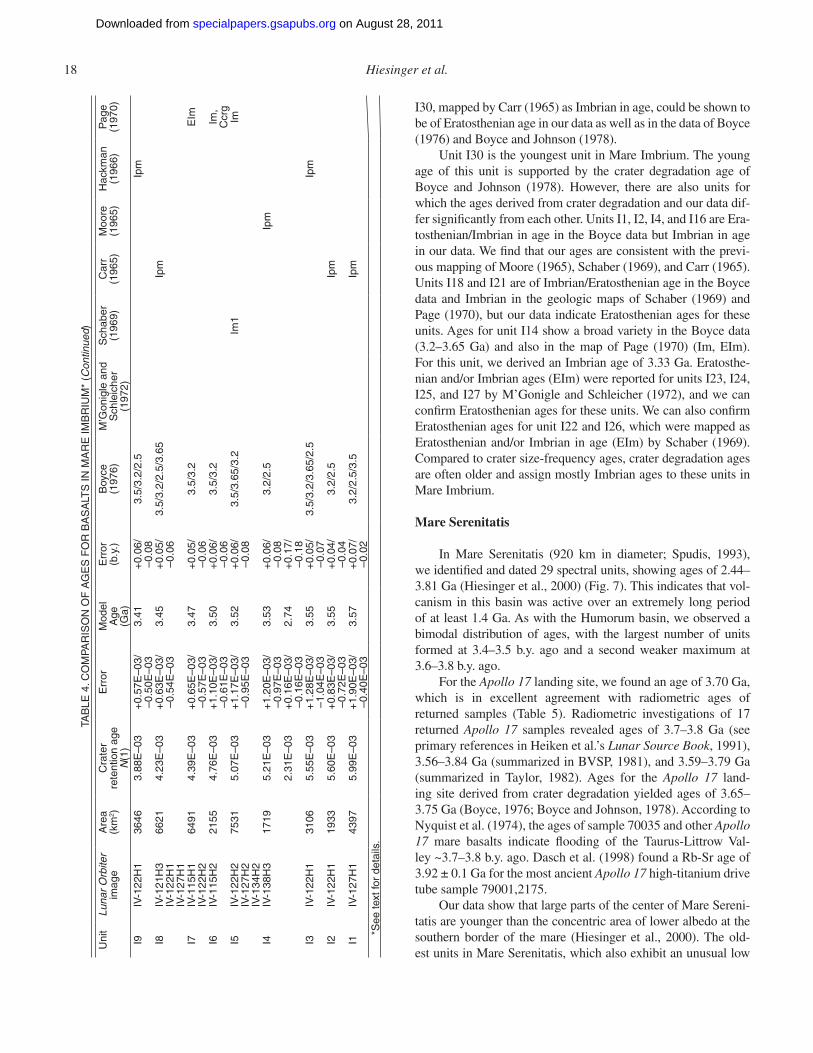
18 Hiesinger et al.TA
BLE
4. C
OM
PAR
ISO
N O
F A
GE
S F
OR
BA
SA
LTS
IN M
AR
E IM
BR
IUM
* (C
ontin
ued)
Uni
tLu
nar
Orb
iter
imag
eA
rea
(km
2 )C
rate
r re
tent
ion
age
N(1
)
Err
orM
odel
A
ge
(Ga)
Err
or(b
.y.)
Boy
ce(1
976)
M’G
onig
le a
nd
Sch
leic
her
(197
2)
Sch
aber
(196
9)C
arr
(196
5)M
oore
(196
5)H
ackm
an(1
966)
Pag
e(1
970)
I9IV
-122
H1
3646
3.88
E–0
3+
0.57
E–0
3/–0
.50E
–03
3.41
+0.
06/
–0.0
83.
5/3.
2/2.
5Ip
m
I8IV
-121
H3
IV-1
22H
1IV
-127
H1
6621
4.23
E–0
3+
0.63
E–0
3/–0
.54E
–03
3.45
+0.
05/
–0.0
63.
5/3.
2/2.
5/3.
65Ip
m
I7IV
-115
H1
IV-1
22H
264
914.
39E
–03
+0.
65E
–03/
–0.5
7E–0
33.
47+
0.05
/–0
.06
3.5/
3.2
EIm
I6IV
-115
H2
2155
4.76
E–0
3+
1.10
E–0
3/–0
.61E
–03
3.50
+0.
06/
–0.0
63.
5/3.
2Im
, C
crg
I5IV
-122
H2
IV-1
27H
2IV
-134
H2
7531
5.07
E–0
3+
1.17
E–0
3/–0
.95E
–03
3.52
+0.
06/
–0.0
83.
5/3.
65/3
.2Im
1Im
I4IV
-138
H3
1719
5.21
E–0
3
2.31
E–0
3
+1.
20E
–03/
–0.9
7E–0
3+
0.16
E–0
3/–0
.16E
–03
3.53
2.74
+0.
06/
–0.0
8+
0.17
/–0
.18
3.2/
2.5
Ipm
I3IV
-122
H1
3106
5.55
E–0
3+
1.28
E–0
3/–1
.04E
–03
3.55
+0.
05/
–0.0
73.
5/3.
2/3.
65/2
.5Ip
m
I2IV
-122
H1
1933
5.60
E–0
3+
0.83
E–0
3/–0
.72E
–03
3.55
+0.
04/
–0.0
43.
2/2.
5Ip
m
I1IV
-127
H1
4397
5.99
E–0
3+
1.90
E–0
3/–0
.40E
–03
3.57
+0.
07/
–0.0
23.
2/2.
5/3.
5Ip
m
*S
ee te
xt fo
r de
tails
.
I30, mapped by Carr (1965) as Imbrian in age, could be shown to be of Eratosthenian age in our data as well as in the data of Boyce (1976) and Boyce and Johnson (1978).
Unit I30 is the youngest unit in Mare Imbrium. The young age of this unit is supported by the crater degradation age of Boyce and Johnson (1978). However, there are also units for which the ages derived from crater degradation and our data dif-fer signifi cantly from each other. Units I1, I2, I4, and I16 are Era-tosthenian/Imbrian in age in the Boyce data but Imbrian in age in our data. We fi nd that our ages are consistent with the previ-ous mapping of Moore (1965), Schaber (1969), and Carr (1965). Units I18 and I21 are of Imbrian/Eratosthenian age in the Boyce data and Imbrian in the geologic maps of Schaber (1969) and Page (1970), but our data indicate Eratosthenian ages for these units. Ages for unit I14 show a broad variety in the Boyce data (3.2–3.65 Ga) and also in the map of Page (1970) (Im, EIm). For this unit, we derived an Imbrian age of 3.33 Ga. Eratosthe-nian and/or Imbrian ages (EIm) were reported for units I23, I24, I25, and I27 by M’Gonigle and Schleicher (1972), and we can confi rm Eratosthenian ages for these units. We can also confi rm Eratosthenian ages for unit I22 and I26, which were mapped as Eratosthenian and/or Imbrian in age (EIm) by Schaber (1969). Compared to crater size-frequency ages, crater degradation ages are often older and assign mostly Imbrian ages to these units in Mare Imbrium.
Mare Serenitatis
In Mare Serenitatis (920 km in diameter; Spudis, 1993), we identifi ed and dated 29 spectral units, showing ages of 2.44–3.81 Ga (Hiesinger et al., 2000) (Fig. 7). This indicates that vol-canism in this basin was active over an extremely long period of at least 1.4 Ga. As with the Humorum basin, we observed a bimodal distribution of ages, with the largest number of units formed at 3.4–3.5 b.y. ago and a second weaker maximum at 3.6–3.8 b.y. ago.
For the Apollo 17 landing site, we found an age of 3.70 Ga, which is in excellent agreement with radiometric ages of returned samples (Table 5). Radiometric investigations of 17 returned Apollo 17 samples revealed ages of 3.7–3.8 Ga (see primary references in Heiken et al.’s Lunar Source Book, 1991), 3.56–3.84 Ga (summarized in BVSP, 1981), and 3.59–3.79 Ga (summarized in Taylor, 1982). Ages for the Apollo 17 land-ing site derived from crater degradation yielded ages of 3.65–3.75 Ga (Boyce, 1976; Boyce and Johnson, 1978). According to Nyquist et al. (1974), the ages of sample 70035 and other Apollo 17 mare basalts indicate fl ooding of the Taurus-Littrow Val-ley ~3.7–3.8 b.y. ago. Dasch et al. (1998) found a Rb-Sr age of 3.92 ± 0.1 Ga for the most ancient Apollo 17 high-titanium drive tube sample 79001,2175.
Our data show that large parts of the center of Mare Sereni-tatis are younger than the concentric area of lower albedo at the southern border of the mare (Hiesinger et al., 2000). The old-est units in Mare Serenitatis, which also exhibit an unusual low
on August 28, 2011specialpapers.gsapubs.orgDownloaded from
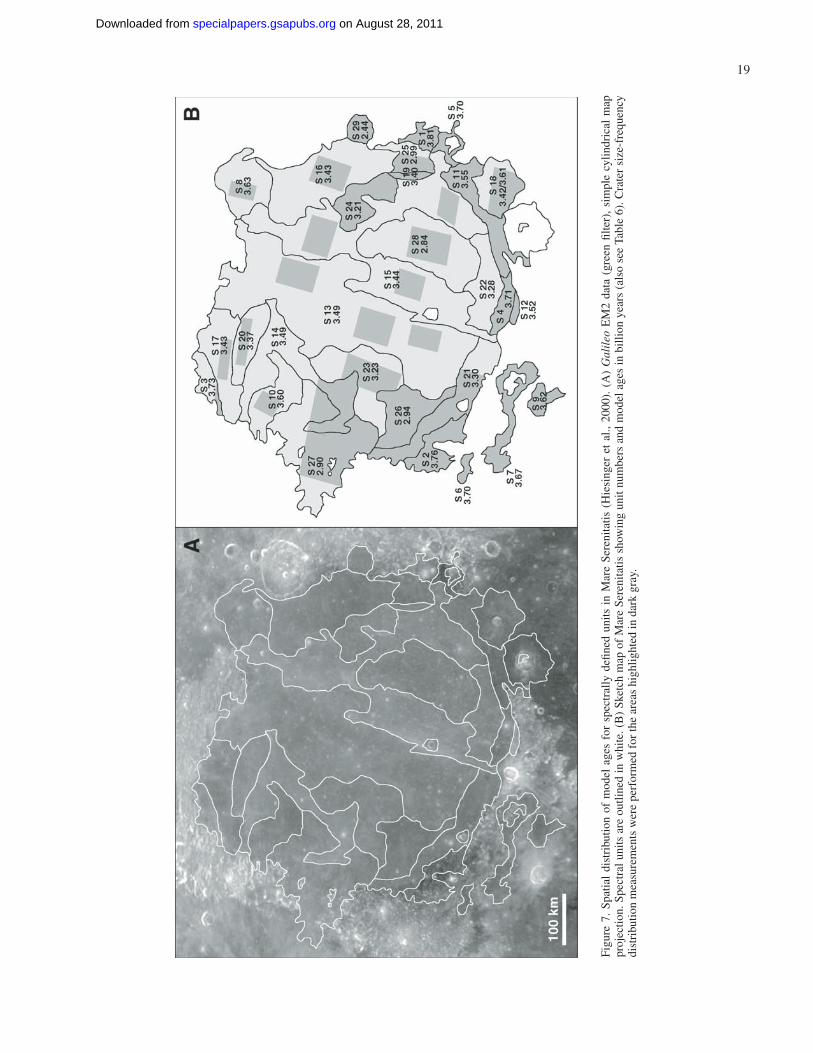
Ages and stratigraphy of lunar mare basalts 19
Figu
re 7
. Sp
atia
l di
stri
butio
n of
mod
el a
ges
for
spec
tral
ly d
efi n
ed u
nits
in
Mar
e Se
reni
tatis
(H
iesi
nger
et
al.,
2000
). (
A)
Gal
ileo
EM
2 da
ta (
gree
n fi l
ter)
, si
mpl
e cy
lindr
ical
map
pr
ojec
tion.
Spe
ctra
l uni
ts a
re o
utlin
ed in
whi
te. (
B)
Sket
ch m
ap o
f M
are
Sere
nita
tis s
how
ing
unit
num
bers
and
mod
el a
ges
in b
illio
n ye
ars
(als
o se
e Ta
ble
6). C
rate
r si
ze-f
requ
ency
di
stri
butio
n m
easu
rem
ents
wer
e pe
rfor
med
for
the
area
s hi
ghlig
hted
in d
ark
gray
.
on August 28, 2011specialpapers.gsapubs.orgDownloaded from
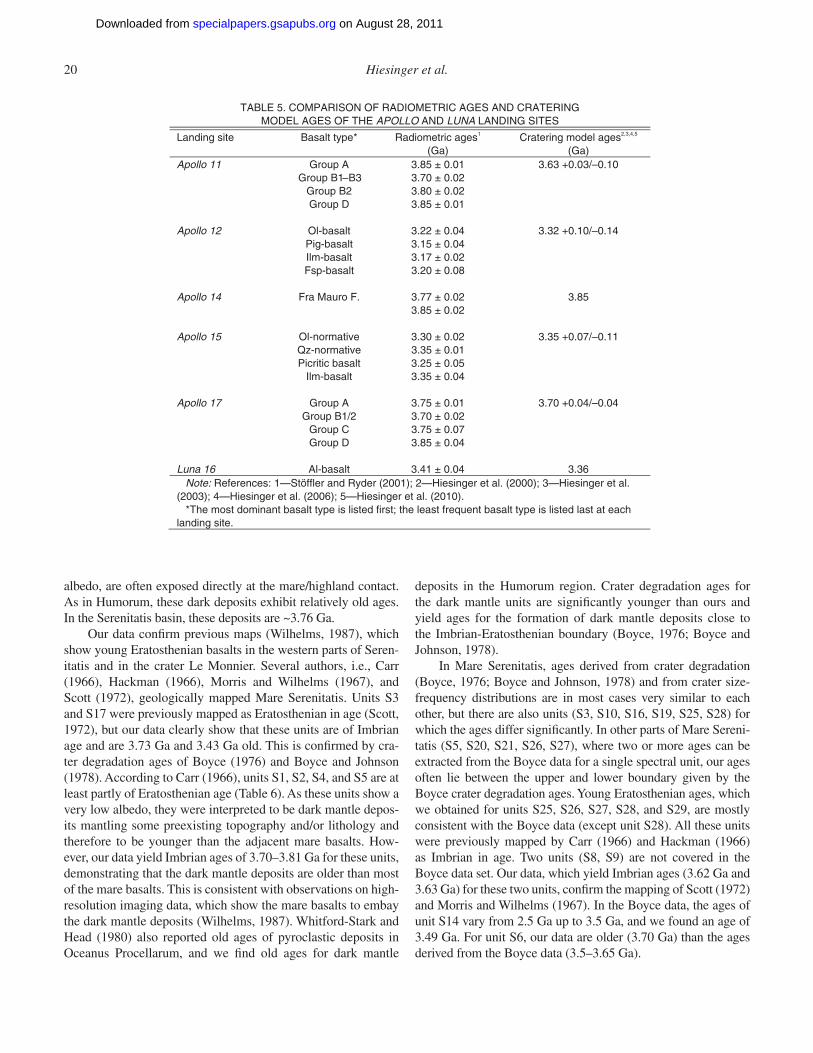
20 Hiesinger et al.
albedo, are often exposed directly at the mare/highland contact. As in Humorum, these dark deposits exhibit relatively old ages. In the Serenitatis basin, these deposits are ~3.76 Ga.
Our data confi rm previous maps (Wilhelms, 1987), which show young Eratosthenian basalts in the western parts of Seren-itatis and in the crater Le Monnier. Several authors, i.e., Carr (1966), Hackman (1966), Morris and Wilhelms (1967), and Scott (1972), geologically mapped Mare Serenitatis. Units S3 and S17 were previously mapped as Eratosthenian in age (Scott, 1972), but our data clearly show that these units are of Imbrian age and are 3.73 Ga and 3.43 Ga old. This is confi rmed by cra-ter degradation ages of Boyce (1976) and Boyce and Johnson (1978). According to Carr (1966), units S1, S2, S4, and S5 are at least partly of Eratosthenian age (Table 6). As these units show a very low albedo, they were interpreted to be dark mantle depos-its mantling some preexisting topography and/or lithology and therefore to be younger than the adjacent mare basalts. How-ever, our data yield Imbrian ages of 3.70–3.81 Ga for these units, demonstrating that the dark mantle deposits are older than most of the mare basalts. This is consistent with observations on high-resolution imaging data, which show the mare basalts to embay the dark mantle deposits (Wilhelms, 1987). Whitford-Stark and Head (1980) also reported old ages of pyroclastic deposits in Oceanus Procellarum, and we fi nd old ages for dark mantle
deposits in the Humorum region. Crater degradation ages for the dark mantle units are signifi cantly younger than ours and yield ages for the formation of dark mantle deposits close to the Imbrian-Eratosthenian boundary (Boyce, 1976; Boyce and Johnson, 1978).
In Mare Serenitatis, ages derived from crater degradation (Boyce, 1976; Boyce and Johnson, 1978) and from crater size-frequency distributions are in most cases very similar to each other, but there are also units (S3, S10, S16, S19, S25, S28) for which the ages differ signifi cantly. In other parts of Mare Sereni-tatis (S5, S20, S21, S26, S27), where two or more ages can be extracted from the Boyce data for a single spectral unit, our ages often lie between the upper and lower boundary given by the Boyce crater degradation ages. Young Eratosthenian ages, which we obtained for units S25, S26, S27, S28, and S29, are mostly consistent with the Boyce data (except unit S28). All these units were previously mapped by Carr (1966) and Hackman (1966) as Imbrian in age. Two units (S8, S9) are not covered in the Boyce data set. Our data, which yield Imbrian ages (3.62 Ga and 3.63 Ga) for these two units, confi rm the mapping of Scott (1972) and Morris and Wilhelms (1967). In the Boyce data, the ages of unit S14 vary from 2.5 Ga up to 3.5 Ga, and we found an age of 3.49 Ga. For unit S6, our data are older (3.70 Ga) than the ages derived from the Boyce data (3.5–3.65 Ga).
TABLE 5. COMPARISON OF RADIOMETRIC AGES AND CRATERING MODEL AGES OF THE APOLLO AND LUNA LANDING SITES
Landing site Basalt type* Radiometric ages1 (Ga)
Cratering model ages2,3,4,5 (Ga)
Apollo 11 Group A 3.85 ± 0.01 3.63 +0.03/–0.10 20.0 ± 07.3 3B–1B puorG 20.0 ± 08.3 2B puorG 10.0 ± 58.3 D puorG
Apollo 12 Ol-basalt 3.22 ± 0.04 3.32 +0.10/–0.14 40.0 ± 51.3 tlasab-giP 20.0 ± 71.3 tlasab-mlI 80.0 ± 02.3 tlasab-psF
Apollo 14 Fra Mauro F. 3.77 ± 0.02 3.85 20.0 ± 58.3
Apollo 15 Ol-normative 3.30 ± 0.02 3.35 +0.07/–0.11 10.0 ± 53.3 evitamron-zQ 50.0 ± 52.3 tlasab citirciP 40.0 ± 53.3 tlasab-mlI
Apollo 17 Group A 3.75 ± 0.01 3.70 +0.04/–0.04 20.0 ± 07.3 2/1B puorG 70.0 ± 57.3 C puorG 40.0 ± 58.3 D puorG
Luna 16 Al-basalt 3.41 ± 0.04 3.36 Note: References: 1—Stöffler and Ryder (2001); 2—Hiesinger et al. (2000); 3—Hiesinger et al. (2003); 4—Hiesinger et al. (2006); 5—Hiesinger et al. (2010). *The most dominant basalt type is listed first; the least frequent basalt type is listed last at each landing site.
on August 28, 2011specialpapers.gsapubs.orgDownloaded from
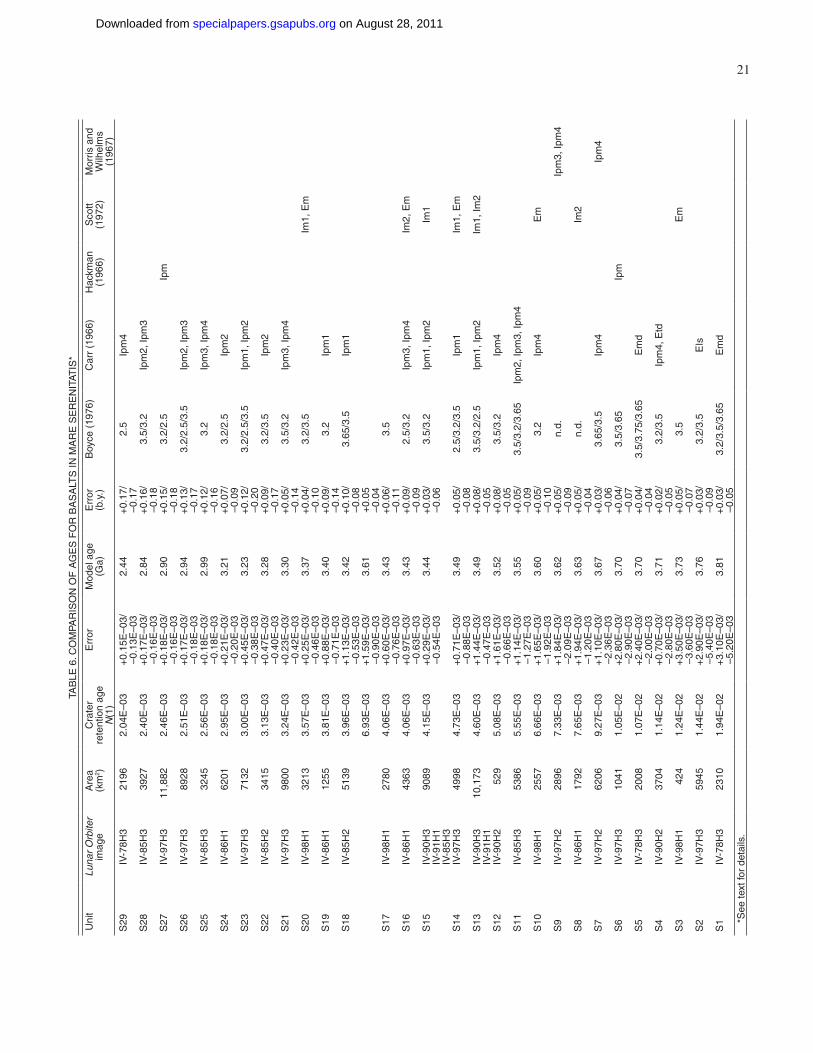
Ages and stratigraphy of lunar mare basalts 21TA
BLE
6. C
OM
PAR
ISO
N O
F A
GE
S F
OR
BA
SA
LTS
IN M
AR
E S
ER
EN
ITAT
IS*
Uni
tLu
nar
Orb
iter
imag
eA
rea
(km
2 )C
rate
r re
tent
ion
age
N(1
)
Err
orM
odel
age
(Ga)
Err
or(b
.y.)
Boy
ce (
1976
)C
arr
(196
6)H
ackm
an(1
966)
Sco
tt (1
972)
Mor
ris a
nd
Wilh
elm
s (1
967)
S29
IV-7
8H3
2196
2.04
E–0
3+
0.15
E–0
3/–0
.13E
–03
2.44
+0.
17/
–0.1
72.
5Ip
m4
S28
IV-8
5H3
3927
2.40
E–0
3+
0.17
E–0
3/–0
.16E
–03
2.84
+0.
16/
–0.1
83.
5/3.
2Ip
m2,
Ipm
3
S27
IV-9
7H3
11,8
822.
46E
–03
+0.
18E
–03/
–0.1
6E–0
32.
90+
0.15
/–0
.18
3.2/
2.5
Ipm
S26
IV-9
7H3
8928
2.51
E–0
3+
0.17
E–0
3/–0
.18E
–03
2.94
+0.
13/
–0.1
73.
2/2.
5/3.
5Ip
m2,
Ipm
3
S25
IV-8
5H3
3245
2.56
E–0
3+
0.18
E–0
3/–0
.18E
–03
2.99
+0.
12/
–0.1
63.
2Ip
m3,
Ipm
4
S24
IV-8
6H1
6201
2.95
E–0
3+
0.21
E–0
3/–0
.20E
–03
3.21
+0.
07/
–0.0
93.
2/2.
5Ip
m2
S23
IV-9
7H3
7132
3.00
E–0
3+
0.45
E–0
3/–0
.38E
–03
3.23
+0.
12/
–0.2
03.
2/2.
5/3.
5Ip
m1,
Ipm
2
S22
IV-8
5H2
3415
3.13
E–0
3+
0.47
E–0
3/–0
.40E
–03
3.28
+0.
09/
–0.1
73.
2/3.
5Ip
m2
S21
IV-9
7H3
9800
3.24
E–0
3+
0.23
E–0
3/–0
.42E
–03
3.30
+0.
05/
–0.1
43.
5/3.
2Ip
m3,
Ipm
4
S20
IV-9
8H1
3213
3.57
E–0
3+
0.25
E–0
3/–0
.46E
–03
3.37
+0.
04/
–0.1
03.
2/3.
5Im
1, E
m
S19
IV-8
6H1
1255
3.81
E–0
3+
0.88
E–0
3/–0
.71E
–03
3.40
+0.
09/
–0.1
43.
2Ip
m1
S18
IV-8
5H2
5139
3.96
E–0
3
6.93
E–0
3
+1.
13E
–03/
–0.5
3E–0
3+
1.59
E–0
3/–0
.90E
–03
3.42
3.61
+0.
10/
–0.0
8+
0.05
–0.0
4
3.65
/3.5
Ipm
1
S17
IV-9
8H1
2780
4.06
E–0
3+
0.60
E–0
3/–0
.76E
–03
3.43
+0.
06/
–0.1
13.
5
S16
IV-8
6H1
4363
4.06
E–0
3+
0.97
E–0
3/–0
.63E
–03
3.43
+0.
09/
–0.0
92.
5/3.
2Ip
m3,
Ipm
4Im
2, E
m
S15
IV-9
0H3
IV-9
1H1
IV-8
5H3
9089
4.15
E–0
3+
0.29
E–0
3/–0
.54E
–03
3.44
+0.
03/
–0.0
63.
5/3.
2Ip
m1,
Ipm
2Im
1
S14
IV-9
7H3
4998
4.73
E–0
3+
0.71
E–0
3/–0
.88E
–03
3.49
+0.
05/
–0.0
82.
5/3.
2/3.
5Ip
m1
Im1,
Em
S13
IV-9
0H3
IV-9
1H1
10,1
734.
60E
–03
+1.
44E
–03/
–0.4
7E–0
33.
49+
0.08
/–0
.05
3.5/
3.2/
2.5
Ipm
1, Ip
m2
Im1,
Im2
S12
IV-9
0H2
529
5.08
E–0
3+
1.61
E–0
3/–0
.66E
–03
3.52
+0.
08/
–0.0
53.
5/3.
2Ip
m4
S11
IV-8
5H3
5386
5.55
E–0
3+
1.14
E–0
3/–1
.27E
–03
3.55
+0.
05/
–0.0
93.
5/3.
2/3.
65Ip
m2,
Ipm
3, Ip
m4
S10
IV-9
8H1
2557
6.66
E–0
3+
1.65
E–0
3/–1
.92E
–03
3.60
+0.
05/
–0.1
03.
2Ip
m4
Em
S9
IV-9
7H2
2896
7.33
E–0
3+
1.84
E–0
3/–2
.09E
–03
3.62
+0.
05/
–0.0
9n.
d.Ip
m3,
Ipm
4
S8
IV-8
6H1
1792
7.65
E–0
3+
1.94
E–0
3/–1
.20E
–03
3.63
+0.
05/
–0.0
4n.
d.Im
2
S7
IV-9
7H2
6206
9.27
E–0
3+
1.10
E–0
3/–2
.36E
–03
3.67
+0.
03/
–0.0
63.
65/3
.5Ip
m4
Ipm
4
S6
IV-9
7H3
1041
1.05
E–0
2+
2.80
E–0
3/–2
.90E
–03
3.70
+0.
04/
–0.0
73.
5/3.
65Ip
m
S5
IV-7
8H3
2008
1.07
E–0
2+
2.40
E–0
3/–2
.00E
–03
3.70
+0.
04/
–0.0
43.
5/3.
75/3
.65
Em
d
S4
IV-9
0H2
3704
1.14
E–0
2+
0.70
E–0
3/–2
.80E
–03
3.71
+0.
02/
–0.0
53.
2/3.
5Ip
m4,
Etd
S3
IV-9
8H1
424
1.24
E–0
2+
3.50
E–0
3/–3
.60E
–03
3.73
+0.
05/
–0.0
73.
5E
m
S2
IV-9
7H3
5945
1.44
E–0
2+
2.90
E–0
3/–5
.40E
–03
3.76
+0.
03/
–0.0
93.
2/3.
5E
Is
S1
IV-7
8H3
2310
1.94
E–0
2+
3.10
E–0
3/–5
.20E
–03
3.81
+0.
03/
–0.0
53.
2/3.
5/3.
65E
md
*See
text
for
deta
ils.
on August 28, 2011specialpapers.gsapubs.orgDownloaded from
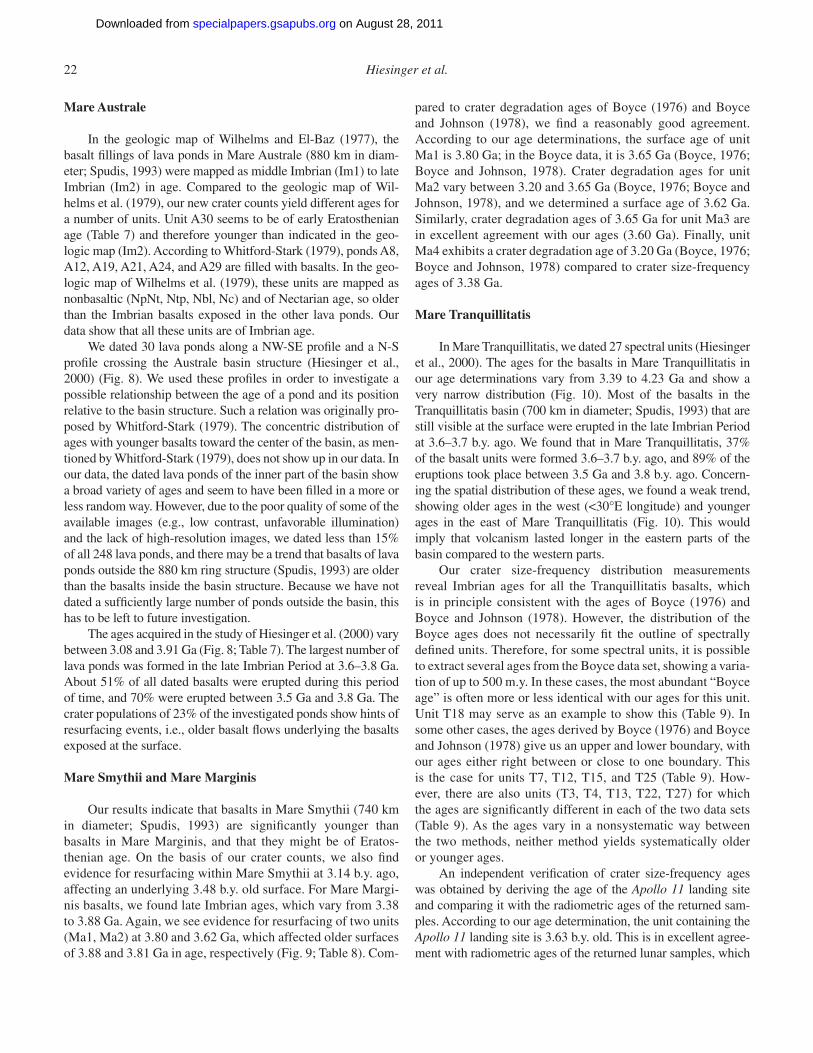
22 Hiesinger et al.
Mare Australe
In the geologic map of Wilhelms and El-Baz (1977), the basalt fi llings of lava ponds in Mare Australe (880 km in diam-eter; Spudis, 1993) were mapped as middle Imbrian (Im1) to late Imbrian (Im2) in age. Compared to the geologic map of Wil-helms et al. (1979), our new crater counts yield different ages for a number of units. Unit A30 seems to be of early Eratosthenian age (Table 7) and therefore younger than indicated in the geo-logic map (Im2). According to Whitford-Stark (1979), ponds A8, A12, A19, A21, A24, and A29 are fi lled with basalts. In the geo-logic map of Wilhelms et al. (1979), these units are mapped as nonbasaltic (NpNt, Ntp, Nbl, Nc) and of Nectarian age, so older than the Imbrian basalts exposed in the other lava ponds. Our data show that all these units are of Imbrian age.
We dated 30 lava ponds along a NW-SE profi le and a N-S profi le crossing the Australe basin structure (Hiesinger et al., 2000) (Fig. 8). We used these profi les in order to investigate a possible relationship between the age of a pond and its position relative to the basin structure. Such a relation was originally pro-posed by Whitford-Stark (1979). The concentric distribution of ages with younger basalts toward the center of the basin, as men-tioned by Whitford-Stark (1979), does not show up in our data. In our data, the dated lava ponds of the inner part of the basin show a broad variety of ages and seem to have been fi lled in a more or less random way. However, due to the poor quality of some of the available images (e.g., low contrast, unfavorable illumination) and the lack of high-resolution images, we dated less than 15% of all 248 lava ponds, and there may be a trend that basalts of lava ponds outside the 880 km ring structure (Spudis, 1993) are older than the basalts inside the basin structure. Because we have not dated a suffi ciently large number of ponds outside the basin, this has to be left to future investigation.
The ages acquired in the study of Hiesinger et al. (2000) vary between 3.08 and 3.91 Ga (Fig. 8; Table 7). The largest number of lava ponds was formed in the late Imbrian Period at 3.6–3.8 Ga. About 51% of all dated basalts were erupted during this period of time, and 70% were erupted between 3.5 Ga and 3.8 Ga. The crater populations of 23% of the investigated ponds show hints of resurfacing events, i.e., older basalt fl ows underlying the basalts exposed at the surface.
Mare Smythii and Mare Marginis
Our results indicate that basalts in Mare Smythii (740 km in diameter; Spudis, 1993) are signifi cantly younger than basalts in Mare Marginis, and that they might be of Eratos-thenian age. On the basis of our crater counts, we also fi nd evidence for resurfacing within Mare Smythii at 3.14 b.y. ago, affecting an underlying 3.48 b.y. old surface. For Mare Margi-nis basalts, we found late Imbrian ages, which vary from 3.38 to 3.88 Ga. Again, we see evidence for resurfacing of two units (Ma1, Ma2) at 3.80 and 3.62 Ga, which affected older surfaces of 3.88 and 3.81 Ga in age, respectively (Fig. 9; Table 8). Com-
pared to crater degradation ages of Boyce (1976) and Boyce and Johnson (1978), we fi nd a reasonably good agreement. According to our age determinations, the surface age of unit Ma1 is 3.80 Ga; in the Boyce data, it is 3.65 Ga (Boyce, 1976; Boyce and Johnson, 1978). Crater degradation ages for unit Ma2 vary between 3.20 and 3.65 Ga (Boyce, 1976; Boyce and Johnson, 1978), and we determined a surface age of 3.62 Ga. Similarly, crater degradation ages of 3.65 Ga for unit Ma3 are in excellent agreement with our ages (3.60 Ga). Finally, unit Ma4 exhibits a crater degradation age of 3.20 Ga (Boyce, 1976; Boyce and Johnson, 1978) compared to crater size-frequency ages of 3.38 Ga.
Mare Tranquillitatis
In Mare Tranquillitatis, we dated 27 spectral units (Hiesinger et al., 2000). The ages for the basalts in Mare Tranquillitatis in our age determinations vary from 3.39 to 4.23 Ga and show a very narrow distribution (Fig. 10). Most of the basalts in the Tranquillitatis basin (700 km in diameter; Spudis, 1993) that are still visible at the surface were erupted in the late Imbrian Period at 3.6–3.7 b.y. ago. We found that in Mare Tranquillitatis, 37% of the basalt units were formed 3.6–3.7 b.y. ago, and 89% of the eruptions took place between 3.5 Ga and 3.8 b.y. ago. Concern-ing the spatial distribution of these ages, we found a weak trend, showing older ages in the west (<30°E longitude) and younger ages in the east of Mare Tranquillitatis (Fig. 10). This would imply that volcanism lasted longer in the eastern parts of the basin compared to the western parts.
Our crater size-frequency distribution measurements reveal Imbrian ages for all the Tranquillitatis basalts, which is in principle consistent with the ages of Boyce (1976) and Boyce and Johnson (1978). However, the distribution of the Boyce ages does not necessarily fi t the outline of spectrally defi ned units. Therefore, for some spectral units, it is possible to extract several ages from the Boyce data set, showing a varia-tion of up to 500 m.y. In these cases, the most abundant “Boyce age” is often more or less identical with our ages for this unit. Unit T18 may serve as an example to show this (Table 9). In some other cases, the ages derived by Boyce (1976) and Boyce and Johnson (1978) give us an upper and lower boundary, with our ages either right between or close to one boundary. This is the case for units T7, T12, T15, and T25 (Table 9). How-ever, there are also units (T3, T4, T13, T22, T27) for which the ages are signifi cantly different in each of the two data sets (Table 9). As the ages vary in a nonsystematic way between the two methods, neither method yields systematically older or younger ages.
An independent verifi cation of crater size-frequency ages was obtained by deriving the age of the Apollo 11 landing site and comparing it with the radiometric ages of the returned sam-ples. According to our age determination, the unit containing the Apollo 11 landing site is 3.63 b.y. old. This is in excellent agree-ment with radiometric ages of the returned lunar samples, which
on August 28, 2011specialpapers.gsapubs.orgDownloaded from
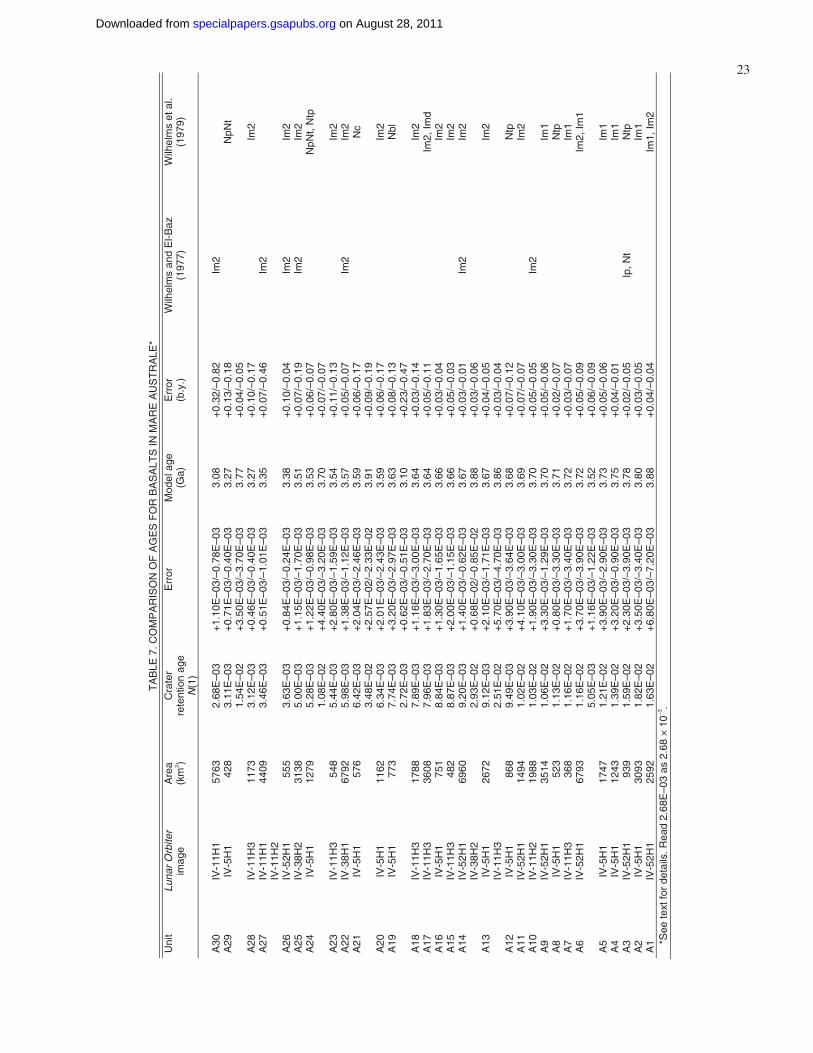
Ages and stratigraphy of lunar mare basalts 23
TA
BLE
7. C
OM
PA
RIS
ON
OF
AG
ES
FO
R B
AS
ALT
S IN
MA
RE
AU
ST
RA
LE*
Uni
t Lu
nar
Orb
iter
imag
e A
rea
(km
2 ) C
rate
rre
tent
ion
age
N(1
)
Err
orM
odel
age
(Ga)
E
rror
(b
.y.)
W
ilhel
ms
and
El-B
az
(197
7)
Wilh
elm
s et
al.
(197
9)
A30
IV
-11H
1 57
63
2.68
E–0
3+
1.10
E–0
3/–0
.78E
– 03
3.08
+0.
32/–
0.82
Im
2A
29
IV-5
H1
428
3.11
E–0
31.
54E
–02
+0.
71E
–03/
–0.4
0E– 0
3+
3.50
E–0
3/–3
.70E
–03
3.27
3.77
+
0.13
/–0.
18
+0.
04/–
0.05
N
pNt
A28
IV
-11H
3 11
73
3.12
E–0
3+
0.46
E–0
3/–0
.40E
–03
3.27
+0.
10/
2mI
71.0–A
27
IV-1
1H1
IV
-11H
2 44
09
3.46
E–0
3+
0.51
E–0
3/–1
.01E
–03
3.35
+0.
07/–
0.46
Im
2
A26
IV
-52H
1 55
5 3.
63E
–03
+0.
84E
–03/
–0.2
4E– 0
33.
38+
0.10
/2
mI2
mI 40.0–
A25
IV
-38H
2 31
38
5.00
E–0
3+
1.15
E–0
3/–1
.70E
– 03
3.51
+0.
07/
2mI
2mI
91.0–A
24
IV-5
H1
1279
5.
28E
–03
1.08
E–0
2 +
1.22
E–0
3 /–0
.98E
– 03
+4.
40E
–03/
–3.2
0E–0
3 3.
533.
70
+0.
06/–
0.07
+
0.07
/–0.
07
NpN
t, N
tp
A23
IV
-11H
3 54
8 5.
44E
–03
+2.
80E
–03 /
–1.5
9E– 0
33.
54+
0.11
/2
mI 31.0–
A22
IV
-38H
1 67
92
5.98
E–0
3+
1.38
E–0
3 /–1
.12E
– 03
3.57
+0.
05/
2mI
2mI
70.0–A
21
IV-5
H1
576
6.42
E–0
33.
48E
–02
+2.
04E
–03/
–2.4
6E– 0
3+
2.57
E–0
2/–2
.33E
–02
3.59
3.91
+
0.06
/–0.
17
+0.
09/–
0.19
N
c
A20
IV
-5H
1 11
62
6.34
E–0
3+
2.01
E–0
3 /–2
.43E
– 03
3.59
+0.
06/
2mI
71.0–A
19
IV-5
H1
773
7.74
E–0
32.
72E
–03
+3.
20E
–03 /
–2.9
7E– 0
3+
0.62
E–0
3/–0
.51E
–03
3.63
3.10
+
0.08
/–0.
13
+0.
23/–
0.47
N
bl
A18
IV
-11H
3 17
88
7.89
E–0
3+
1.16
E–0
3 /–3
.00E
– 03
3.64
+0.
03/
2mI
41.0–A
17
IV-1
1H3
3608
7.
96E
–03
+1.
83E
–03 /
–2.7
0E– 0
33.
64+
0.05
/d
mI ,2mI
11.0–A
16
IV-5
H1
751
8.84
E–0
3+
1.30
E–0
3 /–1
.65E
– 03
3.66
+0.
03/
2mI
40.0–A
15
IV-1
1H3
482
8.87
E–0
3+
2.00
E–0
3/–1
.15E
– 03
3.66
+0.
05/
2mI
30.0–A
14
IV-5
2H1
IV-3
8H2
6960
9.
20E
–03
2.93
E–0
2 +
1.40
E–0
3/–0
.62E
– 03
+0.
68E
–02/
–0.8
5E–0
2 3.
673.
88
+0.
03/–
0.01
+
0.03
/–0.
06
2mI
2mI
A13
IV
-5H
1 IV
-11H
3 26
72
9.12
E–0
32.
51E
–02
+2.
10E
–03 /
–1.7
1E– 0
3+
5.70
E–0
3/–4
.70E
–03
3.67
3.86
+
0.04
/–0.
05
+0.
03/–
0.04
Im
2
A12
IV
-5H
1 86
8 9.
49E
–03
+3.
90E
–03 /
–3.6
4E– 0
33.
68+
0.07
/pt
N 21.0–
A11
IV
-52H
1 14
94
1.02
E–0
2+
4.10
E–0
3 /–3
.00E
– 03
3.69
+0.
07/
2mI
70.0–A
10
IV-1
1H2
1988
1.
03E
–02
+1.
90E
–03 /
–3.3
0E– 0
33.
70+
0.05
/–0.
05
Im2
A9
IV-5
2H1
3514
1.
06E
–02
+3.
30E
–03 /
–1.2
9E– 0
33.
70+
0.05
/1
mI 60.0–
A8
IV-5
H1
523
1.13
E–0
2+
0.80
E–0
3 /–3
.30E
– 03
3.71
+0.
02/
ptN
70.0–A
7 IV
-11H
3 36
8 1.
16E
–02
+1.
70E
–03 /
–3.4
0E– 0
33.
72+
0.03
/1
mI 70.0–
A6
IV-5
2H1
6793
1.
16E
–02
5.05
E–0
3 +
3.70
E–0
3 /–3
.90E
– 03
+1.
16E
–03/
–1.2
2E–0
3 3.
723.
52
+0.
05/–
0.09
+
0.06
/–0.
09
Im2,
Im1
A5
IV-5
H1
1747
1.
21E
–02
+3.
90E
–03 /
–2.9
0E– 0
33.
73+
0.05
/1
mI 60.0–
A4
IV-5
H1
1243
1.
39E
–02
+3.
20E
–03 /
–0.9
0E– 0
33.
75+
0.04
/1
mI 10.0–
A3
IV-5
2H1
939
1.59
E–0
2+
2.30
E–0
3 /–3
.90E
– 03
3.78
+0.
02/
ptN
tN ,pI
50.0–A
2 IV
-5H
1 30
93
1.82
E–0
2+
3.50
E–0
3 /–3
.40E
– 03
3.80
+0.
03/
1mI
50.0–A
1 IV
-52H
1 25
92
1.63
E–0
2+
6.80
E–0
3 /–7
.20E
– 03
3.88
+0.
04/
2mI ,1
mI 40.0–
*S
ee te
xt fo
r de
tails
. Rea
d 2.
68E
–03
as 2
.68
× 1
0–3.
on August 28, 2011specialpapers.gsapubs.orgDownloaded from
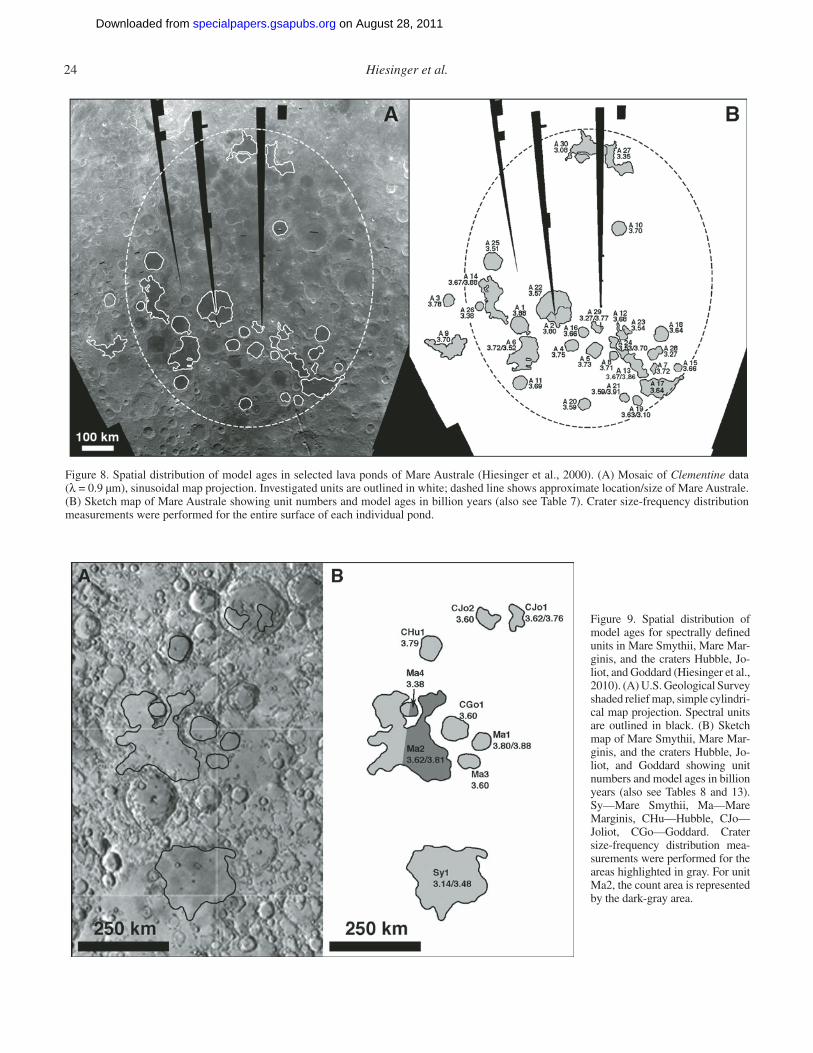
24 Hiesinger et al.
Figure 8. Spatial distribution of model ages in selected lava ponds of Mare Australe (Hiesinger et al., 2000). (A) Mosaic of Clementine data (λ = 0.9 µm), sinusoidal map projection. Investigated units are outlined in white; dashed line shows approximate location/size of Mare Australe. (B) Sketch map of Mare Australe showing unit numbers and model ages in billion years (also see Table 7). Crater size-frequency distribution measurements were performed for the entire surface of each individual pond.
Figure 9. Spatial distribution of model ages for spectrally defi ned units in Mare Smythii, Mare Mar-ginis, and the craters Hubble, Jo-liot, and Goddard (Hiesinger et al., 2010). (A) U.S. Geological Survey shaded relief map, simple cylindri-cal map projection. Spectral units are outlined in black. (B) Sketch map of Mare Smythii, Mare Mar-ginis, and the craters Hubble, Jo-liot, and Goddard showing unit numbers and model ages in billion years (also see Tables 8 and 13). Sy—Mare Smythii, Ma—Mare Marginis, CHu—Hubble, CJo—Joliot, CGo—Goddard. Crater size-frequency distribution mea-surements were performed for the areas highlighted in gray. For unit Ma2, the count area is represented by the dark-gray area.
on August 28, 2011specialpapers.gsapubs.orgDownloaded from
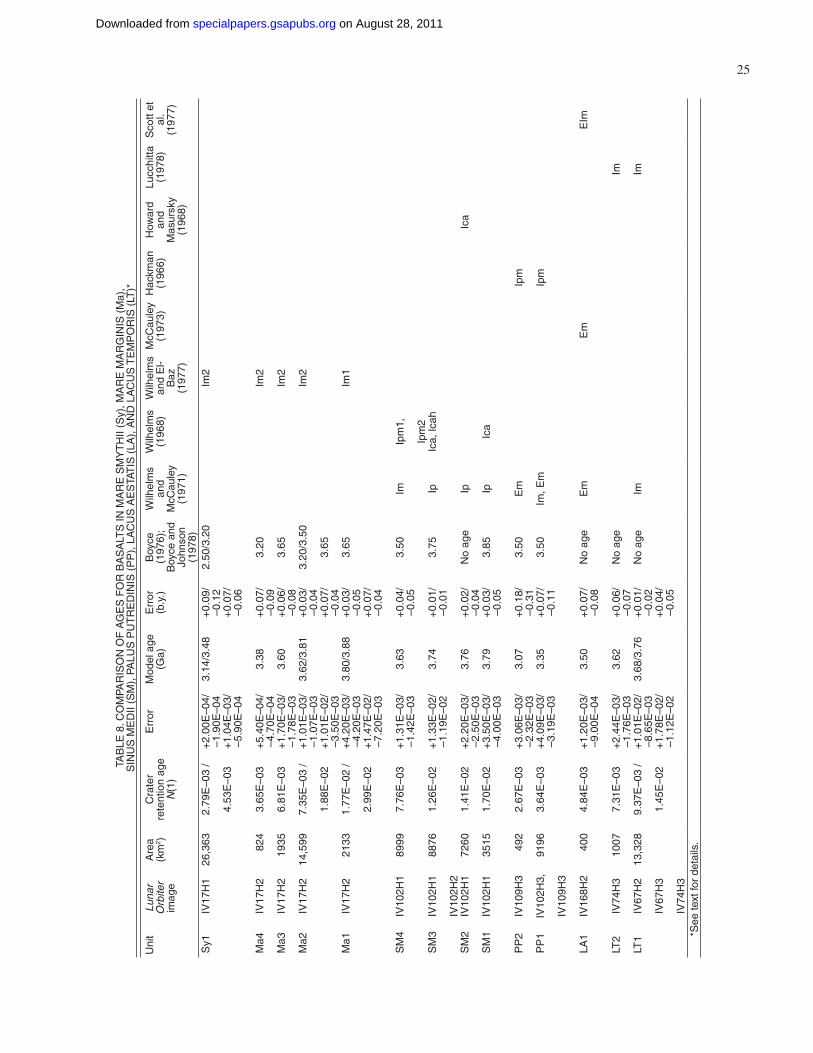
Ages and stratigraphy of lunar mare basalts 25
TAB
LE 8
. CO
MPA
RIS
ON
OF
AG
ES
FO
R B
AS
ALT
S IN
MA
RE
SM
YT
HII
(Sy)
, MA
RE
MA
RG
INIS
(M
a),
SIN
US
ME
DII
(SM
), P
ALU
S P
UT
RE
DIN
IS (
PP
), L
AC
US
AE
STA
TIS
(LA
), A
ND
LA
CU
S T
EM
PO
RIS
(LT
)*
Uni
tLu
nar
Orb
iter
imag
e
Are
a(k
m2 )
Cra
ter
rete
ntio
n ag
e N
(1)
Err
orM
odel
age
(G
a)E
rror
(b.y
.)B
oyce
(197
6);
Boy
ce a
nd
John
son
(197
8)
Wilh
elm
s an
d M
cCau
ley
(197
1)
Wilh
elm
s(1
968)
Wilh
elm
s an
d E
l-B
az(1
977)
McC
aule
y(1
973)
Hac
kman
(196
6)H
owar
d an
dM
asur
sky
(196
8)
Lucc
hitta
(197
8)S
cott
et
al.
(197
7)
Sy1
IV17
H1
26,3
632.
79E
–03
/+
2.00
E–0
4/–1
.90E
–04
3.14
/3.4
8+
0.09
/–0
.12
2.50
/3.2
0Im
2
4.53
E–0
3+
1.04
E–0
3/–5
.90E
–04
+0.
07/
–0.0
6
Ma4
IV17
H2
824
3.65
E–0
3+
5.40
E–0
4/–4
.70E
–04
3.38
+0.
07/
–0.0
93.
20Im
2
Ma3
IV17
H2
1935
6.81
E–0
3+
1.70
E–0
3/–1
.78E
–03
3.60
+0.
06/
–0.0
83.
65Im
2
Ma2
IV17
H2
14,5
997.
35E
–03
/+
1.01
E–0
3/–1
.07E
–03
3.62
/3.8
1+
0.03
/–0
.04
3.20
/3.5
0Im
2
1.88
E–0
2+
1.01
E–0
2/–3
.50E
–03
+0.
07/
–0.0
43.
65
Ma1
IV17
H2
2133
1.77
E–0
2 /
+4.
20E
–03/
–4.2
0E–0
33.
80/3
.88
+0.
03/
–0.0
53.
65Im
1
2.99
E–0
2+
1.47
E–0
2/–7
.20E
–03
+0.
07/
–0.0
4
SM
4IV
102H
189
997.
76E
–03
+1.
31E
–03/
–1.4
2E–0
33.
63+
0.04
/–0
.05
3.50
ImIp
m1,
Ipm
2S
M3
IV10
2H1
8876
1.26
E–0
2+
1.33
E–0
2/–1
.19E
–02
3.74
+0.
01/
–0.0
13.
75Ip
Ica,
Icah
IV10
2H2
SM
2IV
102H
172
601.
41E
–02
+2.
20E
–03/
–2.5
0E–0
33.
76+
0.02
/–0
.04
No
age
IpIc
a
SM
1IV
102H
135
151.
70E
–02
+3.
50E
–03/
–4.0
0E–0
33.
79+
0.03
/–0
.05
3.85
IpIc
a
PP
2IV
109H
349
22.
67E
–03
+3.
06E
–03/
–2.3
2E–0
33.
07+
0.18
/–0
.31
3.50
Em
Ipm
PP
1IV
102H
3,91
963.
64E
–03
+4.
09E
–03/
–3.1
9E–0
33.
35+
0.07
/–0
.11
3.50
Im, E
mIp
m
IV10
9H3
LA1
IV16
8H2
400
4.84
E–0
3+
1.20
E–0
3/–9
.00E
–04
3.50
+0.
07/
–0.0
8N
o ag
eE
mE
mE
Im
LT2
IV74
H3
1007
7.31
E–0
3+
2.44
E–0
3/–1
.76E
–03
3.62
+0.
06/
–0.0
7N
o ag
eIm
LT1
IV67
H2
13,3
289.
37E
–03
/+
1.01
E–0
2/–8
.65E
–03
3.68
/3.7
6+
0.01
/–0
.02
No
age
ImIm
IV67
H3
1.45
E–0
2+
1.78
E–0
2/–1
.12E
–02
+0.
04/
–0.0
5IV
74H
3
*See
text
for
deta
ils.
on August 28, 2011specialpapers.gsapubs.orgDownloaded from
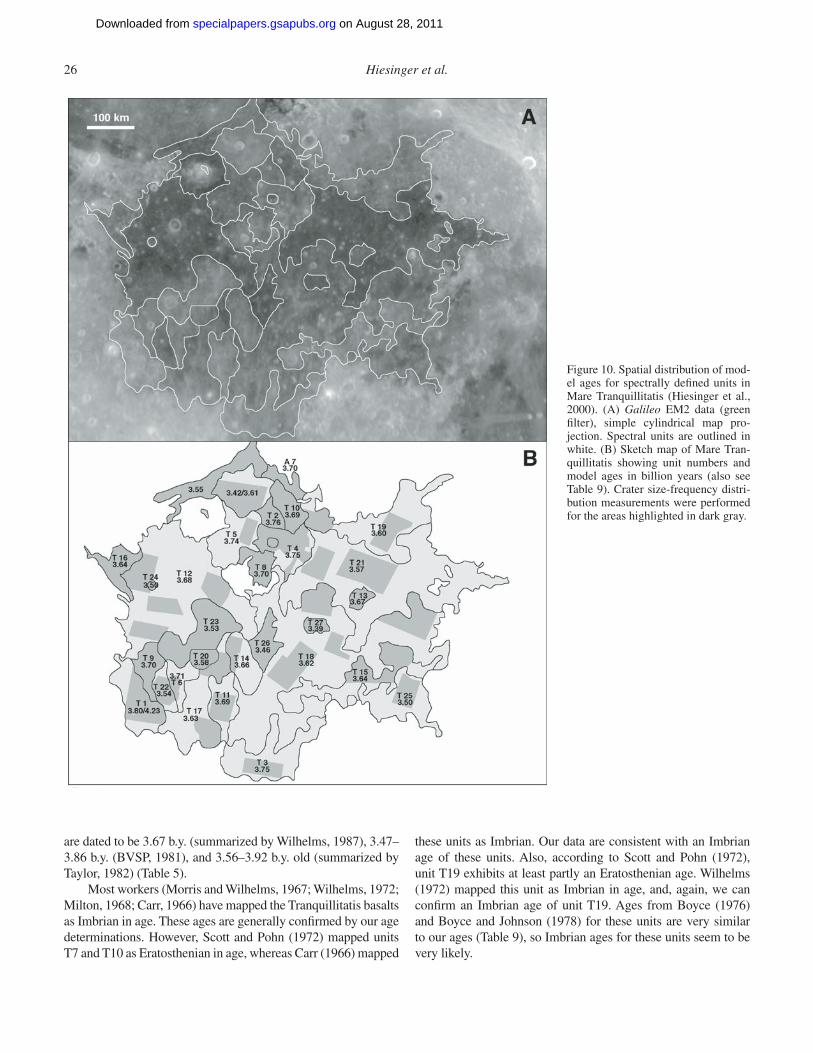
26 Hiesinger et al.
are dated to be 3.67 b.y. (summarized by Wilhelms, 1987), 3.47–3.86 b.y. (BVSP, 1981), and 3.56–3.92 b.y. old (summarized by Taylor, 1982) (Table 5).
Most workers (Morris and Wilhelms, 1967; Wilhelms, 1972; Milton, 1968; Carr, 1966) have mapped the Tranquillitatis basalts as Imbrian in age. These ages are generally confi rmed by our age determinations. However, Scott and Pohn (1972) mapped units T7 and T10 as Eratosthenian in age, whereas Carr (1966) mapped
these units as Imbrian. Our data are consistent with an Imbrian age of these units. Also, according to Scott and Pohn (1972), unit T19 exhibits at least partly an Eratosthenian age. Wilhelms (1972) mapped this unit as Imbrian in age, and, again, we can confi rm an Imbrian age of unit T19. Ages from Boyce (1976) and Boyce and Johnson (1978) for these units are very similar to our ages (Table 9), so Imbrian ages for these units seem to be very likely.
Figure 10. Spatial distribution of mod-el ages for spectrally defi ned units in Mare Tranquillitatis (Hiesinger et al., 2000). (A) Galileo EM2 data (green fi lter), simple cylindrical map pro-jection. Spectral units are outlined in white. (B) Sketch map of Mare Tran-quillitatis showing unit numbers and model ages in billion years (also see Table 9). Crater size-frequency distri-bution measurements were performed for the areas highlighted in dark gray.
on August 28, 2011specialpapers.gsapubs.orgDownloaded from
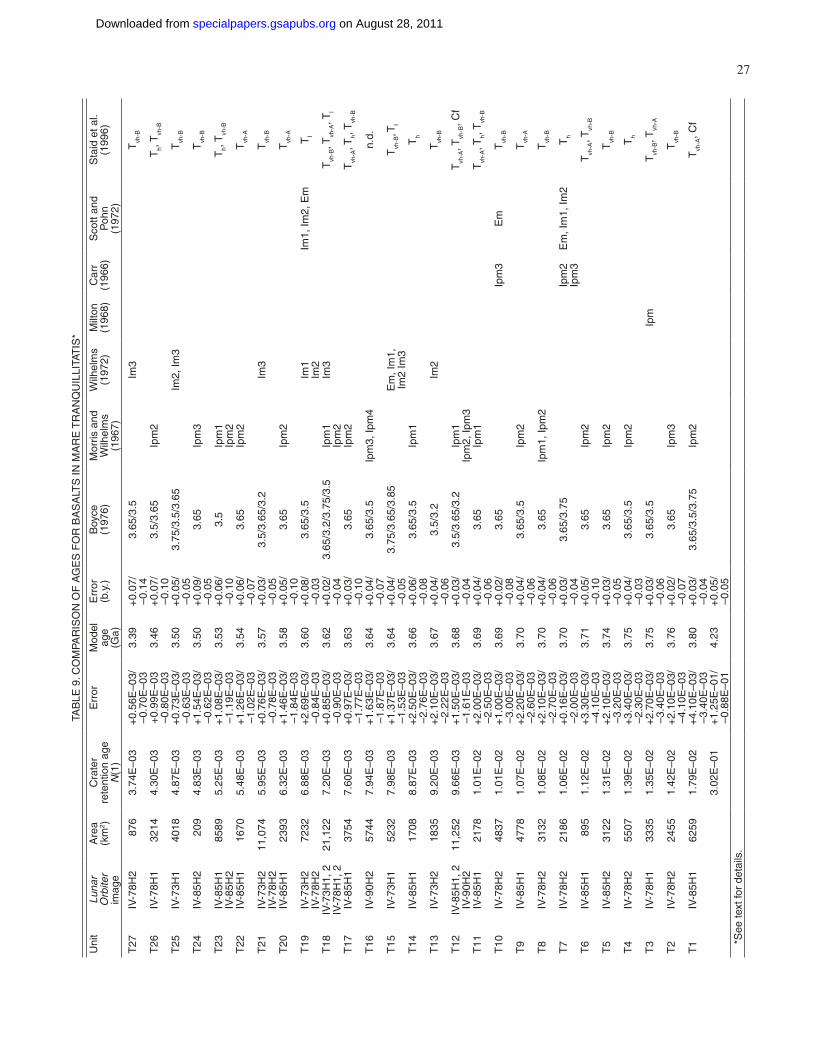
Ages and stratigraphy of lunar mare basalts 27TA
BLE
9. C
OM
PAR
ISO
N O
F A
GE
S F
OR
BA
SA
LTS
IN M
AR
E T
RA
NQ
UIL
LITA
TIS
*
Uni
tLu
nar
Orb
iter
imag
e
Are
a (k
m2 )
Cra
ter
rete
ntio
n ag
e N
(1)
Err
orM
odel
ag
e(G
a)
Err
or
(b.y
.)B
oyce
(197
6)M
orris
and
W
ilhel
ms
(196
7)
Wilh
elm
s(1
972)
Milt
on(1
968)
Car
r(1
966)
Sco
tt an
d P
ohn
(197
2)
Sta
id e
t al.
(199
6)
T27
IV-7
8H2
876
3.74
E–0
3+
0.56
E–0
3/–0
.70E
–03
3.39
+0.
07/
–0.1
43.
65/3
.5Im
3T
vh-B
T26
IV-7
8H1
3214
4.30
E–0
3+
0.99
E–0
3–0
.80E
–03
3.46
+0.
07/
–0.1
03.
5/3.
65Ip
m2
Th,
Tvh
-B
T25
IV-7
3H1
4018
4.87
E–0
3+
0.73
E–0
3/–0
.63E
–03
3.50
+0.
05/
–0.0
53.
75/3
.5/3
.65
Im2,
Im3
Tvh
-B
T24
IV-8
5H2
209
4.83
E–0
3+
1.54
E–0
3/–0
.62E
–03
3.50
+0.
09/
–0.0
53.
65Ip
m3
Tvh
-B
T23
IV-8
5H1
IV-8
5H2
8589
5.25
E–0
3+
1.08
E–0
3/–1
.19E
–03
3.53
+0.
06/
–0.1
03.
5Ip
m1
Ipm
2T
h, T
vh-B
T22
IV-8
5H1
1670
5.48
E–0
3+
1.26
E–0
3/–1
.02E
–03
3.54
+0.
06/
–0.0
73.
65Ip
m2
Tvh
-A
T21
IV-7
3H2
IV-7
8H2
11,0
745.
95E
–03
+0.
76E
–03/
–0.7
8E–0
33.
57+
0.03
/–0
.05
3.5/
3.65
/3.2
Im3
Tvh
-B
T20
IV-8
5H1
2393
6.32
E–0
3+
1.46
E–0
3/–1
.84E
–03
3.58
+0.
05/
–0.1
03.
65Ip
m2
Tvh
-A
T19
IV-7
3H2
IV-7
8H2
7232
6.88
E–0
3+
2.69
E–0
3/–0
.84E
–03
3.60
+0.
08/
–0.0
33.
65/3
.5Im
1Im
2Im
1, Im
2, E
mT
l
T18
IV-7
3H1,
2IV
-78H
1, 2
21,1
227.
20E
–03
+0.
85E
–03/
–0.9
0E–0
33.
62+
0.02
/–0
.04
3.65
/3.2
/3.7
5/3.
5Ip
m1
Ipm
2Im
3T
vh-B
, Tvh
-A, T
l
T17
IV-8
5H1
3754
7.60
E–0
3+
0.97
E–0
3/–1
.77E
–03
3.63
+0.
03/
–0.1
03.
65Ip
m2
Tvh
-A, T
h, T
vh-B
T16
IV-9
0H2
5744
7.94
E–0
3+
1.63
E–0
3/–1
.87E
–03
3.64
+0.
04/
–0.0
73.
65/3
.5Ip
m3,
Ipm
4n.
d.
T15
IV-7
3H1
5232
7.98
E–0
3+
1.37
E–0
3/–1
.53E
–03
3.64
+0.
04/
–0.0
53.
75/3
.65/
3.85
Em
, Im
1,
Im2
Im3
Tvh
-B, T
l
T14
IV-8
5H1
1708
8.87
E–0
3+
2.50
E–0
3/–2
.76E
–03
3.66
+0.
06/
–0.0
83.
65/3
.5Ip
m1
Th
T13
IV-7
3H2
1835
9.20
E–0
3+
2.10
E–0
3/–2
.22E
–03
3.67
+0.
04/
–0.0
63.
5/3.
2Im
2T
vh-B
T12
IV-8
5H1,
2IV
-90H
211
,252
9.66
E–0
3+
1.50
E–0
3/–1
.61E
–03
3.68
+0.
03/
–0.0
43.
5/3.
65/3
.2Ip
m1
Ipm
2, Ip
m3
Tvh
-A, T
vh-B
, Cf
T11
IV-8
5H1
2178
1.01
E–0
2+
2.00
E–0
3/–2
.50E
–03
3.69
+0.
04/
–0.0
63.
65Ip
m1
Tvh
-A, T
h, T
vh-B
T10
IV-7
8H2
4837
1.01
E–0
2+
1.00
E–0
3/–3
.00E
–03
3.69
+0.
02/
–0.0
83.
65Ip
m3
Em
Tvh
-B
T9
IV-8
5H1
4778
1.07
E–0
2+
2.20
E–0
3/–2
.60E
–03
3.70
+0.
04/
–0.0
63.
65/3
.5Ip
m2
Tvh
-A
T8
IV-7
8H2
3132
1.08
E–0
2+
2.10
E–0
3/–2
.70E
–03
3.70
+0.
04/
–0.0
63.
65Ip
m1,
Ipm
2T
vh-B
T7
IV-7
8H2
2186
1.06
E–0
2+
0.16
E–0
3/–2
.00E
–03
3.70
+0.
03/
–0.0
43.
65/3
.75
Ipm
2 Ip
m3
Em
, Im
1, Im
2T
h
T6
IV-8
5H1
895
1.12
E–0
2+
3.30
E–0
3/–4
.10E
–03
3.71
+0.
05/
–0.1
03.
65Ip
m2
Tvh
-A, T
vh-B
T5
IV-8
5H2
3122
1.31
E–0
2+
2.10
E–0
3/–3
.20E
–03
3.74
+0.
03/
–0.0
53.
65Ip
m2
Tvh
-B
T4
IV-7
8H2
5507
1.39
E–0
2+
3.40
E–0
3/–2
.30E
–03
3.75
+0.
04/
–0.0
33.
65/3
.5Ip
m2
Th
T3
IV-7
8H1
3335
1.35
E–0
2+
2.70
E–0
3/–3
.40E
–03
3.75
+0.
03/
–0.0
63.
65/3
.5Ip
mT
vh-B
, Tvh
-A
T2
IV-7
8H2
2455
1.42
E–0
2+
2.10
E–0
3/–4
.10E
–03
3.76
+0.
02/
–0.0
73.
65Ip
m3
Tvh
-B
T1
IV-8
5H1
6259
1.79
E–0
2
3.02
E–0
1
+4.
10E
–03/
–3.4
0E–0
3+
1.25
E–0
1/–0
.88E
–01
3.80
4.23
+0.
03/
–0.0
4+
0.05
/–0
.05
3.65
/3.5
/3.7
5Ip
m2
Tvh
-A, C
f
*See
text
for
deta
ils.
on August 28, 2011specialpapers.gsapubs.orgDownloaded from
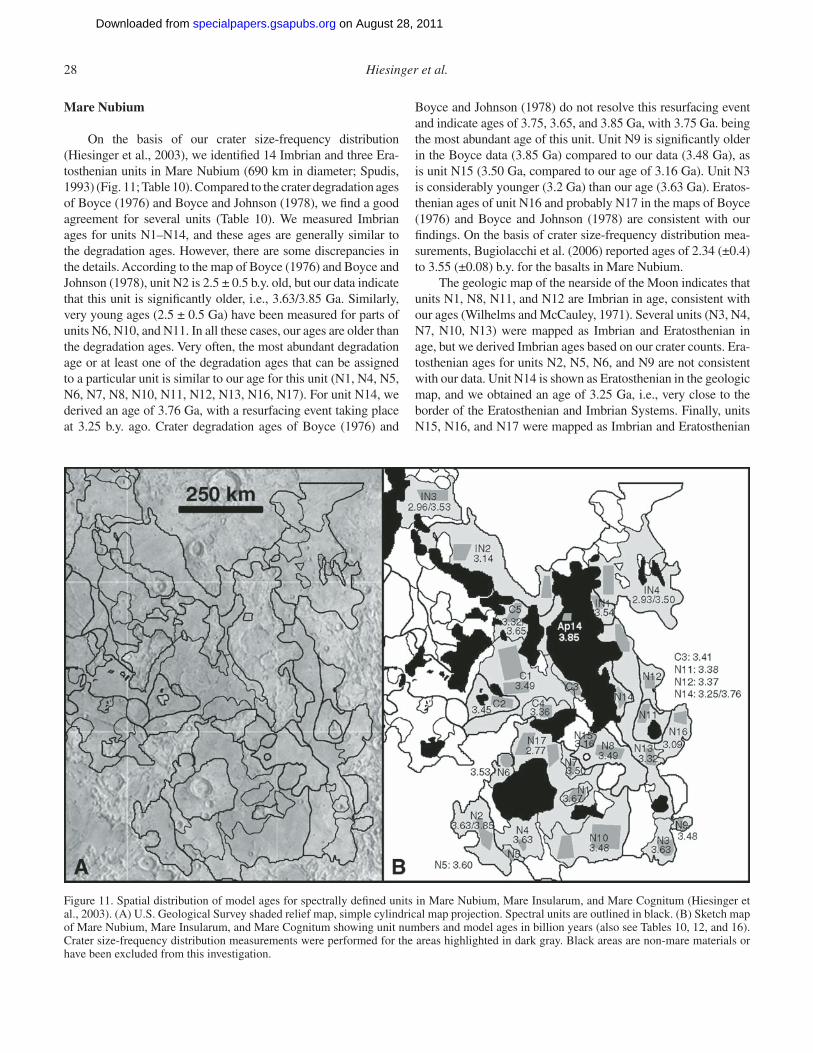
28 Hiesinger et al.
Mare Nubium
On the basis of our crater size-frequency distribution (Hiesinger et al., 2003), we identifi ed 14 Imbrian and three Era-tosthenian units in Mare Nubium (690 km in diameter; Spudis, 1993) (Fig. 11; Table 10). Compared to the crater degradation ages of Boyce (1976) and Boyce and Johnson (1978), we fi nd a good agreement for several units (Table 10). We measured Imbrian ages for units N1–N14, and these ages are generally similar to the degradation ages. However, there are some discrepancies in the details. According to the map of Boyce (1976) and Boyce and Johnson (1978), unit N2 is 2.5 ± 0.5 b.y. old, but our data indicate that this unit is signifi cantly older, i.e., 3.63/3.85 Ga. Similarly, very young ages (2.5 ± 0.5 Ga) have been measured for parts of units N6, N10, and N11. In all these cases, our ages are older than the degradation ages. Very often, the most abundant degradation age or at least one of the degradation ages that can be assigned to a particular unit is similar to our age for this unit (N1, N4, N5, N6, N7, N8, N10, N11, N12, N13, N16, N17). For unit N14, we derived an age of 3.76 Ga, with a resurfacing event taking place at 3.25 b.y. ago. Crater degradation ages of Boyce (1976) and
Boyce and Johnson (1978) do not resolve this resurfacing event and indicate ages of 3.75, 3.65, and 3.85 Ga, with 3.75 Ga. being the most abundant age of this unit. Unit N9 is signifi cantly older in the Boyce data (3.85 Ga) compared to our data (3.48 Ga), as is unit N15 (3.50 Ga, compared to our age of 3.16 Ga). Unit N3 is considerably younger (3.2 Ga) than our age (3.63 Ga). Eratos-thenian ages of unit N16 and probably N17 in the maps of Boyce (1976) and Boyce and Johnson (1978) are consistent with our fi ndings. On the basis of crater size-frequency distribution mea-surements, Bugiolacchi et al. (2006) reported ages of 2.34 (±0.4) to 3.55 (±0.08) b.y. for the basalts in Mare Nubium.
The geologic map of the nearside of the Moon indicates that units N1, N8, N11, and N12 are Imbrian in age, consistent with our ages (Wilhelms and McCauley, 1971). Several units (N3, N4, N7, N10, N13) were mapped as Imbrian and Eratosthenian in age, but we derived Imbrian ages based on our crater counts. Era-tosthenian ages for units N2, N5, N6, and N9 are not consistent with our data. Unit N14 is shown as Eratosthenian in the geologic map, and we obtained an age of 3.25 Ga, i.e., very close to the border of the Eratosthenian and Imbrian Systems. Finally, units N15, N16, and N17 were mapped as Imbrian and Eratosthenian
Figure 11. Spatial distribution of model ages for spectrally defi ned units in Mare Nubium, Mare Insularum, and Mare Cognitum (Hiesinger et al., 2003). (A) U.S. Geological Survey shaded relief map, simple cylindrical map projection. Spectral units are outlined in black. (B) Sketch map of Mare Nubium, Mare Insularum, and Mare Cognitum showing unit numbers and model ages in billion years (also see Tables 10, 12, and 16). Crater size-frequency distribution measurements were performed for the areas highlighted in dark gray. Black areas are non-mare materials or have been excluded from this investigation.
on August 28, 2011specialpapers.gsapubs.orgDownloaded from
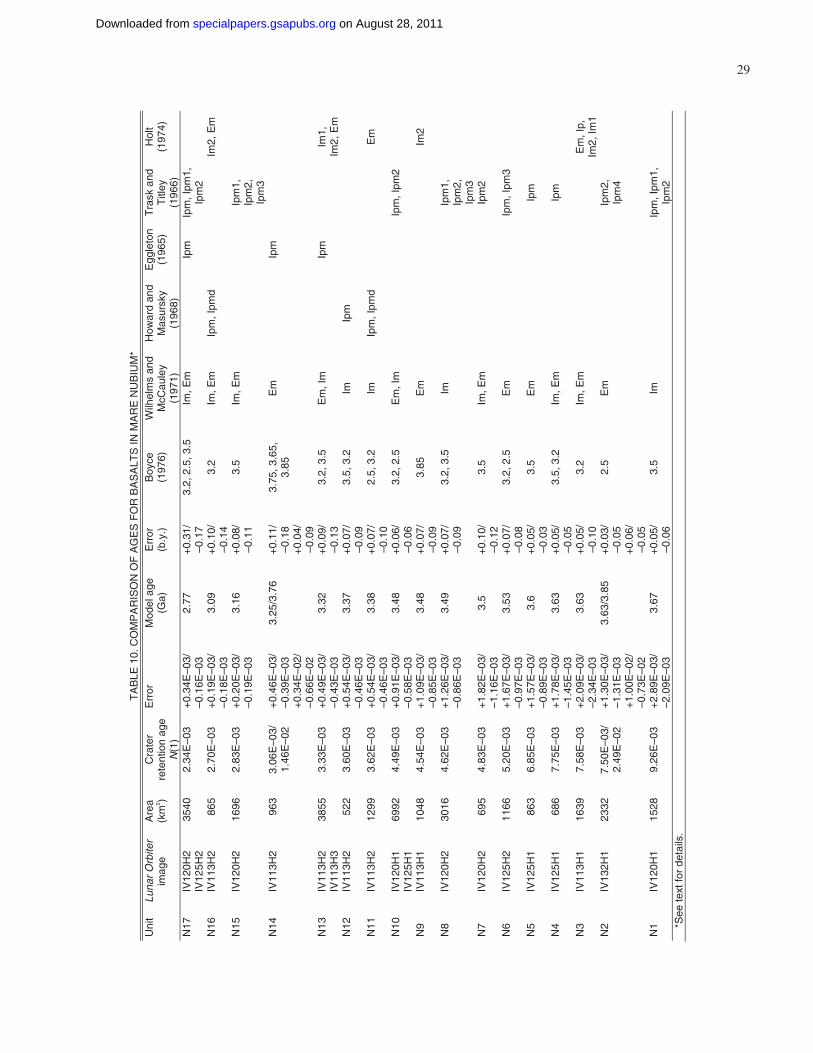
Ages and stratigraphy of lunar mare basalts 29
TA
BLE
10.
CO
MP
AR
ISO
N O
F A
GE
S F
OR
BA
SA
LTS
IN M
AR
E N
UB
IUM
* U
nit
Luna
r O
rbite
r im
age
Are
a (k
m2 )
Cra
ter
rete
ntio
n ag
e N
(1)
Err
or
Mod
el a
ge
(Ga)
E
rror
(b
.y.)
B
oyce
(1
976)
W
ilhel
ms
and
McC
aule
y (1
971)
How
ard
and
Mas
ursk
y (1
968)
Egg
leto
n (1
965)
T
rask
and
T
itley
(1
966)
Hol
t (1
974)
N17
IV
120H
2 IV
125H
2 35
40
2.34
E–0
3 +
0.34
E–0
3/
–0.1
6E–0
3 2.
77
+0.
31/
–0.1
7 3.
2, 2
.5, 3
.5
Im, E
m
Ip
m
Ipm
, Ipm
1,
Ipm
2
N16
IV
113H
2 86
5 2.
70E
–03
+0.
19E
–03/
–0
.18E
–03
3.09
+
0.10
/ –0
.14
3.2
Im, E
m
Ipm
, Ipm
d
Im
2, E
m
N15
IV
120H
2 16
96
2.83
E–0
3 +
0.20
E–0
3/
–0.1
9E–0
3 3.
16
+0.
08/
–0.1
1 3.
5 Im
, Em
Ip
m1,
Ip
m2,
Ip
m3
N14
IV
113H
2 96
3 3.
06E
–03/
1.
46E
–02
+0.
46E
–03/
–0
.39E
–03
+0.
34E
–02/
–0
.66E
–02
3.25
/3.7
6 +
0.11
/ –0
.18
+0.
04/
–0.0
9
3.75
, 3.6
5,
3.85
E
m
Ip
m
N13
IV
113H
2 IV
113H
3 38
55
3.33
E–0
3 +
0.49
E–0
3/
–0.4
3E–0
3 3.
32
+0.
09/
–0.1
3 3.
2, 3
.5
Em
, Im
Ipm
Im1,
Im
2, E
m
N12
IV
113H
2 52
2 3.
60E
–03
+0.
54E
–03/
–0
.46E
–03
3.37
+
0.07
/ –0
.09
3.5,
3.2
Im
Ip
m
N11
IV
113H
2 12
99
3.62
E–0
3 +
0.54
E–0
3/
–0.4
6E–0
3 3.
38
+0.
07/
–0.1
0 2.
5, 3
.2
Im
Ipm
, Ipm
d
E
m
N10
IV
120H
1 IV
125H
1 69
92
4.49
E–0
3 +
0.91
E–0
3/
–0.5
8E–0
3 3.
48
+0.
06/
–0.0
6 3.
2, 2
.5
Em
, Im
Ip
m, I
pm2
N9
IV11
3H1
1048
4.
54E
–03
+1.
09E
–03/
–0
.85E
–03
3.48
+
0.07
/ –0
.09
3.85
E
m
Im
2
N8
IV12
0H2
3016
4.
62E
–03
+1.
26E
–03/
–0
.86E
–03
3.49
+
0.07
/ –0
.09
3.2,
3.5
Im
Ip
m1,
Ip
m2,
Ip
m3
N7
IV12
0H2
695
4.83
E–0
3 +
1.82
E–0
3/
–1.1
6E–0
3 3.
5 +
0.10
/ –0
.12
3.5
Im, E
m
Ipm
2
N6
IV12
5H2
1166
5.
20E
–03
+1.
67E
–03/
–0
.97E
–03
3.53
+
0.07
/ –0
.08
3.2,
2.5
E
m
Ipm
, Ipm
3
N5
IV12
5H1
863
6.85
E–0
3 +
1.57
E–0
3/
–0.8
9E–0
3 3.
6 +
0.05
/ –0
.03
3.5
Em
Ip
m
N4
IV12
5H1
686
7.75
E–0
3 +
1.78
E–0
3/
–1.4
5E–0
3 3.
63
+0.
05/
–0.0
5 3.
5, 3
.2
Im, E
m
Ipm
N3
IV11
3H1
1639
7.
58E
–03
+2.
09E
–03/
–2
.34E
–03
3.63
+
0.05
/ –0
.10
3.2
Im, E
m
E
m, I
p,
Im2,
Im1
N2
IV13
2H1
2332
7.
50E
–03/
2.
49E
–02
+1.
30E
–03/
–1
.31E
–03
+1.
00E
–02/
–0
.73E
–02
3.63
/3.8
5 +
0.03
/ –0
.05
+0.
06/
–0.0
5
2.5
Em
Ip
m2,
Ip
m4
N1
IV12
0H1
1528
9.
26E
–03
+2.
89E
–03/
–2
.09E
–03
3.67
+
0.05
/ –0
.06
3.5
Im
Ipm
, Ipm
1,
Ipm
2
*S
ee te
xt fo
r de
tails
.
on August 28, 2011specialpapers.gsapubs.orgDownloaded from
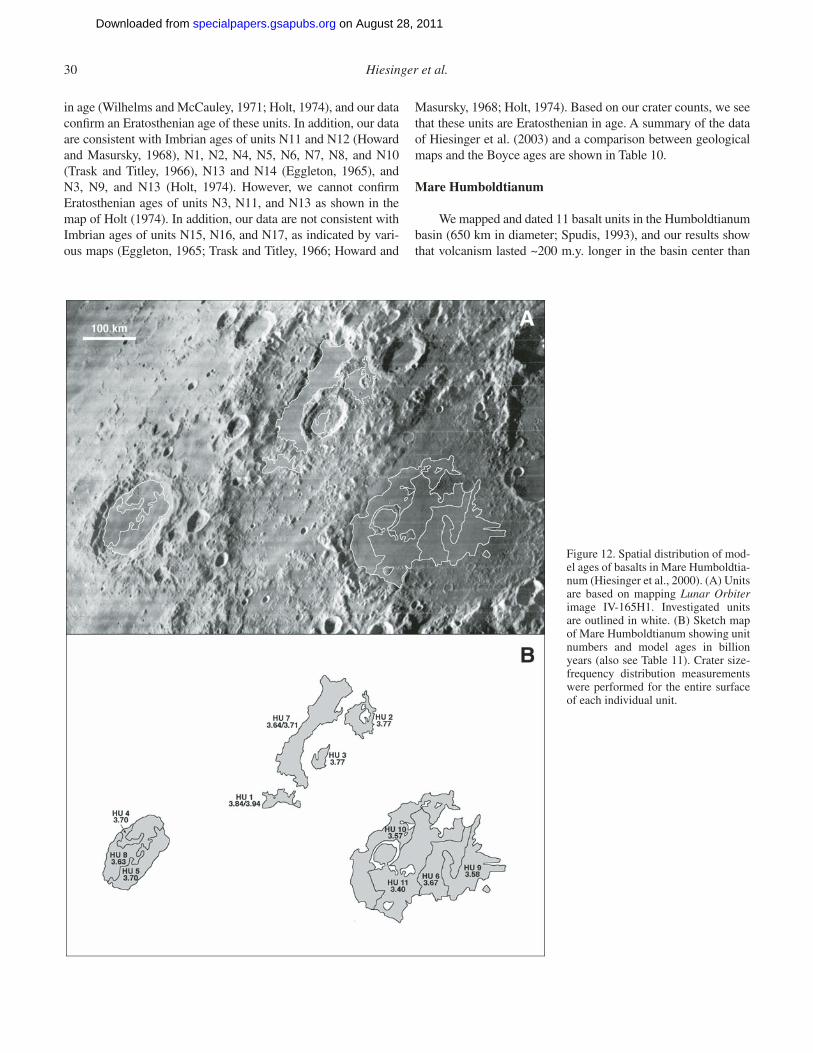
30 Hiesinger et al.
in age (Wilhelms and McCauley, 1971; Holt, 1974), and our data confi rm an Eratosthenian age of these units. In addition, our data are consistent with Imbrian ages of units N11 and N12 (Howard and Masursky, 1968), N1, N2, N4, N5, N6, N7, N8, and N10 (Trask and Titley, 1966), N13 and N14 (Eggleton, 1965), and N3, N9, and N13 (Holt, 1974). However, we cannot confi rm Eratosthenian ages of units N3, N11, and N13 as shown in the map of Holt (1974). In addition, our data are not consistent with Imbrian ages of units N15, N16, and N17, as indicated by vari-ous maps (Eggleton, 1965; Trask and Titley, 1966; Howard and
Masursky, 1968; Holt, 1974). Based on our crater counts, we see that these units are Eratosthenian in age. A summary of the data of Hiesinger et al. (2003) and a comparison between geological maps and the Boyce ages are shown in Table 10.
Mare Humboldtianum
We mapped and dated 11 basalt units in the Humboldtianum basin (650 km in diameter; Spudis, 1993), and our results show that volcanism lasted ~200 m.y. longer in the basin center than
Figure 12. Spatial distribution of mod-el ages of basalts in Mare Humboldtia-num (Hiesinger et al., 2000). (A) Units are based on mapping Lunar Orbiter image IV-165H1. Investigated units are outlined in white. (B) Sketch map of Mare Humboldtianum showing unit numbers and model ages in billion years (also see Table 11). Crater size-frequency distribution measurements were performed for the entire surface of each individual unit.
on August 28, 2011specialpapers.gsapubs.orgDownloaded from
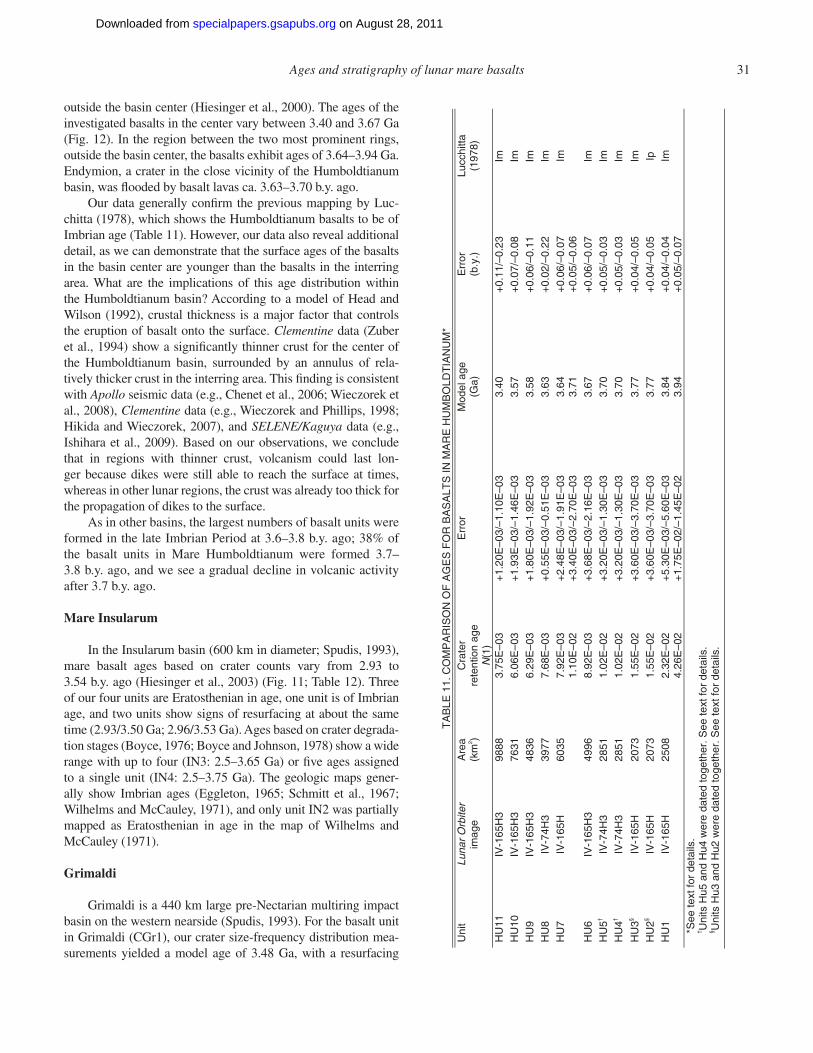
Ages and stratigraphy of lunar mare basalts 31
outside the basin center (Hiesinger et al., 2000). The ages of the investigated basalts in the center vary between 3.40 and 3.67 Ga (Fig. 12). In the region between the two most prominent rings, outside the basin center, the basalts exhibit ages of 3.64–3.94 Ga. Endymion, a crater in the close vicinity of the Humboldtianum basin, was fl ooded by basalt lavas ca. 3.63–3.70 b.y. ago.
Our data generally confi rm the previous mapping by Luc-chitta (1978), which shows the Humboldtianum basalts to be of Imbrian age (Table 11). However, our data also reveal additional detail, as we can demonstrate that the surface ages of the basalts in the basin center are younger than the basalts in the interring area. What are the implications of this age distribution within the Humboldtianum basin? According to a model of Head and Wilson (1992), crustal thickness is a major factor that controls the eruption of basalt onto the surface. Clementine data (Zuber et al., 1994) show a signifi cantly thinner crust for the center of the Humboldtianum basin, surrounded by an annulus of rela-tively thicker crust in the interring area. This fi nding is consistent with Apollo seismic data (e.g., Chenet et al., 2006; Wieczorek et al., 2008), Clementine data (e.g., Wieczorek and Phillips, 1998; Hikida and Wieczorek, 2007), and SELENE/Kaguya data (e.g., Ishihara et al., 2009). Based on our observations, we conclude that in regions with thinner crust, volcanism could last lon-ger because dikes were still able to reach the surface at times, whereas in other lunar regions, the crust was already too thick for the propagation of dikes to the surface.
As in other basins, the largest numbers of basalt units were formed in the late Imbrian Period at 3.6–3.8 b.y. ago; 38% of the basalt units in Mare Humboldtianum were formed 3.7–3.8 b.y. ago, and we see a gradual decline in volcanic activity after 3.7 b.y. ago.
Mare Insularum
In the Insularum basin (600 km in diameter; Spudis, 1993), mare basalt ages based on crater counts vary from 2.93 to 3.54 b.y. ago (Hiesinger et al., 2003) (Fig. 11; Table 12). Three of our four units are Eratosthenian in age, one unit is of Imbrian age, and two units show signs of resurfacing at about the same time (2.93/3.50 Ga; 2.96/3.53 Ga). Ages based on crater degrada-tion stages (Boyce, 1976; Boyce and Johnson, 1978) show a wide range with up to four (IN3: 2.5–3.65 Ga) or fi ve ages assigned to a single unit (IN4: 2.5–3.75 Ga). The geologic maps gener-ally show Imbrian ages (Eggleton, 1965; Schmitt et al., 1967; Wilhelms and McCauley, 1971), and only unit IN2 was partially mapped as Eratosthenian in age in the map of Wilhelms and McCauley (1971).
Grimaldi
Grimaldi is a 440 km large pre-Nectarian multiring impact basin on the western nearside (Spudis, 1993). For the basalt unit in Grimaldi (CGr1), our crater size-frequency distribution mea-surements yielded a model age of 3.48 Ga, with a resurfacing
TA
BLE
11.
CO
MP
AR
ISO
N O
F A
GE
S F
OR
BA
SA
LTS
IN M
AR
E H
UM
BO
LDT
IAN
UM
*
Uni
t Lu
nar
Orb
iter
imag
e A
rea
(km
2 ) C
rate
r
rete
ntio
n ag
e N
(1)
Err
or
Mod
el a
ge
(Ga)
E
rror
(b
.y.)
Lu
cchi
tta
(197
8)
HU
11
IV-1
65H
3 98
88
3.75
E–0
3 +
1.20
E–0
3/–1
.10E
–03
3.40
+
0.11
/–0.
23
Im
HU
10
IV-1
65H
3 76
31
6.06
E–0
3 +
1.93
E–0
3/–1
.46E
–03
3.57
+
0.07
/–0.
08
Im
HU
9 IV
-165
H3
4836
6.
29E
–03
+1.
80E
–03/
–1.9
2E–0
3 3.
58
+0.
06/–
0.11
Im
HU
8 IV
-74H
3 39
77
7.68
E–0
3 +
0.55
E–0
3/–0
.51E
–03
3.63
+
0.02
/–0.
22
Im
HU
7 IV
-165
H
6035
7.
92E
–03
1.10
E–0
2 +
2.48
E–0
3/–1
.91E
–03
+3.
40E
–03/
–2.7
0E–0
3 3.
64
3.71
+
0.06
/–0.
07
+0.
05/–
0.06
Im
HU
6 IV
-165
H3
4996
8.
92E
–03
+3.
68E
–03/
–2.1
6E–0
3 3.
67
+0.
06/–
0.07
Im
HU
5† IV
-74H
3 28
51
1.02
E–0
2 +
3.20
E–0
3/–1
.30E
–03
3.70
+
0.05
/–0.
03
Im
HU
4† IV
-74H
3 28
51
1.02
E–0
2 +
3.20
E–0
3/–1
.30E
–03
3.70
+
0.05
/–0.
03
Im
HU
3§ IV
-165
H
2073
1.
55E
–02
+3.
60E
–03/
–3.7
0E–0
3 3.
77
+0.
04/–
0.05
Im
HU
2§ IV
-165
H
2073
1.
55E
–02
+3.
60E
–03/
–3.7
0E–0
3 3.
77
+0.
04/–
0.05
Ip
HU
1 IV
-165
H
2508
2.
32E
–02
4.26
E–0
2 +
5.30
E–0
3/–5
.60E
–03
+1.
75E
–02/
–1.4
5E–0
2 3.
84
3.94
+
0.04
/–0.
04
+0.
05/–
0.07
Im
*S
ee te
xt fo
r de
tails
.
† U
nits
Hu5
and
Hu4
wer
e da
ted
toge
ther
. See
text
for
deta
ils.
§ U
nits
Hu3
and
Hu2
wer
e da
ted
toge
ther
. See
text
for
deta
ils.
on August 28, 2011specialpapers.gsapubs.orgDownloaded from
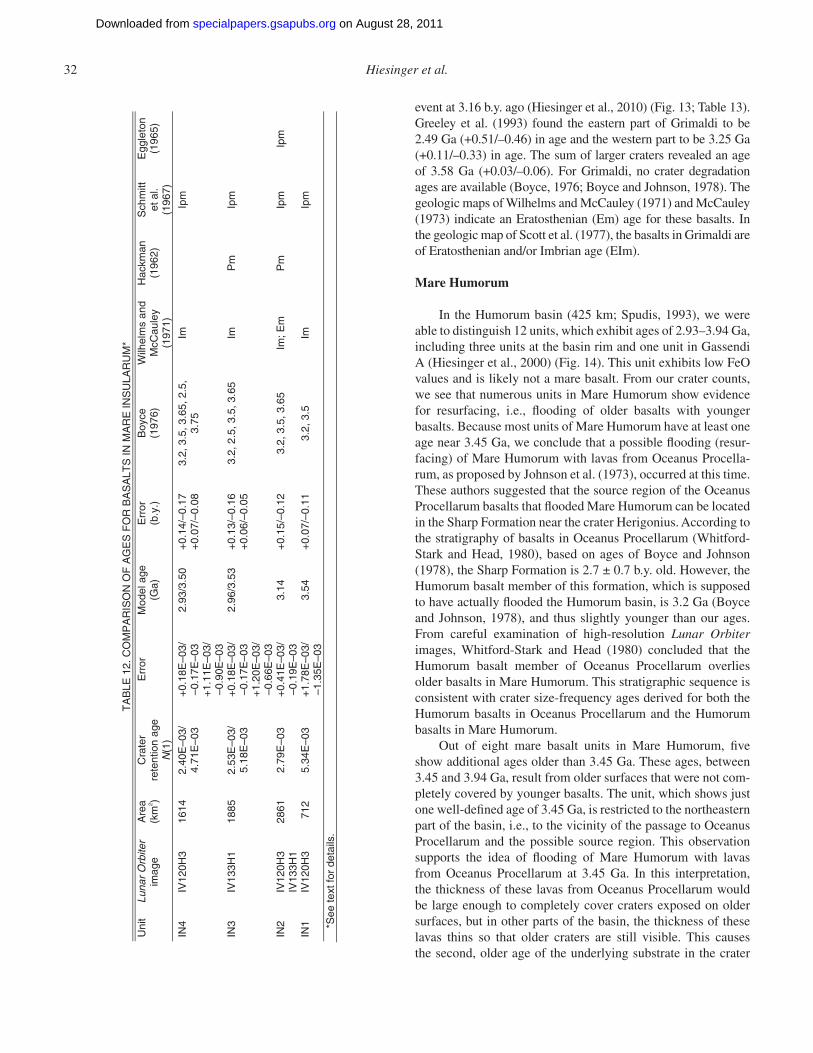
32 Hiesinger et al.
event at 3.16 b.y. ago (Hiesinger et al., 2010) (Fig. 13; Table 13). Greeley et al. (1993) found the eastern part of Grimaldi to be 2.49 Ga (+0.51/–0.46) in age and the western part to be 3.25 Ga (+0.11/–0.33) in age. The sum of larger craters revealed an age of 3.58 Ga (+0.03/–0.06). For Grimaldi, no crater degradation ages are available (Boyce, 1976; Boyce and Johnson, 1978). The geologic maps of Wilhelms and McCauley (1971) and McCauley (1973) indicate an Eratosthenian (Em) age for these basalts. In the geologic map of Scott et al. (1977), the basalts in Grimaldi are of Eratosthenian and/or Imbrian age (EIm).
Mare Humorum
In the Humorum basin (425 km; Spudis, 1993), we were able to distinguish 12 units, which exhibit ages of 2.93–3.94 Ga, including three units at the basin rim and one unit in Gassendi A (Hiesinger et al., 2000) (Fig. 14). This unit exhibits low FeO values and is likely not a mare basalt. From our crater counts, we see that numerous units in Mare Humorum show evidence for resurfacing, i.e., fl ooding of older basalts with younger basalts. Because most units of Mare Humorum have at least one age near 3.45 Ga, we conclude that a possible fl ooding (resur-facing) of Mare Humorum with lavas from Oceanus Procella-rum, as proposed by Johnson et al. (1973), occurred at this time. These authors suggested that the source region of the Oceanus Procellarum basalts that fl ooded Mare Humorum can be located in the Sharp Formation near the crater Herigonius. According to the stratigraphy of basalts in Oceanus Procellarum (Whitford-Stark and Head, 1980), based on ages of Boyce and Johnson (1978), the Sharp Formation is 2.7 ± 0.7 b.y. old. However, the Humorum basalt member of this formation, which is supposed to have actually fl ooded the Humorum basin, is 3.2 Ga (Boyce and Johnson, 1978), and thus slightly younger than our ages. From careful examination of high-resolution Lunar Orbiter images, Whitford-Stark and Head (1980) concluded that the Humorum basalt member of Oceanus Procellarum overlies older basalts in Mare Humorum. This stratigraphic sequence is consistent with crater size-frequency ages derived for both the Humorum basalts in Oceanus Procellarum and the Humorum basalts in Mare Humorum.
Out of eight mare basalt units in Mare Humorum, fi ve show additional ages older than 3.45 Ga. These ages, between 3.45 and 3.94 Ga, result from older surfaces that were not com-pletely covered by younger basalts. The unit, which shows just one well-defi ned age of 3.45 Ga, is restricted to the northeastern part of the basin, i.e., to the vicinity of the passage to Oceanus Procellarum and the possible source region. This observation supports the idea of fl ooding of Mare Humorum with lavas from Oceanus Procellarum at 3.45 Ga. In this interpretation, the thickness of these lavas from Oceanus Procellarum would be large enough to completely cover craters exposed on older surfaces, but in other parts of the basin, the thickness of these lavas thins so that older craters are still visible. This causes the second, older age of the underlying substrate in the crater
TA
BLE
12.
CO
MP
AR
ISO
N O
F A
GE
S F
OR
BA
SA
LTS
IN M
AR
E IN
SU
LAR
UM
*
Uni
t Lu
nar
Orb
iter
imag
e A
rea
(km
2 ) C
rate
r re
tent
ion
age
N(1
)
Err
or
Mod
el a
ge
(Ga)
E
rror
(b
.y.)
B
oyce
(1
976)
W
ilhel
ms
and
McC
aule
y (1
971)
Hac
kman
(1
962)
S
chm
itt
et a
l. (1
967)
Egg
leto
n (1
965)
IN4
IV12
0H3
1614
2.
40E
–03/
4.
71E
–03
+0.
18E
–03/
–0
.17E
–03
+1.
11E
–03/
–0
.90E
–03
2.93
/3.5
0 +
0.14
/–0.
17
+0.
07/–
0.08
3.
2, 3
.5, 3
.65,
2.5
, 3.
75
Im
Ip
m
IN3
IV13
3H1
1885
2.
53E
–03/
5.
18E
–03
+0.
18E
–03/
–0
.17E
–03
+1.
20E
–03/
–0
.66E
–03
2.96
/3.5
3 +
0.13
/–0.
16
+0.
06/–
0.05
3.
2, 2
.5, 3
.5, 3
.65
Im
Pm
Ip
m
IN2
IV12
0H3
IV13
3H1
2861
2.
79E
–03
+0.
41E
–03/
–0
.19E
–03
3.14
+
0.15
/–0.
12
3.2,
3.5
, 3.6
5 Im
; Em
P
m
Ipm
Ip
m
IN1
IV12
0H3
712
5.34
E–0
3 +
1.78
E–0
3/
–1.3
5E–0
3 3.
54
+0.
07/–
0.11
3.
2, 3
.5
Im
Ip
m
*S
ee te
xt fo
r de
tails
.
on August 28, 2011specialpapers.gsapubs.orgDownloaded from
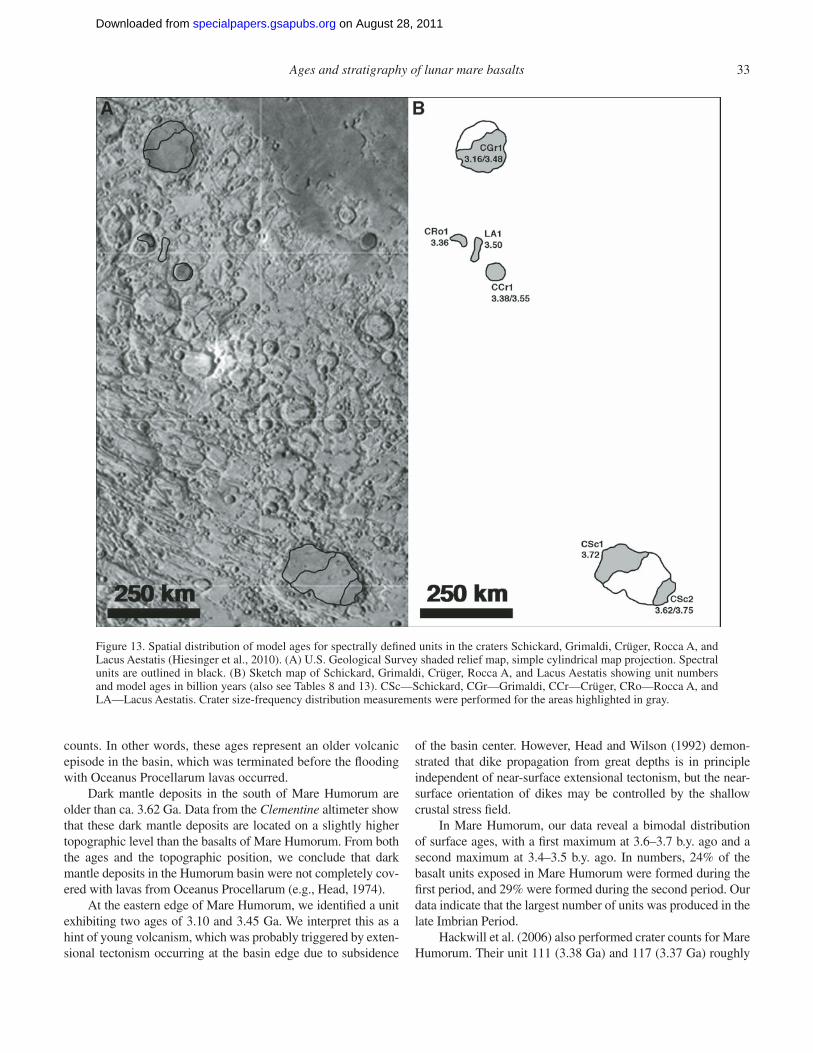
Ages and stratigraphy of lunar mare basalts 33
counts. In other words, these ages represent an older volcanic episode in the basin, which was terminated before the fl ooding with Oceanus Procellarum lavas occurred.
Dark mantle deposits in the south of Mare Humorum are older than ca. 3.62 Ga. Data from the Clementine altimeter show that these dark mantle deposits are located on a slightly higher topographic level than the basalts of Mare Humorum. From both the ages and the topographic position, we conclude that dark mantle deposits in the Humorum basin were not completely cov-ered with lavas from Oceanus Procellarum (e.g., Head, 1974).
At the eastern edge of Mare Humorum, we identifi ed a unit exhibiting two ages of 3.10 and 3.45 Ga. We interpret this as a hint of young volcanism, which was probably triggered by exten-sional tectonism occurring at the basin edge due to subsidence
of the basin center. However, Head and Wilson (1992) demon-strated that dike propagation from great depths is in principle independent of near-surface extensional tectonism, but the near-surface orientation of dikes may be controlled by the shallow crustal stress fi eld.
In Mare Humorum, our data reveal a bimodal distribution of surface ages, with a fi rst maximum at 3.6–3.7 b.y. ago and a second maximum at 3.4–3.5 b.y. ago. In numbers, 24% of the basalt units exposed in Mare Humorum were formed during the fi rst period, and 29% were formed during the second period. Our data indicate that the largest number of units was produced in the late Imbrian Period.
Hackwill et al. (2006) also performed crater counts for Mare Humorum. Their unit 111 (3.38 Ga) and 117 (3.37 Ga) roughly
Figure 13. Spatial distribution of model ages for spectrally defi ned units in the craters Schickard, Grimaldi, Crüger, Rocca A, and Lacus Aestatis (Hiesinger et al., 2010). (A) U.S. Geological Survey shaded relief map, simple cylindrical map projection. Spectral units are outlined in black. (B) Sketch map of Schickard, Grimaldi, Crüger, Rocca A, and Lacus Aestatis showing unit numbers and model ages in billion years (also see Tables 8 and 13). CSc—Schickard, CGr—Grimaldi, CCr—Crüger, CRo—Rocca A, and LA—Lacus Aestatis. Crater size-frequency distribution measurements were performed for the areas highlighted in gray.
on August 28, 2011specialpapers.gsapubs.orgDownloaded from
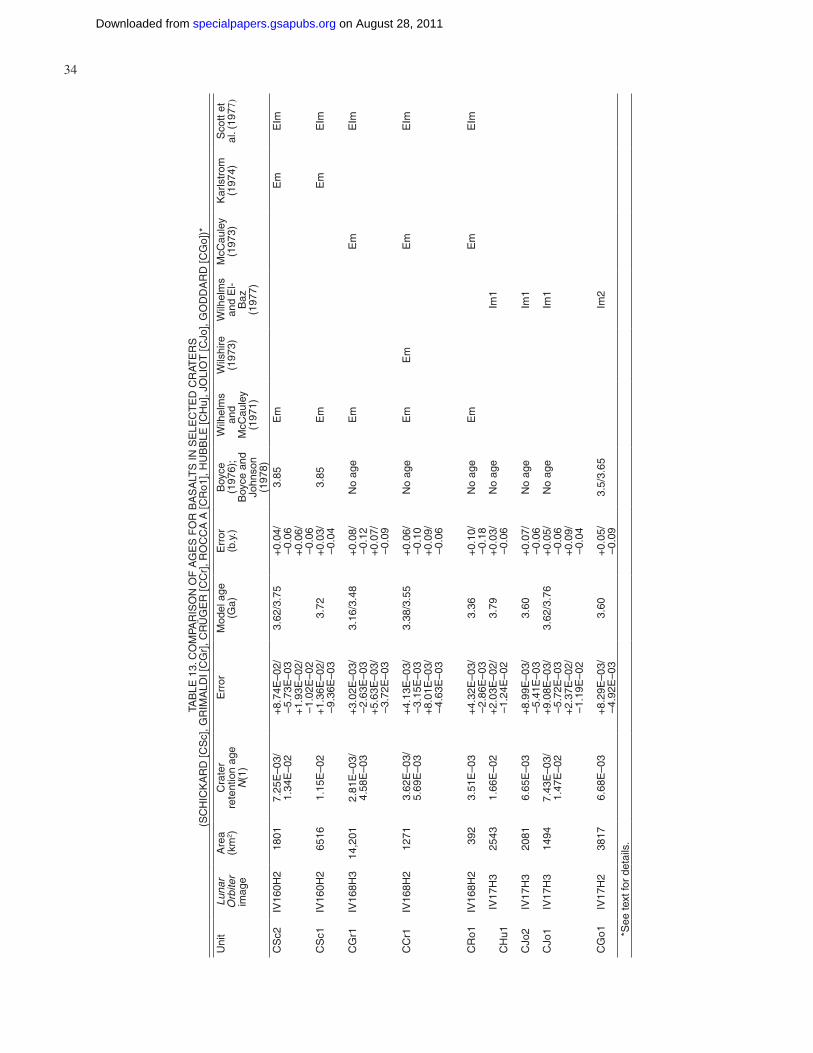
34 Hiesinger et al.
TAB
LE 1
3. C
OM
PAR
ISO
N O
F A
GE
S F
OR
BA
SA
LTS
IN S
ELE
CT
ED
CR
ATE
RS
(S
CH
ICK
AR
D [C
Sc]
, GR
IMA
LDI [
CG
r], C
RÜ
GE
R [C
Cr]
, RO
CC
A A
[CR
o1],
HU
BB
LE [C
Hu]
, JO
LIO
T [C
Jo],
GO
DD
AR
D [C
Go]
)*
Uni
tLu
nar
Orb
iter
imag
e
Are
a(k
m2 )
Cra
ter
rete
ntio
n ag
e N
(1)
Err
orM
odel
age
(G
a)E
rror
(b.y
.)B
oyce
(197
6);
Boy
ce a
nd
John
son
(197
8)
Wilh
elm
s an
d M
cCau
ley
(197
1)
Wils
hire
(197
3)W
ilhel
ms
and
El-
Baz
(197
7)
McC
aule
y(1
973)
Kar
lstr
om(1
974)
Sco
tt et
al
. (19
77)
CS
c2IV
160H
218
017.
25E
–03/
1.34
E–0
2+
8.74
E–0
2/–5
.73E
–03
3.62
/3.7
5+
0.04
/–0
.06
3.85
Em
Em
EIm
+1.
93E
–02/
–1.0
2E–0
2+
0.06
/–0
.06
CS
c1IV
160H
265
161.
15E
–02
+1.
36E
–02/
–9.3
6E–0
33.
72+
0.03
/–0
.04
3.85
Em
Em
EIm
CG
r1IV
168H
314
,201
2.81
E–0
3/4.
58E
–03
+3.
02E
–03/
–2.6
3E–0
33.
16/3
.48
+0.
08/
–0.1
2N
o ag
eE
mE
mE
Im
+5.
63E
–03/
–3.7
2E–0
3+
0.07
/–0
.09
CC
r1IV
168H
212
713.
62E
–03/
5.69
E–0
3+
4.13
E–0
3/–3
.15E
–03
3.38
/3.5
5+
0.06
/–0
.10
No
age
Em
Em
Em
EIm
+8.
01E
–03/
–4.6
3E–0
3+
0.09
/–0
.06
CR
o1IV
168H
239
23.
51E
–03
+4.
32E
–03/
–2.8
6E–0
33.
36+
0.10
/–0
.18
No
age
Em
Em
EIm
CH
u1IV
17H
325
431.
66E
–02
+2.
03E
–02/
–1.2
4E–0
23.
79+
0.03
/–0
.06
No
age
Im1
CJo
2IV
17H
320
816.
65E
–03
+8.
99E
–03/
–5.4
1E–0
33.
60+
0.07
/–0
.06
No
age
Im1
CJo
1IV
17H
314
947.
43E
–03/
1.47
E–0
2+
9.08
E–0
3/–5
.72E
–03
3.62
/3.7
6+
0.05
/–0
.06
No
age
Im1
+2.
37E
–02/
–1.1
9E–0
2+
0.09
/–0
.04
CG
o1IV
17H
238
176.
68E
–03
+8.
29E
–03/
–4.9
2E–0
33.
60+
0.05
/–0
.09
3.5/
3.65
Im2
*S
ee te
xt fo
r de
tails
.
on August 28, 2011specialpapers.gsapubs.orgDownloaded from
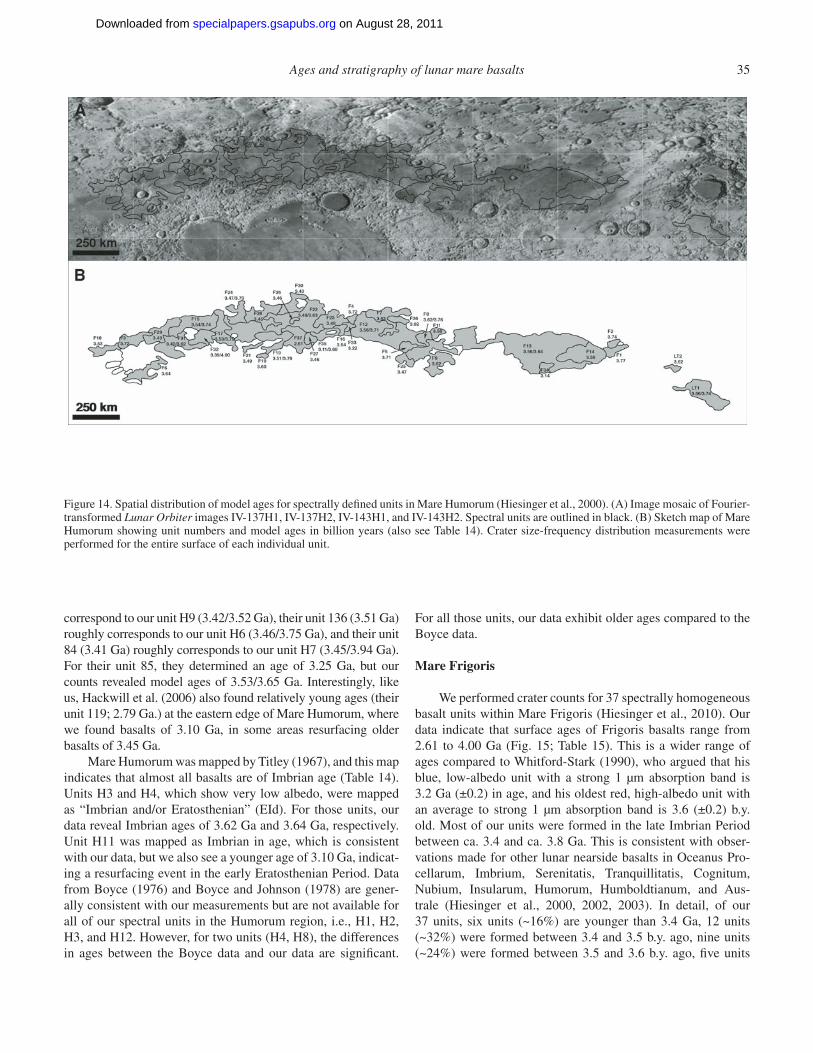
Ages and stratigraphy of lunar mare basalts 35
Figure 14. Spatial distribution of model ages for spectrally defi ned units in Mare Humorum (Hiesinger et al., 2000). (A) Image mosaic of Fourier-transformed Lunar Orbiter images IV-137H1, IV-137H2, IV-143H1, and IV-143H2. Spectral units are outlined in black. (B) Sketch map of Mare Humorum showing unit numbers and model ages in billion years (also see Table 14). Crater size-frequency distribution measurements were performed for the entire surface of each individual unit.
correspond to our unit H9 (3.42/3.52 Ga), their unit 136 (3.51 Ga) roughly corresponds to our unit H6 (3.46/3.75 Ga), and their unit 84 (3.41 Ga) roughly corresponds to our unit H7 (3.45/3.94 Ga). For their unit 85, they determined an age of 3.25 Ga, but our counts revealed model ages of 3.53/3.65 Ga. Interestingly, like us, Hackwill et al. (2006) also found relatively young ages (their unit 119; 2.79 Ga.) at the eastern edge of Mare Humorum, where we found basalts of 3.10 Ga, in some areas resurfacing older basalts of 3.45 Ga.
Mare Humorum was mapped by Titley (1967), and this map indicates that almost all basalts are of Imbrian age (Table 14). Units H3 and H4, which show very low albedo, were mapped as “Imbrian and/or Eratosthenian” (EId). For those units, our data reveal Imbrian ages of 3.62 Ga and 3.64 Ga, respectively. Unit H11 was mapped as Imbrian in age, which is consistent with our data, but we also see a younger age of 3.10 Ga, indicat-ing a resurfacing event in the early Eratosthenian Period. Data from Boyce (1976) and Boyce and Johnson (1978) are gener-ally consistent with our measurements but are not available for all of our spectral units in the Humorum region, i.e., H1, H2, H3, and H12. However, for two units (H4, H8), the differences in ages between the Boyce data and our data are signifi cant.
For all those units, our data exhibit older ages compared to the Boyce data.
Mare Frigoris
We performed crater counts for 37 spectrally homogeneous basalt units within Mare Frigoris (Hiesinger et al., 2010). Our data indicate that surface ages of Frigoris basalts range from 2.61 to 4.00 Ga (Fig. 15; Table 15). This is a wider range of ages compared to Whitford-Stark (1990), who argued that his blue, low-albedo unit with a strong 1 µm absorption band is 3.2 Ga (±0.2) in age, and his oldest red, high-albedo unit with an average to strong 1 µm absorption band is 3.6 (±0.2) b.y. old. Most of our units were formed in the late Imbrian Period between ca. 3.4 and ca. 3.8 Ga. This is consistent with obser-vations made for other lunar nearside basalts in Oceanus Pro-cellarum, Imbrium, Serenitatis, Tranquillitatis, Cognitum, Nubium, Insularum, Humorum, Humboldtianum, and Aus-trale (Hiesinger et al., 2000, 2002, 2003). In detail, of our 37 units, six units (~16%) are younger than 3.4 Ga, 12 units (~32%) were formed between 3.4 and 3.5 b.y. ago, nine units (~24%) were formed between 3.5 and 3.6 b.y. ago, fi ve units
on August 28, 2011specialpapers.gsapubs.orgDownloaded from
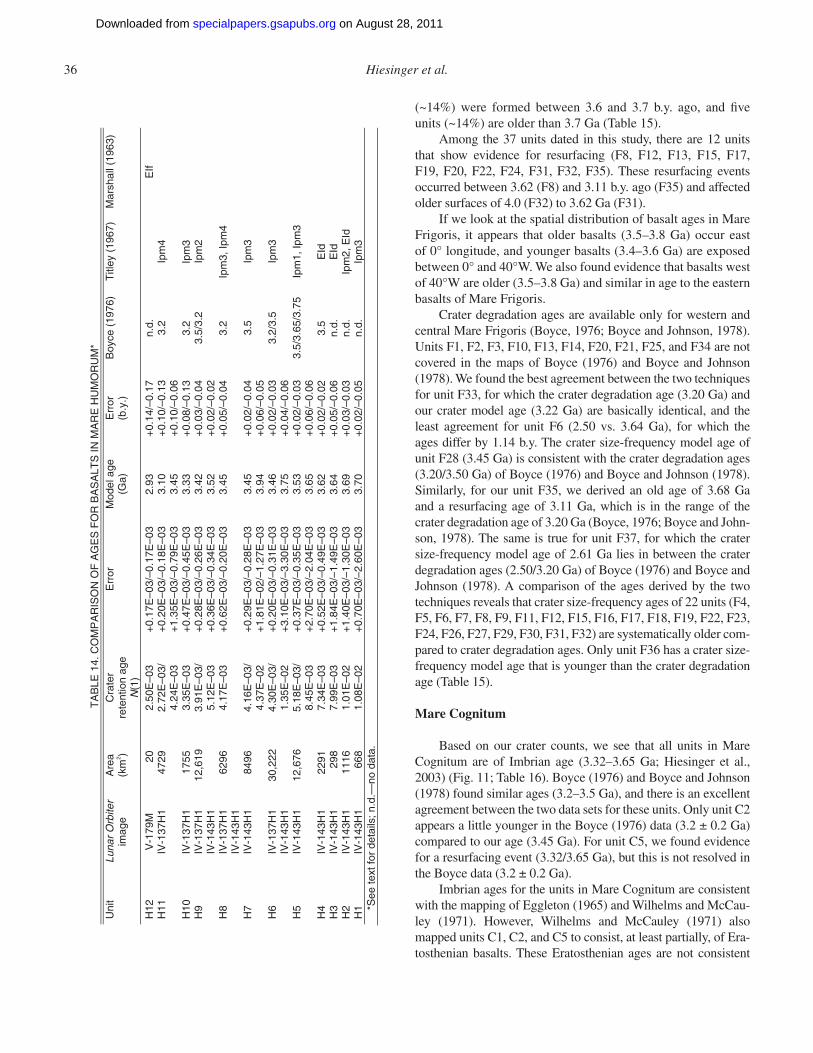
36 Hiesinger et al.
(~14%) were formed between 3.6 and 3.7 b.y. ago, and fi ve units (~14%) are older than 3.7 Ga (Table 15).
Among the 37 units dated in this study, there are 12 units that show evidence for resurfacing (F8, F12, F13, F15, F17, F19, F20, F22, F24, F31, F32, F35). These resurfacing events occurred between 3.62 (F8) and 3.11 b.y. ago (F35) and affected older surfaces of 4.0 (F32) to 3.62 Ga (F31).
If we look at the spatial distribution of basalt ages in Mare Frigoris, it appears that older basalts (3.5–3.8 Ga) occur east of 0° longitude, and younger basalts (3.4–3.6 Ga) are exposed between 0° and 40°W. We also found evidence that basalts west of 40°W are older (3.5–3.8 Ga) and similar in age to the eastern basalts of Mare Frigoris.
Crater degradation ages are available only for western and central Mare Frigoris (Boyce, 1976; Boyce and Johnson, 1978). Units F1, F2, F3, F10, F13, F14, F20, F21, F25, and F34 are not covered in the maps of Boyce (1976) and Boyce and Johnson (1978). We found the best agreement between the two techniques for unit F33, for which the crater degradation age (3.20 Ga) and our crater model age (3.22 Ga) are basically identical, and the least agreement for unit F6 (2.50 vs. 3.64 Ga), for which the ages differ by 1.14 b.y. The crater size-frequency model age of unit F28 (3.45 Ga) is consistent with the crater degradation ages (3.20/3.50 Ga) of Boyce (1976) and Boyce and Johnson (1978). Similarly, for our unit F35, we derived an old age of 3.68 Ga and a resurfacing age of 3.11 Ga, which is in the range of the crater degradation age of 3.20 Ga (Boyce, 1976; Boyce and John-son, 1978). The same is true for unit F37, for which the crater size-frequency model age of 2.61 Ga lies in between the crater degradation ages (2.50/3.20 Ga) of Boyce (1976) and Boyce and Johnson (1978). A comparison of the ages derived by the two techniques reveals that crater size-frequency ages of 22 units (F4, F5, F6, F7, F8, F9, F11, F12, F15, F16, F17, F18, F19, F22, F23, F24, F26, F27, F29, F30, F31, F32) are systematically older com-pared to crater degradation ages. Only unit F36 has a crater size-frequency model age that is younger than the crater degradation age (Table 15).
Mare Cognitum
Based on our crater counts, we see that all units in Mare Cognitum are of Imbrian age (3.32–3.65 Ga; Hiesinger et al., 2003) (Fig. 11; Table 16). Boyce (1976) and Boyce and Johnson (1978) found similar ages (3.2–3.5 Ga), and there is an excellent agreement between the two data sets for these units. Only unit C2 appears a little younger in the Boyce (1976) data (3.2 ± 0.2 Ga) compared to our age (3.45 Ga). For unit C5, we found evidence for a resurfacing event (3.32/3.65 Ga), but this is not resolved in the Boyce data (3.2 ± 0.2 Ga).
Imbrian ages for the units in Mare Cognitum are consistent with the mapping of Eggleton (1965) and Wilhelms and McCau-ley (1971). However, Wilhelms and McCauley (1971) also mapped units C1, C2, and C5 to consist, at least partially, of Era-tosthenian basalts. These Eratosthenian ages are not consistent
TA
BLE
14.
CO
MP
AR
ISO
N O
F A
GE
S F
OR
BA
SA
LTS
IN M
AR
E H
UM
OR
UM
* U
nit
Luna
r O
rbite
r im
age
Are
a (k
m2 )
Cra
ter
re
tent
ion
age
N
(1)
Err
or
Mod
el a
ge
(Ga)
E
rror
(b
.y.)
B
oyce
(19
76)
Titl
ey (
1967
) M
arsh
all (
1963
)
H12
V
-179
M
20
2.50
E–0
3 +
0.17
E–0
3/–0
.17E
–03
2.93
+
0.14
/–0.
17
n.d.
EIf
H11
IV
-137
H1
4729
2.
72E
–03/
4.
24E
–03
+0.
20E
–03/
–0.1
8E–0
3 +
1.35
E–0
3/–0
.79E
–03
3.10
3.
45
+0.
10/–
0.13
+
0.10
/–0.
06
3.2
Ipm
4
H10
IV
-137
H1
1755
3.
35E
–03
+0.
47E
–03/
–0.4
5E–0
3 3.
33
+0.
08/–
0.13
3.
2 Ip
m3
H
9 IV
-137
H1
IV-1
43H
1 12
,619
3.
91E
–03/
5.
12E
–03
+0.
28E
–03/
–0.2
6E–0
3 +
0.36
E–0
3/–0
.34E
–03
3.42
3.
52
+0.
03/–
0.04
+
0.02
/–0.
02
3.5/
3.2
Ipm
2
H8
IV-1
37H
1 IV
-143
H1
6296
4.
17E
–03
+0.
62E
–03/
–0.2
0E–0
3 3.
45
+0.
05/–
0.04
3.
2 Ip
m3,
Ipm
4
H7
IV-1
43H
1 84
96
4.16
E–0
3/
4.37
E–0
2 +
0.29
E–0
3/–0
.28E
–03
+1.
81E
–02/
–1.2
7E–0
3 3.
45
3.94
+
0.02
/–0.
04
+0.
06/–
0.05
3.
5 Ip
m3
H6
IV-1
37H
1 IV
-143
H1
30,2
22
4.30
E–0
3/
1.35
E–0
2 +
0.20
E–0
3/–0
.31E
–03
+3.
10E
–03/
–3.3
0E–0
3 3.
46
3.75
+
0.02
/–0.
03
+0.
04/–
0.06
3.
2/3.
5 Ip
m3
H5
IV-1
43H
1 12
,676
5.
18E
–03/
8.
45E
–03
+0.
37E
–03/
–0.3
5E–0
3 +
2.70
E–0
3/–2
.04E
–03
3.53
3.
65
+0.
02/–
0.03
+
0.06
/–0.
06
3.5/
3.65
/3.7
5 Ip
m1,
Ipm
3
H4
IV-1
43H
1 22
91
7.34
E–0
3 +
0.52
E–0
3/–0
.49E
–03
3.62
+
0.02
/–0.
02
3.5
EId
H3
IV-1
43H
1 29
8 7.
99E
–03
+1.
84E
–03/
–1.4
9E–0
3 3.
64
+0.
05/–
0.06
n.
d.
EId
H2
IV-1
43H
1 11
16
1.01
E–0
2 +
1.40
E–0
3/–1
.30E
–03
3.69
+
0.03
/–0.
03
n.d.
Ip
m2,
EId
H1
IV-1
43H
1 66
8 1.
08E
–02
+0.
70E
–03/
–2.6
0E–0
3 3.
70
+0.
02/–
0.05
n.
d.
Ipm
3
*S
ee te
xt fo
r de
tails
; n.d
.—no
dat
a.
on August 28, 2011specialpapers.gsapubs.orgDownloaded from
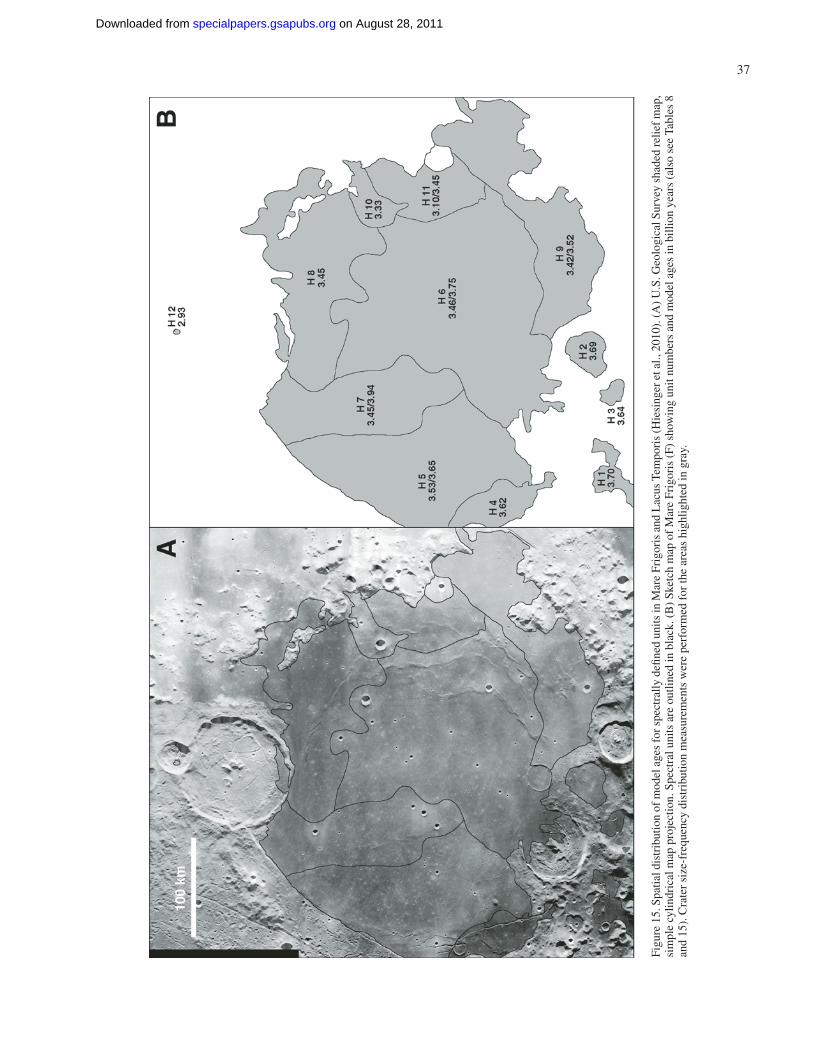
Ages and stratigraphy of lunar mare basalts 37
Figu
re 1
5. S
patia
l dis
trib
utio
n of
mod
el a
ges
for
spec
tral
ly d
efi n
ed u
nits
in M
are
Frig
oris
and
Lac
us T
empo
ris
(Hie
sing
er e
t al.,
201
0). (
A)
U.S
. Geo
logi
cal S
urve
y sh
aded
rel
ief
map
, si
mpl
e cy
lindr
ical
map
pro
ject
ion.
Spe
ctra
l uni
ts a
re o
utlin
ed in
bla
ck. (
B)
Sket
ch m
ap o
f M
are
Frig
oris
(F)
sho
win
g un
it nu
mbe
rs a
nd m
odel
age
s in
bill
ion
year
s (a
lso
see
Tabl
es 8
an
d 15
). C
rate
r si
ze-f
requ
ency
dis
trib
utio
n m
easu
rem
ents
wer
e pe
rfor
med
for
the
area
s hi
ghlig
hted
in g
ray.
on August 28, 2011specialpapers.gsapubs.orgDownloaded from
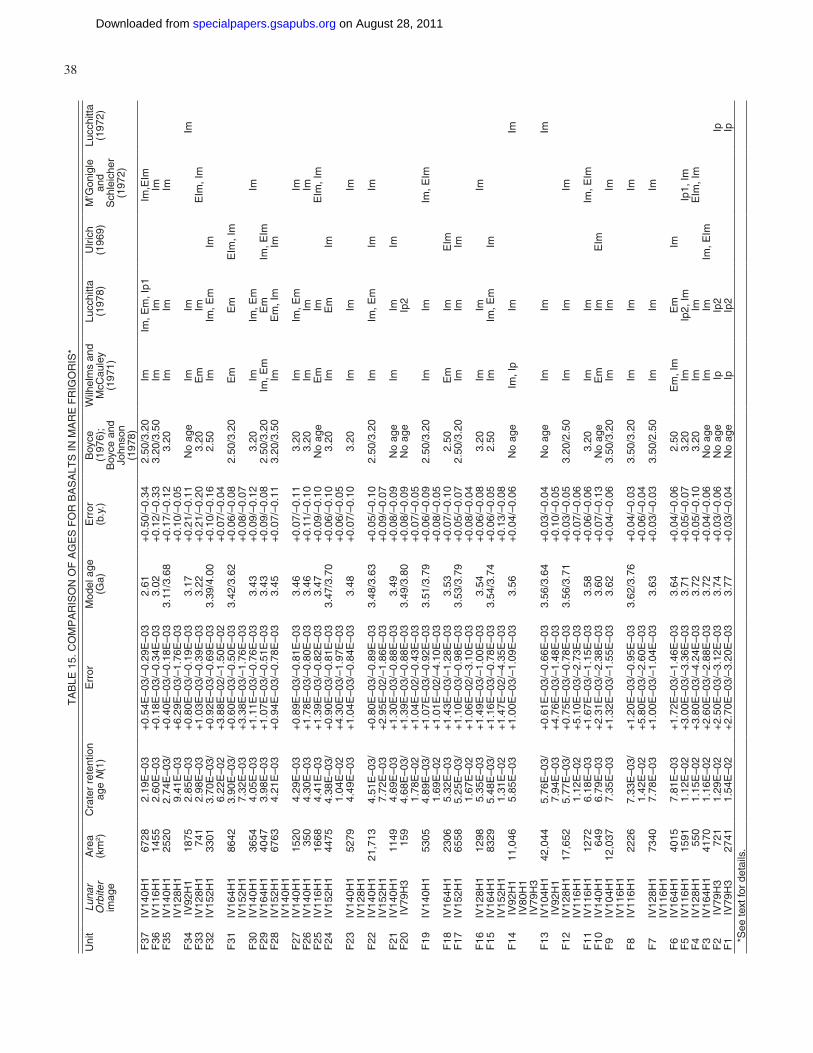
38 Hiesinger et al.T
AB
LE 1
5. C
OM
PA
RIS
ON
OF
AG
ES
FO
R B
AS
ALT
S IN
MA
RE
FR
IGO
RIS
*
Uni
tLu
nar
Orb
iter
imag
e
Are
a(k
m2 )
Cra
ter
rete
ntio
n ag
e N
(1)
Err
orM
odel
age
(G
a)E
rror
(b.y
.)B
oyce
(197
6);
Boy
ce a
nd
John
son
(197
8)
Wilh
elm
s an
d M
cCau
ley
(197
1)
Lucc
hitta
(197
8)U
lrich
(196
9)M
’Gon
igle
and
Sch
leic
her
(197
2)
Lucc
hitta
(197
2)
F37
IV14
0H1
6728
2.19
E–0
3+
0.54
E–0
3/–0
.29E
–03
2.61
+0.
50/–
0.34
2.50
/3.2
0Im
Im, E
m, I
p1Im
,EIm
F36
IV11
6H1
1455
2.60
E–0
3+
0.18
E–0
3/–0
.34E
–03
3.02
+0.
12/–
0.33
3.20
/3.5
0Im
ImIm
F35
IV14
0H1
2520
2.74
E–0
3/+
0.40
E–0
3/–0
.18E
–03
3.11
/3.6
8+
0.17
/–0.
123.
20Im
ImIm
IV12
8H1
9.41
E–0
3+
6.29
E–0
3/–1
.76E
–03
+0.
10/–
0.05
F34
IV92
H1
1875
2.85
E–0
3+
0.80
E–0
3/–0
.19E
–03
3.17
+0.
21/–
0.11
No
age
ImIm
ImF
33IV
128H
174
12.
98E
–03
+1.
03E
–03/
–0.3
9E–0
33.
22+
0.21
/–0.
203.
20E
mIm
EIm
, Im
F32
IV15
2H1
3301
3.70
E–0
3/+
0.92
E–0
3/–0
.69E
–03
3.39
/4.0
0+
0.10
/–0.
162.
50Im
Im, E
mIm
6.22
E–0
2+
3.88
E–0
2/–1
.50E
–02
+0.
07/–
0.04
F31
IV16
4H1
8642
3.90
E–0
3/+
0.60
E–0
3/–0
.50E
–03
3.42
/3.6
2+
0.06
/–0.
08
2.50
/3.2
0E
mE
mE
Im, I
mIV
152H
17.
32E
–03
+3.
38E
–03/
–1.7
6E–0
3+
0.08
/–0.
07F
30IV
140H
136
544.
05E
–03
+1.
11E
–03/
–0.7
6E–0
33.
43+
0.09
/–0.
123.
20Im
Im, E
mIm
F29
IV16
4H1
4047
3.98
E–0
3+
1.07
E–0
3/–0
.51E
–03
3.43
+0.
09/–
0.08
2.50
/3.2
0Im
, Em
Em
Im, E
ImF
28IV
152H
167
634.
21E
–03
+0.
94E
–03/
–0.7
8E–0
33.
45+
0.07
/–0.
113.
20/3
.50
ImE
m, I
mIm
IV14
0H1
F27
IV14
0H1
1520
4.29
E–0
3+
0.89
E–0
3/–0
.81E
–03
3.46
+0.
07/–
0.11
3.20
ImIm
, Em
ImF
26IV
140H
135
04.
30E
–03
+1.
78E
–03/
–0.8
0E–0
33.
46+
0.11
/–0.
103.
20Im
ImIm
F25
IV11
6H1
1668
4.41
E–0
3+
1.39
E–0
3/–0
.82E
–03
3.47
+0.
09/–
0.10
No
age
Em
ImE
Im, I
mF
24IV
152H
144
754.
38E
–03/
+0.
90E
–03/
–0.8
1E–0
33.
47/3
.70
+0.
06/–
0.10
3.20
ImE
mIm
1.04
E–0
2+
4.30
E–0
3/–1
.97E
–03
+0.
06/–
0.05
F23
IV14
0H1
5279
4.49
E–0
3+
1.04
E–0
3/–0
.84E
–03
3.48
+0.
07/–
0.10
3.20
ImIm
ImIV
128H
1F
22IV
140H
121
,713
4.51
E–0
3/+
0.80
E–0
3/–0
.89E
–03
3.48
/3.6
3+
0.05
/–0.
102.
50/3
.20
ImIm
, Em
ImIm
IV15
2H1
7.72
E–0
3+
2.95
E–0
2/–1
.86E
–03
+0.
09/–
0.07
F21
IV14
0H1
1149
4.69
E–0
3+
1.30
E–0
3/–0
.88E
–03
3.49
+0.
08/–
0.09
No
age
ImIm
ImF
20IV
79H
315
94.
68E
–03/
+1.
39E
–03/
–0.8
8E–0
33.
49/3
.80
+0.
08/–
0.09
No
age
Ip2
1.78
E–0
2+
1.04
E–0
2/ –0
.43E
–03
+0.
07/–
0.05
F19
IV14
0H1
5305
4.89
E–0
3/+
1.07
E–0
3/–0
.92E
–03
3.51
/3.7
9+
0.06
/–0.
092.
50/3
.20
ImIm
Im, E
Im1.
69E
–02
+1.
01E
–02/
–4.1
0E–0
3+
0.08
/–0.
05F
18IV
164H
123
065.
32E
–03
+1.
43E
–03/
–1.2
8E–0
33.
53+
0.07
/–0.
102.
50E
mIm
EIm
F17
IV15
2H1
6558
5.25
E–0
3/+
1.10
E–0
3/–0
.98E
–03
3.53
/3.7
9+
0.05
/–0.
072.
50/3
.20
ImIm
Im1.
67E
–02
+1.
06E
–02/
–3.1
0E–0
3+
0.08
/–0.
04F
16IV
128H
112
985.
35E
–03
+1.
49E
–03/
–1.0
0E–0
33.
54+
0.06
/–0.
083.
20Im
ImIm
F15
IV16
4H1
8329
5.48
E–0
3/+
1.16
E–0
3/–0
.78E
–03
3.54
/3.7
4+
0.06
/–0.
052.
50Im
Im, E
mIm
IV15
2H1
1.31
E–0
2+
1.47
E–0
2/–4
.35E
–03
+0.
13/–
0.08
F14
IV92
H1
11,0
465.
85E
–03
+1.
00E
–03/
–1.0
9E–0
33.
56+
0.04
/–0.
06N
o ag
eIm
, Ip
ImIm
IV80
H1
IV79
H3
F13
IV10
4H1
42,0
445.
76E
–03/
+0.
61E
–03/
–0.6
6E–0
33.
56/3
.64
+0.
03/–
0.04
No
age
ImIm
ImIV
92H
17.
94E
–03
+4.
76E
–03/
–1.4
8E–0
3+
0.10
/–0.
05F
12IV
128H
117
,652
5.77
E–0
3/+
0.75
E–0
3/–0
.78E
–03
3.56
/3.7
1+
0.03
/–0.
053.
20/2
.50
ImIm
ImIV
116H
11.
12E
–02
+5.
10E
–03/
–2.7
3E–0
3+
0.07
/–0.
06F
11IV
116H
112
726.
18E
–03
+1.
67E
–03/
–1.1
5E–0
33.
58+
0.06
/–0.
063.
20Im
ImIm
, EIm
F10
IV14
0H1
649
6.79
E–0
3+
2.31
E–0
3/–2
.38E
–03
3.60
+0.
07/–
0.13
No
age
Em
ImE
ImF
9IV
104H
112
,037
7.35
E–0
3+
1.32
E–0
3/–1
.55E
–03
3.62
+0.
04/–
0.06
3.50
/3.2
0Im
ImIm
IV11
6H1
F8
IV11
6H1
2226
7.33
E–0
3/+
1.20
E–0
3/–0
.95E
–03
3.62
/3.7
6+
0.04
/–0.
033.
50/3
.20
ImIm
Im1.
42E
–02
+5.
80E
–03/
–2.6
0E–0
3+
0.06
/–0.
04F
7IV
128H
173
407.
78E
–03
+1.
00E
–03/
–1.0
4E–0
33.
63+
0.03
/–0.
033.
50/2
.50
ImIm
ImIV
116H
1F
6IV
164H
140
157.
81E
–03
+1.
72E
–03/
–1.4
6E–0
33.
64+
0.04
/–0.
062.
50E
m, I
mE
mIm
F5
IV11
6H1
1591
1.12
E–0
2+
3.00
E–0
3/–3
.36E
–03
3.71
+0.
05/–
0.07
3.20
ImIp
2, Im
Ip1,
ImF
4IV
128H
155
01.
15E
–02
+3.
80E
–03/
–4.2
4E–0
33.
72+
0.05
/–0.
103.
20Im
ImE
Im, I
mF
3IV
164H
141
701.
16E
–02
+2.
60E
–03/
–2.8
8E–0
33.
72+
0.04
/–0.
06N
o ag
eIm
ImIm
, EIm
F2
IV79
H3
721
1.29
E–0
2+
2.50
E–0
3/–3
.12E
–03
3.74
+0.
03/–
0.06
No
age
IpIp
2Ip
F1
IV79
H3
2741
1.54
E–0
2+
2.70
E–0
3/–3
.20E
–03
3.77
+0.
03/–
0.04
No
age
IpIp
2Ip
*See
text
for
deta
ils.
on August 28, 2011specialpapers.gsapubs.orgDownloaded from
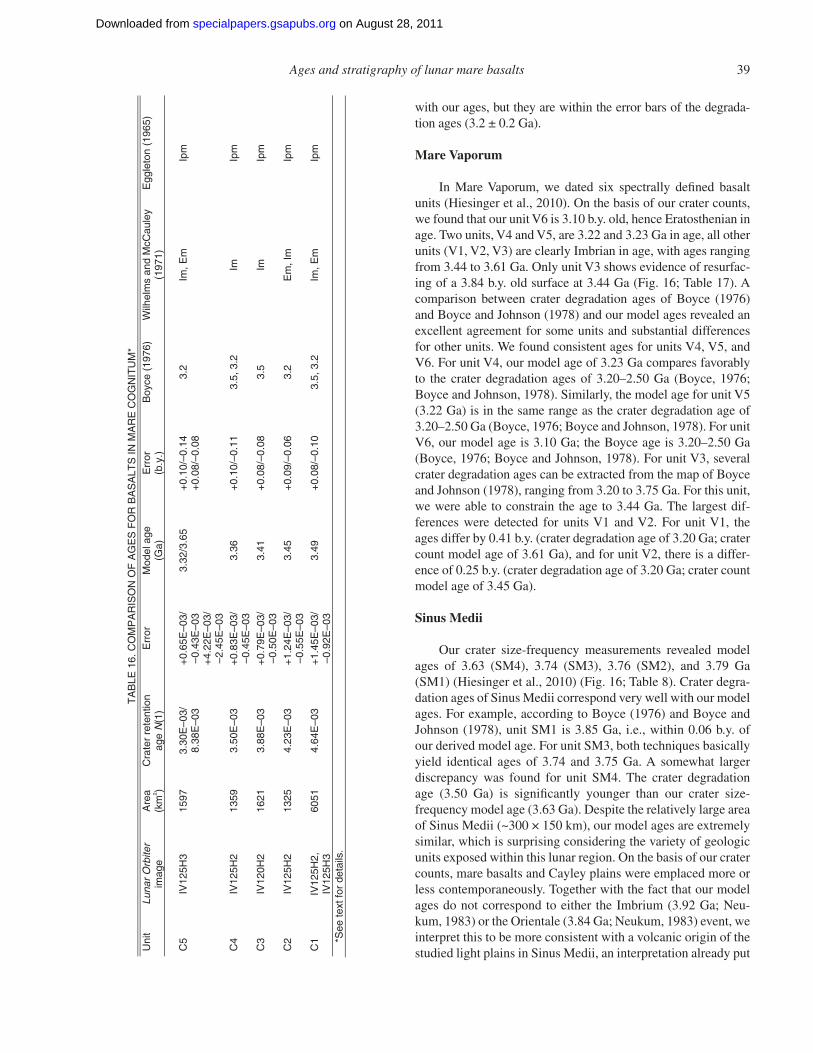
Ages and stratigraphy of lunar mare basalts 39
with our ages, but they are within the error bars of the degrada-tion ages (3.2 ± 0.2 Ga).
Mare Vaporum
In Mare Vaporum, we dated six spectrally defi ned basalt units (Hiesinger et al., 2010). On the basis of our crater counts, we found that our unit V6 is 3.10 b.y. old, hence Eratosthenian in age. Two units, V4 and V5, are 3.22 and 3.23 Ga in age, all other units (V1, V2, V3) are clearly Imbrian in age, with ages ranging from 3.44 to 3.61 Ga. Only unit V3 shows evidence of resurfac-ing of a 3.84 b.y. old surface at 3.44 Ga (Fig. 16; Table 17). A comparison between crater degradation ages of Boyce (1976) and Boyce and Johnson (1978) and our model ages revealed an excellent agreement for some units and substantial differences for other units. We found consistent ages for units V4, V5, and V6. For unit V4, our model age of 3.23 Ga compares favorably to the crater degradation ages of 3.20–2.50 Ga (Boyce, 1976; Boyce and Johnson, 1978). Similarly, the model age for unit V5 (3.22 Ga) is in the same range as the crater degradation age of 3.20–2.50 Ga (Boyce, 1976; Boyce and Johnson, 1978). For unit V6, our model age is 3.10 Ga; the Boyce age is 3.20–2.50 Ga (Boyce, 1976; Boyce and Johnson, 1978). For unit V3, several crater degradation ages can be extracted from the map of Boyce and Johnson (1978), ranging from 3.20 to 3.75 Ga. For this unit, we were able to constrain the age to 3.44 Ga. The largest dif-ferences were detected for units V1 and V2. For unit V1, the ages differ by 0.41 b.y. (crater degradation age of 3.20 Ga; crater count model age of 3.61 Ga), and for unit V2, there is a differ-ence of 0.25 b.y. (crater degradation age of 3.20 Ga; crater count model age of 3.45 Ga).
Sinus Medii
Our crater size-frequency measurements revealed model ages of 3.63 (SM4), 3.74 (SM3), 3.76 (SM2), and 3.79 Ga (SM1) (Hiesinger et al., 2010) (Fig. 16; Table 8). Crater degra-dation ages of Sinus Medii correspond very well with our model ages. For example, according to Boyce (1976) and Boyce and Johnson (1978), unit SM1 is 3.85 Ga, i.e., within 0.06 b.y. of our derived model age. For unit SM3, both techniques basically yield identical ages of 3.74 and 3.75 Ga. A somewhat larger discrepancy was found for unit SM4. The crater degradation age (3.50 Ga) is signifi cantly younger than our crater size- frequency model age (3.63 Ga). Despite the relatively large area of Sinus Medii (~300 × 150 km), our model ages are extremely similar, which is surprising considering the variety of geologic units exposed within this lunar region. On the basis of our crater counts, mare basalts and Cayley plains were emplaced more or less contemporaneously. Together with the fact that our model ages do not correspond to either the Imbrium (3.92 Ga; Neu-kum, 1983) or the Orientale (3.84 Ga; Neukum, 1983) event, we interpret this to be more consistent with a volcanic origin of the studied light plains in Sinus Medii, an interpretation already put
TA
BLE
16.
CO
MP
AR
ISO
N O
F A
GE
S F
OR
BA
SA
LTS
IN M
AR
E C
OG
NIT
UM
*
Uni
t Lu
nar
Orb
iter
imag
e A
rea
(km
2 ) C
rate
r re
tent
ion
age
N(1
) E
rror
M
odel
age
(G
a)
Err
or
(b.y
.)
Boy
ce (
1976
) W
ilhel
ms
and
McC
aule
y (1
971)
E
ggle
ton
(196
5)
C
5 IV
125H
3 15
97
3.30
E–0
3/
8.38
E–0
3 +
0.65
E–0
3/
–0.4
3E–0
3 +
4.22
E–0
3/
–2.4
5E–0
3
3.32
/3.6
5 +
0.10
/–0.
14
+0.
08/–
0.08
3.
2 Im
, Em
Ip
m
C4
IV12
5H2
1359
3.
50E
–03
+0.
83E
–03/
–0
.45E
–03
3.36
+
0.10
/–0.
11
3.5,
3.2
Im
Ip
m
C3
IV12
0H2
1621
3.
88E
–03
+0.
79E
–03/
–0
.50E
–03
3.41
+
0.08
/–0.
08
3.5
Im
Ipm
C2
IV12
5H2
1325
4.
23E
–03
+1.
24E
–03/
–0
.55E
–03
3.45
+
0.09
/–0.
06
3.2
Em
, Im
Ip
m
C1
IV12
5H2,
IV
125H
3 60
51
4.64
E–0
3 +
1.45
E–0
3/
–0.9
2E–0
3 3.
49
+0.
08/–
0.10
3.
5, 3
.2
Im, E
m
Ipm
*S
ee te
xt fo
r de
tails
.
on August 28, 2011specialpapers.gsapubs.orgDownloaded from
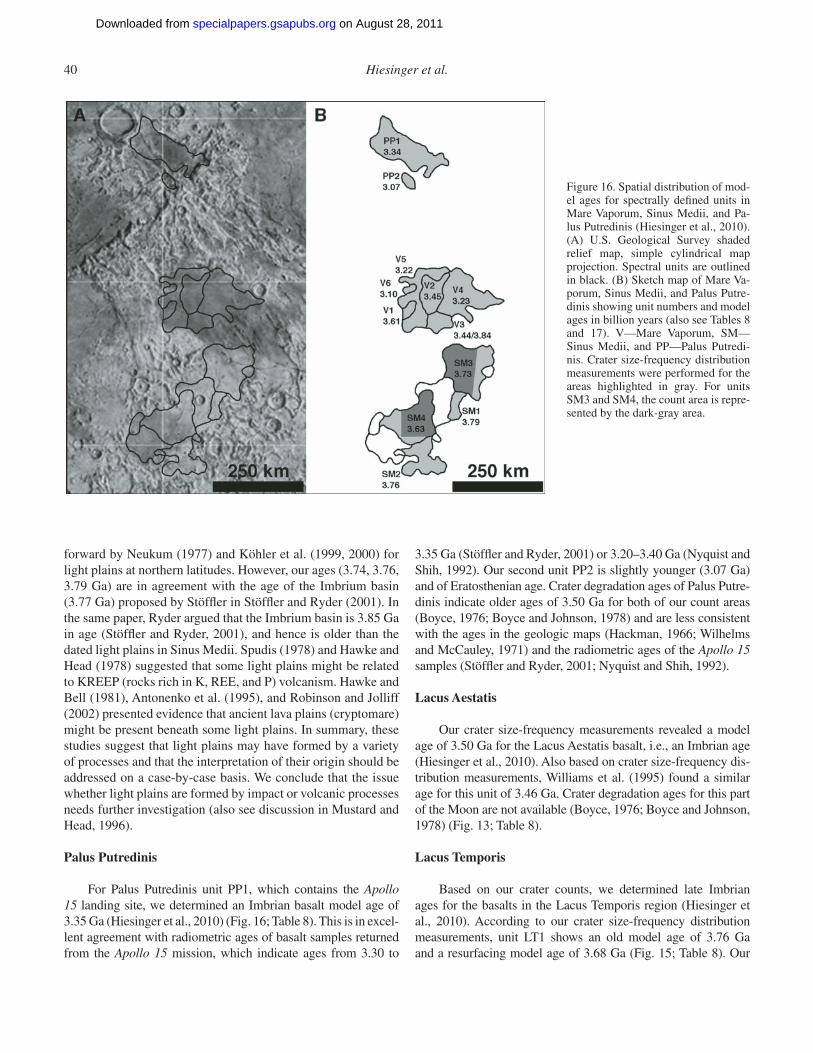
40 Hiesinger et al.
Figure 16. Spatial distribution of mod-el ages for spectrally defi ned units in Mare Vaporum, Sinus Medii, and Pa-lus Putredinis (Hiesinger et al., 2010). (A) U.S. Geological Survey shaded relief map, simple cylindrical map projection. Spectral units are outlined in black. (B) Sketch map of Mare Va-porum, Sinus Medii, and Palus Putre-dinis showing unit numbers and model ages in billion years (also see Tables 8 and 17). V—Mare Vaporum, SM— Sinus Medii, and PP—Palus Putredi-nis. Crater size-frequency distribution measurements were performed for the areas highlighted in gray. For units SM3 and SM4, the count area is repre-sented by the dark-gray area.
forward by Neukum (1977) and Köhler et al. (1999, 2000) for light plains at northern latitudes. However, our ages (3.74, 3.76, 3.79 Ga) are in agreement with the age of the Imbrium basin (3.77 Ga) proposed by Stöffl er in Stöffl er and Ryder (2001). In the same paper, Ryder argued that the Imbrium basin is 3.85 Ga in age (Stöffl er and Ryder, 2001), and hence is older than the dated light plains in Sinus Medii. Spudis (1978) and Hawke and Head (1978) suggested that some light plains might be related to KREEP (rocks rich in K, REE, and P) volcanism. Hawke and Bell (1981), Antonenko et al. (1995), and Robinson and Jolliff (2002) presented evidence that ancient lava plains (cryptomare) might be present beneath some light plains. In summary, these studies suggest that light plains may have formed by a variety of processes and that the interpretation of their origin should be addressed on a case-by-case basis. We conclude that the issue whether light plains are formed by impact or volcanic processes needs further investigation (also see discussion in Mustard and Head, 1996).
Palus Putredinis
For Palus Putredinis unit PP1, which contains the Apollo 15 landing site, we determined an Imbrian basalt model age of 3.35 Ga (Hiesinger et al., 2010) (Fig. 16; Table 8). This is in excel-lent agreement with radiometric ages of basalt samples returned from the Apollo 15 mission, which indicate ages from 3.30 to
3.35 Ga (Stöffl er and Ryder, 2001) or 3.20–3.40 Ga (Nyquist and Shih, 1992). Our second unit PP2 is slightly younger (3.07 Ga) and of Eratosthenian age. Crater degradation ages of Palus Putre-dinis indicate older ages of 3.50 Ga for both of our count areas (Boyce, 1976; Boyce and Johnson, 1978) and are less consistent with the ages in the geologic maps (Hackman, 1966; Wilhelms and McCauley, 1971) and the radiometric ages of the Apollo 15 samples (Stöffl er and Ryder, 2001; Nyquist and Shih, 1992).
Lacus Aestatis
Our crater size-frequency measurements revealed a model age of 3.50 Ga for the Lacus Aestatis basalt, i.e., an Imbrian age (Hiesinger et al., 2010). Also based on crater size-frequency dis-tribution measurements, Williams et al. (1995) found a similar age for this unit of 3.46 Ga. Crater degradation ages for this part of the Moon are not available (Boyce, 1976; Boyce and Johnson, 1978) (Fig. 13; Table 8).
Lacus Temporis
Based on our crater counts, we determined late Imbrian ages for the basalts in the Lacus Temporis region (Hiesinger et al., 2010). According to our crater size-frequency distribution measurements, unit LT1 shows an old model age of 3.76 Ga and a resurfacing model age of 3.68 Ga (Fig. 15; Table 8). Our
on August 28, 2011specialpapers.gsapubs.orgDownloaded from
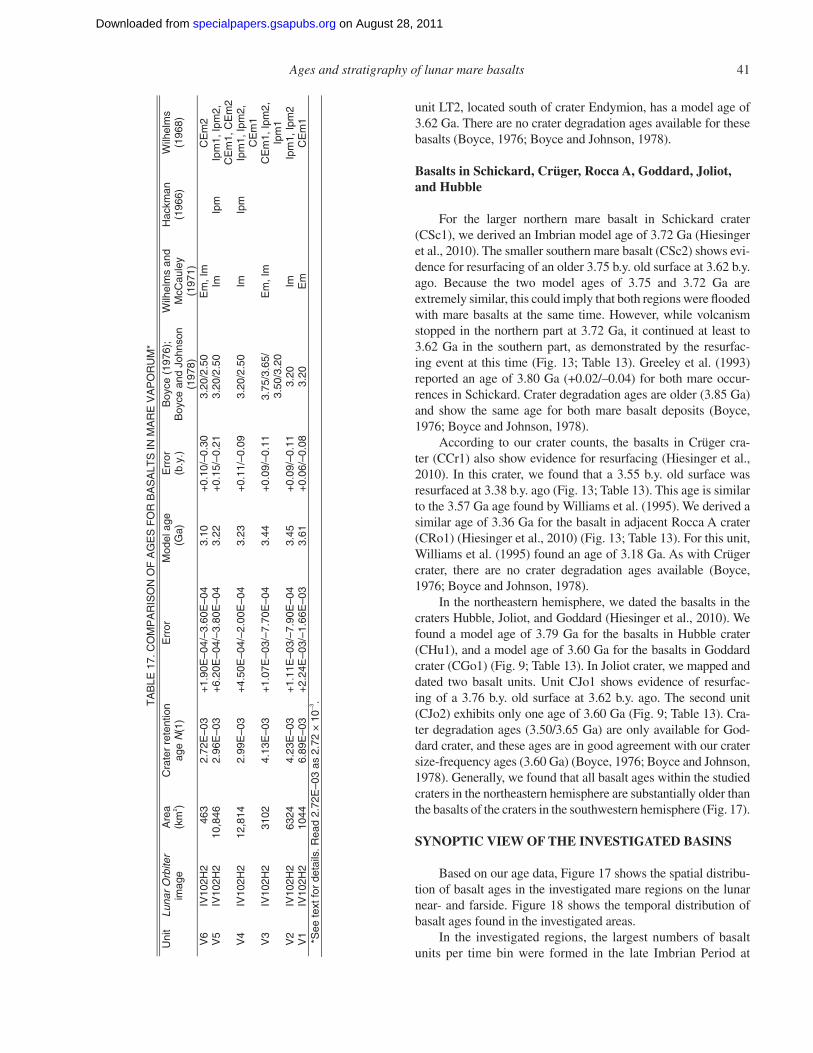
Ages and stratigraphy of lunar mare basalts 41
unit LT2, located south of crater Endymion, has a model age of 3.62 Ga. There are no crater degradation ages available for these basalts (Boyce, 1976; Boyce and Johnson, 1978).
Basalts in Schickard, Crüger, Rocca A, Goddard, Joliot, and Hubble
For the larger northern mare basalt in Schickard crater (CSc1), we derived an Imbrian model age of 3.72 Ga (Hiesinger et al., 2010). The smaller southern mare basalt (CSc2) shows evi-dence for resurfacing of an older 3.75 b.y. old surface at 3.62 b.y. ago. Because the two model ages of 3.75 and 3.72 Ga are extremely similar, this could imply that both regions were fl ooded with mare basalts at the same time. However, while volcanism stopped in the northern part at 3.72 Ga, it continued at least to 3.62 Ga in the southern part, as demonstrated by the resurfac-ing event at this time (Fig. 13; Table 13). Greeley et al. (1993) reported an age of 3.80 Ga (+0.02/–0.04) for both mare occur-rences in Schickard. Crater degradation ages are older (3.85 Ga) and show the same age for both mare basalt deposits (Boyce, 1976; Boyce and Johnson, 1978).
According to our crater counts, the basalts in Crüger cra-ter (CCr1) also show evidence for resurfacing (Hiesinger et al., 2010). In this crater, we found that a 3.55 b.y. old surface was resurfaced at 3.38 b.y. ago (Fig. 13; Table 13). This age is similar to the 3.57 Ga age found by Williams et al. (1995). We derived a similar age of 3.36 Ga for the basalt in adjacent Rocca A crater (CRo1) (Hiesinger et al., 2010) (Fig. 13; Table 13). For this unit, Williams et al. (1995) found an age of 3.18 Ga. As with Crüger crater, there are no crater degradation ages available (Boyce, 1976; Boyce and Johnson, 1978).
In the northeastern hemisphere, we dated the basalts in the craters Hubble, Joliot, and Goddard (Hiesinger et al., 2010). We found a model age of 3.79 Ga for the basalts in Hubble crater (CHu1), and a model age of 3.60 Ga for the basalts in Goddard crater (CGo1) (Fig. 9; Table 13). In Joliot crater, we mapped and dated two basalt units. Unit CJo1 shows evidence of resurfac-ing of a 3.76 b.y. old surface at 3.62 b.y. ago. The second unit (CJo2) exhibits only one age of 3.60 Ga (Fig. 9; Table 13). Cra-ter degradation ages (3.50/3.65 Ga) are only available for God-dard crater, and these ages are in good agreement with our crater size- frequency ages (3.60 Ga) (Boyce, 1976; Boyce and Johnson, 1978). Generally, we found that all basalt ages within the studied craters in the northeastern hemisphere are substantially older than the basalts of the craters in the southwestern hemisphere (Fig. 17).
SYNOPTIC VIEW OF THE INVESTIGATED BASINS
Based on our age data, Figure 17 shows the spatial distribu-tion of basalt ages in the investigated mare regions on the lunar near- and farside. Figure 18 shows the temporal distribution of basalt ages found in the investigated areas.
In the investigated regions, the largest numbers of basalt units per time bin were formed in the late Imbrian Period at
TA
BLE
17.
CO
MP
AR
ISO
N O
F A
GE
S F
OR
BA
SA
LTS
IN M
AR
E V
AP
OR
UM
*
Uni
t Lu
nar
Orb
iter
imag
e A
rea
(km
2 ) C
rate
r re
tent
ion
age
N(1
) E
rror
M
odel
age
(G
a)
Err
or
(b.y
.)
Boy
ce (
1976
);
Boy
ce a
nd J
ohns
on
(197
8)
Wilh
elm
s an
d M
cCau
ley
(197
1)
Hac
kman
(1
966)
W
ilhel
ms
(196
8)
V6
IV10
2H2
463
2.72
E–0
3 +
1.90
E–0
4/–3
.60E
–04
3.10
+
0.10
/–0.
30
3.20
/2.5
0 E
m, I
m
C
Em
2 V
5 IV
102H
2 10
,846
2.
96E
–03
+6.
20E
–04/
–3.8
0E–0
4 3.
22
+0.
15/–
0.21
3.
20/2
.50
Im
Ipm
Ip
m1,
Ipm
2, 2
mE
C ,1m
EC
V4
IV10
2H2
12,8
14
2.99
E–0
3 +
4.50
E–0
4/–2
.00E
–04
3.23
+
0.11
/–0.
09
3.20
/2.5
0 Im
Ip
m
Ipm
1, Ip
m2,
1
mE
C
V
3 IV
102H
2 31
02
4.13
E–0
3 +
1.07
E–0
3/–7
.70E
–04
3.44
+
0.09
/–0.
11
3.75
/3.6
5/
Em
, Im
CE
m1,
Ipm
2,
1mpI
02.3/05.3
V2
IV10
2H2
6324
4.
23E
–03
+1.
11E
–03/
–7.9
0E–0
4 3.
45
+0.
09/–
0.11
3.
20
Im
Ip
m1,
Ipm
2 V
1 IV
102H
2 10
44
6.89
E–0
3 +
2.24
E–0
3/–1
.66E
–03
3.61
+
0.06
/–0.
08
3.20
E
m
C
Em
1
*See
text
for
deta
ils. R
ead
2.72
E–0
3 as
2.7
2 ×
10–3
.
on August 28, 2011specialpapers.gsapubs.orgDownloaded from
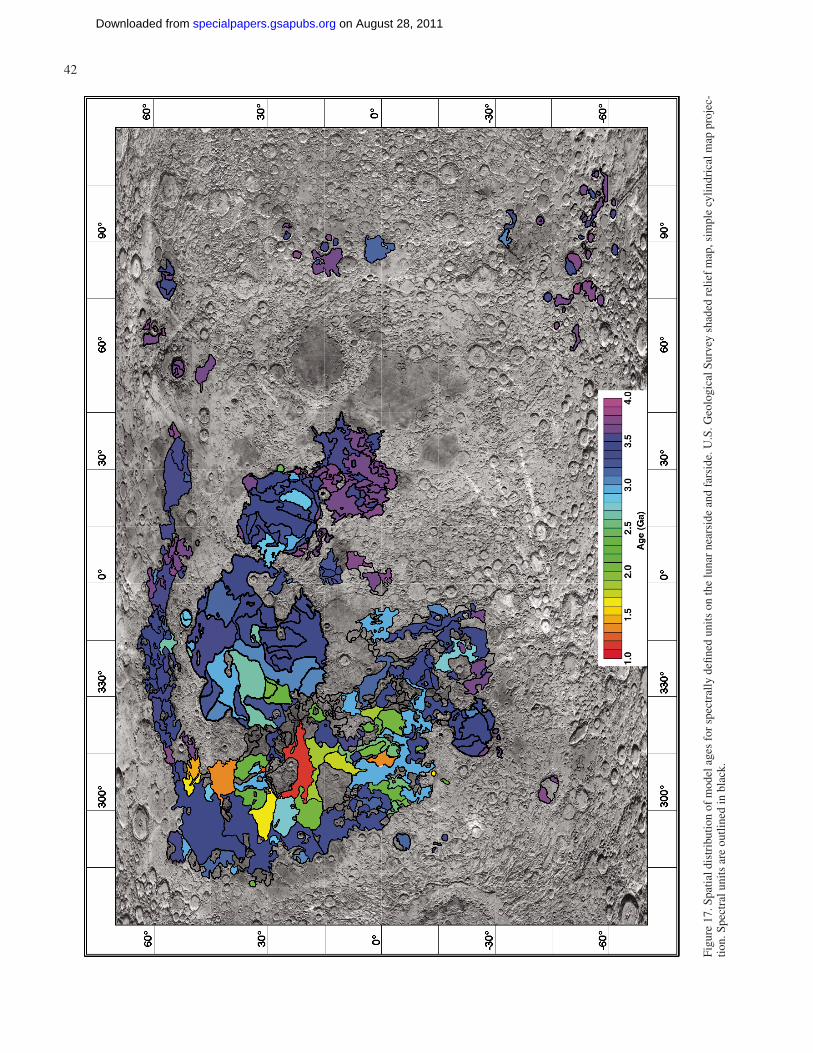
42 Hiesinger et al.
Figu
re 1
7. S
patia
l dis
trib
utio
n of
mod
el a
ges
for
spec
tral
ly d
efi n
ed u
nits
on
the
luna
r ne
arsi
de a
nd f
arsi
de. U
.S. G
eolo
gica
l Sur
vey
shad
ed r
elie
f m
ap, s
impl
e cy
lindr
ical
map
pro
jec-
tion.
Spe
ctra
l uni
ts a
re o
utlin
ed in
bla
ck.
on August 28, 2011specialpapers.gsapubs.orgDownloaded from
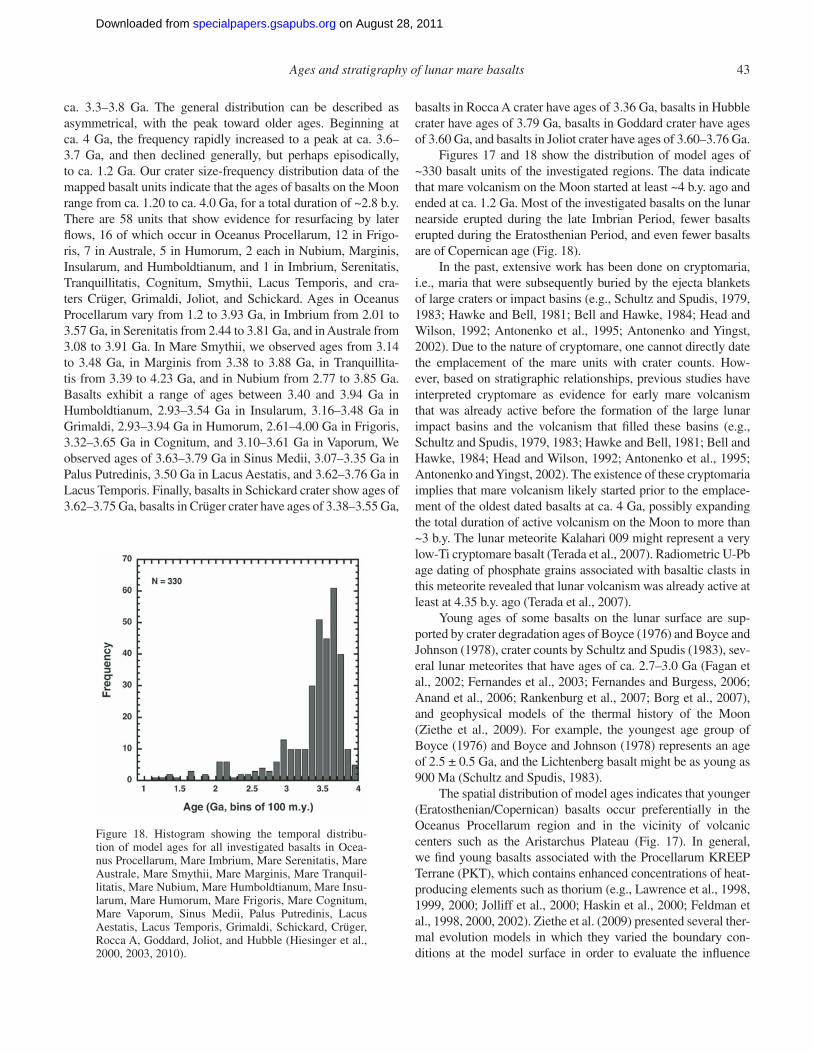
Ages and stratigraphy of lunar mare basalts 43
ca. 3.3–3.8 Ga. The general distribution can be described as asymmetrical, with the peak toward older ages. Beginning at ca. 4 Ga, the frequency rapidly increased to a peak at ca. 3.6–3.7 Ga, and then declined generally, but perhaps episodically, to ca. 1.2 Ga. Our crater size-frequency distribution data of the mapped basalt units indicate that the ages of basalts on the Moon range from ca. 1.20 to ca. 4.0 Ga, for a total duration of ~2.8 b.y. There are 58 units that show evidence for resurfacing by later fl ows, 16 of which occur in Oceanus Procellarum, 12 in Frigo-ris, 7 in Australe, 5 in Humorum, 2 each in Nubium, Marginis, Insularum, and Humboldtianum, and 1 in Imbrium, Serenitatis, Tranquillitatis, Cognitum, Smythii, Lacus Temporis, and cra-ters Crüger, Grimaldi, Joliot, and Schickard. Ages in Oceanus Procellarum vary from 1.2 to 3.93 Ga, in Imbrium from 2.01 to 3.57 Ga, in Serenitatis from 2.44 to 3.81 Ga, and in Australe from 3.08 to 3.91 Ga. In Mare Smythii, we observed ages from 3.14 to 3.48 Ga, in Marginis from 3.38 to 3.88 Ga, in Tranquillita-tis from 3.39 to 4.23 Ga, and in Nubium from 2.77 to 3.85 Ga. Basalts exhibit a range of ages between 3.40 and 3.94 Ga in Humboldtianum, 2.93–3.54 Ga in Insularum, 3.16–3.48 Ga in Grimaldi, 2.93–3.94 Ga in Humorum, 2.61–4.00 Ga in Frigoris, 3.32–3.65 Ga in Cognitum, and 3.10–3.61 Ga in Vaporum, We observed ages of 3.63–3.79 Ga in Sinus Medii, 3.07–3.35 Ga in Palus Putredinis, 3.50 Ga in Lacus Aestatis, and 3.62–3.76 Ga in Lacus Temporis. Finally, basalts in Schickard crater show ages of 3.62–3.75 Ga, basalts in Crüger crater have ages of 3.38–3.55 Ga,
Figure 18. Histogram showing the temporal distribu-tion of model ages for all investigated basalts in Ocea-nus Procellarum, Mare Imbrium, Mare Serenitatis, Mare Australe, Mare Smythii, Mare Marginis, Mare Tranquil-litatis, Mare Nubium, Mare Humboldtianum, Mare Insu-larum, Mare Humorum, Mare Frigoris, Mare Cognitum, Mare Vaporum, Sinus Medii, Palus Putredinis, Lacus Aestatis, Lacus Temporis, Grimaldi, Schickard, Crüger, Rocca A, Goddard, Joliot, and Hubble (Hiesinger et al., 2000, 2003, 2010).
basalts in Rocca A crater have ages of 3.36 Ga, basalts in Hubble crater have ages of 3.79 Ga, basalts in Goddard crater have ages of 3.60 Ga, and basalts in Joliot crater have ages of 3.60–3.76 Ga.
Figures 17 and 18 show the distribution of model ages of ~330 basalt units of the investigated regions. The data indicate that mare volcanism on the Moon started at least ~4 b.y. ago and ended at ca. 1.2 Ga. Most of the investigated basalts on the lunar nearside erupted during the late Imbrian Period, fewer basalts erupted during the Eratosthenian Period, and even fewer basalts are of Copernican age (Fig. 18).
In the past, extensive work has been done on cryptomaria, i.e., maria that were subsequently buried by the ejecta blankets of large craters or impact basins (e.g., Schultz and Spudis, 1979, 1983; Hawke and Bell, 1981; Bell and Hawke, 1984; Head and Wilson, 1992; Antonenko et al., 1995; Antonenko and Yingst, 2002). Due to the nature of cryptomare, one cannot directly date the emplacement of the mare units with crater counts. How-ever, based on stratigraphic relationships, previous studies have interpreted cryptomare as evidence for early mare volcanism that was already active before the formation of the large lunar impact basins and the volcanism that fi lled these basins (e.g., Schultz and Spudis, 1979, 1983; Hawke and Bell, 1981; Bell and Hawke, 1984; Head and Wilson, 1992; Antonenko et al., 1995; Antonenko and Yingst, 2002). The existence of these cryptomaria implies that mare volcanism likely started prior to the emplace-ment of the oldest dated basalts at ca. 4 Ga, possibly expanding the total duration of active volcanism on the Moon to more than ~3 b.y. The lunar meteorite Kalahari 009 might represent a very low-Ti cryptomare basalt (Terada et al., 2007). Radiometric U-Pb age dating of phosphate grains associated with basaltic clasts in this meteorite revealed that lunar volcanism was already active at least at 4.35 b.y. ago (Terada et al., 2007).
Young ages of some basalts on the lunar surface are sup-ported by crater degradation ages of Boyce (1976) and Boyce and Johnson (1978), crater counts by Schultz and Spudis (1983), sev-eral lunar meteorites that have ages of ca. 2.7–3.0 Ga (Fagan et al., 2002; Fernandes et al., 2003; Fernandes and Burgess, 2006; Anand et al., 2006; Rankenburg et al., 2007; Borg et al., 2007), and geophysical models of the thermal history of the Moon (Ziethe et al., 2009). For example, the youngest age group of Boyce (1976) and Boyce and Johnson (1978) represents an age of 2.5 ± 0.5 Ga, and the Lichtenberg basalt might be as young as 900 Ma (Schultz and Spudis, 1983).
The spatial distribution of model ages indicates that younger (Eratosthenian/Copernican) basalts occur preferentially in the Oceanus Procellarum region and in the vicinity of volcanic centers such as the Aristarchus Plateau (Fig. 17). In general, we fi nd young basalts associated with the Procellarum KREEP Terrane (PKT), which contains enhanced concentrations of heat- producing elements such as thorium (e.g., Lawrence et al., 1998, 1999, 2000; Jolliff et al., 2000; Haskin et al., 2000; Feldman et al., 1998, 2000, 2002). Ziethe et al. (2009) presented several ther-mal evolution models in which they varied the boundary con-ditions at the model surface in order to evaluate the infl uence
on August 28, 2011specialpapers.gsapubs.orgDownloaded from
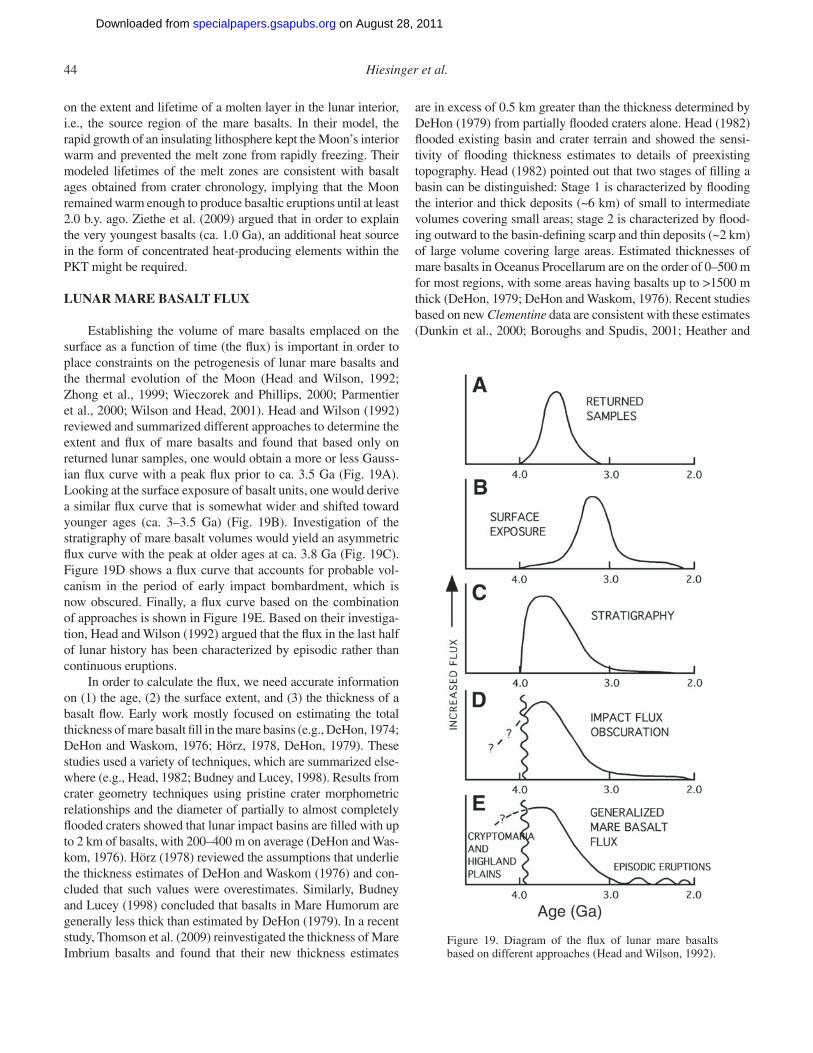
44 Hiesinger et al.
on the extent and lifetime of a molten layer in the lunar interior, i.e., the source region of the mare basalts. In their model, the rapid growth of an insulating lithosphere kept the Moon’s interior warm and prevented the melt zone from rapidly freezing. Their modeled lifetimes of the melt zones are consistent with basalt ages obtained from crater chronology, implying that the Moon remained warm enough to produce basaltic eruptions until at least 2.0 b.y. ago. Ziethe et al. (2009) argued that in order to explain the very youngest basalts (ca. 1.0 Ga), an additional heat source in the form of concentrated heat-producing elements within the PKT might be required.
LUNAR MARE BASALT FLUX
Establishing the volume of mare basalts emplaced on the surface as a function of time (the fl ux) is important in order to place constraints on the petrogenesis of lunar mare basalts and the thermal evolution of the Moon (Head and Wilson, 1992; Zhong et al., 1999; Wieczorek and Phillips, 2000; Parmentier et al., 2000; Wilson and Head, 2001). Head and Wilson (1992) reviewed and summarized different approaches to determine the extent and fl ux of mare basalts and found that based only on returned lunar samples, one would obtain a more or less Gauss-ian fl ux curve with a peak fl ux prior to ca. 3.5 Ga (Fig. 19A). Looking at the surface exposure of basalt units, one would derive a similar fl ux curve that is somewhat wider and shifted toward younger ages (ca. 3–3.5 Ga) (Fig. 19B). Investigation of the stratigraphy of mare basalt volumes would yield an asymmetric fl ux curve with the peak at older ages at ca. 3.8 Ga (Fig. 19C). Figure 19D shows a fl ux curve that accounts for probable vol-canism in the period of early impact bombardment, which is now obscured. Finally, a fl ux curve based on the combination of approaches is shown in Figure 19E. Based on their investiga-tion, Head and Wilson (1992) argued that the fl ux in the last half of lunar history has been characterized by episodic rather than continuous eruptions.
In order to calculate the fl ux, we need accurate information on (1) the age, (2) the surface extent, and (3) the thickness of a basalt fl ow. Early work mostly focused on estimating the total thickness of mare basalt fi ll in the mare basins (e.g., DeHon, 1974; DeHon and Waskom, 1976; Hörz, 1978, DeHon, 1979). These studies used a variety of techniques, which are summarized else-where (e.g., Head, 1982; Budney and Lucey, 1998). Results from crater geometry techniques using pristine crater morphometric relationships and the diameter of partially to almost completely fl ooded craters showed that lunar impact basins are fi lled with up to 2 km of basalts, with 200–400 m on average (DeHon and Was-kom, 1976). Hörz (1978) reviewed the assumptions that underlie the thickness estimates of DeHon and Waskom (1976) and con-cluded that such values were overestimates. Similarly, Budney and Lucey (1998) concluded that basalts in Mare Humorum are generally less thick than estimated by DeHon (1979). In a recent study, Thomson et al. (2009) reinvestigated the thickness of Mare Imbrium basalts and found that their new thickness estimates
Figure 19. Diagram of the fl ux of lunar mare basalts based on different approaches (Head and Wilson, 1992).
are in excess of 0.5 km greater than the thickness determined by DeHon (1979) from partially fl ooded craters alone. Head (1982) fl ooded existing basin and crater terrain and showed the sensi-tivity of fl ooding thickness estimates to details of preexisting topography. Head (1982) pointed out that two stages of fi lling a basin can be distinguished: Stage 1 is characterized by fl ooding the interior and thick deposits (~6 km) of small to intermediate volumes covering small areas; stage 2 is characterized by fl ood-ing outward to the basin-defi ning scarp and thin deposits (~2 km) of large volume covering large areas. Estimated thicknesses of mare basalts in Oceanus Procellarum are on the order of 0–500 m for most regions, with some areas having basalts up to >1500 m thick (DeHon, 1979; DeHon and Waskom, 1976). Recent studies based on new Clementine data are consistent with these estimates (Dunkin et al., 2000; Boroughs and Spudis, 2001; Heather and
on August 28, 2011specialpapers.gsapubs.orgDownloaded from
Ages and stratigraphy of lunar mare basalts 45
Dunkin, 2002). Using craters that excavated highland material from beneath the mare basalts in Oceanus Procellarum, Heather and Dunkin (2002) estimated that the basalts are 160–625 m thick, with thicknesses ranging from tens to hundreds of meters near the mare/highland boundaries and several hundreds of meters closer to the center of the mare. Based on the exposure of highland islands and crater rims such as Flamsteed, Wilhelms and McCauley (1971) concluded that the thickness of mare basalts within Oceanus Procellarum is relatively thin. All these estimates, which are based on fl ooded impact craters or impact craters that penetrated the mare basalts and excavated underlying highland material, provide the total thickness of basalts in a par-ticular basin, but not the thickness of individual basalt fl ow units.
To place better constraints on the fl ux of lunar mare basalt volcanism, we need to know the thicknesses of individual mare fl ow units. In the past, extensive work has been done to estimate the thicknesses of individual fl ow units (e.g., Howard et al., 1972; Schaber, 1973; Brett, 1975; Schaber et al., 1976; Gifford and El-Baz, 1978, 1981). Gifford and El-Baz (1978, 1981) noted that despite the wide acceptance of the idea of multiple fl ow units fi lling the basins, morphometric characteristics of individual fl ow units have not been extensively studied. Measurements of fl ow unit thicknesses are complicated by (1) the limited availability of suitable data necessary for the recognition of fl ow fronts, i.e., high-resolution topography and near-terminator low-sun images, (2) regolith formation processes, i.e., impact cratering, which can obliterate fl ow fronts of up to 15 m (Head, 1976), and (3) the composition and the eruption style of lunar lavas, which are thought to be responsible for the sparseness of mare fl ow fea-tures (Schultz et al., 1976; Head, 1976).
Numerous techniques have been applied to estimate the thicknesses of individual fl ow units. Such techniques included: (1) shadow measurements in high-resolution low-sun images (e.g., Schaber, 1973; Schaber et al., 1976; Gifford and El-Baz, 1978, 1981); (2) in situ observations of fl ow units by the Apollo astronauts, e.g., within the walls of Hadley Rille at the Apollo 15 landing site (Howard et al., 1972); and (3) studies of the chemical kinetic aspects of lava emplacement and cooling (Brett, 1975).
On the basis of Apollo 14 and 15 near-terminator images of the region southeast of Kunowsky crater, Lloyd and Head (1972) determined a fl ow front height of 3–5 m for a single fl ow unit. Reporting on a much larger number of units, Gifford and El-Baz (1981) found fl ow heights of 1–96 m, with an average thickness of ~21 m. These results are similar to thicknesses of 10–20 m observed in the wall of Hadley Rille (Howard et al., 1972). Gif-ford and El-Baz (1981) argued that a few fl ow units might even have actual thicknesses in excess of 100 m because only the shad-owed portions of the fl ow fronts were measured. Schaber (1973) found that the average thickness of the Eratosthenian fl ows in Mare Imbrium is 30–35 m. However, they considered these Era-tosthenian fl ows as atypical because their thickness (10–63 m) is much larger compared to other lunar fl ow fronts that could be identifi ed in imaging data (5–10 m) (Schaber et al., 1976). Finally, chemical kinetic considerations based on Apollo samples
suggest that lunar lava fl ow units are no thicker than ~8–10 m at the Apollo 11, 12, and 15 sites (Brett, 1975).
A fourth technique was applied by Neukum and Horn (1976). They showed that endogenic lava fl ow processes could be identifi ed by their characteristic effects on crater size-frequency distributions, even if these individual fl ows were not visible in the images. This is an important result because photogeologic and morphologic recognition of individual fl ow fronts on the Moon is diffi cult and is mostly restricted to thicker fl ows and areas where low-sun images or samples have been obtained. Based on defl ections (knees) in crater size-frequency distribution curves, Neukum and Horn (1976) estimated the thickness of Imbrian-age fl ow units in Mare Imbrium. They found that these fl ows are ~200 m thick, and they reported Eratosthenian fl ows to be ~60 m thick. The latter value is consistent with photogeologic estimates of the same fl ow unit by Schaber (1973), Schaber et al. (1976), and Gifford and El-Baz (1981). Hiesinger et al. (2002) applied this technique to a much larger number of their crater counts and found that the average thickness of 58 of their inves-tigated individual basalt fl ow units is ~30–60 m, with a range of fl ow unit thickness of ~20–200 m. A comparison with previ-ously published thickness estimates (e.g., Howard et al., 1972; Schaber, 1973; Brett, 1975; Schaber et al., 1976; Gifford and El-Baz, 1978, 1981) showed that crater size-frequency distribution measurements yield thicknesses that are in excellent agreement with results from these other techniques and allow one to obtain thicknesses of additional fl ow units that have not been detected in low-sun images. Based on their thickness estimates, Hiesinger et al. (2002) also reported that the volumes of individual basalt fl ows range from 30 to 7700 km3, with an average of 590–940 km3. Yingst and Head (1997) estimated the volumes of lava ponds thought to represent single eruptive phases and found that pond volumes range from 35 to 8745 km3, with a mean value of 860 km3 for South Pole–Aitken, and 10–1280 km3, with a mean value of 240 km3 for the Orientale region.
For our fl ux estimates, we used ages and thicknesses derived from crater size-frequency distribution measurements and surface extents of mare basalt units measured in imaging data. We have already demonstrated that crater size-frequency distribution measurements constitute an adequate method to derive the surface age of the uppermost basalt unit with suf-fi cient accuracy (Hiesinger et al., 2000, 2003, 2010). We have also demonstrated that crater size-frequency distribution mea-surements can be used to estimate the thickness of mare fl ow units (Hiesinger et al., 2002).
Using this approach, we have to consider potential caveats. First, because older units might have been covered by younger fl ows, the measured surface area of older basalt fl ow units might be too small. Consequently, volumes estimated for these fl ow units must be considered as minimum estimates. Secondly, we also have to consider variations of fl ow unit thicknesses with time, i.e., older fl ow units might be thicker than younger fl ow units, as indicated by the work of Head (1982). Again, this implies that volumes estimates of early fl ow units are minimum estimates.
on August 28, 2011specialpapers.gsapubs.orgDownloaded from
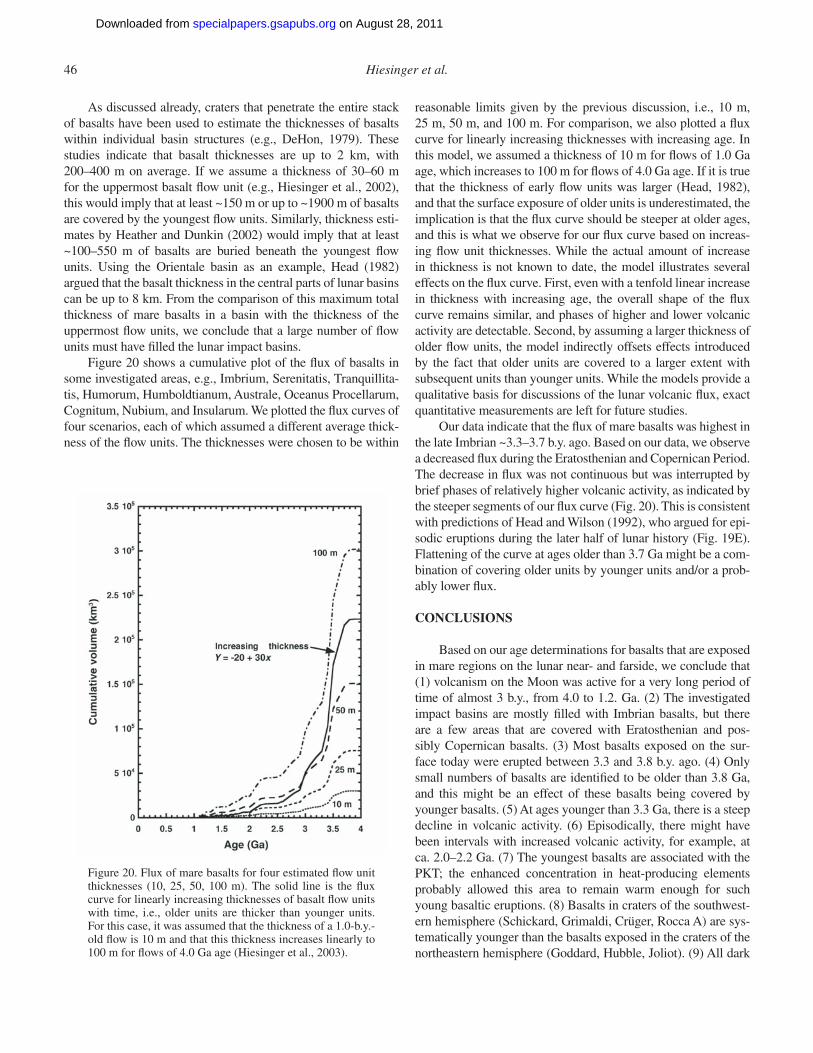
46 Hiesinger et al.
As discussed already, craters that penetrate the entire stack of basalts have been used to estimate the thicknesses of basalts within individual basin structures (e.g., DeHon, 1979). These studies indicate that basalt thicknesses are up to 2 km, with 200–400 m on average. If we assume a thickness of 30–60 m for the uppermost basalt fl ow unit (e.g., Hiesinger et al., 2002), this would imply that at least ~150 m or up to ~1900 m of basalts are covered by the youngest fl ow units. Similarly, thickness esti-mates by Heather and Dunkin (2002) would imply that at least ~100–550 m of basalts are buried beneath the youngest fl ow units. Using the Orientale basin as an example, Head (1982) argued that the basalt thickness in the central parts of lunar basins can be up to 8 km. From the comparison of this maximum total thickness of mare basalts in a basin with the thickness of the uppermost fl ow units, we conclude that a large number of fl ow units must have fi lled the lunar impact basins.
Figure 20 shows a cumulative plot of the fl ux of basalts in some investigated areas, e.g., Imbrium, Serenitatis, Tranquillita-tis, Humorum, Humboldtianum, Australe, Oceanus Procellarum, Cognitum, Nubium, and Insularum. We plotted the fl ux curves of four scenarios, each of which assumed a different average thick-ness of the fl ow units. The thicknesses were chosen to be within
reasonable limits given by the previous discussion, i.e., 10 m, 25 m, 50 m, and 100 m. For comparison, we also plotted a fl ux curve for linearly increasing thicknesses with increasing age. In this model, we assumed a thickness of 10 m for fl ows of 1.0 Ga age, which increases to 100 m for fl ows of 4.0 Ga age. If it is true that the thickness of early fl ow units was larger (Head, 1982), and that the surface exposure of older units is underestimated, the implication is that the fl ux curve should be steeper at older ages, and this is what we observe for our fl ux curve based on increas-ing fl ow unit thicknesses. While the actual amount of increase in thickness is not known to date, the model illustrates several effects on the fl ux curve. First, even with a tenfold linear increase in thickness with increasing age, the overall shape of the fl ux curve remains similar, and phases of higher and lower volcanic activity are detectable. Second, by assuming a larger thickness of older fl ow units, the model indirectly offsets effects introduced by the fact that older units are covered to a larger extent with subsequent units than younger units. While the models provide a qualitative basis for discussions of the lunar volcanic fl ux, exact quantitative measurements are left for future studies.
Our data indicate that the fl ux of mare basalts was highest in the late Imbrian ~3.3–3.7 b.y. ago. Based on our data, we observe a decreased fl ux during the Eratosthenian and Copernican Period. The decrease in fl ux was not continuous but was interrupted by brief phases of relatively higher volcanic activity, as indicated by the steeper segments of our fl ux curve (Fig. 20). This is consistent with predictions of Head and Wilson (1992), who argued for epi-sodic eruptions during the later half of lunar history (Fig. 19E). Flattening of the curve at ages older than 3.7 Ga might be a com-bination of covering older units by younger units and/or a prob-ably lower fl ux.
CONCLUSIONS
Based on our age determinations for basalts that are exposed in mare regions on the lunar near- and farside, we conclude that (1) volcanism on the Moon was active for a very long period of time of almost 3 b.y., from 4.0 to 1.2. Ga. (2) The investigated impact basins are mostly fi lled with Imbrian basalts, but there are a few areas that are covered with Eratosthenian and pos-sibly Copernican basalts. (3) Most basalts exposed on the sur-face today were erupted between 3.3 and 3.8 b.y. ago. (4) Only small numbers of basalts are identifi ed to be older than 3.8 Ga, and this might be an effect of these basalts being covered by younger basalts. (5) At ages younger than 3.3 Ga, there is a steep decline in volcanic activity. (6) Episodically, there might have been intervals with increased volcanic activity, for example, at ca. 2.0–2.2 Ga. (7) The youngest basalts are associated with the PKT; the enhanced concentration in heat-producing elements probably allowed this area to remain warm enough for such young basaltic eruptions. (8) Basalts in craters of the southwest-ern hemisphere (Schickard, Grimaldi, Crüger, Rocca A) are sys-tematically younger than the basalts exposed in the craters of the northeastern hemisphere (Goddard, Hubble, Joliot). (9) All dark
Figure 20. Flux of mare basalts for four estimated fl ow unit thicknesses (10, 25, 50, 100 m). The solid line is the fl ux curve for linearly increasing thicknesses of basalt fl ow units with time, i.e., older units are thicker than younger units. For this case, it was assumed that the thickness of a 1.0-b.y.-old fl ow is 10 m and that this thickness increases linearly to 100 m for fl ows of 4.0 Ga age (Hiesinger et al., 2003).
on August 28, 2011specialpapers.gsapubs.orgDownloaded from
Ages and stratigraphy of lunar mare basalts 47
mantle deposits are Imbrian in age and often older than adjacent mare basalts. (10) Thickness estimates for 58 basalt units based on crater size-frequency measurements revealed average thick-nesses of 30–60 m. (11) Volume estimates in combination with ages of individual basalt units indicate a steep decline in erupted basalt volumes since ca. 3.6 Ga.
ACKNOWLEDGMENTS
We would like to thank the National Aeronautics and Space Administration (NASA) Planetary Geology and Geophysics Program, which provided support for this analysis to Head and Hiesinger while at Brown University. Figures 1–17, and 20 are reproduced by permission of the American Geophysical Union.
REFERENCES CITED
Alexander, E.C., Jr., Bates, A., Coscio, M.R., Jr., Dragon, J.C., Murthy, V.R., Pepin, R.O., and Venkatesan, T.R., 1976, K/Ar dating of lunar soils II: Houston, Texas, Lunar and Planetary Institute, Lunar and Planetary Sci-ence Conference VII, p. 625–648.
Anand, M., Taylor, L.A., Floss, C., Neal, C.R., Terada, K., and Tanikawa, S., 2006, Petrology and geochemistry of LaPaz Icefi eld 02205: A new unique low-Ti mare-basalt meteorite: Geochimica et Cosmochimica Acta, v. 70, p. 246–264, doi:10.1016/j.gca.2005.08.018.
Antonenko, I., and Yingst, R.A., 2002, Mare and cryptomare deposits in the Schickard region of the Moon: New measurements using Clementine FeO data: Houston, Texas, Lunar and Planetary Institute, Lunar and Planetary Science Conference XXXIII, CD-ROM, abstract 1438.
Antonenko, I., Head, J.W., III, Mustard, J.F., and Hawke, B.R., 1995, Criteria for the detection of lunar cryptomaria: Earth, Moon, and Planets, v. 69, p. 141–172, doi:10.1007/BF00613096.
Arvidson, R., Boyce, J., Chapman, C., Cintala, M., Fulchignoni, M., Moore, H., Neukum, G., Schultz, P., Soderblom, L., Strom, R., Woronow, A., and Young, R., 1979, Standard techniques for presentation and analysis of crater size-frequency data: Icarus, v. 37, p. 467–474, doi:10.1016/0019-1035(79)90009-5.
Baldwin, R.B., 1971, On the history of lunar impact cratering: The abso-lute time scale and the origin of planetesimals: Icarus, v. 14, p. 36–52, doi:10.1016/0019-1035(71)90100-X.
Baldwin, R.B., 1974, Was there a “terminal lunar cataclysm” 3.9–4.0 × 10⁹ years ago?: Icarus, v. 23, p. 157–166, doi:10.1016/0019-1035(74)90003-7.
Baldwin, R.B., 1987, On the relative and absolute ages of seven lunar front face basins: II. From crater counts: Icarus, v. 71, p. 19–29, doi:10.1016/0019-1035(87)90159-X.
Basaltic Volcanism Study Project (BVSP), 1981, Basaltic Volcanism on the Ter-restrial Planets: New York, Pergamon, 1286 p.
Bell, J.F., and Hawke, B.R., 1984, Lunar dark-haloed impact craters: Ori-gins and implications for early mare volcanism: Journal of Geophysical Research, v. 89, p. 6899–6910, doi:10.1029/JB089iB08p06899.
Bierhaus, E.B., Chapman, C.R., and Merline, W.J., 2005, Secondary craters on Europa and implications for cratered surfaces: Nature, v. 437, p. 1125–1127, doi:10.1038/nature04069.
Borg, L.E., Gaffney, A., and DePaolo, D., 2007, Rb-Sr and Sm-Nd isotopic systematics of NWA 032, in 70th Annual Meteoritical Society Meeting Abstracts, 13–17 August 2007, Tucson, Arizona: Meteoritics and Plan-etary Science Supplement, v. 42, p. 5232.
Boroughs, L.L., and Spudis, P.D., 2001, The stratigraphy of lava fl ows in north-ern Oceanus Procellarum, Moon: Houston, Texas, Lunar and Planetary Institute, Lunar and Planetary Science Conference XXXII, CD-ROM, abstract 1192.
Boyce, J.M., 1976, Ages of fl ow units in the lunar nearside maria based on Lunar Orbiter IV photographs: Houston, Texas, Lunar and Planetary Institute, Lunar and Planetary Science Conference VII, p. 2717–2728.
Boyce, J.M., and Johnson, D.A., 1978, Ages of fl ow units in the far eastern maria and implications for basin-fi lling history: Houston, Texas, Lunar and Planetary Institute, Lunar and Planetary Science Conference IX, p. 3275–3283.
Brett, R., 1975, Thicknesses of some lunar mare basalt fl ows and ejecta blan-kets based on chemical kinetic data: Geochimica et Cosmochimica Acta, v. 39, p. 1135–1141, doi:10.1016/0016-7037(75)90055-1.
Budney, C.J., and Lucey, P.G., 1998, Basalt thickness in Mare Humorum: The crater excavation method: Journal of Geophysical Research, v. 103, no. E7, p. 16,855–16,870, doi:10.1029/98JE01602.
Bugiolacchi, R., and Guest, J.E., 2008, Compositional and temporal investiga-tion of exposed lunar basalts in the Mare Imbrium region: Icarus, v. 197, p. 1–18, doi:10.1016/j.icarus.2008.04.001.
Bugiolacchi, R., Spudis, P.D., and Guest, J.E., 2006, Stratigraphy and compo-sition of lava fl ows in Mare Nubium and Mare Cognitum: Meteoritics & Planetary Science, v. 41, p. 285–304, doi:10.1111/j.1945-5100.2006.tb00210.x.
Burgess, R., and Turner, G., 1998, Laser 40Ar-39Ar age determinations of Luna 24 mare basalts: Meteoritics and Space Science, v. 33, no. 4, p. 921–935, doi:10.1111/j.1945-5100.1998.tb01697.x.
Carr, M.H., 1965, Geologic Map of the Timocharis Region of the Moon (LAC-40): U.S. Geological Survey I-462, scale 1:1,000,000.
Carr, M.H., 1966, Geologic Map of the Mare Serenitatis Region of the Moon (LAC-42): U.S. Geological Survey I-489, scale 1:1,000,000.
Chapman, C.R., Ryan, E.V., Merline, W.J., Neukum, G., Wagner, R., Thomas, P.C., Veverka, J., and Sullivan, R.J., 1996a, Cratering on Ida: Icarus, v. 120, p. 77–86, doi:10.1006/icar.1996.0038.
Chapman, C.R., Veverka, J., Belton, M.J.S., Neukum, G., and Morrison, D., 1996b, Cratering on Gaspra: Icarus, v. 120, p. 231–245, doi:10.1006/icar.1996.0048.
Chenet, H., Lognonné, P., Wieczorek, M., and Mizutani, H., 2006, Lateral variations of lunar crustal thickness from the Apollo seismic data set: Earth and Planetary Science Letters, v. 243, p. 1–14, doi:10.1016/j.epsl.2005.12.017.
Dasch, E., Shih, C.-Y., Bansal, B.M., Wiesmann, H., and Nyquist, L.E., 1987, Isotopic analysis of basaltic fragments from lunar breccia 14321: Chronology and petrogenesis of pre-Imbrium mare volcanism: Geochi-mica et Cosmochimica Acta, v. 51, p. 3241–3254, doi:10.1016/0016-7037(87)90132-3.
Dasch, J., Ryder, G., Reese, Y., Wiesmann, H., Shih, C.-Y., and Nyquist, L., 1998, Old age of formation for a distinct variety of A17 high-titanium mare basalts: Houston, Texas, Lunar and Planetary Institute, Lunar and Planetary Science Conference XXIX, CD-ROM, abstract 1750.
DeHon, R.A., 1974, Thickness of mare material in the Tranquillitatis and Nec-taris basins: Houston, Texas, Lunar and Planetary Institute, Lunar and Planetary Science Conference V, p. 53–59.
DeHon, R.A., 1979, Thickness of the western mare basalts: Houston, Texas, Lunar and Planetary Institute, Lunar and Planetary Science Conference X, p. 2935–2955.
DeHon, R.A., and Waskom, J.D., 1976, Geologic structure of the eastern mare basins: Houston, Texas, Lunar and Planetary Institute, Lunar and Plan-etary Science Conference VII, p. 2729–2746.
Deutsch, A., and Stöffl er, D., 1987, Rb-Sr-analyses of Apollo 16 melt rocks and a new age estimate for the Imbrium basin: Lunar basin chronology and the early heavy bombardment of the moon: Geochimica et Cosmochimica Acta, v. 51, p. 1951–1964, doi:10.1016/0016-7037(87)90184-0.
Dunkin, S.K., Heather, D.J., Dandy, C.L., Spudis, P.D., and Bussey, D.B.J., 2000, Stratigraphy of the mare fl ows in southern Oceanus Procellarum: Houston, Texas, Lunar and Planetary Institute, Lunar and Planetary Sci-ence Conference XXXI, CD-ROM, abstract 1357.
Eberhardt, P., Geiss, J., Grögler, N., and Stettler, A., 1973, How old is the crater Copernicus?: The Moon, v. 8, p. 104–114, doi:10.1007/BF00562752.
Eggleton, R.E., 1965, Geologic Map of the Riphaeus Mountains Region of the Moon (LAC-76): U.S. Geological Survey I-458, scale 1:1,000,000.
Engel, S., 1986, Genese der lunaren hellen Ebenen: Impakt oder Vulkanismus? [Diploma thesis]: München, Germany, Universität München, 75 p.
Fagan, T.J., Taylor, G.J., Keil, K., Bunch, T.E., Wittke, J.H., Korotev, R.L., Jolliff, B.L., Gillis, J.J., Haskin, L.A., Jarosewich, E., Clayton, R.N., Mayeda, T.K., Fernandes, V.A., Burgess, R., Turner, G., Eugster, O., and Lorenzetti, S.S., 2002, Northwest Africa 032: Product of lunar volcanism: Meteoritics and Planetary Science, v. 37, p. 371–394.
Feldman, W.C., Barraclough, B.L., Maurice, S., Elphic, R.C., Lawrence, D.J., Thomsen, D.R., and Binder, A.B., 1998, Major compositional units of the Moon: Lunar Prospector thermal and fast neutrons: Science, v. 281, p. 1489, doi:10.1126/science.281.5382.1489.
Feldman, W.C., Lawrence, D.J., Elphic, R.C., Vaniman, D.T., Thomsen, D.R., Bar-raclough, B.L., Maurice, S., and Binder, A.B., 2000, Chemical information
on August 28, 2011specialpapers.gsapubs.orgDownloaded from
48 Hiesinger et al.
content of lunar thermal and epithermal neutrons: Journal of Geophysical Research, v. 105, p. 20,347–20,363, doi:10.1029/1999JE001183.
Feldman, W.C., Gasnault, O., Maurice, S., Lawrence, D.J., Elphic, R.C., Lucey, P.G., and Binder, A.B., 2002, Global distribution of lunar composition: New results from Lunar Prospector: Journal of Geophysical Research, v. 107, doi:10.1029/2001JE001506.
Fernandes, V.A., and Burgess, R., 2006, Lunar volcanism during the Eratosthenian II: NWA479, in 69th Annual Meteoritical Society Meeting Abstracts, 6–11 August 2006, Zurich, Switzerland: Meteoritical Society, abstract 5312.
Fernandes, V.A., Burgess, R., and Turner, G., 2003, 40Ar-39Ar chronology of lunar meteorites Northwest Africa 032 and 773: Meteoritics & Planetary Science, v. 38, p. 555–564, doi:10.1111/j.1945-5100.2003.tb00026.x.
Gaddis, L.R., Sucharski, T., Becker, T., and Gitlin, A., 2001, Cartographic pro-cessing of digital lunar orbiter data: Houston, Texas, Lunar and Planetary Institute, Lunar and Planetary Science Conference XXXII, CD-ROM, abstract 1892.
Gaffney, A.M., Borg, L.E., Depaolo, D.J., and Irving, A.J., 2008, Age and iso-tope systematics of Northwest Africa 4898, a new type of highly-depleted mare basalt: Houston, Texas, Lunar and Planetary Institute, Lunar and Planetary Science Conference XXXIX, CD-ROM, abstract 1877.
Gifford, A.W., and El-Baz, F., 1978, Thickness of mare fl ow fronts: Houston, Texas, Lunar and Planetary Institute, Lunar and Planetary Science Con-ference IX, p. 382–384.
Gifford, A.W., and El-Baz, F., 1981, Thicknesses of lunar mare fl ow fronts: The Moon and the Planets, v. 24, p. 391–398, doi:10.1007/BF00896904.
Giguere, T.A., Taylor, G.J., Hawke, B.R., and Lucey, P.G., 2000, The titanium content of lunar mare basalts: Meteoritics & Planetary Science, v. 35, p. 193–200, doi:10.1111/j.1945-5100.2000.tb01985.x.
Greeley, R., and Gault, D.E., 1970, Precision size-frequency distributions for craters for 12 selected areas of the lunar surface: The Moon, v. 2, p. 10–77, doi:10.1007/BF00561875.
Greeley, R., Kadel, S.D., Williams, D.A., Gaddis, L.R., Head, J.W., III, Mc-Ewen, A.S., Murchie, S.L., Nagel, E., Neukum, G., Pieters, C.M., Sun-shine, J.M., Wagner, R., and Belton, M.J.S., 1993, Galileo imaging observations of lunar maria and related deposits: Journal of Geophysical Research, v. 98, p. 17,183–17,205, doi:10.1029/93JE01000.
Guggisberg, S., Eberhardt, P., Geiss, J., Grögler, N., Stettler, A., Brown, G.M., and Peckett, A., 1979, Classifi cation of the Apollo-11 mare basalts according to Ar39-Ar40 ages and petrological properties: Houston, Texas, Lunar and Planetary Institute, Lunar and Planetary Science Conference X, p. 1–39.
Hackman, R.J., 1962, Geologic Map and Sections of the Kepler Region of the Moon (LAC-57): U.S. Geological Survey I-355, scale 1:1,000,000.
Hackman, R.J., 1966, Geologic Map of the Montes Apenninus Region of the Moon (LAC-41): U.S. Geological Survey I-463, scale 1:1,000,000.
Hackwill, T., Guest, J., and Spudis, P.D., 2006, Stratigraphy and evolution of basalts in Mare Humorum and southeastern Procellarum: Meteoritics & Planetary Science, v. 41, p. 479–488, doi:10.1111/j.1945-5100.2006.tb00475.x.
Hartmann, W.K., 1966, Early lunar cratering: Icarus, v. 5, p. 406–418, doi:10.1016/0019-1035(66)90054-6.
Hartmann, W.K., 1972, Interplanet variations in scale of crater morphol-ogy—Earth, Mars, Moon: Icarus, v. 17, p. 707–713, doi:10.1016/0019-1035(72)90036-X.
Hartmann, W.K., 2005, Martian cratering 8: Isochron refi nement and the chronology of Mars: Icarus, v. 174, p. 294–320, doi:10.1016/j.icarus.2004.11.023.
Hartmann, W.K., 2007a, Martian cratering 9: Toward resolution of the con-troversy about small craters: Icarus, v. 189, p. 274–278, doi:10.1016/j.icarus.2007.02.011.
Hartmann, W.K., 2007b, Martian chronology: Toward resolution of the 2005 “controversy” and evidence for obliquity-driven resurfacing processes, in 7th International Conference on Mars: Houston, Texas, Lunar and Planetary Institute, Lunar and Planetary Institute Contribution 1320, abstract 3318.
Hartmann, W.K., and Neukum, G., 2001, Cratering chronology and the evolution of Mars: Space Science Reviews, v. 96, p. 165–194, doi:10.1023/A:1011945222010.
Hartmann, W.K., Neukum, G., and Werner, S.C., 2008, Confi rmation and utili-zation of the “production function” size-frequency distributions of Mar-tian impact craters: Geophysical Research Letters, v. 35, doi:10.1029/2007GL031557.
Haruyama, J., Othake, M., Matsunaga, T., Honda, C., Yokota, Y., Abe, M., Ogawa, Y., Miyamoto, H., Iwasaki, A., Pieters, C.M., Asada, N., Demura, H., Hirata, N., Terazono, J., Sasaki, S., Saiki, K., Yamaji, A., Torii, M., and Josset, J.-L., 2009, Long-lived volcanism on the lunar farside revealed by SELENE Terrain Camera: Science, v. 323, p. 905–908, doi:10.1126/science.1163382.
Haskin, L.A., Gillis, J.J., Korotev, R.L., and Jolliff, B.L., 2000, The materials of the lunar Procellarum KREEP terrane: A synthesis of data from geomor-phological mapping, remote sensing, and sample analyses: Journal of Geo-physical Research, v. 105, p. 20,403–20,415, doi:10.1029/1999JE001128.
Hawke, B.R., and Bell, J.F., 1981, Remote sensing studies of lunar dark-halo impact craters: Preliminary results and implications for early volcanism: Houston, Texas, Lunar and Planetary Institute, Lunar and Planetary Sci-ence Conference XII, p. 665–678.
Hawke, B.R., and Head, J.W., 1978, Lunar KREEP volcanism—Geologic evidence for history and mode of emplacement: Houston, Texas, Lunar and Planetary Institute, Lunar and Planetary Science Conference IX, p. 3285–3309.
Hawke, B.R., Blewett, D.T., Lucey, P.G., Smith, G.A., Bell, J.F., III, Campbell, B.A., and Robinson, M.S., 2004, The origin of lunar crater rays: Icarus, v. 170, p. 1–16, doi:10.1016/j.icarus.2004.02.013.
Head, J.W., III, 1974, Lunar dark-mantle deposits: Possible clues to the distri-bution of early mare deposits: Houston, Texas, Lunar and Planetary Insti-tute, Lunar and Planetary Science Conference V, p. 207–222.
Head, J.W., III, 1976, Lunar volcanism in space and time: Reviews of Geophys-ics, v. 14, p. 265–300, doi:10.1029/RG014i002p00265.
Head, J.W., III, 1982, Lava fl ooding of ancient planetary crusts: Geometry, thickness, and volumes of fl ooded lunar impact basins: The Moon and the Planets, v. 26, p. 61–88, doi:10.1007/BF00941369.
Head, J.W., III, and Wilson, L., 1992, Lunar mare volcanism: Stratigraphy, erup-tion conditions, and the evolution of secondary crusts: Geochimica et Cos-mochimica Acta, v. 56, p. 2155–2175, doi:10.1016/0016-7037(92)90183-J.
Head, J.W., III, Murchie, S., Mustard, J.F., Pieters, C.M., Neukum, G., Mc-Ewen, A., Greeley, R., Nagel, E., and Belton, M.J.S., 1993, Lunar impact basins: New data for the western limb and far side (Orientale and South Pole–Aitken basins) from the fi rst Galileo fl yby: Journal of Geophysical Research, v. 98, no. E9, p. 17,149–17,181, doi:10.1029/93JE01278.
Heather, D.J., and Dunkin, S.K., 2002, A stratigraphic study of southern Ocea-nus Procellarum using Clementine multispectral data: Planetary and Space Science, v. 50, p. 1299–1309, doi:10.1016/S0032-0633(02)00124-1.
Heiken, G.H., Vaniman, D.T., and French, B.M., eds., 1991, Lunar Source Book—A User’s Guide to the Moon: Cambridge, UK, Cambridge Uni-versity Press, 736 p.
Hiesinger, H., Jaumann, R., Neukum, G., and Head, J.W., III, 2000, Ages of mare basalts on the lunar nearside: Journal of Geophysical Research, v. 105, p. 29,239–29,275, doi:10.1029/2000JE001244.
Hiesinger, H., Head, J.W., III, Wolf, U., and Neukum, G., 2001, New age determinations of lunar mare basalts in Mare Cognitum, Mare Nubium, Oceanus Procellarum, and other nearside mare: Houston, Texas, Lunar and Planetary Institute, Lunar and Planetary Science Conference XXXII, CD-ROM, abstract 1815.
Hiesinger, H., Head, J.W., III, Wolf, U., Jaumann, R., and Neukum, G., 2002, Lunar mare basalt fl ow thicknesses determined from crater size-frequency distributions: Geophysical Research Letters, v. 29, doi:10.1029/2002GL014847.
Hiesinger, H., Head, J.W., III, Wolf, U., Jaumann, R., and Neukum, G., 2003, Ages and stratigraphy of mare basalts in Oceanus Procellarum, Mare Nubium, Mare Cognitum, and Mare Insularum: Journal of Geophysical Research, v. 108, doi:10.1029/2002JE001985.
Hiesinger, H., Head, J.W., III, Wolf, U., Jaumann, R., and Neukum, G., 2006, New ages for basalts in Mare Fecunditatis based on crater size-frequency measurements: Houston, Texas, Lunar and Planetary Institute, Lunar and Planetary Science Conference IX, p. 382–384.
Hiesinger, H., Head, J.W., III, Wolf, U., Jaumann, R., and Neukum, G., 2010, Ages and stratigraphy of lunar mare basalts in Mare Frigo-ris and other nearside maria based on crater size-frequency distribu-tion measurements: Journal of Geophysical Research, v. 115, E03003, doi:10.1029/2009JE003380.
Hikida, H., and Wieczorek, M.A., 2007, Crustal thickness of the Moon: New constraints from gravity inversions using polyhedral shape models: Ica-rus, v. 192, p. 150–166, doi:10.1016/j.icarus.2007.06.015.
on August 28, 2011specialpapers.gsapubs.orgDownloaded from
Ages and stratigraphy of lunar mare basalts 49
Holt, H.E., 1974, Geologic Map of the Purbach Quadrangle of the Moon (LAC-95): U.S. Geological Survey I-822, scale 1:1,000,000.
Hörz, F., 1978, How thick are lunar mare basalts?: Houston, Texas, Lunar and Planetary Institute, Lunar and Planetary Science Conference IV, p. 3311–3331.
Howard, K.A., and Masursky, H., 1968, Geologic Map of the Ptolemaeus Quadrangle of the Moon (LAC-77): U.S. Geological Survey I-566, scale 1:1,000,000.
Howard, K.A., Head, J.W., III, and Swann, G.A., 1972, Geology of Hadley Rille: Houston, Texas, Lunar and Planetary Institute, Lunar and Planetary Science Conference III, p. 1–14.
Husain, L., 1974, 40Ar-39Ar chronology and cosmic ray exposure ages of the Apollo 15 samples: Journal of Geophysical Research, v. 79, no. 17, p. 2588–2606, doi:10.1029/JB079i017p02588.
Ishihara, Y., Goossens, S., Matsumoto, K., Noda, H., Araki, H., Namiki, N., Hanada, H., Iwata, T., Tazawa, S., and Sasaki, S., 2009, Crustal thick-ness of the Moon: Implications for farside basin structures: Geophysical Research Letters, v. 36, doi:10.1029/2009GL039708.
Ivanov, B.A., 2001, Moon cratering rate ratio estimates: Space Science Reviews, v. 96, p. 87–104, doi:10.1023/A:1011941121102.
Ivanov, B.A., Neukum, G., and Wagner, R., 2001, Size-frequency distributions of planetary impact craters and asteroids, in Rickmann, H., and Marov, M., eds., Collisional Processes in the Solar System: Dordrecht, the Neth-erlands, ASSL Kluwer Academic Publishers, 357 p.
James, O.B., 1981, Petrologic and age relations of the Apollo 16 rocks: Implica-tions for subsurface geology and the age of the Nectaris Basin: Houston, Texas, Lunar and Planetary Institute, Lunar and Planetary Science Con-ference XII, p. 209–233.
Jessberger, E.K., Huneke, J.C., Podosek, F.A., and Wasserburg, G.J., 1974, High resolution argon analysis of neutron irradiated Apollo rocks and separated minerals: Houston, Texas, Lunar and Planetary Institute, Lunar and Planetary Science Conference V, p. 1419–1449.
Jessberger, E.K., Kirsten, T., and Staudacher, T., 1977, One rock and many ages—Further K-Ar data on consortium breccia 73215: Houston, Texas, Lunar and Planetary Institute, Lunar and Planetary Science Conference VIII, p. 2567–2580.
Johnson, T.V., Pieters, C.M., and McCord, T.B., 1973, Mare Humorum: An integrated study of spectral refl ectivity: Icarus, v. 19, p. 224–229, doi:10.1016/0019-1035(73)90125-5.
Johnson, T.V., Mosher, J.A., and Matson, D.L., 1977a, Lunar spectral units: A northern hemispheric mosaic: Houston, Texas, Lunar and Planetary Insti-tute, Lunar and Planetary Science Conference VIII, p. 1013–1028.
Johnson, T.V., Saunders, R.S., Matson, D.L., and Mosher, J.A., 1977b, A TiO2
abundance map for the northern maria: Houston, Texas, Lunar and Plane-tary Institute, Lunar and Planetary Science Conference VIII, p. 1029–1036.
Jolliff, B.L., Gillis, J.J., Haskin, L.A., Korotev, R.L., and Wieczorek, M.A., 2000, Major lunar crustal terranes: Surface expressions and crust- mantle origins: Journal of Geophysical Research, v. 105, p. 4197–4216, doi:10.1029/1999JE001103.
Karlstrom, T.N.V., 1974, Geologic Map of the Schickard Quadrangle of the Moon (LAC-110): U.S. Geological Survey I-823, scale 1:1,000,000.
Köhler, U., Head, J.W., Neukum, G., and Wolf, U., 1999, North-polar lunar light plains: Ages and compositional observations, in Workshop on New Views of the Moon II: Understanding the Moon through the Integra-tion of Diverse Datasets, 22–24 September 1999, Flagstaff, Airzona, abstract 8050.
Köhler, U., Head, J.W., III, Neukum, G., and Wolf, U., 2000, Lunar light plains in the northern latitudes: Latest results on age distributions, surface com-position, nature, and possible origin: Houston, Texas, Lunar and Plane-tary Institute, Lunar and Planetary Science Conference XXXI, CD-ROM, abstract 1822.
König, B., 1977, Investigations of Primary and Secondary Impact Structures on the Moon and Laboratory Experiments to Study the Ejecta of Second-ary Particles [Ph.D. dissertation]: Heidelberg, Germany, Ruprecht-Karls University, 88 p. (in German).
Lawrence, D.J., Feldman, W.C., Barraclough, B.L., Binder, A.B., Elphic, R.C., Maurice, S., and Thomsen, D.R., 1998, Global elemental maps of the Moon: The Lunar Prospector gamma-ray spectrometer: Science, v. 281, p. 1484, doi:10.1126/science.281.5382.1484.
Lawrence, D.J., Feldman, W.C., Barraclough, B.L., Binder, A.B., Elphic, R.C., Maurice, S., Miller, M.C., and Prettyman, T.H., 1999, High resolution mea-
surements of absolute thorium abundances on the lunar surface: Geophys-ical Research Letters, v. 26, p. 2681–2684, doi:10.1029/1999GL008361.
Lawrence, D.J., Feldman, W.C., Barraclough, B.L., Binder, A.B., Elphic, R.C., Maurice, S., Miller, M.C., and Prettyman, T.H., 2000, Thorium abun-dances on the lunar surface: Journal of Geophysical Research, v. 105, p. 20,307–20,331, doi:10.1029/1999JE001177.
Lloyd, D.D., and Head, J.W., III, 1972, Lunar surface properties as determined from earthshine and near-terminator photography: Houston, Texas, Lunar and Planetary Institute, Lunar and Planetary Science Conference III, p. 3127–3142.
Lucchitta, B.K., 1972, Geologic Map of the Aristoteles Quadrangle of the Moon (LAC-13): U.S. Geological Survey I-725, scale 1:1,000,000.
Lucchitta, B.K., 1978, Geologic Map of the North Side of the Moon: U.S. Geo-logical Survey I-1062, scale 1:5,000,000.
Malin, M.C., Edgett, K., Posiolova, L., McColley, S., and Noe Dobrea, E., 2006, Present-day impact cratering rate and contemporary gully activity on Mars: Science, v. 314, p. 1573–1577, doi:10.1126/science.1135156.
Marshall, C.H., 1963, Geologic Map and Sections of the Letronne Region of the Moon (LAC-75): U.S. Geological Survey I-385, scale 1:1,000,000.
Maurer, P., Eberhardt, P., Geiss, J., Grögler, N., and Stettler, A., 1978, Pre-Imbrium craters and basins: Ages, compositions and excavation depths of Apollo 16 breccias: Geochimica et Cosmochimica Acta, v. 42, p. 1687–1720, doi:10.1016/0016-7037(78)90257-0.
McCauley, J.F., 1967, Geologic Map of the Hevelius Region of the Moon (LAC-56): U.S. Geological Survey I-491, scale 1:1,000,000.
McCauley, J.F., 1973, Geologic Map of the Grimaldi Quadrangle of the Moon (LAC-74): U.S. Geological Survey I-740, scale 1:1,000,000.
McCord, T.B., Pieters, C.M., and Feierberg, M.A., 1976, Multi-spectral map-ping of the lunar surface using ground-based telescopes: Icarus, v. 29, p. 1–34, doi:10.1016/0019-1035(76)90099-3.
McEwen, A.S., 2003, Secondary cratering on Mars: Implications for age dating and surface properties, in 6th International Conference on Mars: Pasa-dena, California, Lunar and Planetary Institute, abstract 3268.
McEwen, A.S., and Bierhaus, E.B., 2006, The importance of secondary cra-tering to age constraints on planetary surfaces: Annual Review of Earth and Planetary Sciences, v. 34, p. 535–567, doi:10.1146/annurev.earth.34.031405.125018.
McEwen, A.S., Preblich, B.S., Turtle, E.P., Artemieva, N.A., Golombek, M.P., Hurst, M., Kirk, R.L., Burr, D.M., and Christensen, P.R., 2005, The rayed crater Zunil and interpretations of small impact craters on Mars: Icarus, v. 176, p. 351–381, doi:10.1016/j.icarus.2005.02.009.
Melosh, H.J., 1989, Impact Cratering: A Geologic Process: Oxford Mono-graphs on Geology and Geophysics, no. 11, 245 p.
M’Gonigle, J.W., and Schleicher, D., 1972, Geologic Map of the Plato Quad-rangle of the Moon (LAC-12): U.S. Geological Survey I-701, scale 1:1,000,000.
Milton, D.J., 1968, Geologic Map of the Theophilus Quadrangle of the Moon (LAC-78): U.S. Geological Survey I-546, scale 1:1,000,000.
Moore, H.J., 1965, Geologic Map of the Aristarchus Region of the Moon (LAC-39): U.S. Geological Survey I-465, scale 1:1,000,000.
Moore, H.J., 1967, Geologic Map of the Seleucus Quadrangle of the Moon (LAC-38): U.S. Geological Survey I-527, scale 1:1,000,000.
Morota, T., Haruyama, J., Ohtake, M., Matsunaga, T., Yokota, Y., Honda, C., Torii, M., Ogawa, Y., Abe, M., and the LISM Working Group, 2008, Age determination of mare basalts surrounding the crater Lichtenberg: Pre-liminary results using SELENE(Kaguya)/Terrain Camera data: Houston, Texas, Lunar and Planetary Institute, Lunar and Planetary Science Con-ference XXXIX, CD-ROM, abstract 1513.
Morris, E.C., and Wilhelms, D.E., 1967, Geologic Map of the Julius Caesar Quadrangle of the Moon (LAC-60): U.S. Geological Survey I-510, scale 1:1,000,000.
Mustard, J.F., and Head, J.W., 1996, Buried stratigraphic relationships along the southwestern shores of Oceanus Procellarum: Implications for early lunar volcanism: Journal of Geophysical Research, v. 101, p. 18,913–18,925, doi:10.1029/96JE01826.
Neukum, G., 1971, Untersuchungen über Einschlagskrater auf dem Mond [Dis-sertation]: Heidelberg, Germany, Ruprecht-Karls Universität, 74 p.
Neukum, G., 1977, Lunar cratering: Philosophical Transactions of the Royal Society of London, ser. A, v. 285, p. 267–272.
Neukum, G., 1983, Meteoritenbombardement und Datierung planetarer Oberfl ächen, Habilitationsschrift: München, Germany, Universität München, 186 p.
on August 28, 2011specialpapers.gsapubs.orgDownloaded from
50 Hiesinger et al.
Neukum, G., and Horn, P., 1976, Effects of lava fl ows on lunar crater popula-tions: The Moon, v. 15, p. 205–222, doi:10.1007/BF00562238.
Neukum, G., and Ivanov, B.A., 1994, Crater size distributions and impact prob-abilities on Earth from lunar, terrestrial-planet, and asteroid cratering data, in Gehrels, T., ed., Hazards Due to Comets and Asteroids: Tucson, University of Arizona Press, p. 359–416.
Neukum, G., and Wise, D.U., 1976, A standard crater curve and possible new time scale: Science, v. 194, p. 1381–1387, doi:10.1126/science.194.4272.1381.
Neukum, G., Koenig, B., Fechtig, H., and Storzer, D., 1975a, Cratering in the Earth-Moon system: Consequences for age determination by crater count-ing: Houston, Texas, Lunar and Planetary Institute, Lunar and Planetary Science Conference VI, p. 2597–2620.
Neukum, G., Koenig, B., and Arkani-Hamed, J., 1975b, A study of lunar impact crater size-distributions: The Moon, v. 12, p. 201–229, doi:10.1007/BF00577878.
Neukum, G., Ivanov, B.A., and Hartmann, W.K., 2001, Cratering records in the inner solar system in relation to the lunar reference system: Space Science Reviews, v. 96, p. 55–86, doi:10.1023/A:1011989004263.
Neukum, G., Werner, S.C., and Ivanov, B.A., 2006, The characteristics of the impact crater production size-frequency distributions on the solar system planetary bodies, their relationships to asteroidal and cometary impacts, and the question of secondary-cratering contributions, in Workshop on Surface Ages and Histories: Issues in Planetary Chronology: Houston, Texas, Lunar and Planetary Institute, Lunar and Planetary Institute Con-tribution 1320, p. 38–39.
Nunes, P.D., Tatsumoto, M., and Unruh, D.M., 1974, U-Th-Pb systematics of some Apollo 17 lunar samples and implications for a lunar basin excava-tion chronology: Houston, Texas, Lunar and Planetary Institute, Lunar and Planetary Science Conference V, p. 1487–1514.
Nyquist, L.E., and Shih, C.-Y., 1992, The isotopic record of lunar vol-canism: Geochimica et Cosmochimica Acta, v. 56, p. 2213–2234, doi:10.1016/0016-7037(92)90185-L.
Nyquist, L.E., Bansal, B.M., Wiesmann, H., and Jahn, B.-M., 1974, Taurus-Littrow chronology: Some constraints on early lunar crustal development: Houston, Texas, Lunar and Planetary Institute, Lunar and Planetary Sci-ence Conference V, p. 1515–1539.
Nyquist, L.E., Bogard, D.D., and Shih, C.-Y., 2001, Radiometric chronology of the Moon and Mars, in Bleeker, J.A.M., Geiss, J., and Huber, M.C.E., eds., The Century of Space Science: Dordrecht, Netherlands, Kluwer Academic Publishers, p. 1325–1376.
Oberbeck, V.R., and Morrison, R.H., 1973, On the formation of the lunar her-ringbone pattern: Houston, Texas, Lunar and Planetary Institute, Lunar and Planetary Science Conference IV, p. 107–123.
Page, N.J., 1970, Geologic Map of the Cassini Quadrangle of the Moon (LAC-25): U.S. Geological Survey I-666, scale 1:1,000,000.
Papanastassiou, D.A., and Wasserburg, G.J., 1971, Lunar chronology and evolu-tion from Rb-Sr studies of Apollo 11 and 12 samples: Earth and Planetary Science Letters, v. 11, p. 37–62, doi:10.1016/0012-821X(71)90139-7.
Parmentier, E.M., Zhong, S., and Zuber, M.T., 2000, On the relationship between chemical differentiation and the origin of lunar asymmetries: Houston, Texas, Lunar and Planetary Institute, Lunar and Planetary Sci-ence Conference XXXI, CD-ROM, abstract 1614.
Pieters, C.M., 1978, Mare basalt types on the front side of the Moon: Houston, Texas, Lunar and Planetary Institute, Lunar and Planetary Science Con-ference IX, p. 2825–2849.
Pieters, C.M., 1993, Compositional diversity and stratigraphy of the lunar crust derived from refl ectance spectroscopy, in Pieters, C.M., and Englert, P.A.J., eds., Topics in Remote Sensing—Remote Geochemical Analysis: Elemental and Mineralogical Composition: Cambridge, UK, Cambridge University Press, p. 309–339.
Pieters, C.M., Head, J.W., Adams, J.B., McCord, T.B., Zisk, S.H., and Whitford-Stark, J.L., 1980, Late high-titanium basalts of the western maria: Geol-ogy of the Flamsteed region of Oceanus Procellarum: Journal of Geo-physical Research, v. 85, p. 3913–3938, doi:10.1029/JB085iB07p03913.
Pieters, C.M., Staid, M.I., Fischer, E.M., Tompkins, S., and He, G., 1994, A sharper view of impact craters from Clementine data: Science, v. 266, p. 1844–1848, doi:10.1126/science.266.5192.1844.
Pike, R.J., 1980, Geometric Interpretation of Lunar Craters: U.S. Geological Survey Professional Paper 1046-C, 77 p.
Preblich, B.S., McEwen, A.S., and Studer, D.M., 2007, Mapping rays and secondary craters from the Martian crater Zunil: Journal of Geophysical Research, v. 112, doi:10.1029/2006JE002817.
Rankenburg, K., Brandon, A.D., and Norman, M.D., 2007, A Rb-Sr and Sm-Nd isotope geochronology and trace element study of lunar meteorite LaPaz Icefi eld 02205: Geochimica et Cosmochimica Acta, v. 71, p. 2120–2135, doi:10.1016/j.gca.2007.01.014.
Robinson, M.S., and Jolliff, B.L., 2002, Apollo 17 landing site: Topography, pho-tometric corrections, and heterogeneity of the surrounding highland mas-sifs: Journal of Geophysical Research, v. 107, doi:10.1029/2001JE001614.
Ryder, G., and Spudis, P.D., 1980, Volcanic rocks in the lunar highlands, in Proceedings of the Conference on the Lunar Highlands Crust: New York and Oxford, Pergamon Press, p. 353–375.
Schaber, G.G., 1969, Geologic Map of the Sinus Iridum Quadrangle of the Moon (LAC-24): U.S. Geological Survey I-602, scale 1:1,000,000.
Schaber, G.G., 1973, Lava fl ows in Mare Imbrium: Geologic evaluation from Apollo orbital photography: Houston, Texas, Lunar and Planetary Insti-tute, Lunar and Planetary Science Conference IV, p. 73–92.
Schaber, G.G., Boyce, J.M., and Moore, H.J., 1976, The scarcity of mappable fl ow lobes on the lunar maria: Unique morphology of the Imbrium fl ows: Houston, Texas, Lunar and Planetary Institute, Lunar and Planetary Sci-ence Conference VII, p. 2783–2800.
Schaefer, O.A., and Husain, L., 1974, Chronology of lunar basin formation and ages of lunar anorthositic rocks: Houston, Texas, Lunar and Planetary Institute, Lunar and Planetary Science Conference V, p. 663–665.
Schmitt, H.H., Trask, N.J., and Shoemaker, E.M., 1967, Geologic Map of the Copernicus Quadrangle of the Moon (LAC-58): U.S. Geological Survey I-515, scale 1:1,000,000.
Schultz, P.H., and Spudis, P.D., 1979, Evidence for ancient mare volcanism: Houston, Texas, Lunar and Planetary Institute, Lunar and Planetary Sci-ence Conference X, p. 2899–2918.
Schultz, P.H., and Spudis, P.D., 1983, Beginning and end of lunar mare volca-nism: Nature, v. 302, p. 233–236, doi:10.1038/302233a0.
Schultz, P.H., Greeley, R., and Gault, D.E., 1976, Degradation of small mare surface features: Houston, Texas, Lunar and Planetary Institute, Lunar and Planetary Science Conference VII, p. 985–1003.
Scott, D.H., 1972, Geologic Map of the Eudoxus Quadrangle of the Moon (LAC-26): U.S. Geological Survey I-705, scale 1:1,000,000.
Scott, D.H., and Eggleton, R.E., 1973, Geologic Map of the Rümker Quad-rangle of the Moon (LAC-23): U.S. Geological Survey I-805, scale 1:1,000,000.
Scott, D.H., and Pohn, H.A., 1972, Geologic Map of the Macrobius Quadrangle of the Moon (LAC-43): U.S. Geological Survey I-799, scale 1:1,000,000.
Scott, D.H., McCauley, J.F., and West, M.N., 1977, Geologic Map of the West Side of the Moon: U.S. Geological Survey I-1034, scale 1:5,000,000.
Shih, C.-Y., Nyquist, L.E., Reese, Y., Yamaguchi, A., and Takeda, H., 2005, Rb-Sr and Sm-Nd isotopic studies of lunar highland meteorite Y86032 and lunar ferroan anorthosites 60025 and 67075: Houston, Texas, Lunar and Planetary Institute, Lunar and Planetary Science Conference XXXVI, CD-ROM, abstract 1433.
Shoemaker, E.M., and Hackman, R., 1962, Stratigraphic basis for a lunar time scale, in Kopal, Z., and Mikhailov, Z.K., eds., The Moon: Symposium 14 of the International Astronomical Union: San Diego, California, Aca-demic Press, p. 289–300.
Silver, L.T., 1971, U-Th-Pb isotope systems in Apollo 11 and 12 regolithic materials and a possible age for the Copernican impact: Eos (Transac-tions, American Geophysical Union), v. 52, no. 7, 534 p.
Soderblom, L.A., 1972, The process of crater removal in the lunar maria, in Apollo 15 Preliminary Science Report: National Aeronautics and Space Administration Report SP-289, p. 25-87–25-91.
Soderblom, L.A., and Boyce, J.M., 1972, Relative ages of some near-side and far-side terra plains based on Apollo 16 metric photography, in Apollo 16 Preliminary Science Report: National Aeronautics and Space Administra-tion Report SP-315, p. 29-3–29-6.
Soderblom, L.A., Condit, C.D., West, R.A., Herman, B.M., and Kreidler, T.J., 1974, Martian planetwide crater distributions: Implications for geologic history and surface processes: Icarus, v. 22, p. 239–263, doi:10.1016/0019-1035(74)90175-4.
Soderblom, L.A., Arnold, J.R., Boyce, J.M., and Lin, R.P., 1977, Regional variations in the lunar maria: Age, remanent magnetism, and chemistry: Houston, Texas, Lunar and Planetary Institute, Lunar and Planetary Sci-ence Conference VIII, p. 1191–1199.
Spudis, P.D., 1978, Composition and origin of the Apennine Bench Formation: Houston, Texas, Lunar and Planetary Institute, Lunar and Planetary Sci-ence Conference IX, p. 1086–1088.
on August 28, 2011specialpapers.gsapubs.orgDownloaded from
Ages and stratigraphy of lunar mare basalts 51
Spudis, P.D., 1993, The Geology of Multi-Ring Impact Basins: Cambridge Planetary Science Series, Volume 8: New York, Cambridge University Press, 263 p.
Stadermann, F.J., Heusser, E., Jessberger, E.K., Lingner, S., and Stöffl er, D., 1991, The case for a young Imbrium basin: New 40Ar-39Ar ages of Apollo 14 rocks: Geochimica et Cosmochimica Acta, v. 55, p. 2339–2349, doi:10.1016/0016-7037(91)90108-H.
Staid, M.I., Pieters, C.M., and Head, J.W., III, 1996, Mare Tranquillitatis: Basalt emplacement history and relation to lunar samples: Journal of Geophysi-cal Research, v. 101, no. E10, p. 23,213–23,228.
Stöffl er, D., and Ryder, G., 2001, Stratigraphy and isotope ages of lunar geo-logic units: Chronological standard for the inner solar system: Space Sci-ence Reviews, v. 96, p. 9–54, doi:10.1023/A:1011937020193.
Stöffl er, D., Ryder, G., Ivanov, B.A., Artemieva, N.A., Cintala, M.J., and Grieve, R.A.F., 2006, Cratering history and lunar chronology, in Jolliff, B.L., Wieczorek, M.A., Shearer, C.K., and Neal, C.R., eds., New Views of the Moon: Reviews in Mineralogy and Geochemistry, v. 60, p. 519–596.
Strom, R.G., and Neukum, G., 1988, The cratering record on Mercury and the origin of impacting objects, in Vilas, F., Chapman, C.R., and Matthews, M.S., eds., Mercury: Tucson, University of Arizona Press, p. 336–373.
Stuart-Alexander, D.E., 1978, Geologic Map of the Central Far Side of the Moon: U.S. Geological Survey I-1047, scale 1:5,000,000.
Taylor, L.A., Shervais, J.W., Hunter, R.H., Shih, C.-Y., Bansal, B.M., Wooden, J., Nyquist, L.E., and Laul, L.C., 1983, Pre–4.2 AE mare-basalt volca-nism in the lunar highlands: Earth and Planetary Science Letters, v. 66, p. 33–47, doi:10.1016/0012-821X(83)90124-3.
Taylor, S.R., 1982, Planetary Science: A Lunar Perspective: Houston, Lunar and Planetary Institute, 481 p.
Tera, F., and Wasserburg, G.J., 1974a, The evolution and history of mare basalts as inferred from U-Th-Pb systematics: Houston, Texas, Lunar and Plan-etary Institute, Lunar and Planetary Science Conference VI, p. 807–809.
Tera, F., and Wasserburg, G.J., 1974b, U-Th-Pb systematics on lunar rocks and interferences about lunar evolution and the age of the Moon: Houston, Texas, Lunar and Planetary Institute, Lunar and Planetary Science Con-ference V, p. 1571–1599.
Terada, K., Anand, M., Sokol, A., Bischoff, A., and Sano, Y., 2007, Crypto-mare magmatism 4.35 Gyr ago recorded in lunar meteorite Kalahari 009: Nature, v. 450, doi:10.1038/nature06356.
Thomson, B.J., Grosfi ls, E.B., Bussey, D.B.J., and Spudis, P.D., 2009, A new technique for estimating the thickness of mare basalts in Imbrium Basin: Geophysical Research Letters, v. 36, doi:10.1029/2009GL037600.
Titley, S.R., 1967, Geologic Map of the Mare Humorum Region of the Moon (LAC-93): U.S. Geological Survey I-495, scale 1:1,000,000.
Trask, N.J., and Titley, S.R., 1966, Geologic Map of the Pitatus Region of the Moon (LAC-94): U.S. Geological Survey I-485, scale 1:1,000,000.
Ulrich, G.E., 1969, Geologic Map of the J. Herschel Quadrangle of the Moon (LAC-11): U.S. Geological Survey I-604, scale 1:1,000,000.
Wagner, R., Head, J.W., III, Wolf, U., and Neukum, G., 2010, Lunar red spots: Stratigraphic sequence and ages of domes and plains in the Hansteen and Helmet regions on the lunar near-side: Journal of Geophysical Research, v. 115, no. E6, E06015, doi:10.1029/2009JE003359.
Walker, A.S., and El-Baz, F., 1982, Analysis of crater distributions in mare units on the lunar far side: The Moon and the Planets, v. 27, p. 91–106, doi:10.1007/BF00941559.
Werner, S.C., 2006, Major Aspects of the Chronostratigraphy and Geologic Evolutionary History of Mars [Ph.D. dissertation]: Berlin, Germany, Freie Universität, http://www.diss.fu-berlin.de/2006/33/indexe.html, 226 p.
Werner, S.C., Harris, A.W., Neukum, G., and Ivanov, B.A., 2002, The near-Earth asteroid size-frequency distribution: Note to Icarus, v. 156, p. 287–290, doi:10.1006/icar.2001.6789.
Werner, S.C., Ivanov, B.A., and Neukum, G., 2006, Mars: Secondary crater-ing—Implications for age determination: Houston, Texas, Lunar and Planetary Institute, Lunar and Planetary Science Conference XXXVII, CD-ROM, abstract 1595.
Wetherill, G.W., 1981, Nature and origin of basin-forming projectiles, in Schultz, P.H., and Merrill, R.B., eds., Multi-Ring Basins: Houston, Texas, Lunar and Planetary Institute, Lunar and Planetary Science Conference XII, p. 1–18.
Whitaker, E.A., 1972, Lunar color boundaries and their relationship to topo-graphic features: A preliminary survey: The Moon, v. 4, p. 348–355, doi:10.1007/BF00562002.
Whitford-Stark, J.L., 1979, Charting the southern seas: The evolution of the lunar Mare Australe: Houston, Texas, Lunar and Planetary Institute, Lunar and Planetary Science Conference X, p. 2975–2994.
Whitford-Stark, J.L., 1990, The volcanotectonic evolution of Mare Frigoris: Houston, Texas, Lunar and Planetary Institute, Lunar and Planetary Sci-ence Conference XX, p. 175–185.
Whitford-Stark, J.L., and Head, J.W., III, 1980, Stratigraphy of Oceanus Pro-cellarum basalts: Sources and styles of emplacement: Journal of Geo-physical Research, v. 85, p. 6579–6609, doi:10.1029/JB085iB11p06579.
Wieczorek, M.A., and Phillips, R.J., 1998, Potential anomalies on a sphere: Applications to the thickness of the lunar crust: Journal of Geophysical Research, v. 103, p. 1715–1724, doi:10.1029/97JE03136.
Wieczorek, M.A., and Phillips, R.J., 2000, The “Procellarum KREEP terrane”: Implications for mare volcanism and lunar evolution: Journal of Geo-physical Research, v. 105, p. 20,417–20,430, doi:10.1029/1999JE001092.
Wieczorek, M.A., Cahill, J.T.S., Lucey, P.G., and Shearer, C.K., 2008, The mantle of the Moon: Exposed or sampled?: Houston, Texas, Lunar and Planetary Institute, Lunar and Planetary Science Conference XXXIX, CD-ROM, abstract 1271.
Wilhelms, D.E., 1968, Geologic Map of the Mare Vaporum Quadrangle of the Moon (LAC-59): U.S. Geological Survey I-548, scale 1:1,000,000.
Wilhelms, D.E., 1970, Summary of telescopic lunar stratigraphy: U.S. Geologi-cal Survey Professional Paper 599-F, p. 235–305.
Wilhelms, D.E., 1972, Geologic Map of the Taruntius Quadrangle of the Moon (LAC-61): U.S. Geological Survey I-722, scale 1:1,000,000.
Wilhelms, D.E., 1987, The Geologic History of the Moon: U.S. Geological Survey Professional Paper 1348, 302 p.
Wilhelms, D.E., and El-Baz, F., 1977, Geologic Map of the East Side of the Moon: U.S. Geological Survey I-948, scale 1:1,000,000.
Wilhelms, D.E., and McCauley, J.F., 1971, Geologic Map of the Nearside of the Moon: U.S. Geological Survey I-703, scale 1:1,000,000.
Wilhelms, D.E., Howard, K.A., and Wilshire, H.G., 1979, Geologic Map of the South Side of the Moon: U.S. Geological Survey I-1162, scale 1:1,000,000.
Williams, D.A., Greeley, R., Neukum, G., Wagner, R., and Kadel, S.D., 1995, Multispectral studies of western limb and farside maria from Galileo Earth-Moon Encounter 1: Journal of Geophysical Research, v. 100, p. 23,291–23,299, doi:10.1029/94JE01863.
Wilshire, H.G., 1973, Geologic Map of the Byrgius Quadrangle of the Moon (LAC-92): U.S. Geological Survey I-755, scale 1:1,000,000.
Wilson, L., and Head, J.W., III, 2001, Ascent and eruption of mare basalts on the Moon: Houston, Texas, Lunar and Planetary Institute, Lunar and Plan-etary Science Conference XXXII, CD-ROM, abstract 1297.
Yingst, R.A., and Head, J.W., III, 1997, Volumes of lunar lava ponds in South Pole–Aitken and Orientale Basins: Implications for eruption conditions, transport mechanisms, and magma source regions: Journal of Geophysi-cal Research, v. 102, no. E5, p. 10,909–10,931, doi:10.1029/97JE00717.
Zhong, S., Parmentier, E.M., and Zuber, M.T., 1999, Early lunar evolution and the origin of asymmetric distribution of mare basalts: Houston, Texas, Lunar and Planetary Institute, Lunar and Planetary Science Conference XXX, CD-ROM, abstract 1789.
Ziethe, R., Seiferlein, K., and Hiesinger, H., 2009, Duration and extent of lunar volcanism: Comparison of 3D convection models to mare basalt ages: Planetary and Space Science, v. 57, p. 784–796, doi:10.1016/j.pss.2009.02.002.
Zuber, M.T., Smith, D.E., Lemoine, F.G., and Neumann, G.A., 1994, The shape and internal structure of the Moon from the Clementine mission: Science, v. 266, p. 1839–1843, doi:10.1126/science.266.5192.1839.
MANUSCRIPT ACCEPTED BY THE SOCIETY 26 AUGUST 2010
Printed in the USA
on August 28, 2011specialpapers.gsapubs.orgDownloaded from