Embed Size (px)
Citation preview
Accenture Spend Trends Report Q1 2015
2 Copyright © 2015 Accenture. All rights reserved.
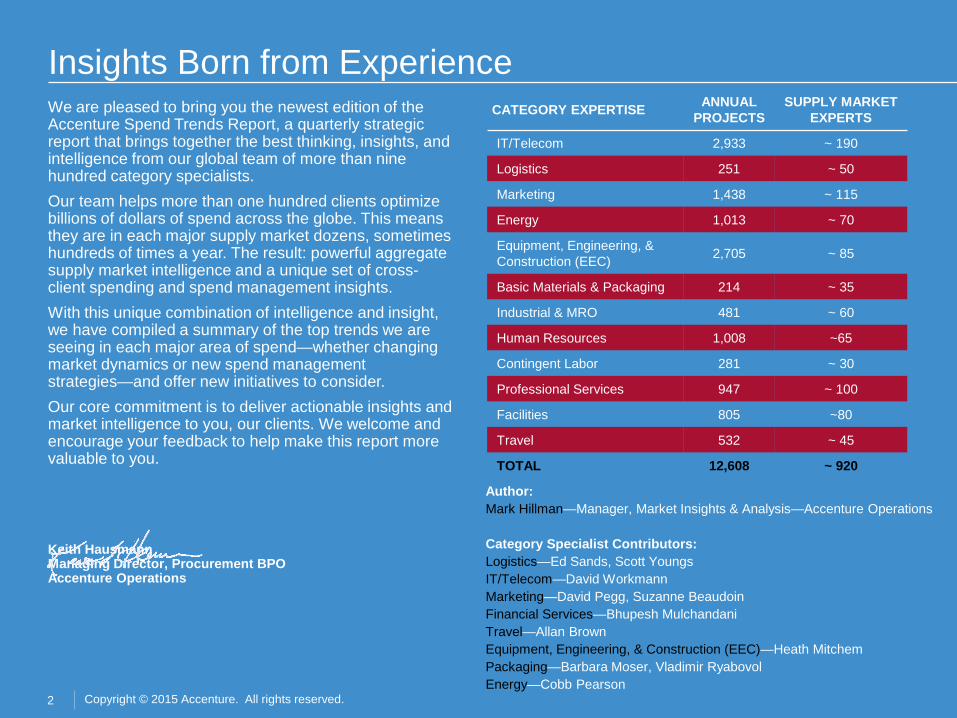
Insights Born from Experience We are pleased to bring you the newest edition of the Accenture Spend Trends Report, a quarterly strategic report that brings together the best thinking, insights, and intelligence from our global team of more than nine hundred category specialists. Our team helps more than one hundred clients optimize billions of dollars of spend across the globe. This means they are in each major supply market dozens, sometimes hundreds of times a year. The result: powerful aggregate supply market intelligence and a unique set of cross-client spending and spend management insights. With this unique combination of intelligence and insight, we have compiled a summary of the top trends we are seeing in each major area of spend—whether changing market dynamics or new spend management strategies—and offer new initiatives to consider. Our core commitment is to deliver actionable insights and market intelligence to you, our clients. We welcome and encourage your feedback to help make this report more valuable to you.
Keith Hausmann Managing Director, Procurement BPO Accenture Operations
Author: Mark Hillman—Manager, Market Insights & Analysis—Accenture Operations Category Specialist Contributors: Logistics—Ed Sands, Scott Youngs IT/Telecom—David Workmann Marketing—David Pegg, Suzanne Beaudoin Financial Services—Bhupesh Mulchandani Travel—Allan Brown Equipment, Engineering, & Construction (EEC)—Heath Mitchem Packaging—Barbara Moser, Vladimir Ryabovol Energy—Cobb Pearson
CATEGORY EXPERTISE ANNUAL PROJECTS
SUPPLY MARKET EXPERTS
IT/Telecom 2,933 ~ 190
Logistics 251 ~ 50
Marketing 1,438 ~ 115
Energy 1,013 ~ 70
Equipment, Engineering, & Construction (EEC) 2,705 ~ 85
Basic Materials & Packaging 214 ~ 35
Industrial & MRO 481 ~ 60
Human Resources 1,008 ~65
Contingent Labor 281 ~ 30
Professional Services 947 ~ 100
Facilities 805 ~80
Travel 532 ~ 45
TOTAL 12,608 ~ 920
3 Copyright © 2015 Accenture. All rights reserved.
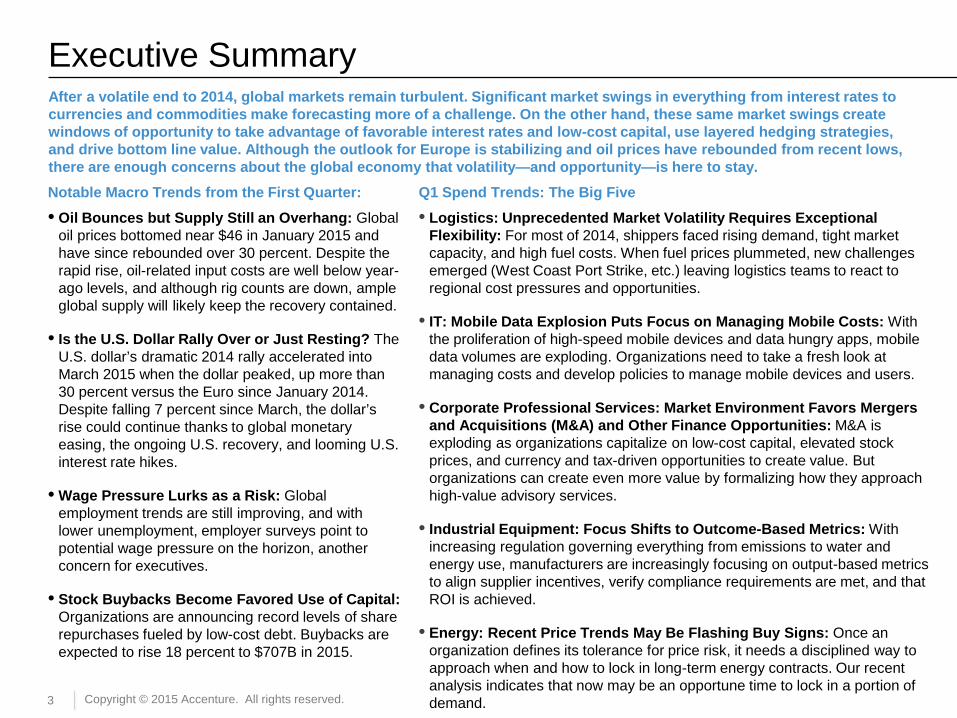
Executive Summary After a volatile end to 2014, global markets remain turbulent. Significant market swings in everything from interest rates to currencies and commodities make forecasting more of a challenge. On the other hand, these same market swings create windows of opportunity to take advantage of favorable interest rates and low-cost capital, use layered hedging strategies, and drive bottom line value. Although the outlook for Europe is stabilizing and oil prices have rebounded from recent lows, there are enough concerns about the global economy that volatility—and opportunity—is here to stay. Notable Macro Trends from the First Quarter: • Oil Bounces but Supply Still an Overhang: Global
oil prices bottomed near $46 in January 2015 and have since rebounded over 30 percent. Despite the rapid rise, oil-related input costs are well below year-ago levels, and although rig counts are down, ample global supply will likely keep the recovery contained.
• Is the U.S. Dollar Rally Over or Just Resting? The U.S. dollar’s dramatic 2014 rally accelerated into March 2015 when the dollar peaked, up more than 30 percent versus the Euro since January 2014. Despite falling 7 percent since March, the dollar’s rise could continue thanks to global monetary easing, the ongoing U.S. recovery, and looming U.S. interest rate hikes.
• Wage Pressure Lurks as a Risk: Global employment trends are still improving, and with lower unemployment, employer surveys point to potential wage pressure on the horizon, another concern for executives.
• Stock Buybacks Become Favored Use of Capital: Organizations are announcing record levels of share repurchases fueled by low-cost debt. Buybacks are expected to rise 18 percent to $707B in 2015.
Q1 Spend Trends: The Big Five • Logistics: Unprecedented Market Volatility Requires Exceptional
Flexibility: For most of 2014, shippers faced rising demand, tight market capacity, and high fuel costs. When fuel prices plummeted, new challenges emerged (West Coast Port Strike, etc.) leaving logistics teams to react to regional cost pressures and opportunities.
• IT: Mobile Data Explosion Puts Focus on Managing Mobile Costs: With the proliferation of high-speed mobile devices and data hungry apps, mobile data volumes are exploding. Organizations need to take a fresh look at managing costs and develop policies to manage mobile devices and users.
• Corporate Professional Services: Market Environment Favors Mergers and Acquisitions (M&A) and Other Finance Opportunities: M&A is exploding as organizations capitalize on low-cost capital, elevated stock prices, and currency and tax-driven opportunities to create value. But organizations can create even more value by formalizing how they approach high-value advisory services.
• Industrial Equipment: Focus Shifts to Outcome-Based Metrics: With increasing regulation governing everything from emissions to water and energy use, manufacturers are increasingly focusing on output-based metrics to align supplier incentives, verify compliance requirements are met, and that ROI is achieved.
• Energy: Recent Price Trends May Be Flashing Buy Signs: Once an organization defines its tolerance for price risk, it needs a disciplined way to approach when and how to lock in long-term energy contracts. Our recent analysis indicates that now may be an opportune time to lock in a portion of demand.
4 Copyright © 2015 Accenture. All rights reserved.
Macroeconomic Backdrop
Source: International Monetary Fund World Economic Outlook
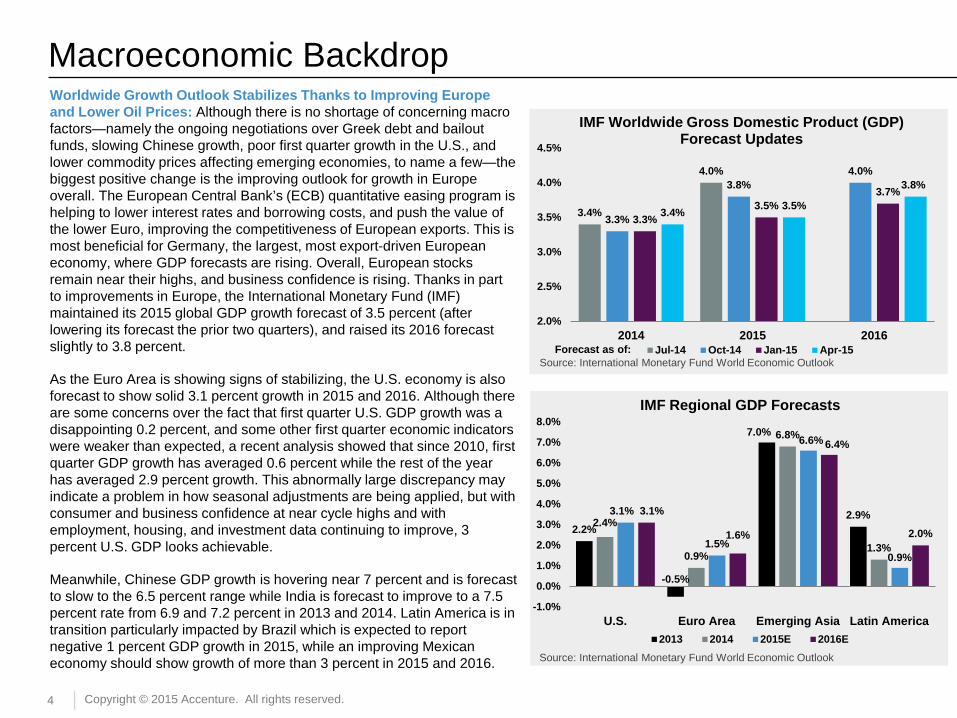
Worldwide Growth Outlook Stabilizes Thanks to Improving Europe and Lower Oil Prices: Although there is no shortage of concerning macro factors—namely the ongoing negotiations over Greek debt and bailout funds, slowing Chinese growth, poor first quarter growth in the U.S., and lower commodity prices affecting emerging economies, to name a few—the biggest positive change is the improving outlook for growth in Europe overall. The European Central Bank’s (ECB) quantitative easing program is helping to lower interest rates and borrowing costs, and push the value of the lower Euro, improving the competitiveness of European exports. This is most beneficial for Germany, the largest, most export-driven European economy, where GDP forecasts are rising. Overall, European stocks remain near their highs, and business confidence is rising. Thanks in part to improvements in Europe, the International Monetary Fund (IMF) maintained its 2015 global GDP growth forecast of 3.5 percent (after lowering its forecast the prior two quarters), and raised its 2016 forecast slightly to 3.8 percent.
As the Euro Area is showing signs of stabilizing, the U.S. economy is also forecast to show solid 3.1 percent growth in 2015 and 2016. Although there are some concerns over the fact that first quarter U.S. GDP growth was a disappointing 0.2 percent, and some other first quarter economic indicators were weaker than expected, a recent analysis showed that since 2010, first quarter GDP growth has averaged 0.6 percent while the rest of the year has averaged 2.9 percent growth. This abnormally large discrepancy may indicate a problem in how seasonal adjustments are being applied, but with consumer and business confidence at near cycle highs and with employment, housing, and investment data continuing to improve, 3 percent U.S. GDP looks achievable.
Meanwhile, Chinese GDP growth is hovering near 7 percent and is forecast to slow to the 6.5 percent range while India is forecast to improve to a 7.5 percent rate from 6.9 and 7.2 percent in 2013 and 2014. Latin America is in transition particularly impacted by Brazil which is expected to report negative 1 percent GDP growth in 2015, while an improving Mexican economy should show growth of more than 3 percent in 2015 and 2016.
Forecast as of:
2.2%
-0.5%
7.0%
2.9% 2.4%
0.9%
6.8%
1.3%
3.1%
1.5%
6.6%
0.9%
3.1%
1.6%
6.4%
2.0%
-1.0%
0.0%
1.0%
2.0%
3.0%
4.0%
5.0%
6.0%
7.0%
8.0%
U.S. Euro Area Emerging Asia Latin America
IMF Regional GDP Forecasts
2013 2014 2015E 2016E
3.4%
4.0%
3.3%
3.8% 4.0%
3.3% 3.5%
3.7%
3.4% 3.5%
3.8%
2.0%
2.5%
3.0%
3.5%
4.0%
4.5%
2014 2015 2016
IMF Worldwide Gross Domestic Product (GDP) Forecast Updates
Jul-14 Oct-14 Jan-15 Apr-15
Source: International Monetary Fund World Economic Outlook
5 Copyright © 2015 Accenture. All rights reserved.
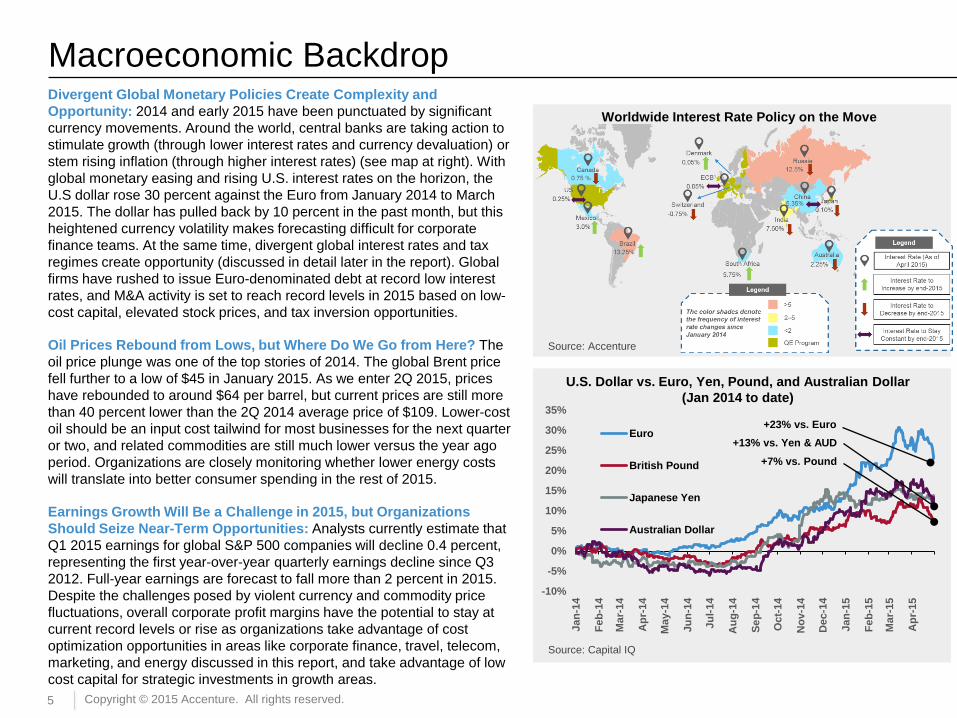
Macroeconomic Backdrop Divergent Global Monetary Policies Create Complexity and Opportunity: 2014 and early 2015 have been punctuated by significant currency movements. Around the world, central banks are taking action to stimulate growth (through lower interest rates and currency devaluation) or stem rising inflation (through higher interest rates) (see map at right). With global monetary easing and rising U.S. interest rates on the horizon, the U.S dollar rose 30 percent against the Euro from January 2014 to March 2015. The dollar has pulled back by 10 percent in the past month, but this heightened currency volatility makes forecasting difficult for corporate finance teams. At the same time, divergent global interest rates and tax regimes create opportunity (discussed in detail later in the report). Global firms have rushed to issue Euro-denominated debt at record low interest rates, and M&A activity is set to reach record levels in 2015 based on low-cost capital, elevated stock prices, and tax inversion opportunities.
Oil Prices Rebound from Lows, but Where Do We Go from Here? The oil price plunge was one of the top stories of 2014. The global Brent price fell further to a low of $45 in January 2015. As we enter 2Q 2015, prices have rebounded to around $64 per barrel, but current prices are still more than 40 percent lower than the 2Q 2014 average price of $109. Lower-cost oil should be an input cost tailwind for most businesses for the next quarter or two, and related commodities are still much lower versus the year ago period. Organizations are closely monitoring whether lower energy costs will translate into better consumer spending in the rest of 2015.
Earnings Growth Will Be a Challenge in 2015, but Organizations Should Seize Near-Term Opportunities: Analysts currently estimate that Q1 2015 earnings for global S&P 500 companies will decline 0.4 percent, representing the first year-over-year quarterly earnings decline since Q3 2012. Full-year earnings are forecast to fall more than 2 percent in 2015. Despite the challenges posed by violent currency and commodity price fluctuations, overall corporate profit margins have the potential to stay at current record levels or rise as organizations take advantage of cost optimization opportunities in areas like corporate finance, travel, telecom, marketing, and energy discussed in this report, and take advantage of low cost capital for strategic investments in growth areas.
-10%
-5%
0%
5%
10%
15%
20%
25%
30%
35%
Jan-
14
Feb-
14
Mar
-14
Apr
-14
May
-14
Jun-
14
Jul-1
4
Aug
-14
Sep-
14
Oct
-14
Nov
-14
Dec
-14
Jan-
15
Feb-
15
Mar
-15
Apr
-15
Euro
British Pound
Japanese Yen
Australian Dollar
+23% vs. Euro +13% vs. Yen & AUD
+7% vs. Pound
U.S. Dollar vs. Euro, Yen, Pound, and Australian Dollar (Jan 2014 to date)
Source: Capital IQ
Worldwide Interest Rate Policy on the Move
Source: Accenture
6 Copyright © 2015 Accenture. All rights reserved.
ENERGY
EQUIPMENT, ENGINEERING, & CONSTRUCTION
TRAVEL
FINANCIAL SERVICES
MARKETING & MEDIA
LOGISTICS
INFORMATION TECHNOLOGY
PACKAGING
Top Trends in Logistics
Diesel, Jet Fuel, and Bunker Fuel Prices Closely Track Oil Price
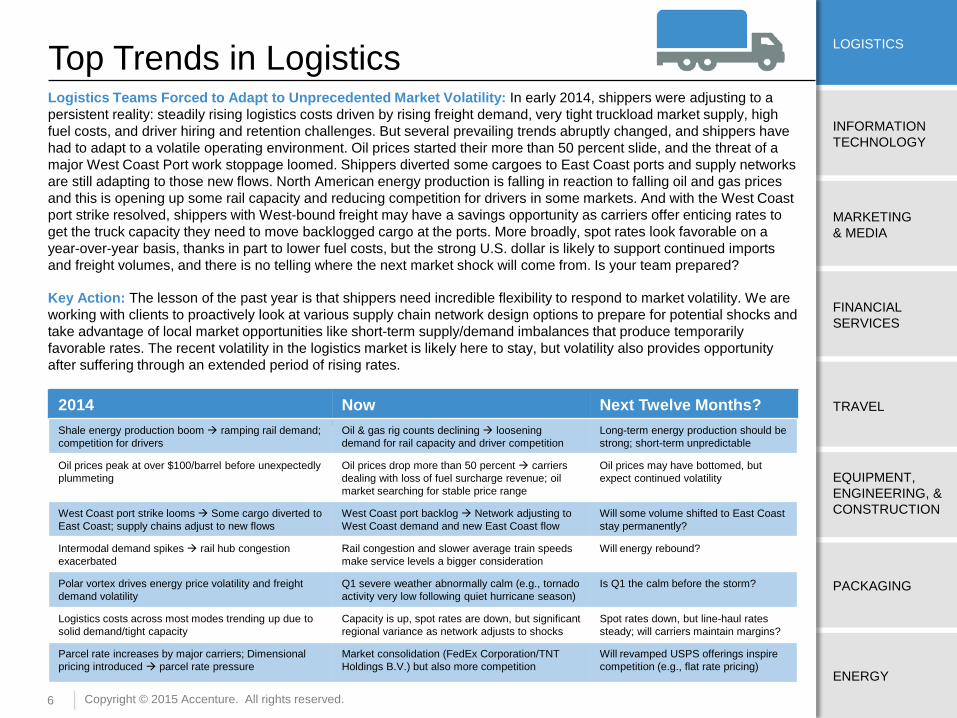
Logistics Teams Forced to Adapt to Unprecedented Market Volatility: In early 2014, shippers were adjusting to a persistent reality: steadily rising logistics costs driven by rising freight demand, very tight truckload market supply, high fuel costs, and driver hiring and retention challenges. But several prevailing trends abruptly changed, and shippers have had to adapt to a volatile operating environment. Oil prices started their more than 50 percent slide, and the threat of a major West Coast Port work stoppage loomed. Shippers diverted some cargoes to East Coast ports and supply networks are still adapting to those new flows. North American energy production is falling in reaction to falling oil and gas prices and this is opening up some rail capacity and reducing competition for drivers in some markets. And with the West Coast port strike resolved, shippers with West-bound freight may have a savings opportunity as carriers offer enticing rates to get the truck capacity they need to move backlogged cargo at the ports. More broadly, spot rates look favorable on a year-over-year basis, thanks in part to lower fuel costs, but the strong U.S. dollar is likely to support continued imports and freight volumes, and there is no telling where the next market shock will come from. Is your team prepared?
Key Action: The lesson of the past year is that shippers need incredible flexibility to respond to market volatility. We are working with clients to proactively look at various supply chain network design options to prepare for potential shocks and take advantage of local market opportunities like short-term supply/demand imbalances that produce temporarily favorable rates. The recent volatility in the logistics market is likely here to stay, but volatility also provides opportunity after suffering through an extended period of rising rates.
2014 Now Next Twelve Months? Shale energy production boom ramping rail demand; competition for drivers
Oil & gas rig counts declining loosening demand for rail capacity and driver competition
Long-term energy production should be strong; short-term unpredictable
Oil prices peak at over $100/barrel before unexpectedly plummeting
Oil prices drop more than 50 percent carriers dealing with loss of fuel surcharge revenue; oil market searching for stable price range
Oil prices may have bottomed, but expect continued volatility
West Coast port strike looms Some cargo diverted to East Coast; supply chains adjust to new flows
West Coast port backlog Network adjusting to West Coast demand and new East Coast flow
Will some volume shifted to East Coast stay permanently?
Intermodal demand spikes rail hub congestion exacerbated
Rail congestion and slower average train speeds make service levels a bigger consideration
Will energy rebound?
Polar vortex drives energy price volatility and freight demand volatility
Q1 severe weather abnormally calm (e.g., tornado activity very low following quiet hurricane season)
Is Q1 the calm before the storm?
Logistics costs across most modes trending up due to solid demand/tight capacity
Capacity is up, spot rates are down, but significant regional variance as network adjusts to shocks
Spot rates down, but line-haul rates steady; will carriers maintain margins?
Parcel rate increases by major carriers; Dimensional pricing introduced parcel rate pressure
Market consolidation (FedEx Corporation/TNT Holdings B.V.) but also more competition
Will revamped USPS offerings inspire competition (e.g., flat rate pricing)
7
ENERGY
EQUIPMENT, ENGINEERING, & CONSTRUCTION
TRAVEL
FINANCIAL SERVICES
MARKETING & MEDIA
LOGISTICS
INFORMATION TECHNOLOGY
PACKAGING
Copyright © 2015 Accenture. All rights reserved.
Top Trends in Information Technology
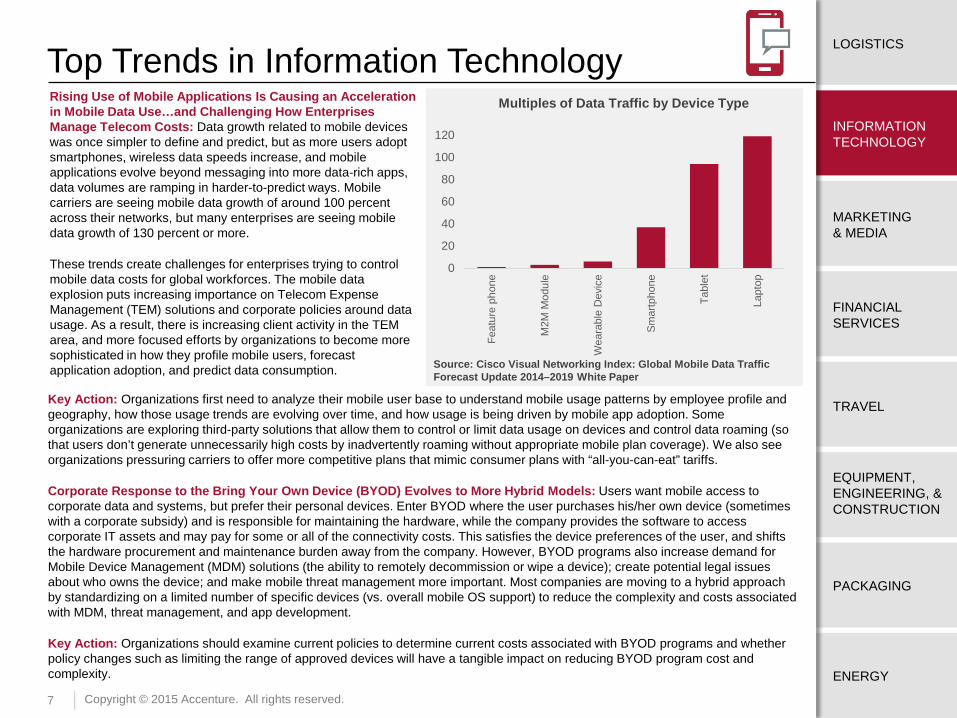
Source: Cisco Visual Networking Index: Global Mobile Data Traffic Forecast Update 2014–2019 White Paper
Multiples of Data Traffic by Device Type Rising Use of Mobile Applications Is Causing an Acceleration in Mobile Data Use…and Challenging How Enterprises Manage Telecom Costs: Data growth related to mobile devices was once simpler to define and predict, but as more users adopt smartphones, wireless data speeds increase, and mobile applications evolve beyond messaging into more data-rich apps, data volumes are ramping in harder-to-predict ways. Mobile carriers are seeing mobile data growth of around 100 percent across their networks, but many enterprises are seeing mobile data growth of 130 percent or more.
These trends create challenges for enterprises trying to control mobile data costs for global workforces. The mobile data explosion puts increasing importance on Telecom Expense Management (TEM) solutions and corporate policies around data usage. As a result, there is increasing client activity in the TEM area, and more focused efforts by organizations to become more sophisticated in how they profile mobile users, forecast application adoption, and predict data consumption.
Key Action: Organizations first need to analyze their mobile user base to understand mobile usage patterns by employee profile and geography, how those usage trends are evolving over time, and how usage is being driven by mobile app adoption. Some organizations are exploring third-party solutions that allow them to control or limit data usage on devices and control data roaming (so that users don’t generate unnecessarily high costs by inadvertently roaming without appropriate mobile plan coverage). We also see organizations pressuring carriers to offer more competitive plans that mimic consumer plans with “all-you-can-eat” tariffs.
Corporate Response to the Bring Your Own Device (BYOD) Evolves to More Hybrid Models: Users want mobile access to corporate data and systems, but prefer their personal devices. Enter BYOD where the user purchases his/her own device (sometimes with a corporate subsidy) and is responsible for maintaining the hardware, while the company provides the software to access corporate IT assets and may pay for some or all of the connectivity costs. This satisfies the device preferences of the user, and shifts the hardware procurement and maintenance burden away from the company. However, BYOD programs also increase demand for Mobile Device Management (MDM) solutions (the ability to remotely decommission or wipe a device); create potential legal issues about who owns the device; and make mobile threat management more important. Most companies are moving to a hybrid approach by standardizing on a limited number of specific devices (vs. overall mobile OS support) to reduce the complexity and costs associated with MDM, threat management, and app development.
Key Action: Organizations should examine current policies to determine current costs associated with BYOD programs and whether policy changes such as limiting the range of approved devices will have a tangible impact on reducing BYOD program cost and complexity.
0
20
40
60
80
100
120
Feat
ure
phon
e
M2M
Mod
ule
Wea
rabl
e D
evic
e
Smar
tpho
ne
Tabl
et
Lapt
op
8
ENERGY
EQUIPMENT, ENGINEERING, & CONSTRUCTION
TRAVEL
FINANCIAL SERVICES
MARKETING & MEDIA
LOGISTICS
INFORMATION TECHNOLOGY
PACKAGING
Copyright © 2015 Accenture. All rights reserved.
Top Trends in Marketing and Media
Source: IEG, LLC.
Global Sponsorship Market
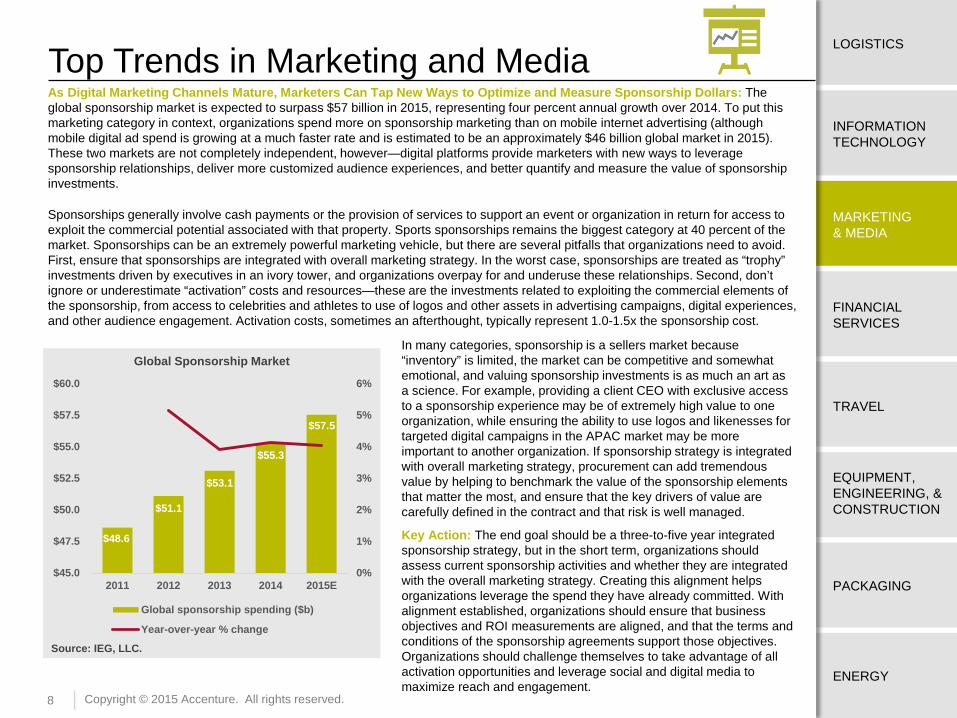
As Digital Marketing Channels Mature, Marketers Can Tap New Ways to Optimize and Measure Sponsorship Dollars: The global sponsorship market is expected to surpass $57 billion in 2015, representing four percent annual growth over 2014. To put this marketing category in context, organizations spend more on sponsorship marketing than on mobile internet advertising (although mobile digital ad spend is growing at a much faster rate and is estimated to be an approximately $46 billion global market in 2015). These two markets are not completely independent, however—digital platforms provide marketers with new ways to leverage sponsorship relationships, deliver more customized audience experiences, and better quantify and measure the value of sponsorship investments.
Sponsorships generally involve cash payments or the provision of services to support an event or organization in return for access to exploit the commercial potential associated with that property. Sports sponsorships remains the biggest category at 40 percent of the market. Sponsorships can be an extremely powerful marketing vehicle, but there are several pitfalls that organizations need to avoid. First, ensure that sponsorships are integrated with overall marketing strategy. In the worst case, sponsorships are treated as “trophy” investments driven by executives in an ivory tower, and organizations overpay for and underuse these relationships. Second, don’t ignore or underestimate “activation” costs and resources—these are the investments related to exploiting the commercial elements of the sponsorship, from access to celebrities and athletes to use of logos and other assets in advertising campaigns, digital experiences, and other audience engagement. Activation costs, sometimes an afterthought, typically represent 1.0-1.5x the sponsorship cost.
In many categories, sponsorship is a sellers market because “inventory” is limited, the market can be competitive and somewhat emotional, and valuing sponsorship investments is as much an art as a science. For example, providing a client CEO with exclusive access to a sponsorship experience may be of extremely high value to one organization, while ensuring the ability to use logos and likenesses for targeted digital campaigns in the APAC market may be more important to another organization. If sponsorship strategy is integrated with overall marketing strategy, procurement can add tremendous value by helping to benchmark the value of the sponsorship elements that matter the most, and ensure that the key drivers of value are carefully defined in the contract and that risk is well managed.
Key Action: The end goal should be a three-to-five year integrated sponsorship strategy, but in the short term, organizations should assess current sponsorship activities and whether they are integrated with the overall marketing strategy. Creating this alignment helps organizations leverage the spend they have already committed. With alignment established, organizations should ensure that business objectives and ROI measurements are aligned, and that the terms and conditions of the sponsorship agreements support those objectives. Organizations should challenge themselves to take advantage of all activation opportunities and leverage social and digital media to maximize reach and engagement.
$48.6
$51.1
$53.1
$55.3
$57.5
0%
1%
2%
3%
4%
5%
6%
$45.0
$47.5
$50.0
$52.5
$55.0
$57.5
$60.0
2011 2012 2013 2014 2015E
Global sponsorship spending ($b)
Year-over-year % change
9
ENERGY
EQUIPMENT, ENGINEERING, & CONSTRUCTION
TRAVEL
FINANCIAL SERVICES
MARKETING & MEDIA
LOGISTICS
INFORMATION TECHNOLOGY
PACKAGING
Copyright © 2015 Accenture. All rights reserved.
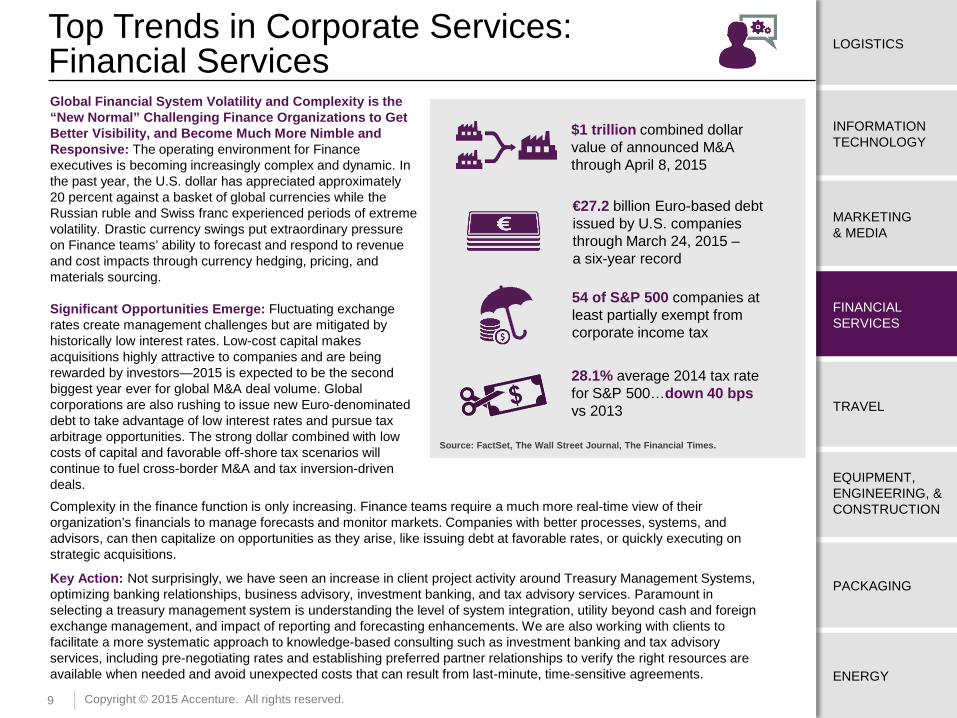
Top Trends in Corporate Services: Financial Services Global Financial System Volatility and Complexity is the “New Normal” Challenging Finance Organizations to Get Better Visibility, and Become Much More Nimble and Responsive: The operating environment for Finance executives is becoming increasingly complex and dynamic. In the past year, the U.S. dollar has appreciated approximately 20 percent against a basket of global currencies while the Russian ruble and Swiss franc experienced periods of extreme volatility. Drastic currency swings put extraordinary pressure on Finance teams’ ability to forecast and respond to revenue and cost impacts through currency hedging, pricing, and materials sourcing.
Significant Opportunities Emerge: Fluctuating exchange rates create management challenges but are mitigated by historically low interest rates. Low-cost capital makes acquisitions highly attractive to companies and are being rewarded by investors—2015 is expected to be the second biggest year ever for global M&A deal volume. Global corporations are also rushing to issue new Euro-denominated debt to take advantage of low interest rates and pursue tax arbitrage opportunities. The strong dollar combined with low costs of capital and favorable off-shore tax scenarios will continue to fuel cross-border M&A and tax inversion-driven deals. Complexity in the finance function is only increasing. Finance teams require a much more real-time view of their organization’s financials to manage forecasts and monitor markets. Companies with better processes, systems, and advisors, can then capitalize on opportunities as they arise, like issuing debt at favorable rates, or quickly executing on strategic acquisitions.
Key Action: Not surprisingly, we have seen an increase in client project activity around Treasury Management Systems, optimizing banking relationships, business advisory, investment banking, and tax advisory services. Paramount in selecting a treasury management system is understanding the level of system integration, utility beyond cash and foreign exchange management, and impact of reporting and forecasting enhancements. We are also working with clients to facilitate a more systematic approach to knowledge-based consulting such as investment banking and tax advisory services, including pre-negotiating rates and establishing preferred partner relationships to verify the right resources are available when needed and avoid unexpected costs that can result from last-minute, time-sensitive agreements.
Source: FactSet, The Wall Street Journal, The Financial Times.
28.1% average 2014 tax rate for S&P 500…down 40 bps vs 2013
54 of S&P 500 companies at least partially exempt from corporate income tax
€27.2 billion Euro-based debt issued by U.S. companies through March 24, 2015 – a six-year record
$1 trillion combined dollar value of announced M&A through April 8, 2015
10
ENERGY
EQUIPMENT, ENGINEERING, & CONSTRUCTION
TRAVEL
FINANCIAL SERVICES
MARKETING & MEDIA
LOGISTICS
INFORMATION TECHNOLOGY
PACKAGING
Copyright © 2015 Accenture. All rights reserved.
Top Trends in Travel
Source: Accenture
Travel Policy Compliance Remains One of the Most Effective Tools to Drive Travel Program Savings…So Why Can’t Organizations Do a Better Job? Most companies have travel policies and programs in place. The goal of most travel policies is to control overall travel costs by providing guidance about what business cases justify business travel (i.e., sales call, customer support visit), rules for employees about how to book travel (booking tools, travel agents, advanced purchase requirements), and drive volume to preferred providers (air carriers, hotel chains, corporate credit card) to take advantage of negotiated rates.
How a travel policy is constructed, communicated and enforced says a lot about corporate culture because of the inherent trade-offs between the conflicting goals of minimizing total travel cost vs. maximizing traveler comfort and preferences. The travel policy also needs to balance rigidity of rules, exception management and the “investment” value of travel to support business goals.
Barring significant personal inconvenience, most business travelers want to do the right thing, but all too often they
make decisions (intentional or not) that cost the business money. And these compliance and other issues are present at every level of the business. Consider this recent anecdote: a c-level executive assistant had begun systematically booking travel through internet sites in order to save the fee charged by the corporate travel agency…not realizing the cost of lost discounts and preferred rates. How much is policy non-compliance costing your business? Calculating the impact is straightforward if you have access to the right data and tools to manage compliance in near real time.
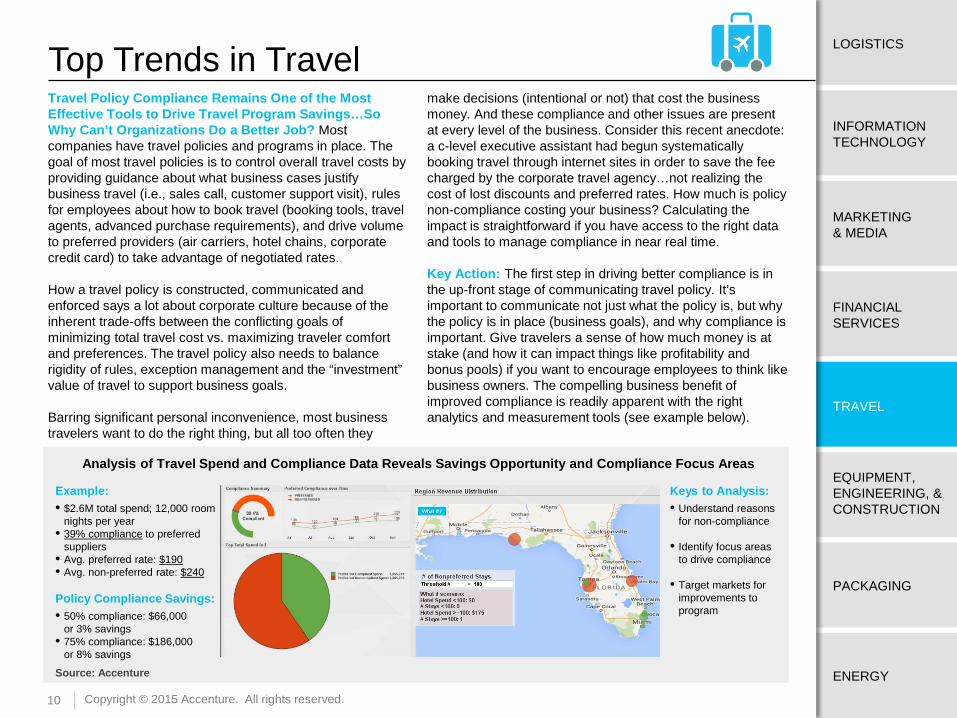
Key Action: The first step in driving better compliance is in the up-front stage of communicating travel policy. It’s important to communicate not just what the policy is, but why the policy is in place (business goals), and why compliance is important. Give travelers a sense of how much money is at stake (and how it can impact things like profitability and bonus pools) if you want to encourage employees to think like business owners. The compelling business benefit of improved compliance is readily apparent with the right analytics and measurement tools (see example below).
Example: • $2.6M total spend; 12,000 room
nights per year • 39% compliance to preferred
suppliers • Avg. preferred rate: $190 • Avg. non-preferred rate: $240 Policy Compliance Savings: • 50% compliance: $66,000
or 3% savings • 75% compliance: $186,000
or 8% savings
Keys to Analysis: • Understand reasons
for non-compliance
• Identify focus areas to drive compliance
• Target markets for improvements to program
Analysis of Travel Spend and Compliance Data Reveals Savings Opportunity and Compliance Focus Areas
11
ENERGY
EQUIPMENT, ENGINEERING, & CONSTRUCTION
TRAVEL
FINANCIAL SERVICES
MARKETING & MEDIA
LOGISTICS
INFORMATION TECHNOLOGY
PACKAGING
Copyright © 2015 Accenture. All rights reserved.
Top Trends in Equipment, Engineering, and Construction Asset Owners Need to Focus on Output-based Metrics, not Just Activity-based Metrics when Contracting for Industrial Equipment: Purchasing a large piece of industrial equipment is a high-cost investment with an expected return on investment based on a business case, but also fraught with potential risk. In the contracting process, most buyers take care to make sure that the supplier provides ample warranty coverage for the equipment asset to perform as expected. However, we notice that organizations often overlook an important element—the inclusion of a “performance guarantee”—as an explicit contract element that goes beyond the standard warranty. Buyers can no longer ignore the question of when and how to use performance guarantees especially in an environment of increasing regulations governing everything from environmental emissions to energy efficiency standards to water use.
The scope of a typical warranty is focused on whether equipment is functioning properly, but it lacks a second, and potentially more important dimension related to ROI: is the asset performing to defined performance specifications? For example, production run-rates (does the equipment meet production rates presumed in the business case?) or emissions levels (are emissions compliant with regulatory limits?). Of course, a buyer can choose to award a large equipment contract to a supplier without using a performance guarantee, but should they?
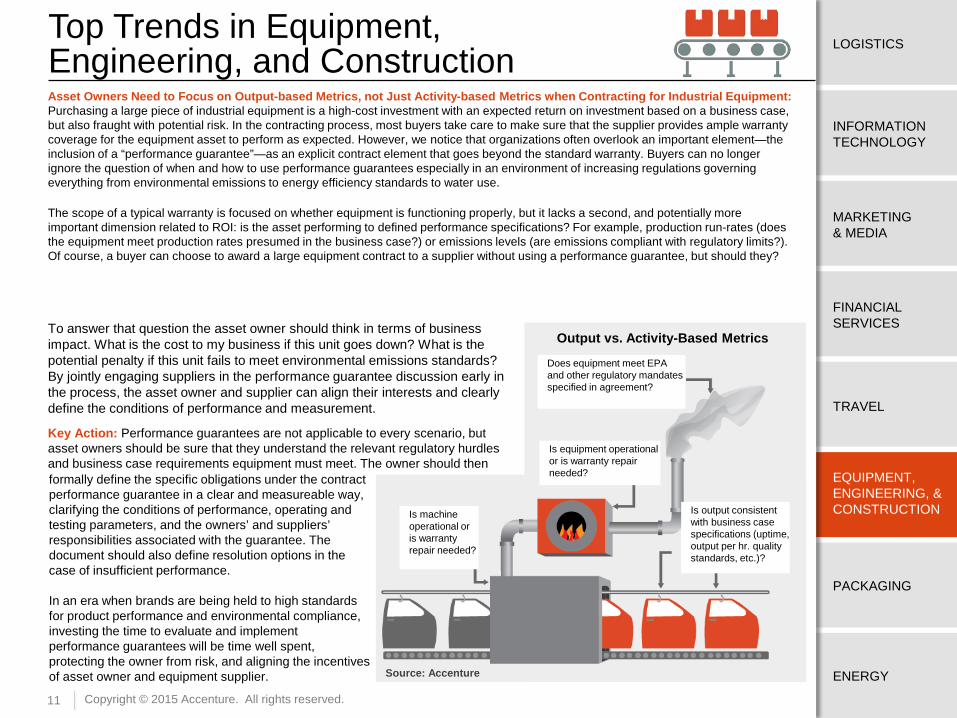
To answer that question the asset owner should think in terms of business impact. What is the cost to my business if this unit goes down? What is the potential penalty if this unit fails to meet environmental emissions standards? By jointly engaging suppliers in the performance guarantee discussion early in the process, the asset owner and supplier can align their interests and clearly define the conditions of performance and measurement.
Is machine operational or is warranty repair needed?
Is output consistent with business case specifications (uptime, output per hr. quality standards, etc.)?
Is equipment operational or is warranty repair needed?
Does equipment meet EPA and other regulatory mandates specified in agreement?
Key Action: Performance guarantees are not applicable to every scenario, but asset owners should be sure that they understand the relevant regulatory hurdles and business case requirements equipment must meet. The owner should then formally define the specific obligations under the contract performance guarantee in a clear and measureable way, clarifying the conditions of performance, operating and testing parameters, and the owners’ and suppliers’ responsibilities associated with the guarantee. The document should also define resolution options in the case of insufficient performance. In an era when brands are being held to high standards for product performance and environmental compliance, investing the time to evaluate and implement performance guarantees will be time well spent, protecting the owner from risk, and aligning the incentives of asset owner and equipment supplier.
Output vs. Activity-Based Metrics
Source: Accenture
12
ENERGY
EQUIPMENT, ENGINEERING, & CONSTRUCTION
TRAVEL
FINANCIAL SERVICES
MARKETING & MEDIA
LOGISTICS
INFORMATION TECHNOLOGY
PACKAGING
Copyright © 2015 Accenture. All rights reserved.
Top Trends in Packaging Mandatory Packaging Changes Create Another Reason to be Proactive about Packaging Substitution and Redesign Options: In February 2013, New York City Mayor Michael Bloomberg called for a complete ban of Styrofoam food packaging in favor of recyclable packaging materials. Fast forward to 2015, and the ban on Styrofoam packaging materials is set to finally take effect: as of July 1st, Styrofoam packaging will be outlawed. The new regulations will not only affect food trucks and local eateries—the ban applies to food establishments as well as manufacturers and bans businesses from possessing, selling or offering single-use Styrofoam containers and related products including “packing peanuts.” Exemptions are available for some smaller businesses, but for national businesses that have standardized on Styrofoam products from coffee cups to shipping material, the new rules could require significant packaging re-design and reformulation.
New York City’s ban is not an isolated occurrence. In the United States, the cities of San Francisco, Seattle and Portland (and nearly one hundred other municipalities) have already banned the use of foam-based packaging containers, and globally, full or partial bans on foam packaging exist in locales ranging from Paris to India to Taiwan.
Other common materials have been subject to bans (such as numerous municipalities outlawing the use of single-use plastic bags) or significant negative publicity and health concerns (for example the debate about the safety of Bisphenol A or “BPA” used in polycarbonate
and epoxy resins used in food packaging applications). Evolving regulations and grass-roots consumer campaigns as well as corporate sustainability initiatives combine to create an evolving set of challenges for packaging teams to negotiate.
The best practice, evidenced by many organizations, is to constantly explore the potential for packaging innovation and substitutability to optimize the trade-off between packaging performance, cost and local market and customer preferences. The process of regularly re-evaluating packaging materials and designs can help organizations proactively take advantage of market opportunities to reduce costs (for example, input cost changes that make one material more cost-competitive than another) and not be caught flat-footed when local-market packaging regulations change.
Key Action: The drastic fall in the price of oil and natural gas already has leading organizations re-examining the packaging materials they use for substitutability and cost savings opportunities. For those organizations not already engaged in the practice, New York City’s recent foam packaging ban provides another incentive for organizations to reinvigorate packaging innovation efforts. Organizations should start by understanding customer preferences and trends by local market, evaluate the sensitivity of packaging materials to input cost changes (including raw material, labor and other cost drivers), and consider the use of supplier innovation councils to institute collaboration with key suppliers and tap into best practices and foster tighter collaboration.
13
ENERGY
EQUIPMENT, ENGINEERING, & CONSTRUCTION
TRAVEL
FINANCIAL SERVICES
MARKETING & MEDIA
LOGISTICS
INFORMATION TECHNOLOGY
PACKAGING
Copyright © 2015 Accenture. All rights reserved.
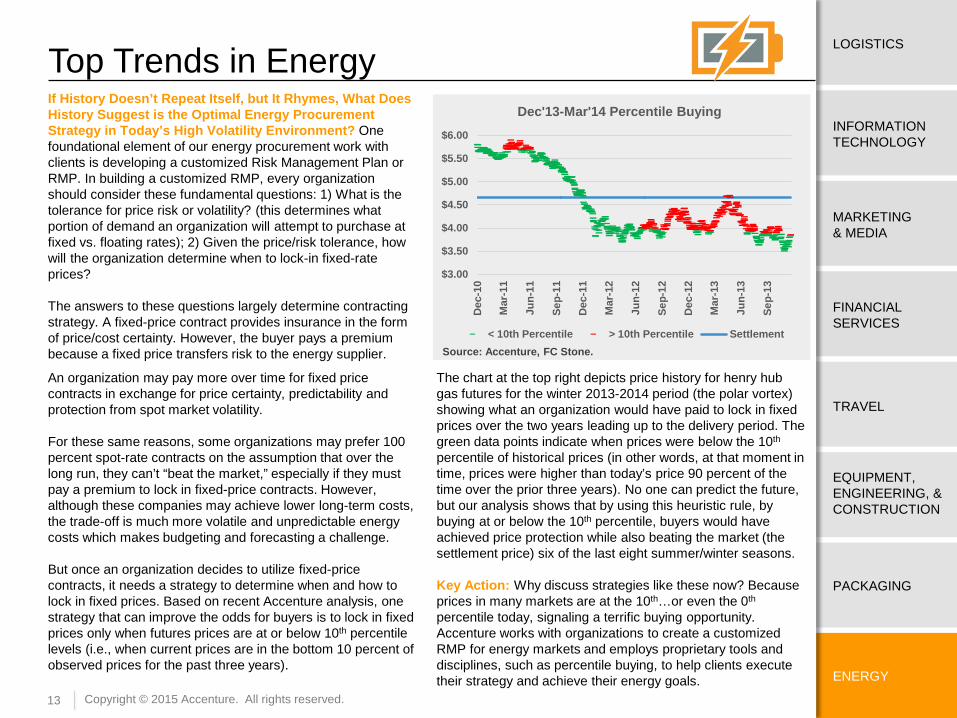
Top Trends in Energy If History Doesn’t Repeat Itself, but It Rhymes, What Does History Suggest is the Optimal Energy Procurement Strategy in Today’s High Volatility Environment? One foundational element of our energy procurement work with clients is developing a customized Risk Management Plan or RMP. In building a customized RMP, every organization should consider these fundamental questions: 1) What is the tolerance for price risk or volatility? (this determines what portion of demand an organization will attempt to purchase at fixed vs. floating rates); 2) Given the price/risk tolerance, how will the organization determine when to lock-in fixed-rate prices?
The answers to these questions largely determine contracting strategy. A fixed-price contract provides insurance in the form of price/cost certainty. However, the buyer pays a premium because a fixed price transfers risk to the energy supplier.
An organization may pay more over time for fixed price contracts in exchange for price certainty, predictability and protection from spot market volatility.
For these same reasons, some organizations may prefer 100 percent spot-rate contracts on the assumption that over the long run, they can’t “beat the market,” especially if they must pay a premium to lock in fixed-price contracts. However, although these companies may achieve lower long-term costs, the trade-off is much more volatile and unpredictable energy costs which makes budgeting and forecasting a challenge.
But once an organization decides to utilize fixed-price contracts, it needs a strategy to determine when and how to lock in fixed prices. Based on recent Accenture analysis, one strategy that can improve the odds for buyers is to lock in fixed prices only when futures prices are at or below 10th percentile levels (i.e., when current prices are in the bottom 10 percent of observed prices for the past three years).
The chart at the top right depicts price history for henry hub gas futures for the winter 2013-2014 period (the polar vortex) showing what an organization would have paid to lock in fixed prices over the two years leading up to the delivery period. The green data points indicate when prices were below the 10th percentile of historical prices (in other words, at that moment in time, prices were higher than today’s price 90 percent of the time over the prior three years). No one can predict the future, but our analysis shows that by using this heuristic rule, by buying at or below the 10th percentile, buyers would have achieved price protection while also beating the market (the settlement price) six of the last eight summer/winter seasons.
Key Action: Why discuss strategies like these now? Because prices in many markets are at the 10th…or even the 0th percentile today, signaling a terrific buying opportunity. Accenture works with organizations to create a customized RMP for energy markets and employs proprietary tools and disciplines, such as percentile buying, to help clients execute their strategy and achieve their energy goals.
Source: Accenture, FC Stone.
$3.00
$3.50
$4.00
$4.50
$5.00
$5.50
$6.00
Dec
-10
Mar
-11
Jun-
11
Sep-
11
Dec
-11
Mar
-12
Jun-
12
Sep-
12
Dec
-12
Mar
-13
Jun-
13
Sep-
13
Dec'13-Mar'14 Percentile Buying
< 10th Percentile > 10th Percentile Settlement
14 Copyright © 2015 Accenture. All rights reserved.
Subscribe to Accenture Spend Trends
Get the quarterly Accenture Spend trends Report delivered straight to your inbox each quarter.
Visit: www.accenture.com/subscribespendtrends
15 Copyright © 2015 Accenture. All rights reserved.
Sources and References EXECUTIVE SUMMARY:
• Wang, Lu and Renick, Oliver, Bloomberg Business, “American Companies Are in Love With Themselves,” March 3, 2015. Retrieved from: http://www.bloomberg.com/news/articles/2015-03-03/company-cash-bathes-stocks-as-monthly-buybacks-set-record
• International Monetary Fund World Economic Update, “Uneven Growth: Short- and Long-Term Factors,” April 2015. Retrieved from: http://www.imf.org/external/pubs/ft/weo/2015/01/
• FactSet Earnings Insight: May 1, 2015, Retrieved from: http://www.factset.com/websitefiles/PDFs/earningsinsight/earningsinsight_5.1.15/view
INFORMATION TECHNOLOGY:
• Cisco Systems, “Cisco Visual Networking Index: Global Mobile Data Traffic Forecast Update 2014–2019 White Paper,” February 3, 2015. Retrieved from: http://www.cisco.com/c/en/us/solutions/collateral/service-provider/visual-networking-index-vni/white_paper_c11-520862.html
MARKETING:
• IEG, LLC., “IEG Projects North American Sponsorship Spending to Increase Four Percent in 2015.” Retrieved from: http://www.sponsorship.com/About-IEG/Press-Room/IEG-Projects-North-American-Sponsorship-Spending-t.aspx
FINANCIAL SERVCES:
• FactSet Earnings Insight, April 17, 2015, Retrieved from: http://www.factset.com/websitefiles/PDFs/earningsinsight/earningsinsight_4.17.15/view
• Cimilluca, Dana, Mattioli, Dana and Raice, Shayndi, The Wall Street Journal, “Rising Optimism Fuels Deal Rebound,” April 8, 2015. Retrieved from: http://www.wsj.com/articles/rising-optimism-fuels-deal-rebound-1428538721
• Platt, Eric, The Financial Times, “US Companies Sell Record Euro Debt,” March 23, 2015. Retrieved from: http://www.ft.com/intl/cms/s/0/36cf4210-cf2e-11e4-b761-00144feab7de.html#axzz3ZW5wrUDU
PACKAGING:
• Dockterman, Eliana, Time, “New York City Bans Single-Use Styrofoam Products.” Retrieved from: http://time.com/3660943/new-york-city-styrofoam-ban/
• The Official Website of the City of New York. “De Blasio Administration Bans Single-Use Styrofoam Products in New York City Beginning July 1, 2015,” January 8, 2015. Retrieved from: http://www1.nyc.gov/office-of-the-mayor/news/016-15/de-blasio-administration-bans-single-use-styrofoam-products-new-york-city-beginning-july-1-2015.
16 Copyright © 2015 Accenture. All rights reserved.
About Accenture
Copyright © 2015 Accenture.
All rights reserved.
Accenture, its logo, and High performance. Delivered. are trademarks of Accenture.
This document makes descriptive reference to trademarks that may be owned by others. The use of such trademarks herein is not an assertion of ownership of such trademarks by Accenture and is not intended to represent or imply the existence of an association between Accenture and the lawful owners of such trademarks.
Accenture is a global management consulting, technology services and outsourcing company, with approximately 323,000 people serving clients in more than 120 countries. Combining unparalleled experience, comprehensive capabilities across all industries and business functions, and extensive research on the world’s most successful companies, Accenture collaborates with clients to help them become high-performance businesses and governments. The company generated net revenues of US$30.0 billion for the fiscal year ended Aug. 31, 2014. Its home page is www.accenture.com.