Embed Size (px)
Citation preview
A PERSPECTIVE OF A
CONNECTED AND
AUTONOMOUS
TRANSPORTATION SYSTEM
C. Michael Walton, Ph.D., P.E.
Ernest H. Cockrell Centennial Chair in Engineering
The University of Texas at Austin
March 2, 2015
2
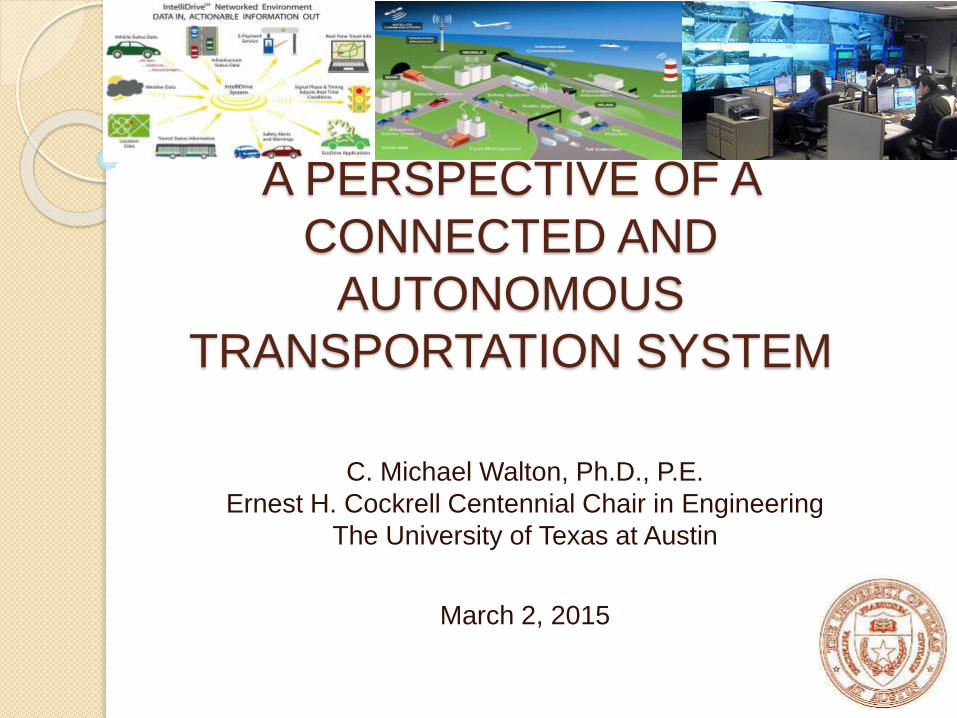
Why ITS?
United States in 2009:
• 5.5 million traffic crashes * – 30,797 fatalities (lowest
since 1954)
– 1.5 million injuries’
– $230.6 billion in costs
• $115 billion cost of urban traffic congestion**
– 4.8 billion hours of delay
– 3.9 billion gallons of wasted fuel
• Unacceptable
* US DOT, Traffic Safety Facts 2009
**Texas Transportation Institute, Urban Mobility Report 2010
Source: USDOT
Safety Facts 2010,
Texas Tech Institute
Mobility Report 2010
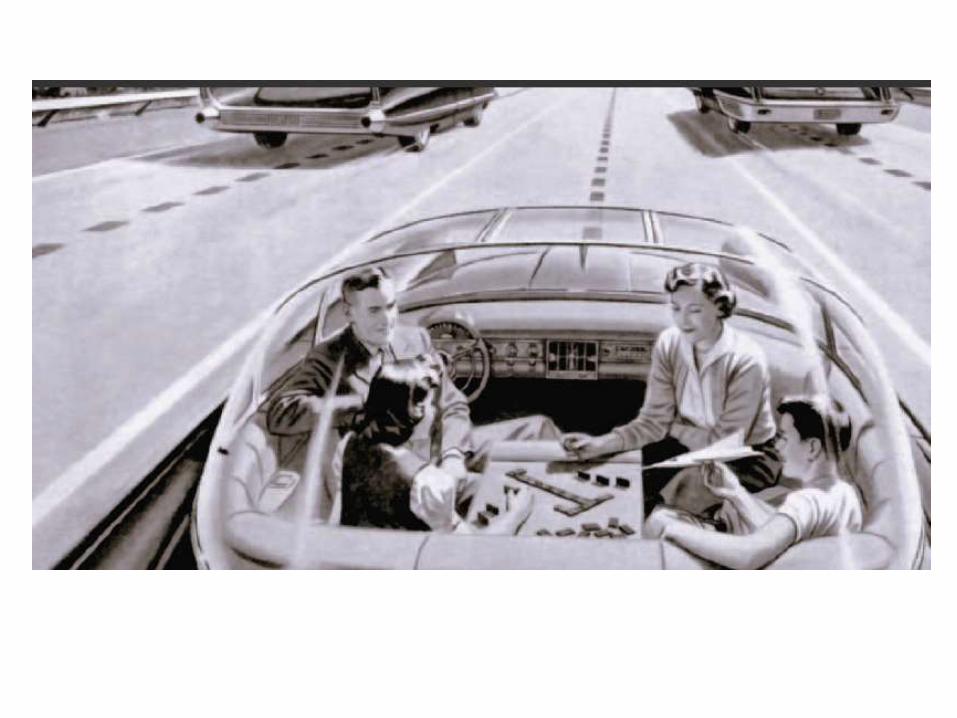
Vision –
What would we wish for?
Vehicles that can’t crash
◦ Vehicles are wrapped in information
◦ Everyone has technology-enabled safety in
their vehicles
Technology in transportation reduces
negative impact on the environment
◦ Improved system performance
◦ Improved driver decision-making
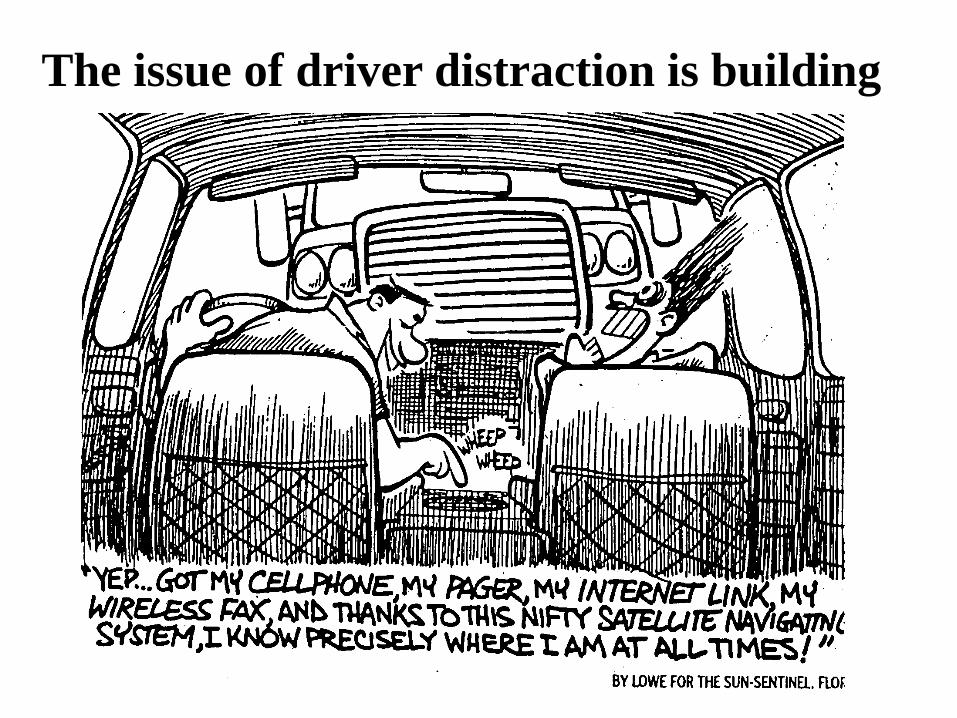
The issue of driver distraction is building
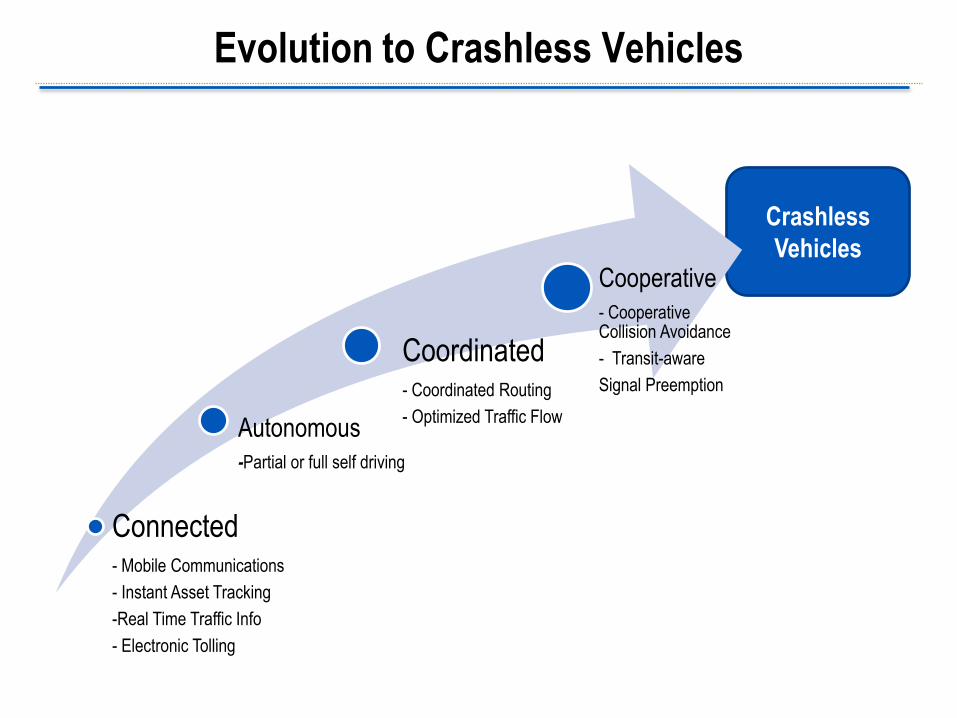
Crashless
Vehicles
Evolution to Crashless Vehicles
Connected- Mobile Communications
- Instant Asset Tracking
-Real Time Traffic Info
- Electronic Tolling
Autonomous
-Partial or full self driving
Coordinated- Coordinated Routing
- Optimized Traffic Flow
Cooperative
- Cooperative Collision Avoidance
- Transit-aware
Signal Preemption
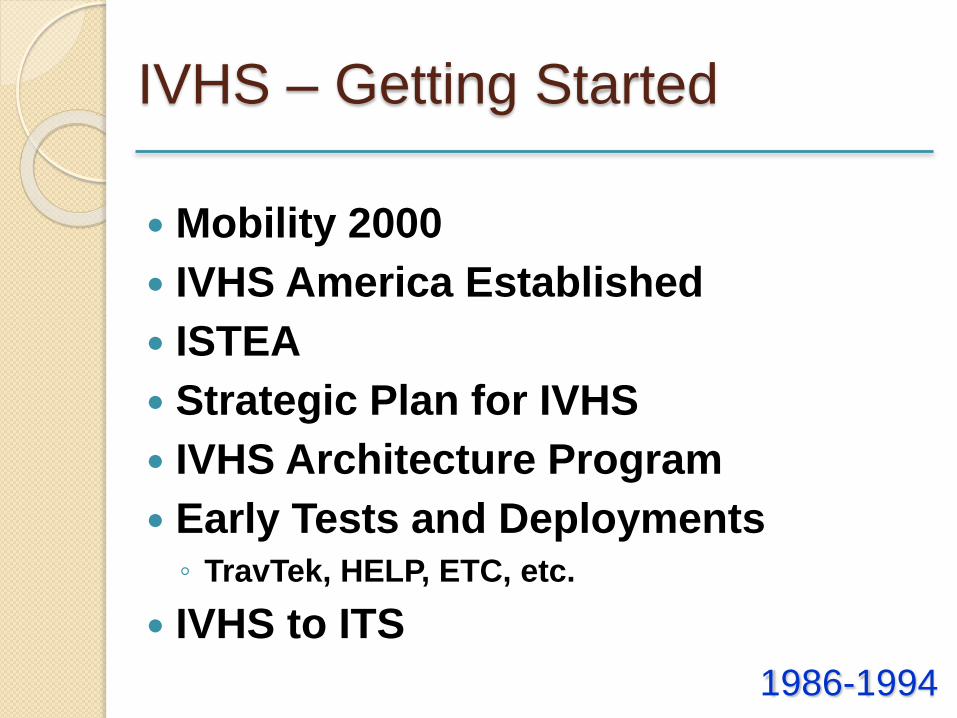
IVHS – Getting Started
Mobility 2000
IVHS America Established
ISTEA
Strategic Plan for IVHS
IVHS Architecture Program
Early Tests and Deployments◦ TravTek, HELP, ETC, etc.
IVHS to ITS
1986-1994
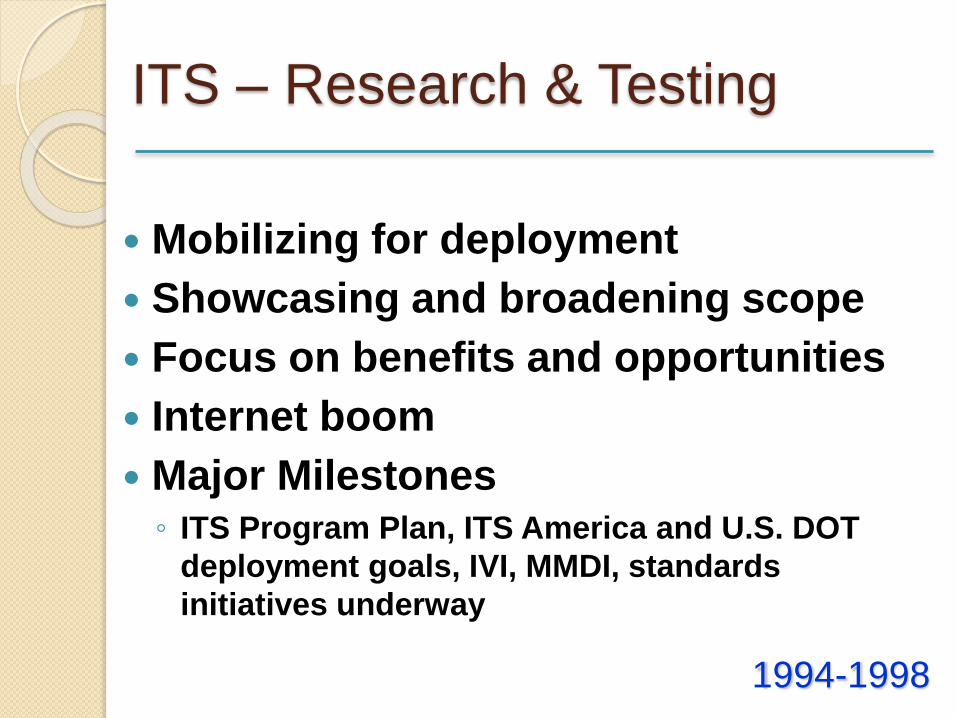
ITS – Research & Testing
Mobilizing for deployment
Showcasing and broadening scope
Focus on benefits and opportunities
Internet boom
Major Milestones◦ ITS Program Plan, ITS America and U.S. DOT
deployment goals, IVI, MMDI, standards
initiatives underway
1994-1998
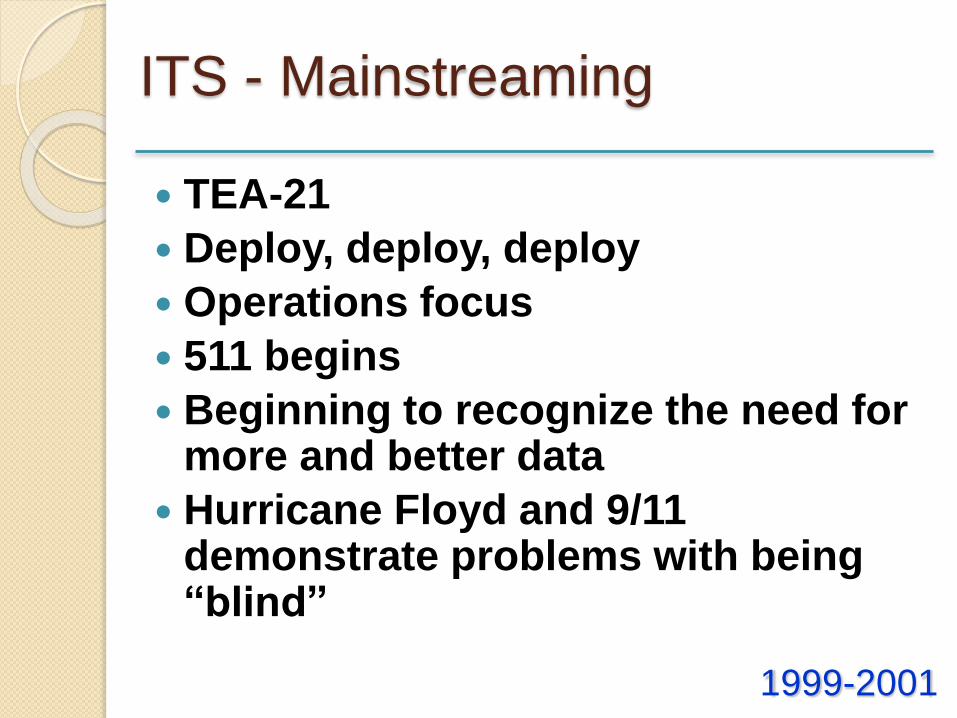
ITS - Mainstreaming
TEA-21
Deploy, deploy, deploy
Operations focus
511 begins
Beginning to recognize the need for more and better data
Hurricane Floyd and 9/11 demonstrate problems with being “blind”
1999-2001
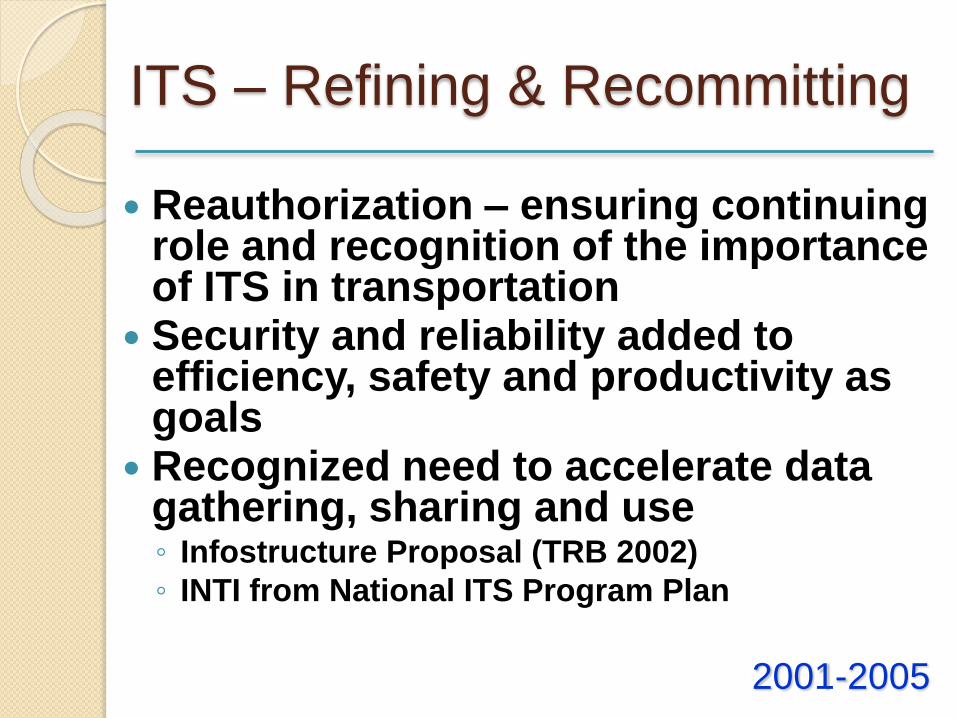
ITS – Refining & Recommitting
Reauthorization – ensuring continuing role and recognition of the importance of ITS in transportation
Security and reliability added to efficiency, safety and productivity as goals
Recognized need to accelerate data gathering, sharing and use◦ Infostructure Proposal (TRB 2002)
◦ INTI from National ITS Program Plan
2001-2005
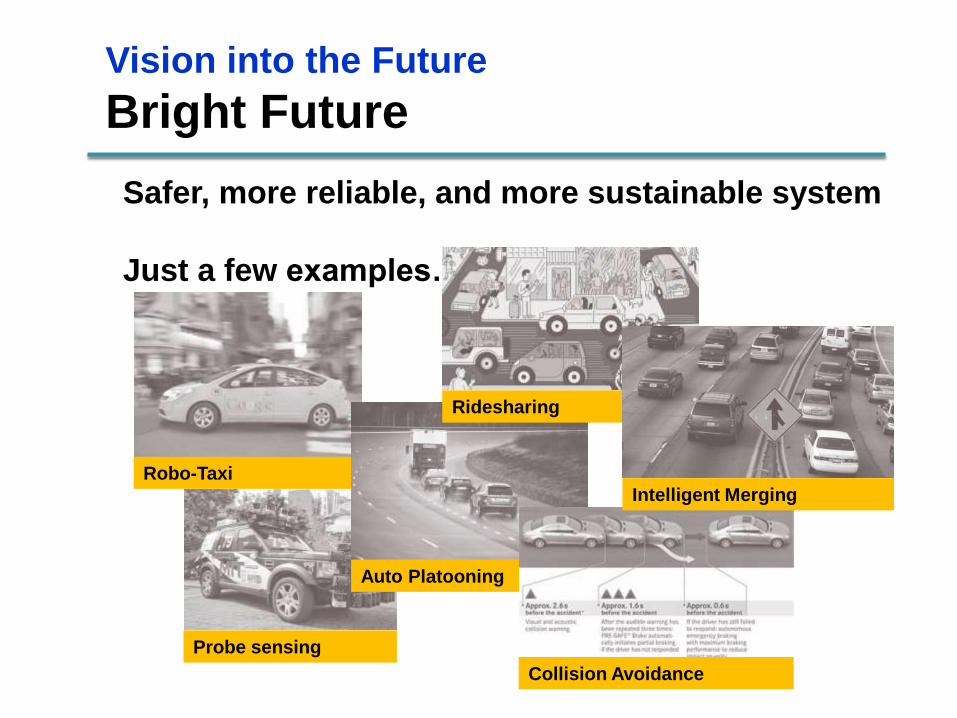
Robo-Taxi
Vision into the Future
Bright Future
Safer, more reliable, and more sustainable system
Just a few examples…
Auto Platooning
Ridesharing
Collision Avoidance
Intelligent Merging
Probe sensing
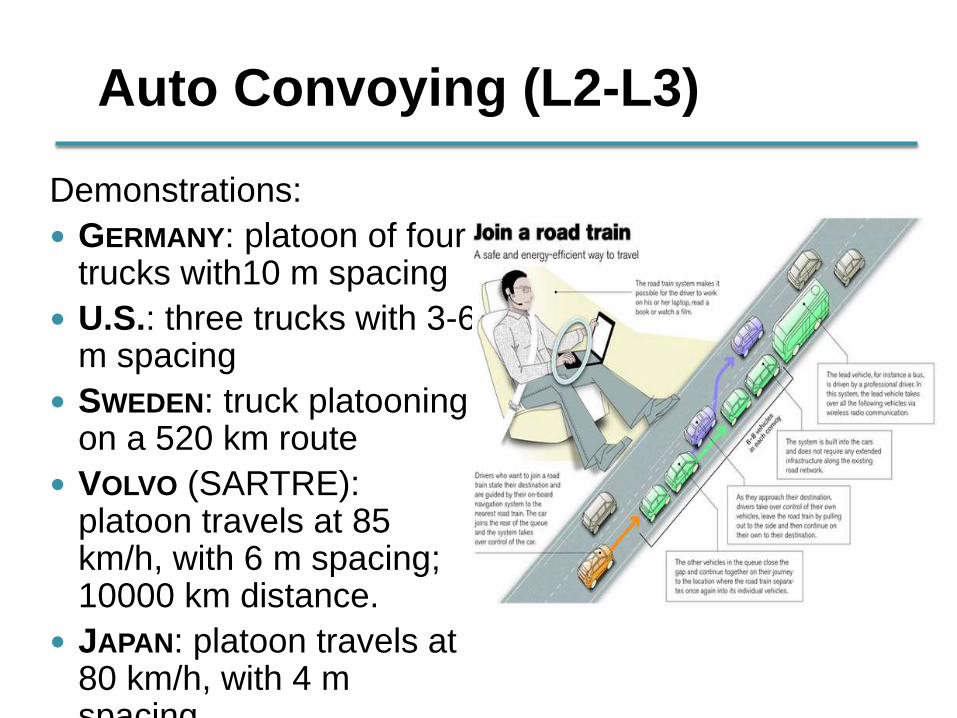
Auto Convoying (L2-L3)
Demonstrations:
GERMANY: platoon of four trucks with10 m spacing
U.S.: three trucks with 3-6 m spacing
SWEDEN: truck platooning on a 520 km route
VOLVO (SARTRE): platoon travels at 85 km/h, with 6 m spacing; 10000 km distance.
JAPAN: platoon travels at 80 km/h, with 4 m spacing
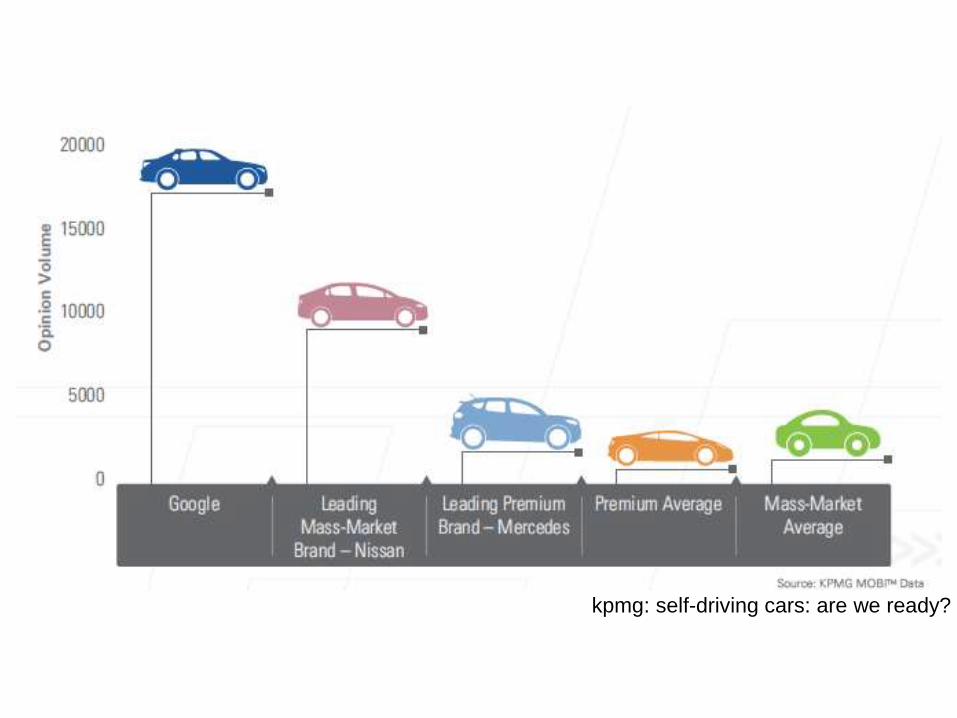
kpmg: self-driving cars: are we ready?
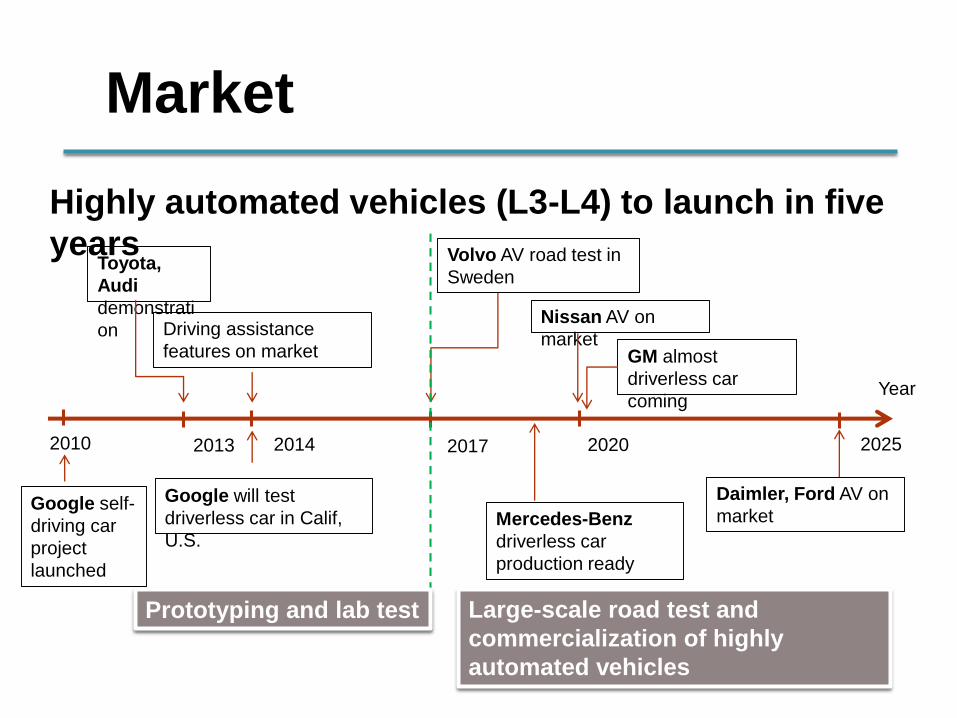
Market
Highly automated vehicles (L3-L4) to launch in five
years
2014 2020
Nissan AV on
market
2017
Volvo AV road test in
Sweden
Year
Google will test
driverless car in Calif,
U.S.
Driving assistance
features on market
Prototyping and lab test Large-scale road test and
commercialization of highly
automated vehicles
GM almost
driverless car
coming
2013
Toyota,
Audi
demonstrati
on
Mercedes-Benz
driverless car
production ready
2025
Daimler, Ford AV on
market
2010
Google self-
driving car
project
launched
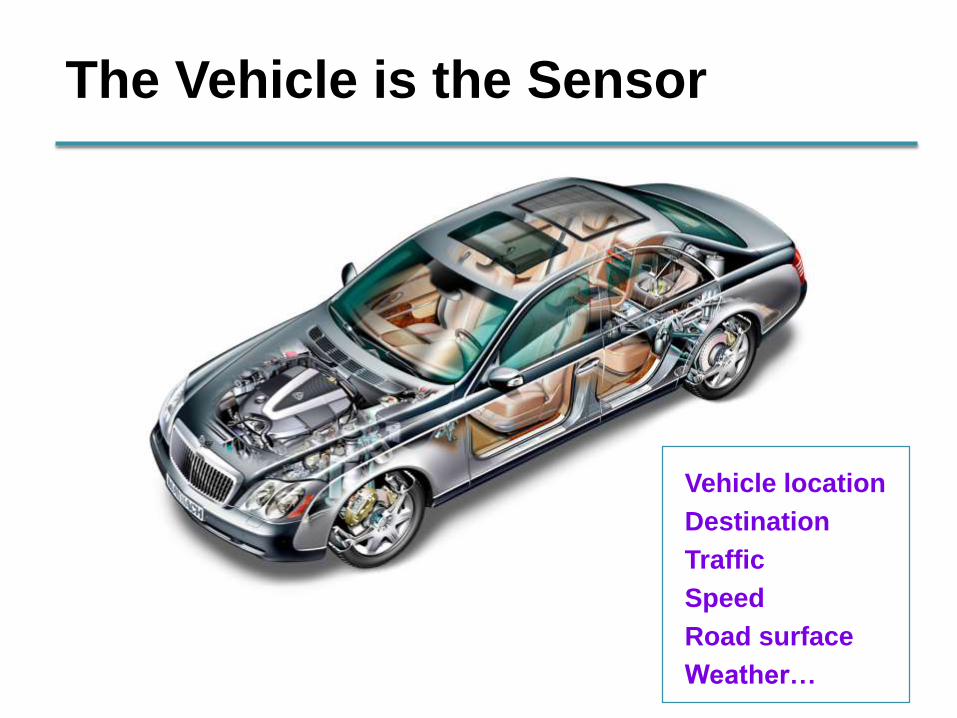
The Vehicle is the Sensor
Maybach 57
Vehicle location
Destination
Traffic
Speed
Road surface
Weather…
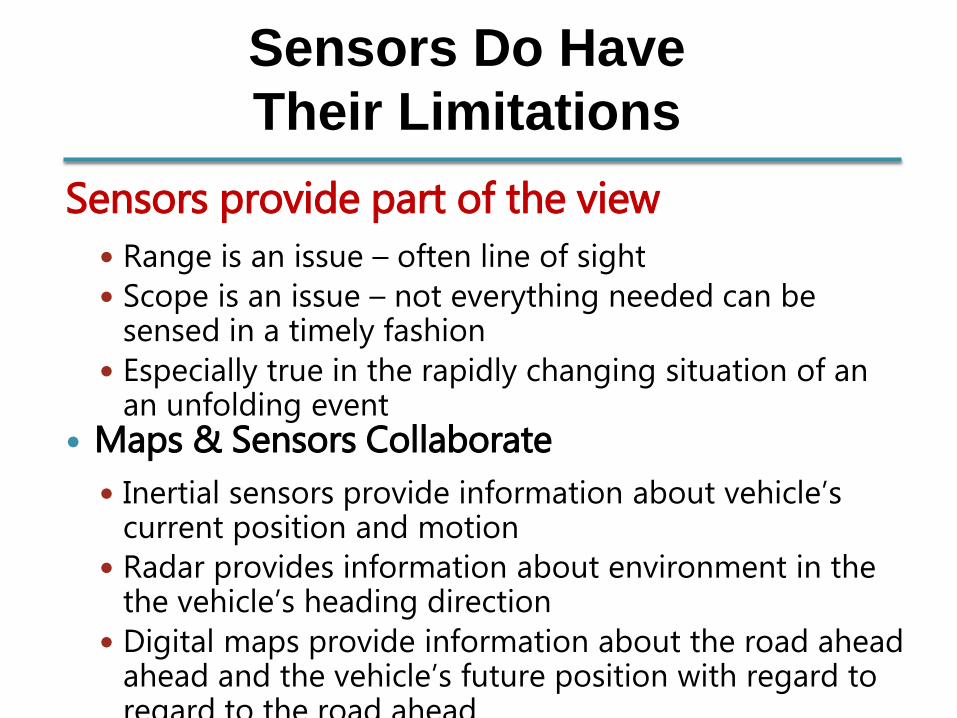
Sensors Do Have
Their Limitations
Sensors provide part of the view
Range is an issue – often line of sight Scope is an issue – not everything needed can be
sensed in a timely fashion
Especially true in the rapidly changing situation of an an unfolding event
Maps & Sensors Collaborate
Inertial sensors provide information about vehicle’s current position and motion
Radar provides information about environment in the the vehicle’s heading direction
Digital maps provide information about the road ahead ahead and the vehicle’s future position with regard to regard to the road ahead
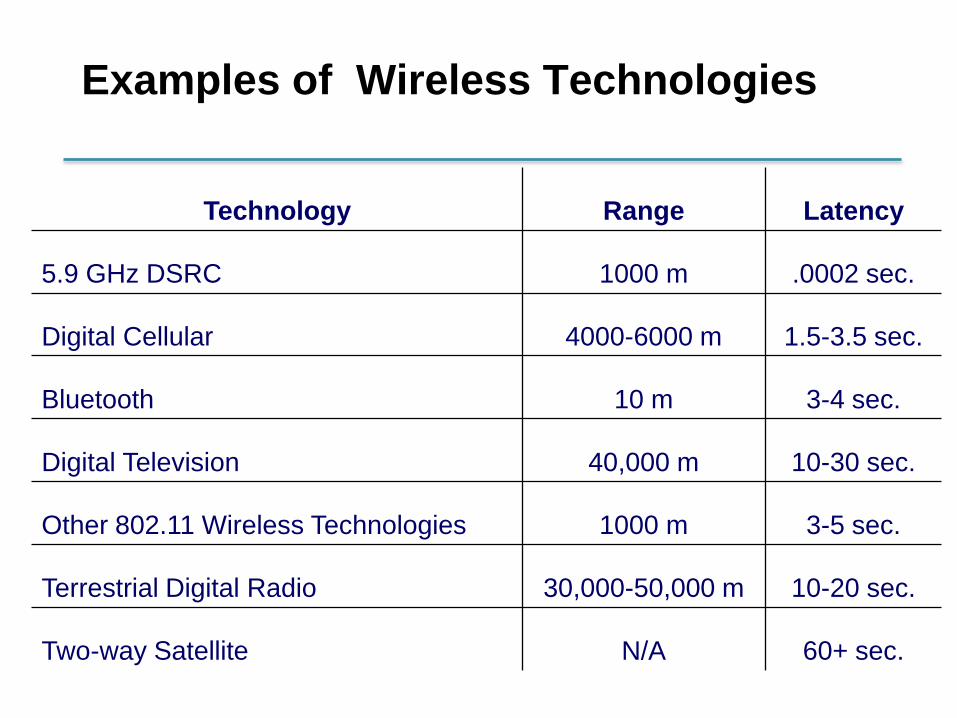
Examples of Wireless Technologies
Technology Range Latency
5.9 GHz DSRC 1000 m .0002 sec.
Digital Cellular 4000-6000 m 1.5-3.5 sec.
Bluetooth 10 m 3-4 sec.
Digital Television 40,000 m 10-30 sec.
Other 802.11 Wireless Technologies 1000 m 3-5 sec.
Terrestrial Digital Radio 30,000-50,000 m 10-20 sec.
Two-way Satellite N/A 60+ sec.
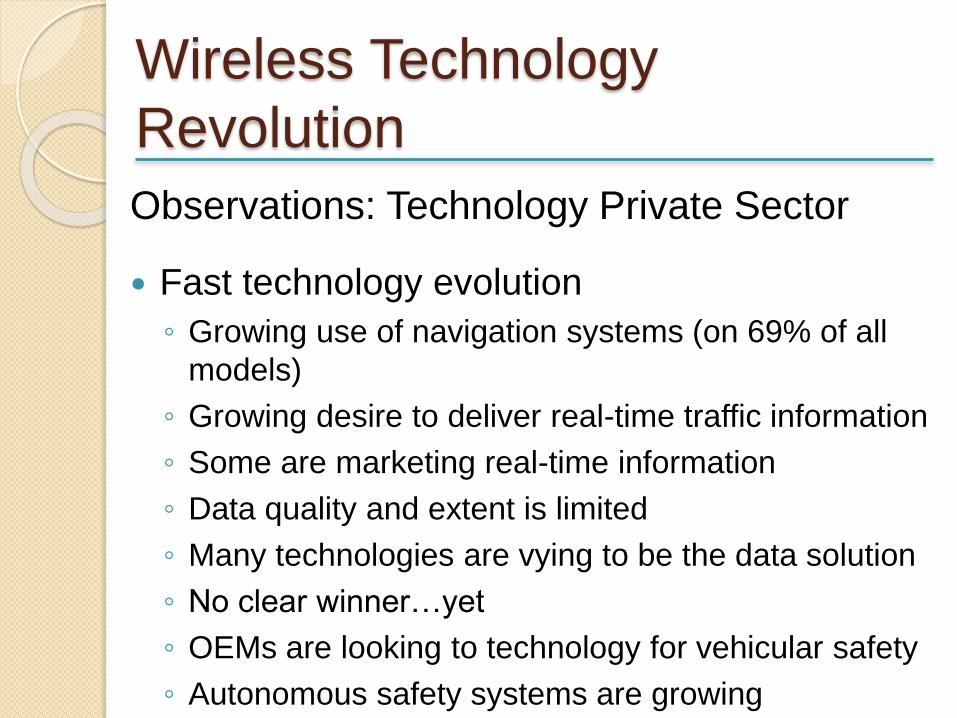
Wireless Technology
Revolution
Observations: Technology Private Sector
Fast technology evolution
◦ Growing use of navigation systems (on 69% of all
models)
◦ Growing desire to deliver real-time traffic information
◦ Some are marketing real-time information
◦ Data quality and extent is limited
◦ Many technologies are vying to be the data solution
◦ No clear winner…yet
◦ OEMs are looking to technology for vehicular safety
◦ Autonomous safety systems are growing
U.S. Department of Transportation
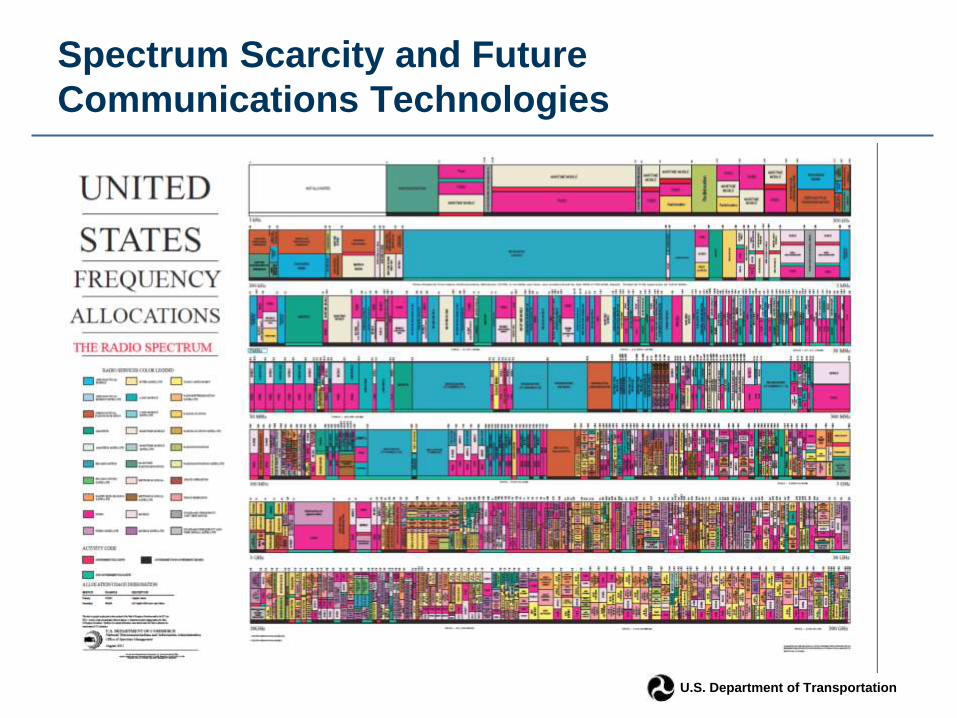
Spectrum Scarcity and Future
Communications Technologies
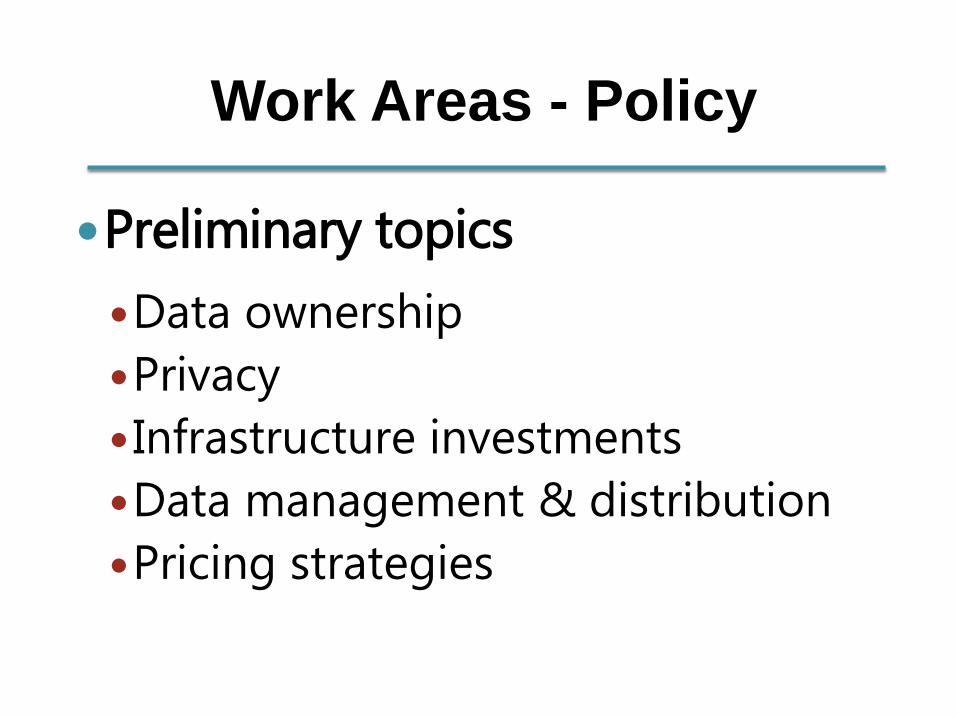
Work Areas - Policy
Preliminary topics
Data ownership
Privacy
Infrastructure investments
Data management & distribution
Pricing strategies
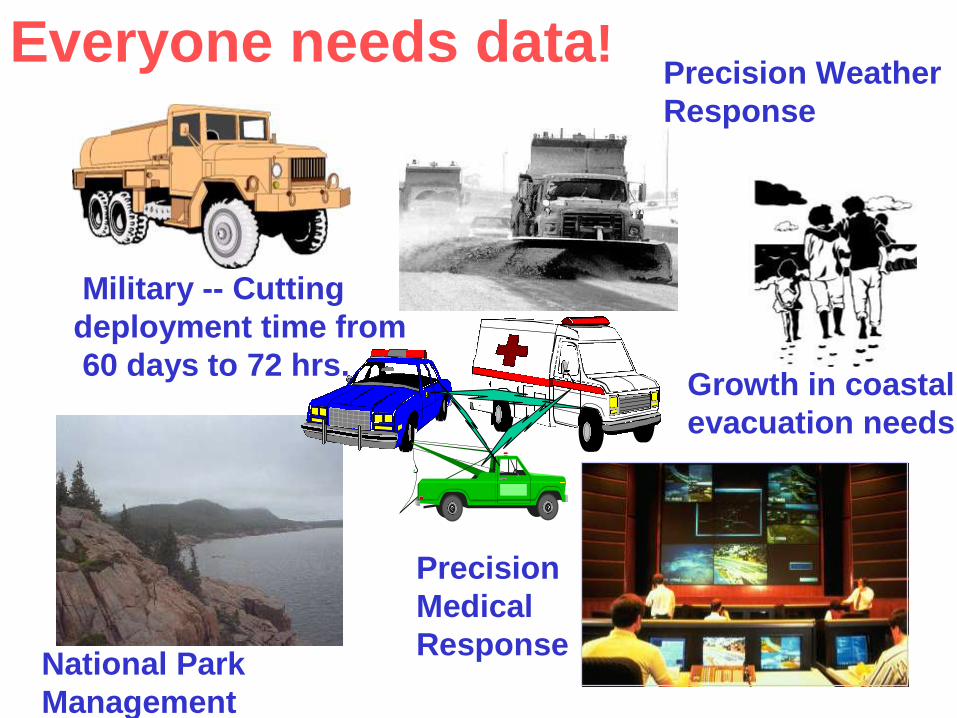
Military -- Cutting
deployment time from
60 days to 72 hrs.Growth in coastal
evacuation needs
Precision Weather
Response
National Park
Management
Everyone needs data!
Precision
Medical
Response
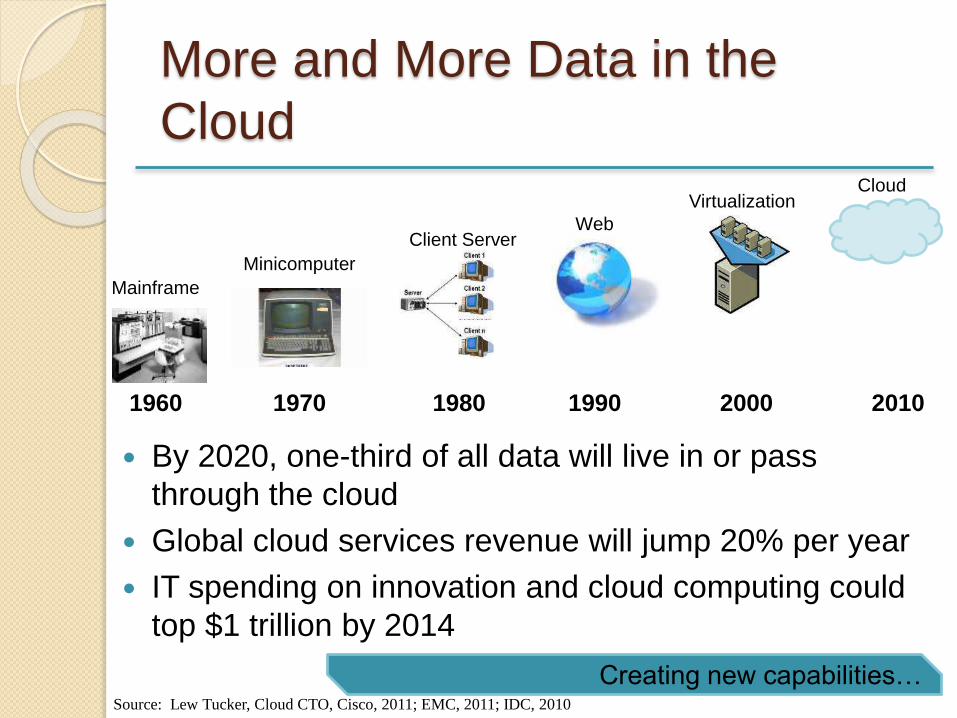
More and More Data in the
Cloud
By 2020, one-third of all data will live in or pass
through the cloud
Global cloud services revenue will jump 20% per year
IT spending on innovation and cloud computing could
top $1 trillion by 2014
Creating new capabilities…
1960 1970 1980 1990 20102000
Mainframe
CloudVirtualization
WebClient Server
Minicomputer
Source: Lew Tucker, Cloud CTO, Cisco, 2011; EMC, 2011; IDC, 2010
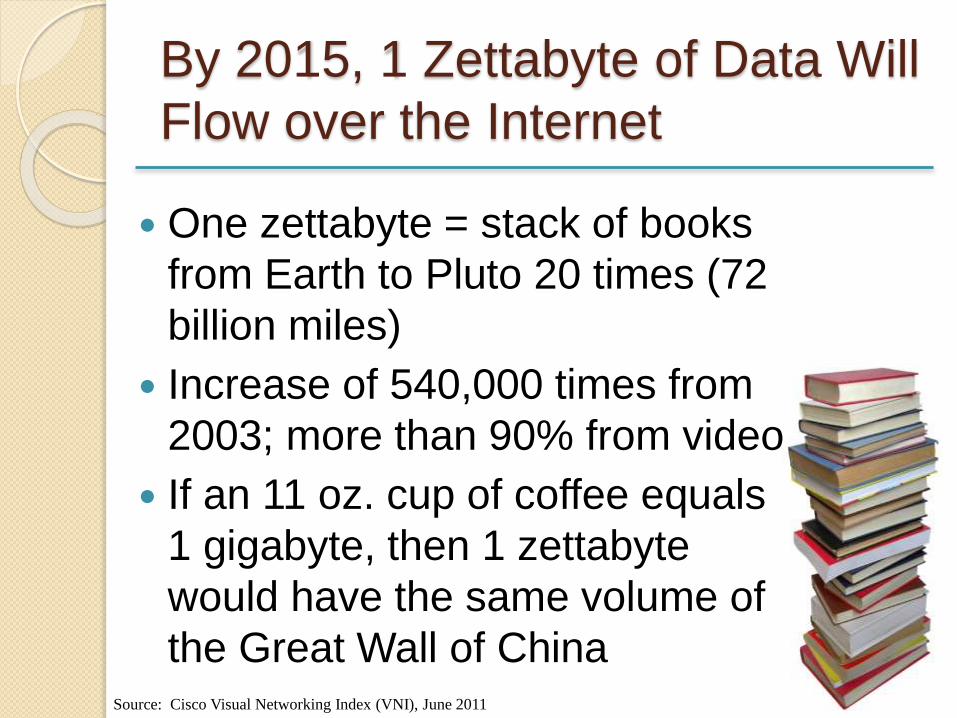
By 2015, 1 Zettabyte of Data Will
Flow over the Internet
One zettabyte = stack of books
from Earth to Pluto 20 times (72
billion miles)
Increase of 540,000 times from
2003; more than 90% from video
If an 11 oz. cup of coffee equals
1 gigabyte, then 1 zettabyte
would have the same volume of
the Great Wall of ChinaSource: Cisco Visual Networking Index (VNI), June 2011
U.S. Department of Transportation
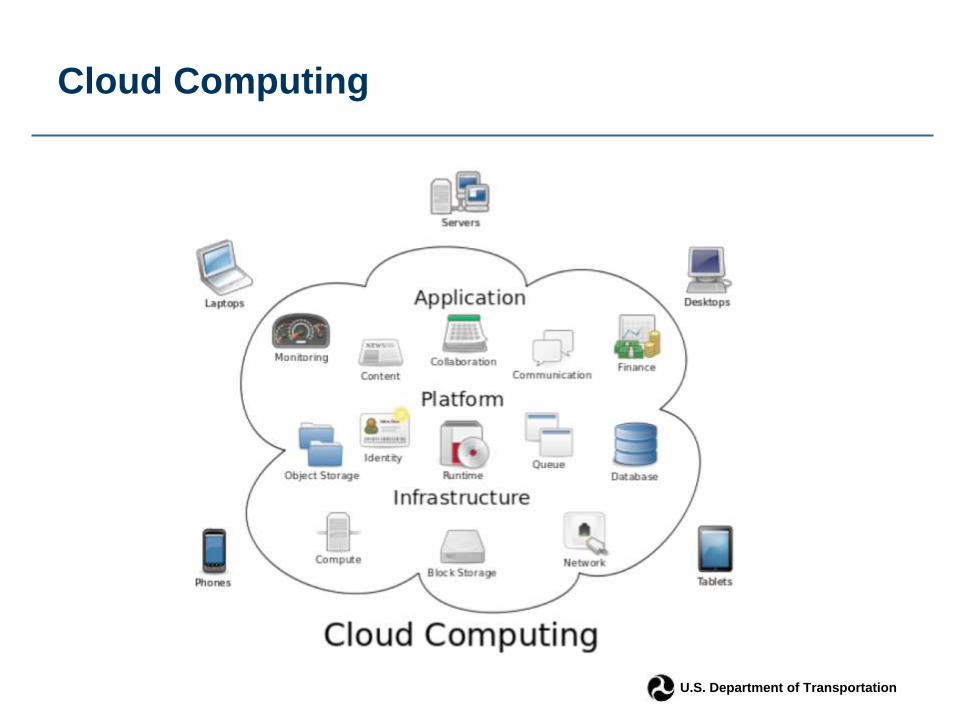
Cloud Computing
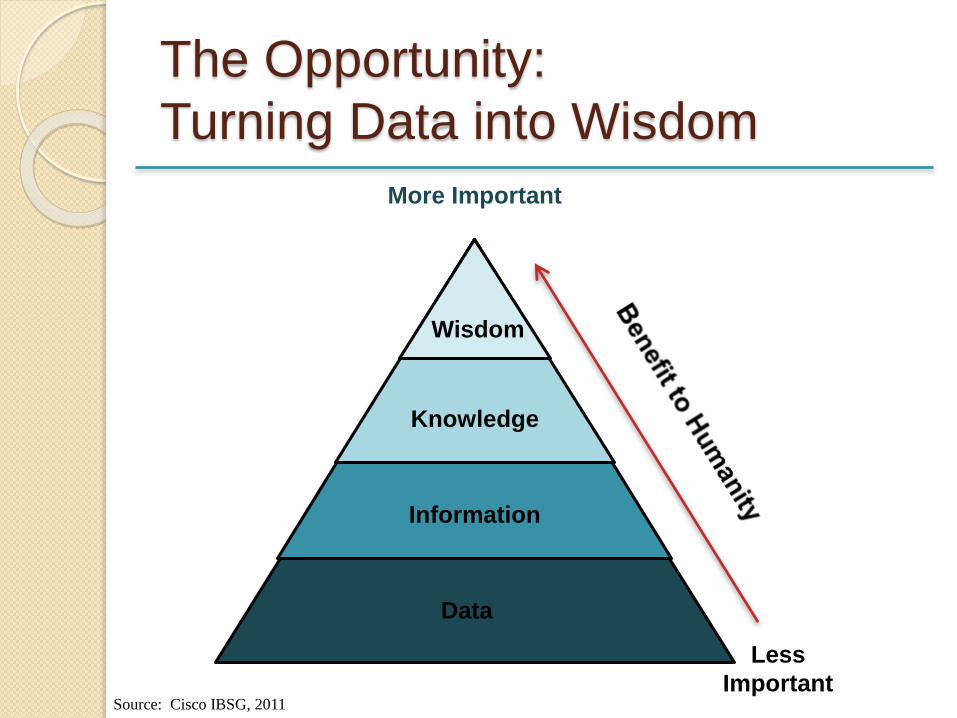
The Opportunity:
Turning Data into Wisdom
Data
Data
Information
Knowledge
Wisdom
More Important
Less
ImportantSource: Cisco IBSG, 2011
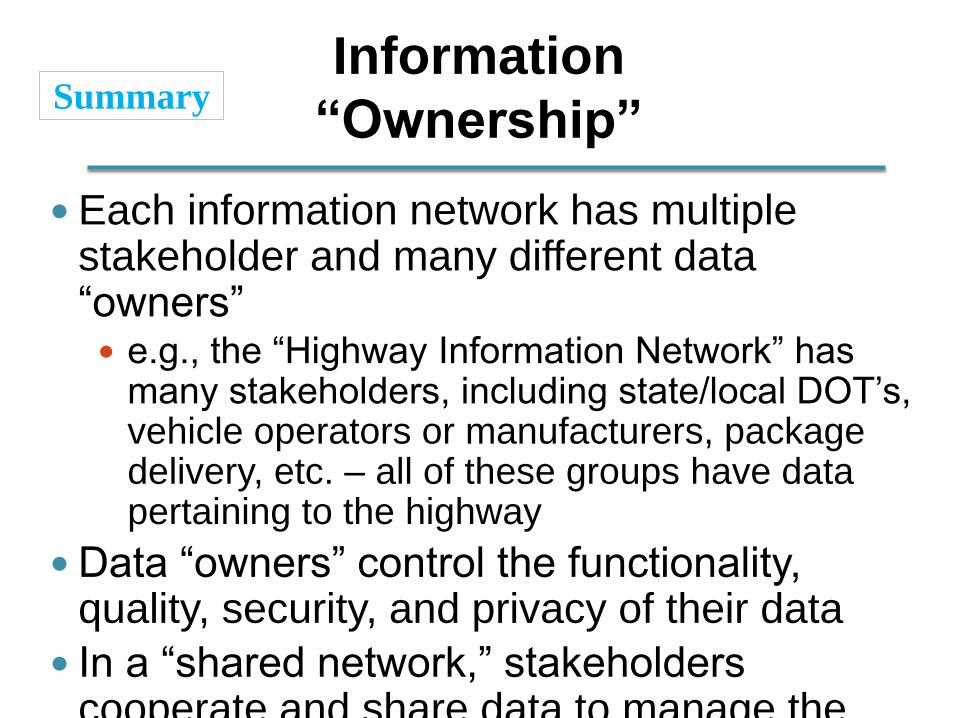
Information
“Ownership”
Each information network has multiple stakeholder and many different data “owners” e.g., the “Highway Information Network” has
many stakeholders, including state/local DOT’s, vehicle operators or manufacturers, package delivery, etc. – all of these groups have data pertaining to the highway
Data “owners” control the functionality, quality, security, and privacy of their data
In a “shared network,” stakeholders cooperate and share data to manage the system and provide value-added information
Summary
U.S. Department of Transportation
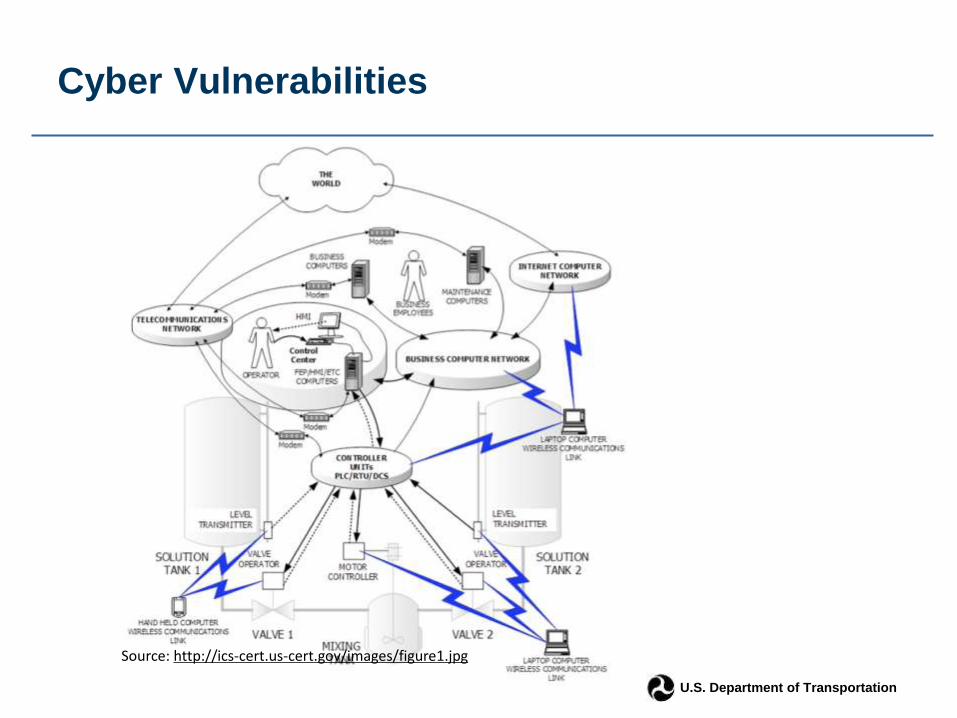
Cyber Vulnerabilities
Source: http://ics-cert.us-cert.gov/images/figure1.jpg
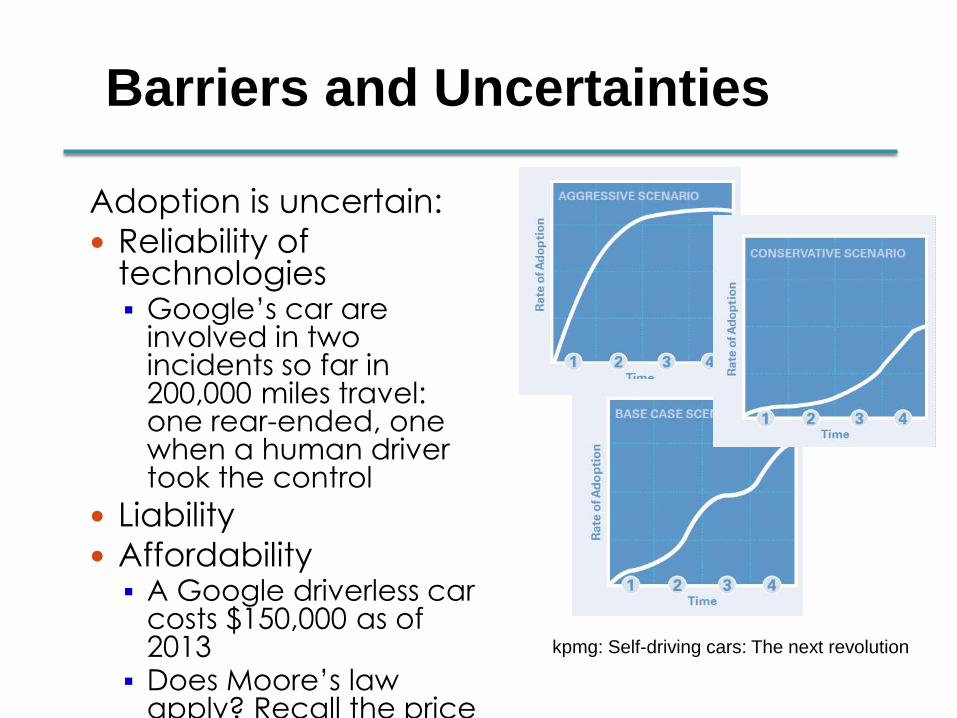
Barriers and Uncertainties
Adoption is uncertain:
Reliability of technologies Google’s car are
involved in two incidents so far in 200,000 miles travel: one rear-ended, one when a human driver took the control
Liability
Affordability A Google driverless car
costs $150,000 as of 2013
Does Moore’s law apply? Recall the price of personal computers.
kpmg: Self-driving cars: The next revolution
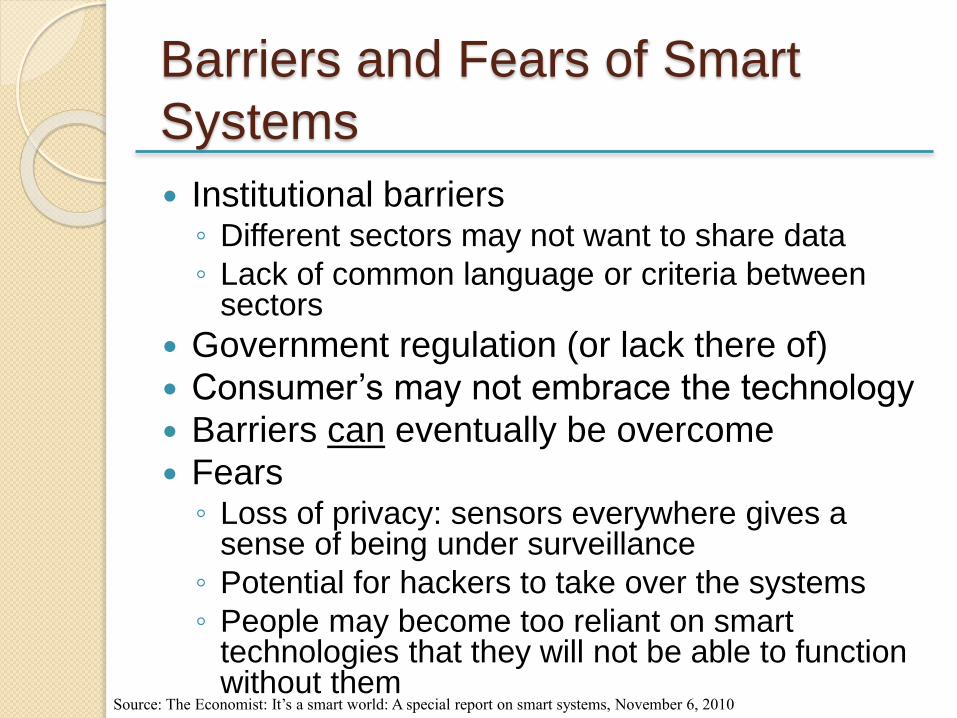
Barriers and Fears of Smart
Systems
Institutional barriers◦ Different sectors may not want to share data
◦ Lack of common language or criteria between sectors
Government regulation (or lack there of)
Consumer’s may not embrace the technology
Barriers can eventually be overcome
Fears◦ Loss of privacy: sensors everywhere gives a
sense of being under surveillance
◦ Potential for hackers to take over the systems
◦ People may become too reliant on smart technologies that they will not be able to function without them
Source: The Economist: It’s a smart world: A special report on smart systems, November 6, 2010
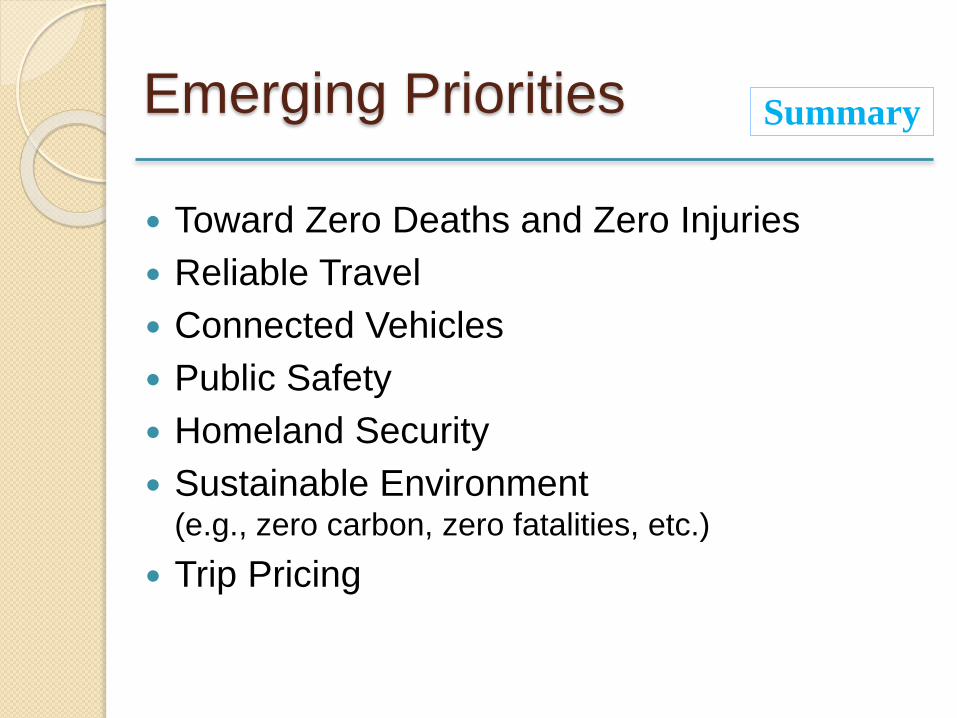
Emerging Priorities
Toward Zero Deaths and Zero Injuries
Reliable Travel
Connected Vehicles
Public Safety
Homeland Security
Sustainable Environment (e.g., zero carbon, zero fatalities, etc.)
Trip Pricing
Summary
C. Michael Walton, Ph.D., P.E.
Ernest H. Cockrell Centennial Chair in Engineering
Dept. of Civil, Architectural and Environmental
Engineering
The University of Texas at Austin
301 E. Dean Keeton Street, Stop C1761
Austin, TX 78712
512-471-1414
34