Embed Size (px)
Citation preview

A Desalination Success Story
Texas Groundwater SummitAugust 29, 2012 - Austin, Texas
Ed Archuleta, P.E., President & CEO El Paso Water Utilities
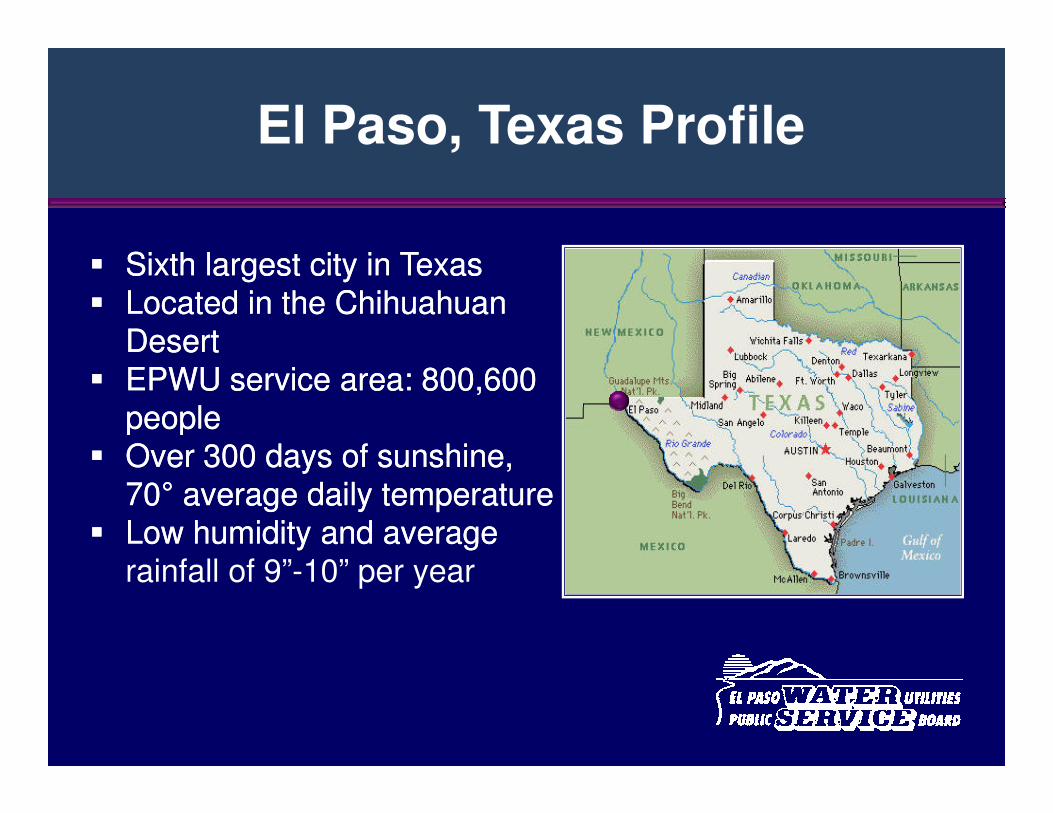
El Paso, Texas Profile
�� Sixth largest city in Sixth largest city in TexasTexas�� Located in the Chihuahuan Located in the Chihuahuan
DesertDesert�� EPWU service area: 800,600 EPWU service area: 800,600
peoplepeoplepeoplepeople�� Over 300 days of sunshineOver 300 days of sunshine,,
7070°° average daily temperatureaverage daily temperature�� Low humidity and average Low humidity and average
rainfall of 9”-10” per year
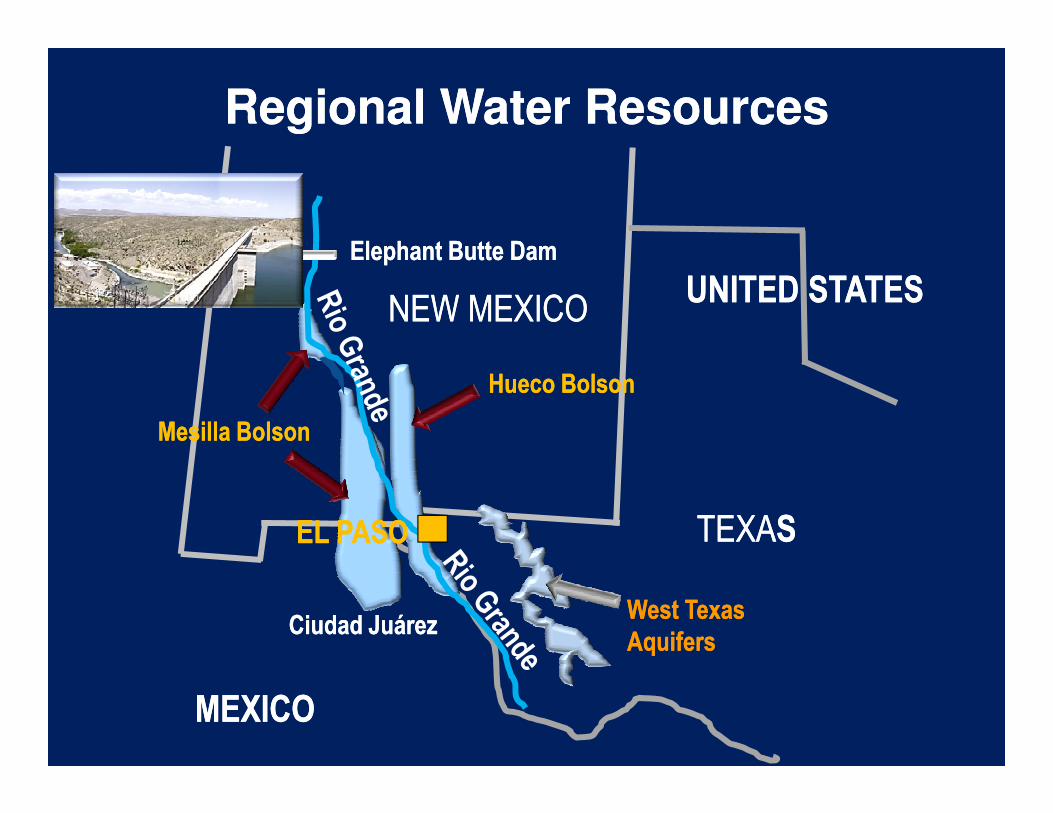
Regional Water ResourcesRegional Water Resources
UNITED STATESUNITED STATESNEW MEXICONEW MEXICO
Hueco BolsonHueco Bolson
Elephant Butte DamElephant Butte Dam
MEXICOMEXICO
Ciudad JuárezCiudad Juárez
TEXATEXASS
Mesilla BolsonMesilla Bolson
West Texas West Texas AquifersAquifers
EL PASOEL PASO
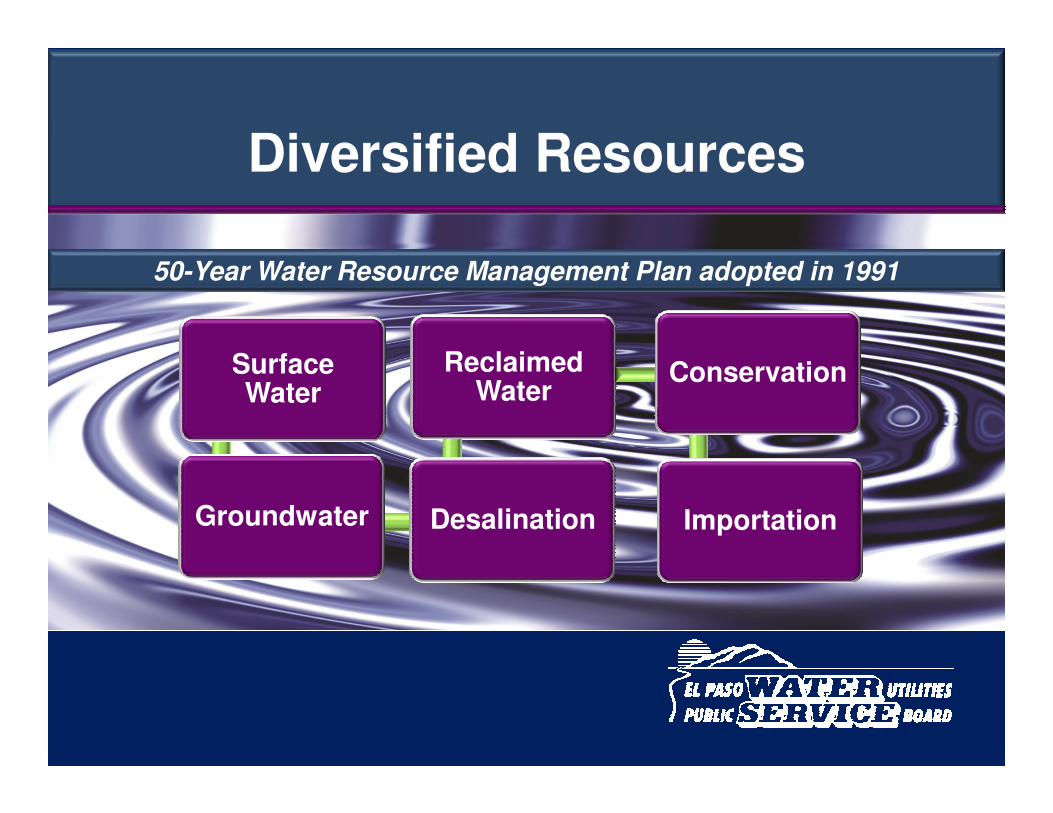
Surface Water
Reclaimed Water
Conservation
Diversified Resources
50-Year Water Resource Management Plan adopted in 1991
Water
Groundwater Desalination Importation
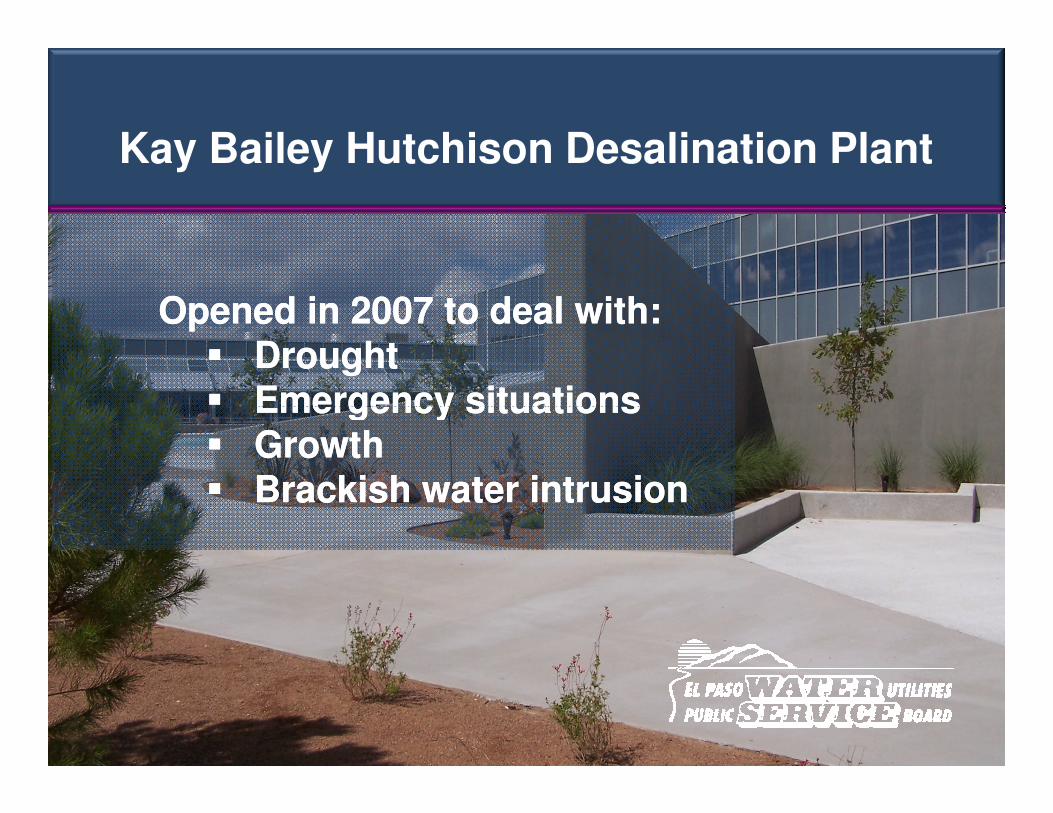
Kay Bailey Hutchison Desalination Plant
Opened in 2007 to deal with:Opened in 2007 to deal with:�� Drought Drought �� EEmergency situations mergency situations �� EEmergency situations mergency situations �� GrowthGrowth�� Brackish water intrusionBrackish water intrusion
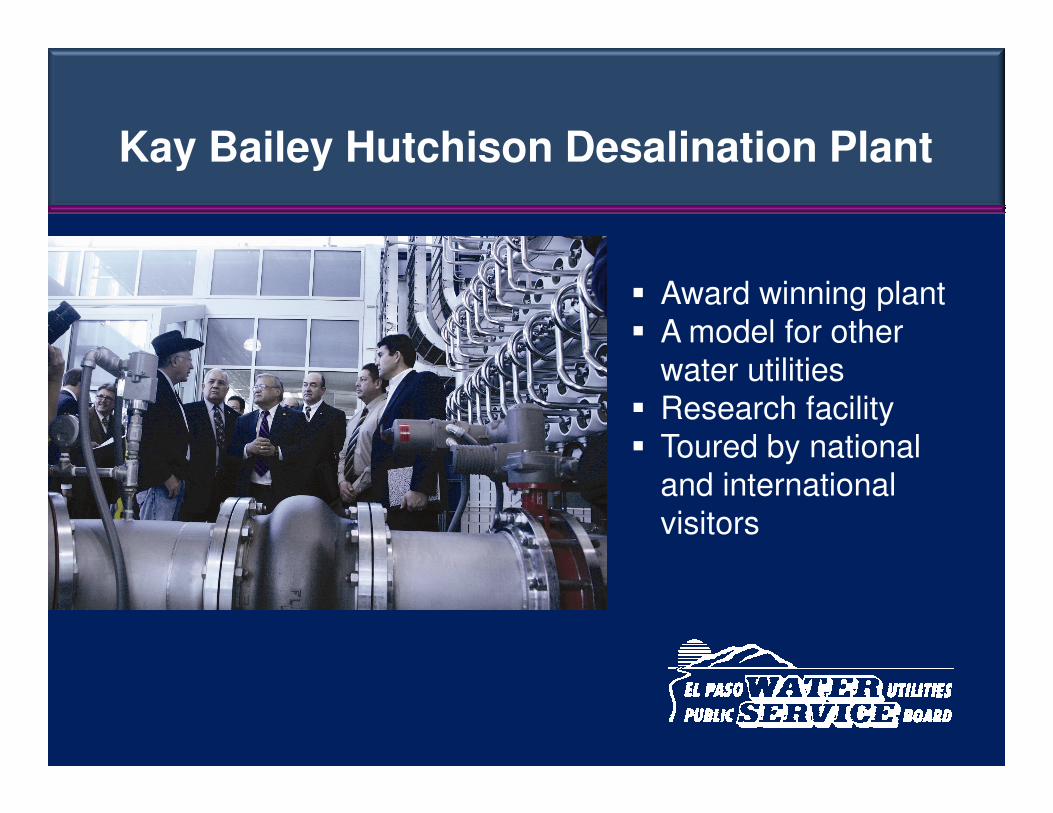
Kay Bailey Hutchison Desalination Plant
� Award winning plant� A model for other
water utilities � Research facility� Research facility� Toured by national
and international visitors
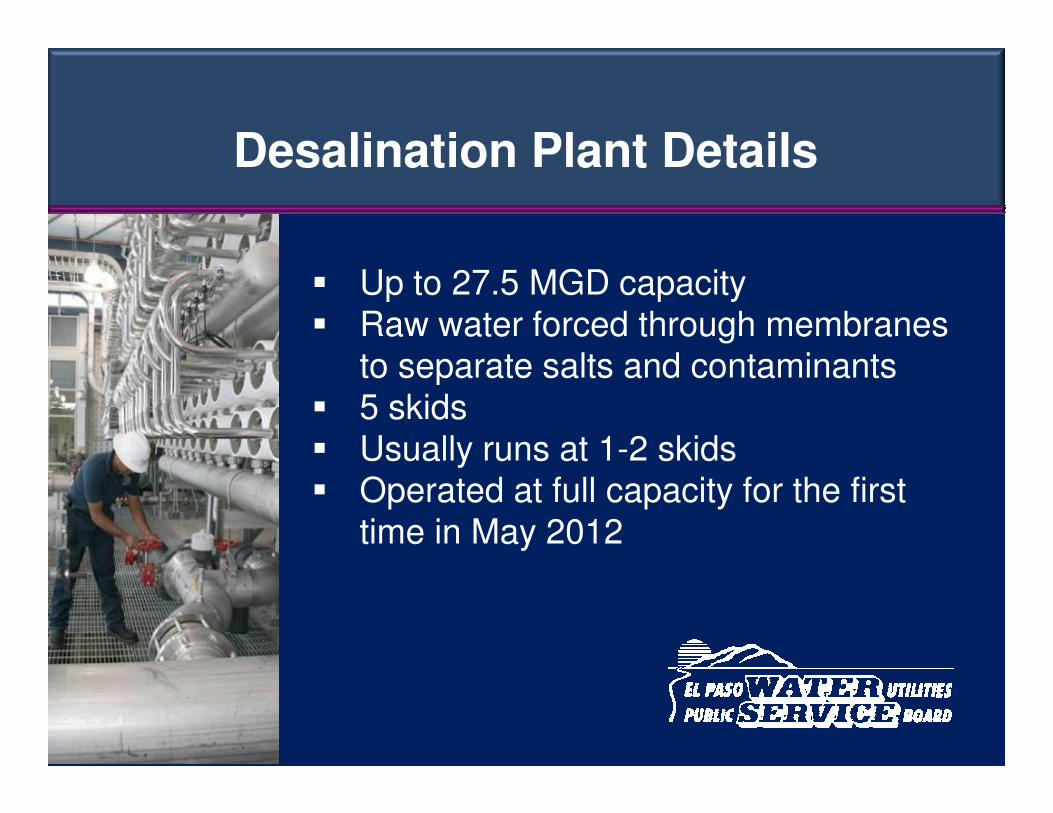
Desalination Plant Details
� Up to 27.5 MGD capacity� Raw water forced through membranes
to separate salts and contaminants � 5 skids� 5 skids� Usually runs at 1-2 skids � Operated at full capacity for the first
time in May 2012
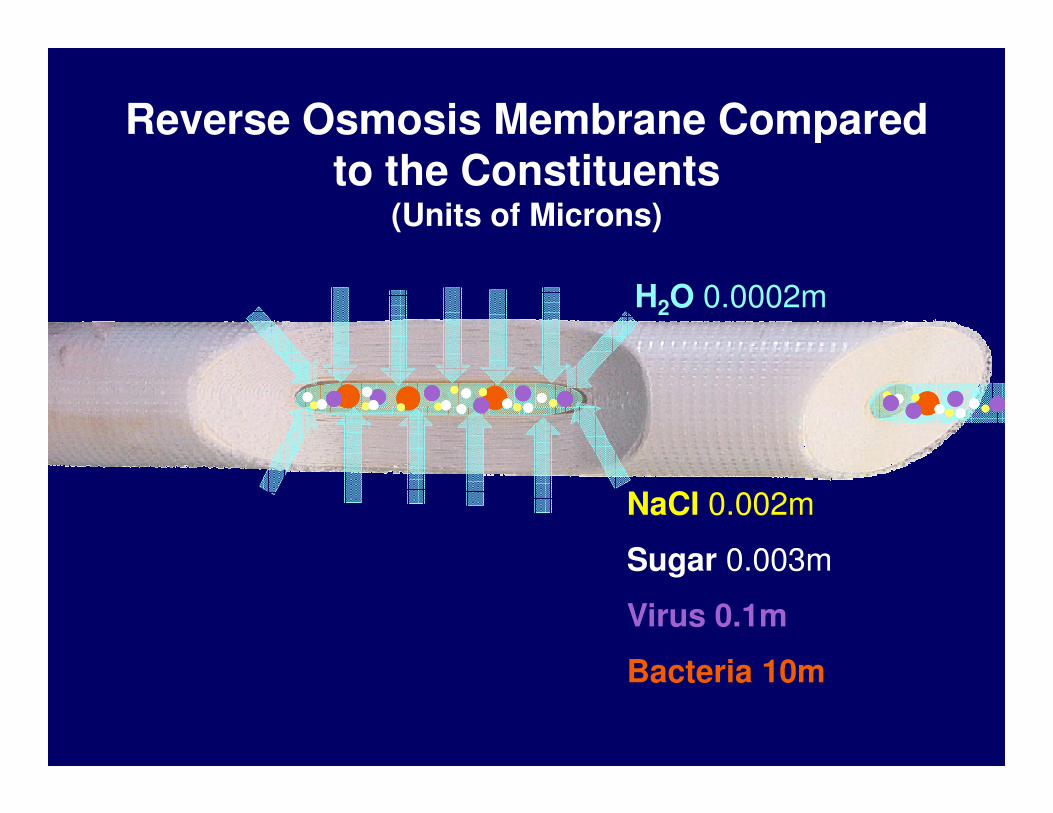
H2O 0.0002m
Reverse Osmosis Membrane Compared to the Constituents
(Units of Microns)
NaCI 0.002m
Sugar 0.003m
Virus 0.1m
Bacteria 10m
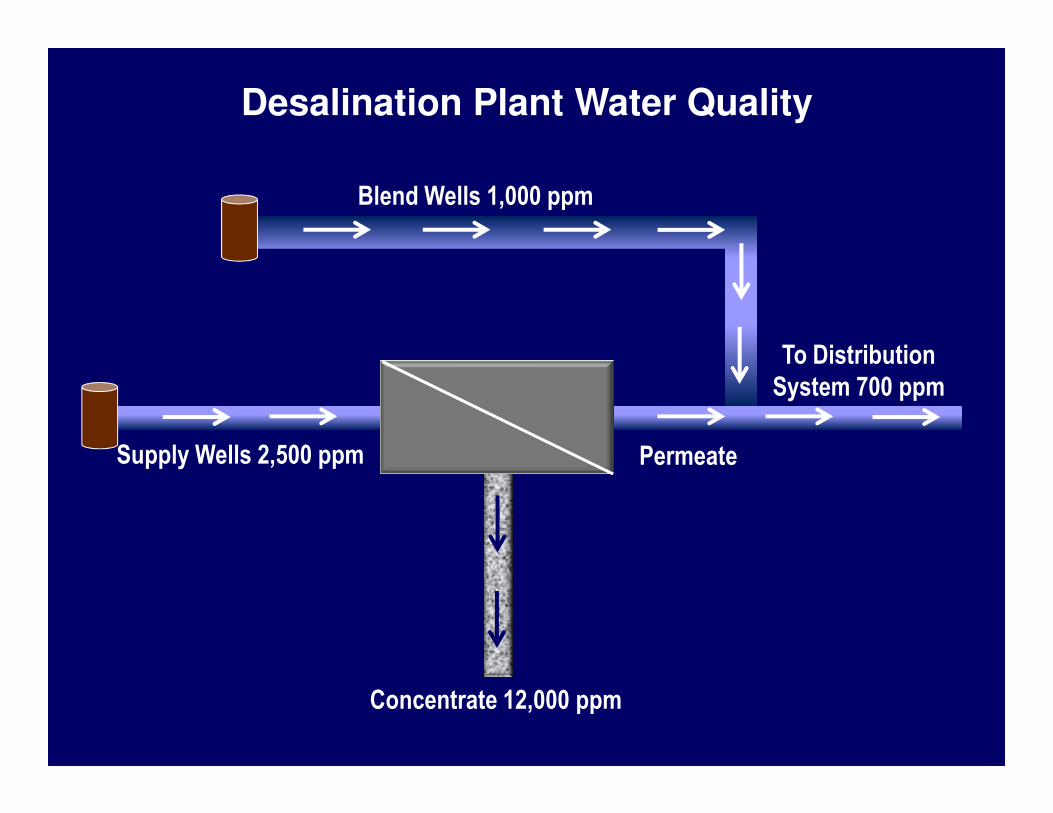
Blend Wells 1,000 ppm
To Distribution System 700 ppm
Desalination Plant Water Quality
Supply Wells 2,500 ppm
Concentrate 12,000 ppm
Permeate
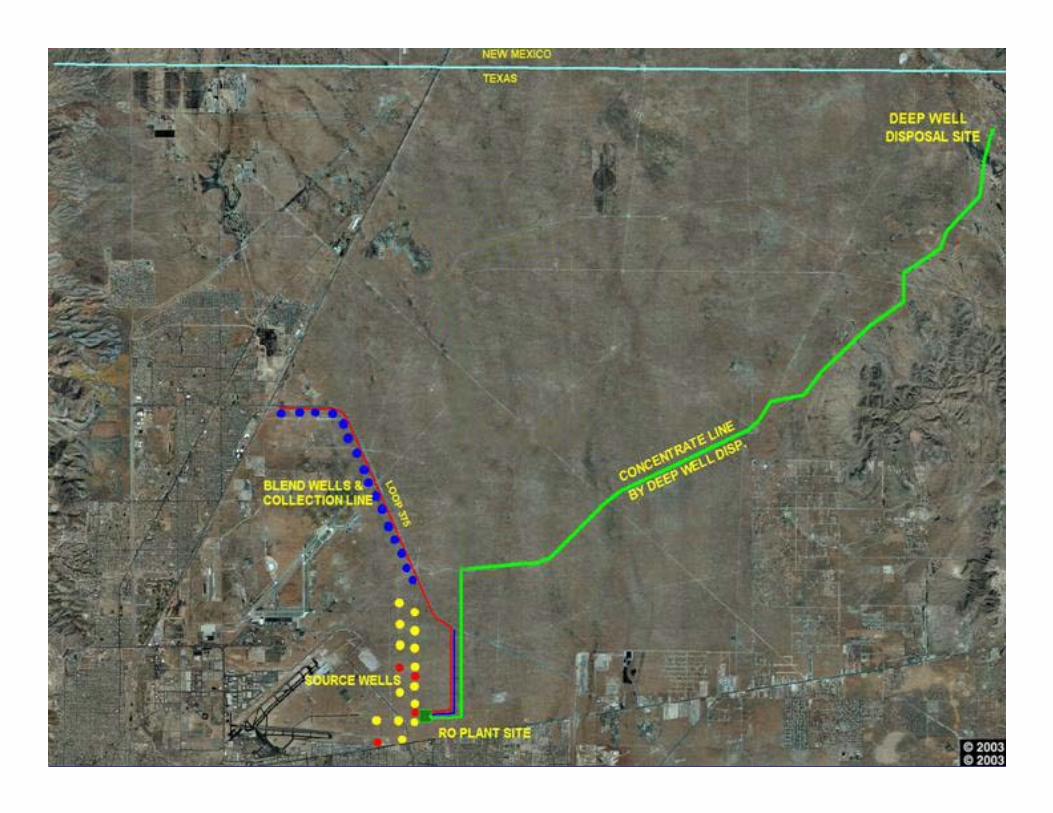
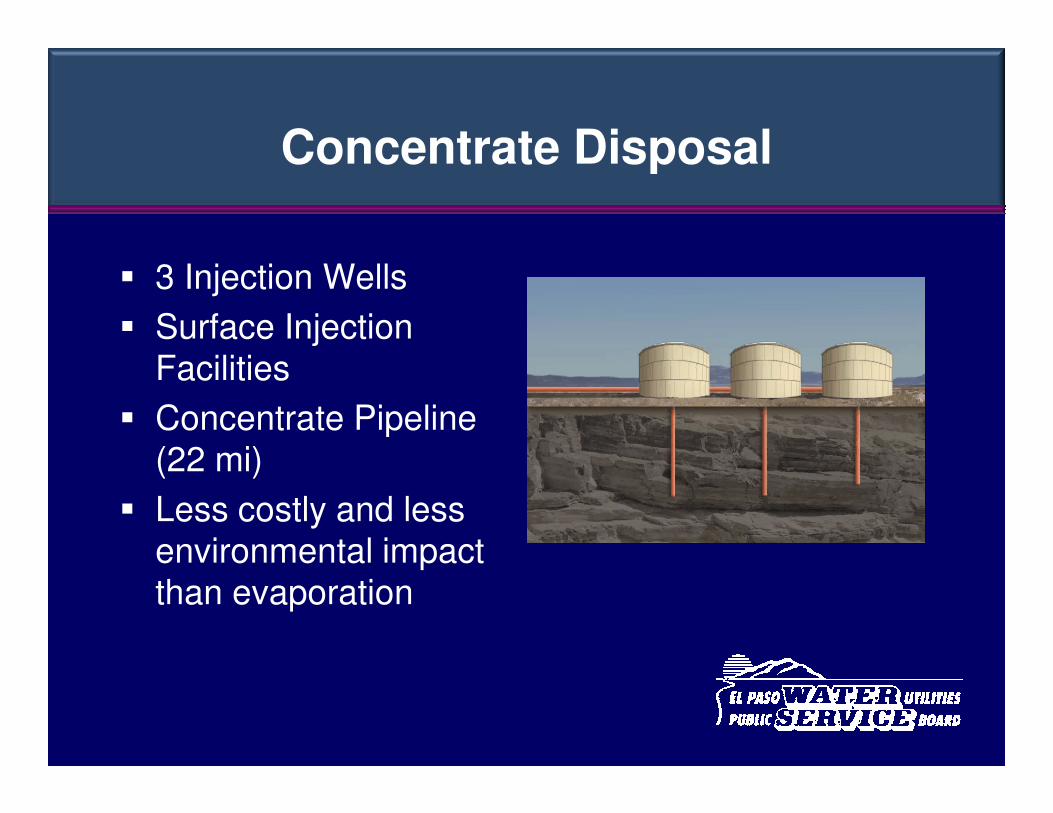
Concentrate Disposal
� 3 Injection Wells
� Surface Injection Facilities
� Concentrate Pipeline � Concentrate Pipeline (22 mi)
� Less costly and less environmental impact than evaporation
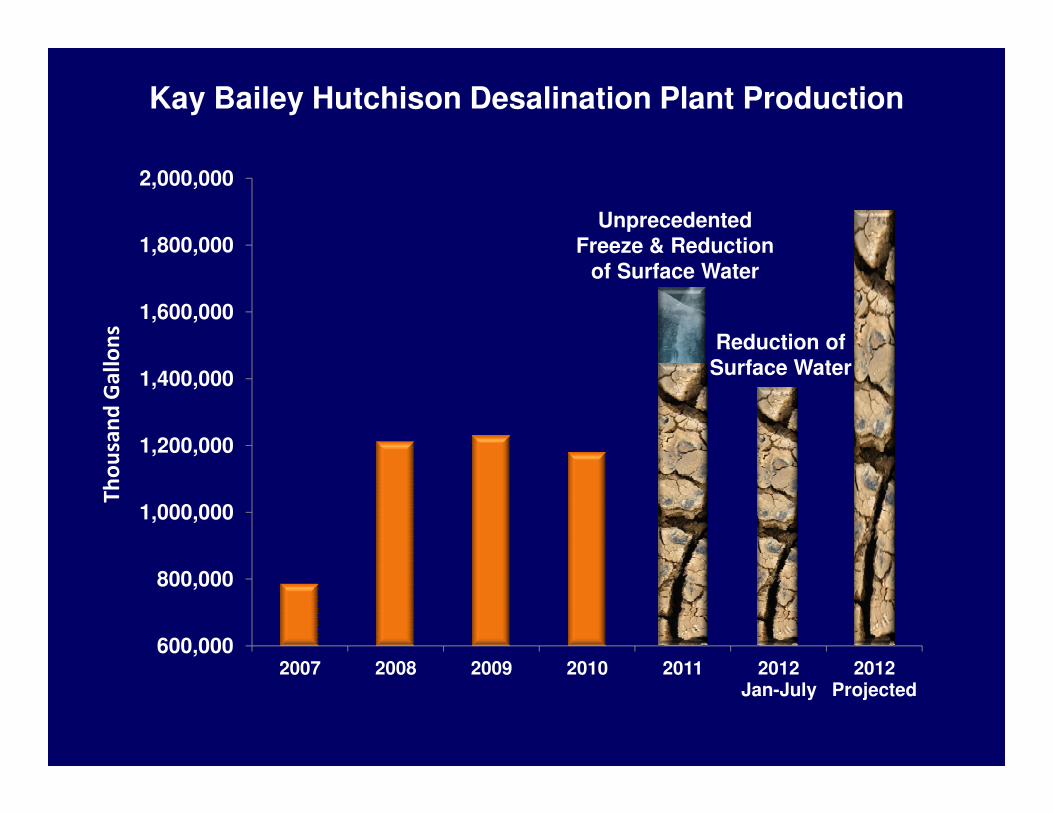
Kay Bailey Hutchison Desalination Plant Production
1,400,000
1,600,000
1,800,000
2,000,000
Unprecedented Freeze & Reduction
of Surface Water
Th
ou
san
d G
all
on
s
Reduction ofSurface Water
600,000
800,000
1,000,000
1,200,000
2007 2008 2009 2010 2011 2012 Jan-July
2012 Projected
Th
ou
san
d G
all
on
s
80
100
120
140
160
Mil
lio
n G
all
on
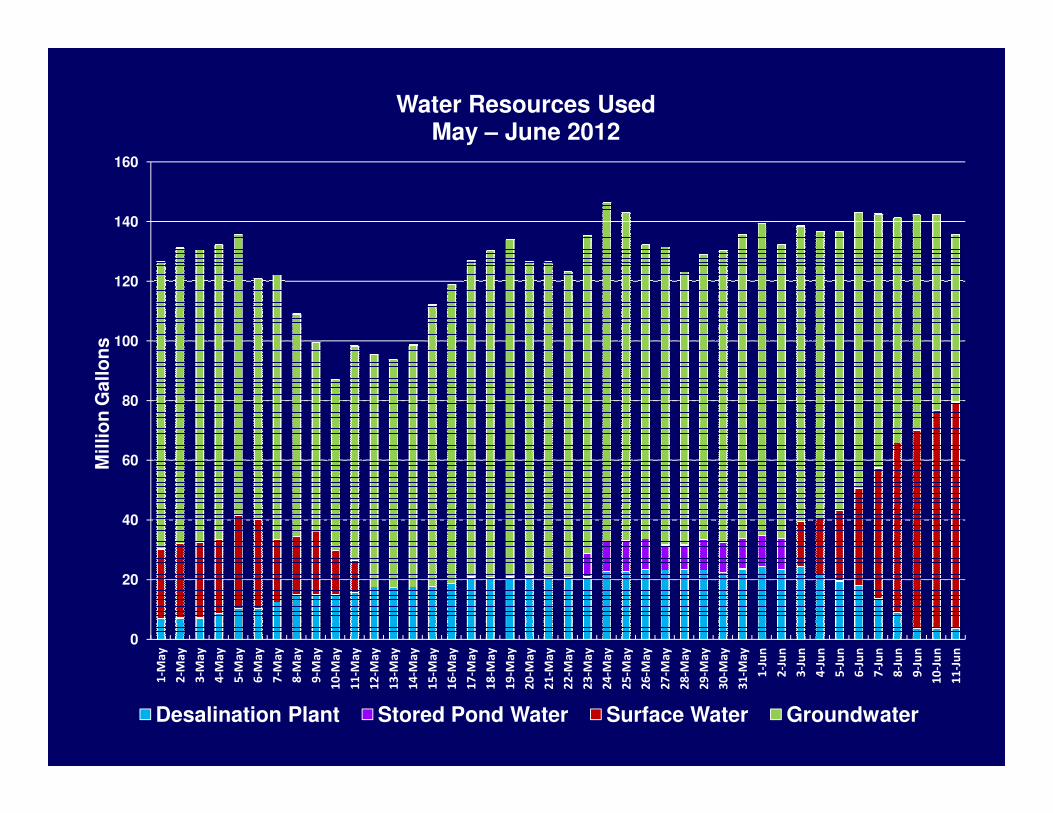
sWater Resources Used
May – June 2012
0
20
40
60
80
1-M
ay
2-M
ay
3-M
ay
4-M
ay
5-M
ay
6-M
ay
7-M
ay
8-M
ay
9-M
ay
10
-Ma
y
11
-Ma
y
12
-Ma
y
13
-Ma
y
14
-Ma
y
15
-Ma
y
16
-Ma
y
17
-Ma
y
18
-Ma
y
19
-Ma
y
20
-Ma
y
21
-Ma
y
22
-Ma
y
23
-Ma
y
24
-Ma
y
25
-Ma
y
26
-Ma
y
27
-Ma
y
28
-Ma
y
29
-Ma
y
30
-Ma
y
31
-Ma
y
1-J
un
2-J
un
3-J
un
4-J
un
5-J
un
6-J
un
7-J
un
8-J
un
9-J
un
10
-Ju
n
11
-Ju
n
Mil
lio
n G
all
on
s
Desalination Plant Stored Pond Water Surface Water Groundwater
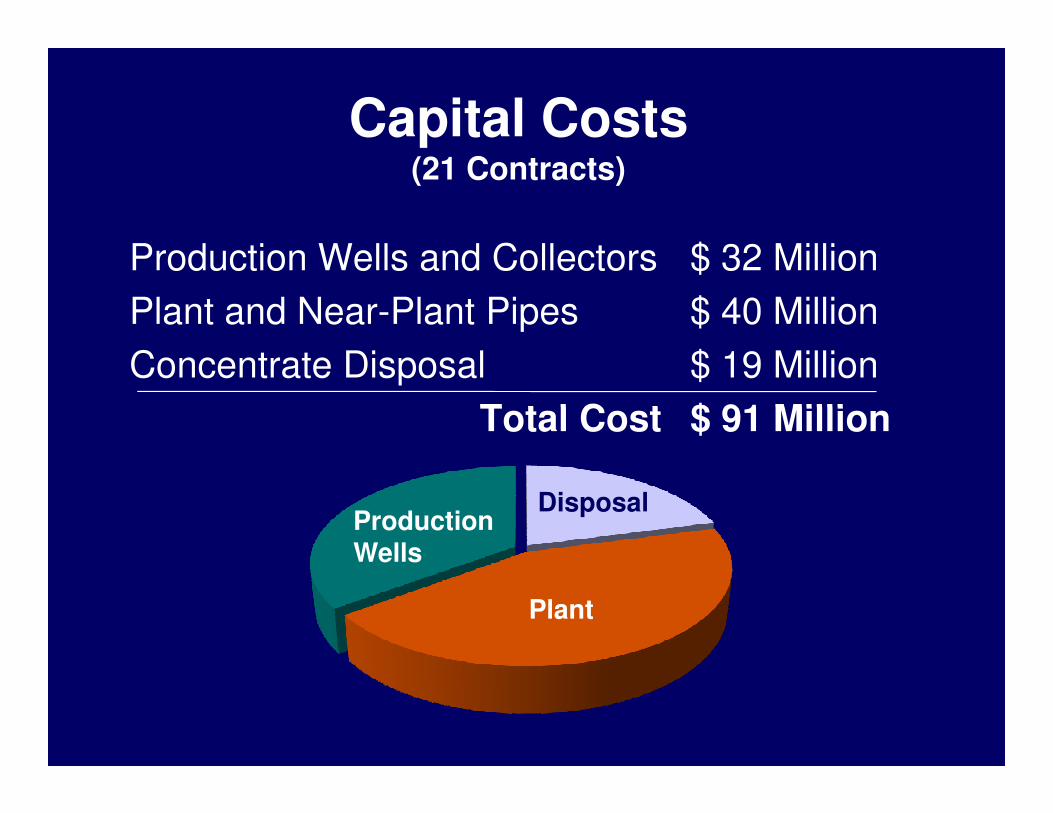
Capital Costs(21 Contracts)
Production Wells and Collectors
Plant and Near-Plant Pipes
Concentrate Disposal
Total Cost
$ 32 Million
$ 40 Million
$ 19 Million
$ 91 MillionTotal Cost $ 91 Million
DisposalProduction Wells
Plant
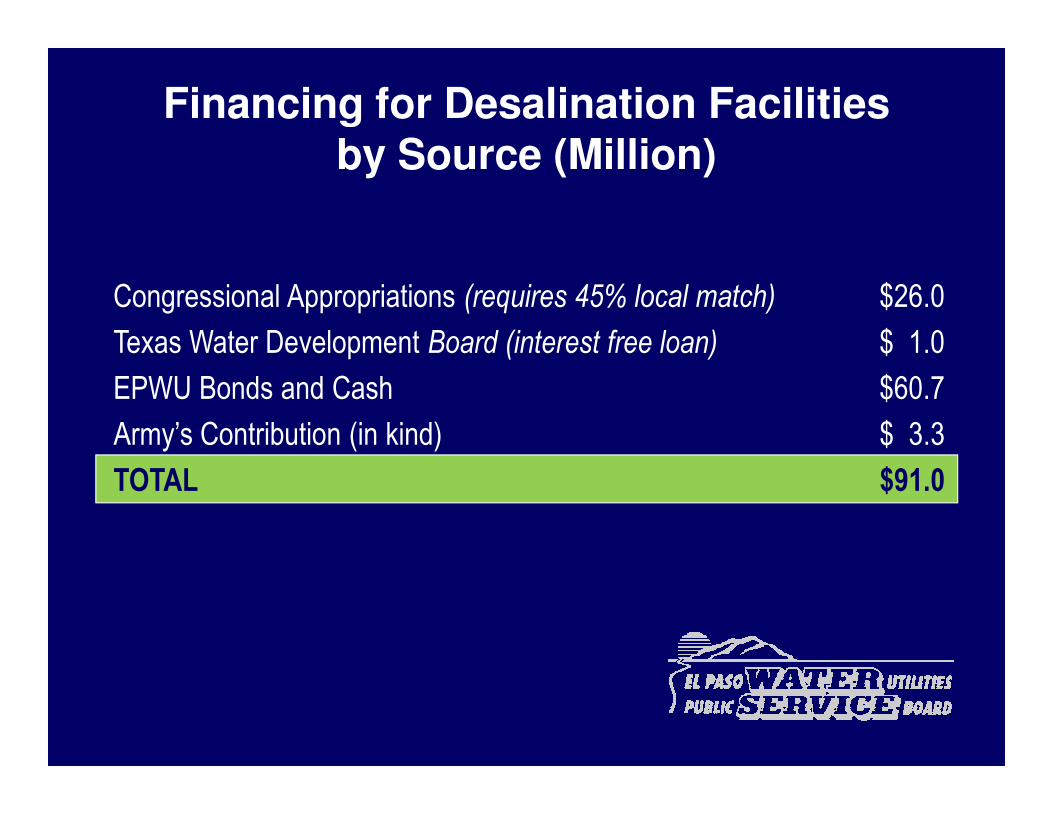
Congressional Appropriations (requires 45% local match) $26.0
Texas Water Development Board (interest free loan) $ 1.0
EPWU Bonds and Cash $60.7
Financing for Desalination Facilities by Source (Million)
Army’s Contribution (in kind) $ 3.3
TOTAL $91.0
$2.50
$3.00
$3.50
$4.00
$4.50
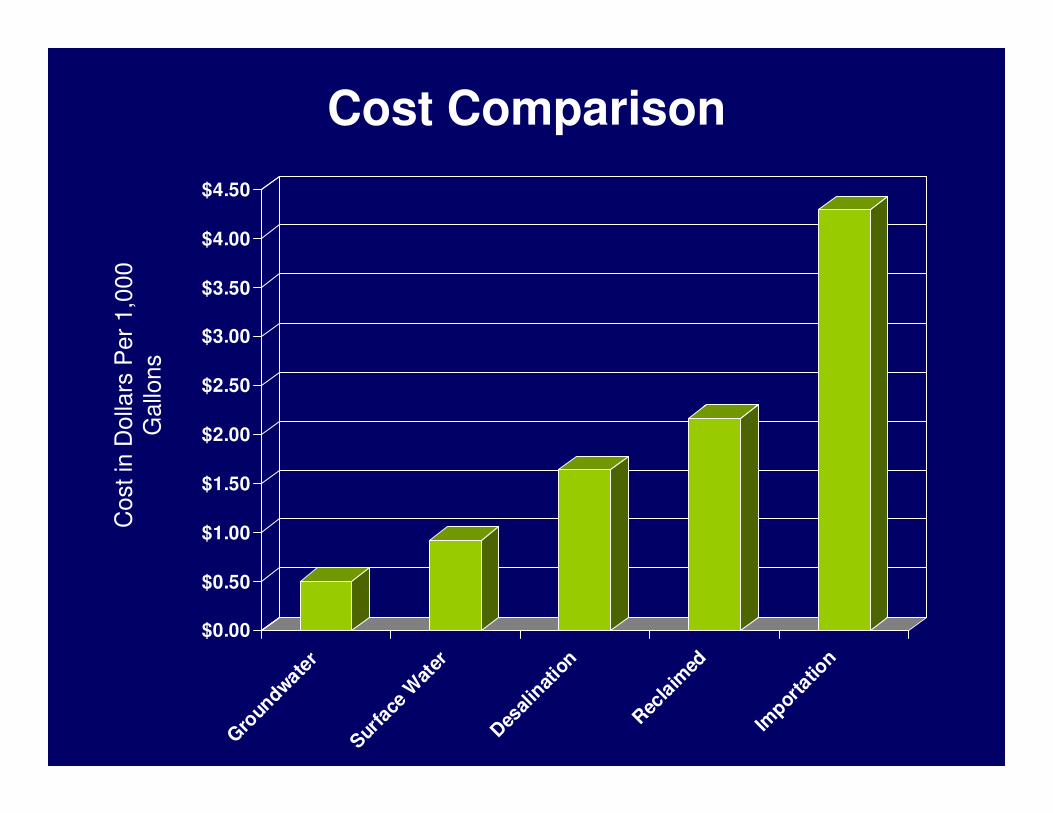
Cost ComparisonC
ost in
Dolla
rs P
er
1,0
00
Gallo
ns
$0.00
$0.50
$1.00
$1.50
$2.00
Gro
undw
ater
Surfa
ce W
ater
Des
alin
atio
n
Rec
laim
ed
Impor
tatio
n
Cost in
Dolla
rs P
er
1,0
00
Gallo
ns
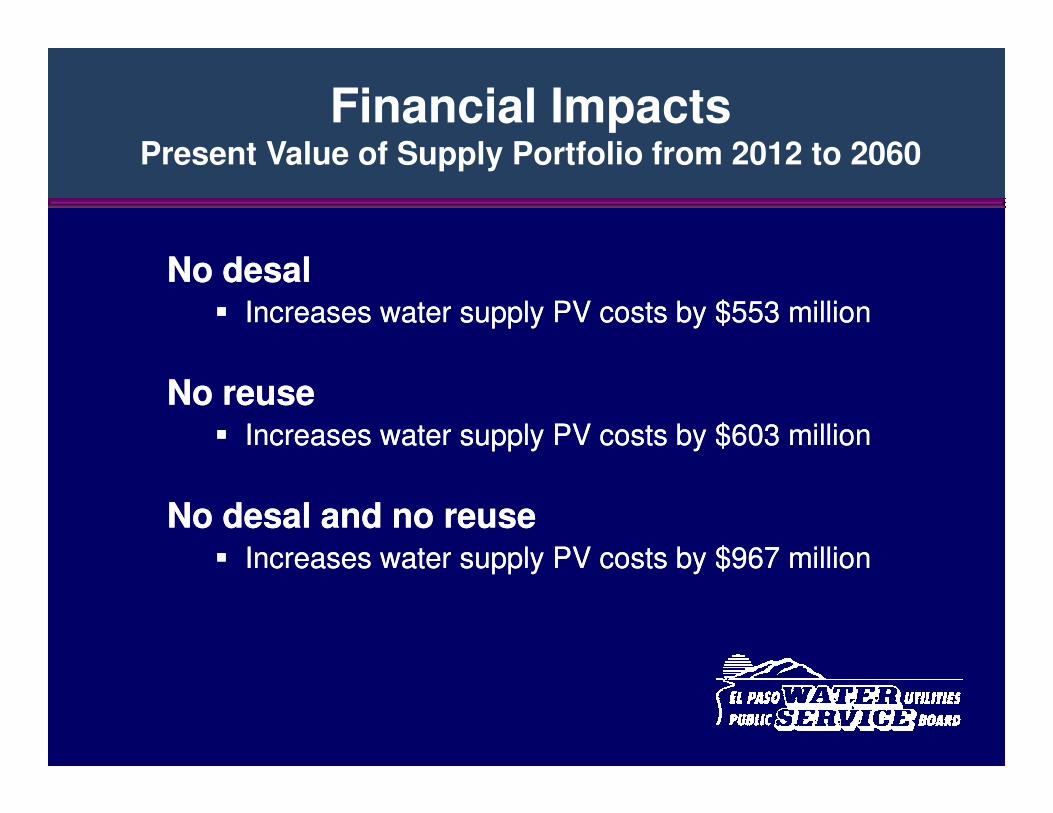
Financial ImpactsPresent Value of Supply Portfolio from 2012 to 2060
No desalNo desal�� Increases water supply PV costs by $553 millionIncreases water supply PV costs by $553 million
No reuseNo reuseNo reuseNo reuse�� Increases water supply PV costs by Increases water supply PV costs by $603 $603 millionmillion
No No desal and no reusedesal and no reuse�� Increases water supply PV costs by Increases water supply PV costs by $967 $967 millionmillion
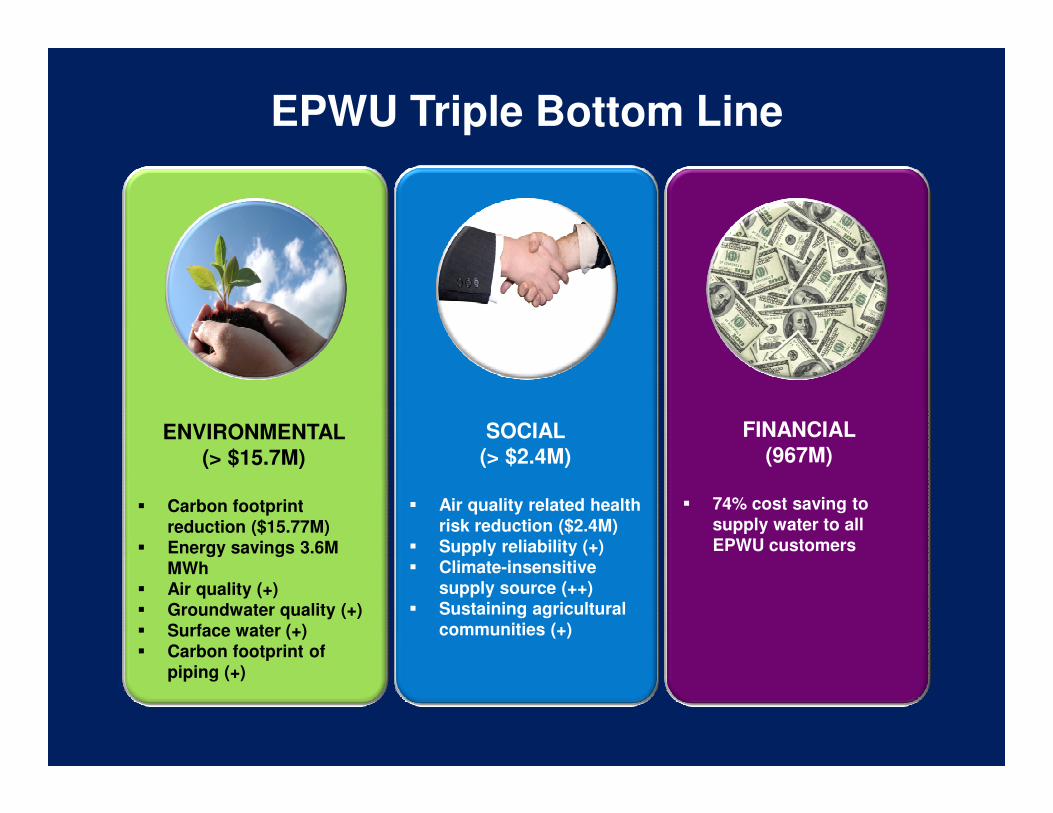
EPWU Triple Bottom Line
ENVIRONMENTAL (> $15.7M)
� Carbon footprint reduction ($15.77M)
� Energy savings 3.6M MWh
� Air quality (+)� Groundwater quality (+)� Surface water (+)� Carbon footprint of
piping (+)
SOCIAL (> $2.4M)
� Air quality related health risk reduction ($2.4M)
� Supply reliability (+)� Climate-insensitive
supply source (++)� Sustaining agricultural
communities (+)
FINANCIAL (967M)
� 74% cost saving to supply water to all EPWU customers
Summary
� A diversified water resource strategy is key� Desalination, reuse and conservation can
be effective management tools� Desalination costs have decreased
substantiallysubstantially� Desalination and reuse are much more
cost-efficient than importation

For More Information Contact
Ed Archuleta, P.E. President & CEOEl Paso Water UtilitiesEl Paso Water UtilitiesOffice: 915.594.5501


![David Archuleta - Crush [6] Originial](https://img.pdfslide.us/doc/110x75/55284c264a7959b3448b46cd/david-archuleta-crush-6-originial.jpg)