Embed Size (px)
Citation preview

The 13th Scandinavian International Conference on Fluid Power, SICFP2013, June 3-5, 2013, Linköping, Sweden
A Case Study on Quantifying the Workload of Working Machine Operators by Means of Psychophysiological Measurements
R. Filla1, E. M. G. Olsson2, B. H. C. von Schéele3, and K. Ohlsson4
1Emerging Technologies, Volvo Construction Equipment, Eskilstuna, Sweden E-mail: [email protected]
2Department of Public Health and Caring Sciences, Uppsala University, Uppsala, Sweden
E-mail: [email protected]
3Stress Medicine AB, Bergvik, Sweden E-mail: [email protected]
4Department of Management and Engineering, Linköping University, Linköping, Sweden
E-mail: [email protected]
Abstract In this study of eighteen wheel loader operators, test-driving a machine in three different traction force settings, we examine if a workload index derived from psychophysiological measurements of heart rate, finger temperature, skin conductance, respiration rate and end-tidal CO2-concentration in exhaled air can be easily used to assess operator workload in sufficient detail to use it as a complement to traditional subjective evaluations in machine testing, either of real machines or in a human-in-the-loop simulator. In a longer perspective, such measurements are expected to play a role in a workload-adaptive operator assistance system.
However, the findings do not give support for this vision. Instead they indicate that other types of measurements than what have been used in our study should be employed if ease of use for practitioners such as test engineers is in focus, but also that other factors than just machine operability must be considered to have a great influence on the operator workload.
Keywords: operator, working machines, wheel loaders, operator workload, stress, operability, human-machine interaction
1 Introduction Working machines in construction, mining, agriculture, and forestry are not only becoming ever more sophisticated in terms of digital control, but are also complex in architecture. Many of these machines consist of at least two working systems that are used simultaneously and the human operators are essential to the performance of the machines in their working place.
With their productivity and energy efficiency being linked to the operators’ workload, it is essential to make working machines easier to use. The immediate goal of our research is to support product development by complementing the traditional subjective evaluation of a prototype machine’s operability (involving asking the operator to rate the machine according to a specific scale) with a less subjective measure based on the operator’s workload. In order to be usable in product development projects, such a measure needs to be easy to derive for a test engineer who is not a
trained researcher in the field of psychophysiology. Ideally, this measure would be calculated automatically and online in order to be available during or immediately after testing.
This article will report on the setup and results of a larger study conducted to investigate if common psychophysio-logical measurements of finger temperature, heart rate, respiratory rate, CO2 concentration in exhaled air, and galvanic skin response can be used to quantify the workload of wheel loader operators during operation of the machine.
In a longer perspective, such measurements might be employed for giving workload-adaptive assistance to the machine operator.
2 Wheel loader application and challenges In our on-going research, a wheel loader was chosen as the object of study, although working machines of similar complexity and with similar challenges can be found in construction, agriculture, forestry and mining.

The short loading cycle shown in Figure 1 is highly repre-sentative of the majority of a wheel loader’s application. Typical of this cycle is bucket loading of granular material (for instance gravel) on an adjacent dump truck (or other load receiver, mobile or stationary) within a time frame of 25-35 seconds, depending on working place setup and how aggressively the operator uses the machine, but also depending on the operator skill. A detailed description with identification of wheel loader working cycles, together with the challenges they present for machine design and operability, can be found in [1].
Figure 1: Short loading cycle.
In Figure 1 the short loading cycle has been divided into ten phases, beginning with bucket filling. Visualising test results obtained in earlier studies, Figure 2 shows that the fuel consumption rate (expressed in volume or mass per time unit) is approximately 60% higher during bucket filling than the cycle average. Expressed in absolute values, bucket filling accounts for 35-40% of the mean total fuel consumption per cycle, yet the time spent on filling the bucket is only 25% of the average cycle time.
Figure 2: Fuel consumption during short loading cycle.
After bucket filling, the operator drives backwards towards the reversing point and steers the wheel loader to accomplish the characteristic V-pattern of a short loading cycle. The lifting function is engaged the whole time. The operator chooses the reversing point such that having arrived at the load receiver and starting to empty the bucket (phase 6 in Figure 1), the lifting height will be sufficient to do so without delay. Figure 2 shows that the fuel consumption rate for phases 2 to 6 is approximately constant and close to the average fuel consumption rate of the complete short loading cycle.
In the remaining phases, the bucket needs to be lowered and the operator steers the wheel loader back to the initial position in order to fill the bucket again in the next cycle. Phases 7-10 are less energy-demanding and the fuel consumption rate is therefore lower than the average for the complete short loading cycle.
The higher fuel consumption rate during bucket filling (as shown in Figure 2) warrants a closer look at this phase. The inner loop in Figure 3 shows how the human operator interacts with the wheel loader. In order to fill the bucket, the operator needs to control three motions simultaneously: a forward motion that also exerts a force (traction), an upward motion (lift) and a rotating motion of the bucket to load as much material as possible (tilt). This is similar to how a simple manual shovel is used. However, in contrast to a manual shovel, the operator of a wheel loader can only observe, and cannot directly control these three motions. Instead, he or she has to use different subsystems of the machine to accomplish the task. The gas pedal controls engine speed, while the lift and tilt levers control valves in the hydraulics system that ultimately control movement of the linkage’s lift and tilt cylinder, respectively.
Figure 3: Simplified power transfer and control scheme of a wheel loader.
The difficulty lies in that no operator control directly affects only one single motion. The gas pedal controls engine speed, which affects both the machine’s longitudinal motion and via the hydraulic pumps also affects the speeds of the lift and tilt cylinders. The linkage between the hydraulic cylinders and the bucket acts as a non-linear planar transmission and due to its design a lift movement will also change the bucket’s tilt angle and a tilt movement affects the bucket edge’s height above the ground.
Furthermore, Figure 3 also shows how in the outer loop the primary power from the diesel engine is split up between
Auxiliaries
Bucket
Wheels
Lifting + Breaking/Tilting
Travelling/PenetrationDrivetrain
Hydraulics
Σ Engine
Linkage
External (+/-)
GravelpileOperatorECU
ECU
ECU
ECU

hydraulics and drive train in order to create lift/tilt movements of the bucket and traction of the wheels, but is connected again when filling the bucket from for example a gravel pile. Figure 4 shows that in this situation, the traction force from the drive train, acting between wheels and ground, creates a reaction force between gravel pile and bucket edge, which in turn creates a moment of forces around the loading arm’s centre of rotation that counteracts the moment of forces created by the push of the lift cylinder.
Figure 4: Force balance during bucket filling.
In effect, the traction force, indirectly controlled by the operator through the engine speed, reduces the available lifting force. Depending on lifting height and applied traction force, the lifting force can be completely cancelled out, and the bucket cannot be moved upwards any further. The operator then has to either apply the tilt function or reduce the traction force by reducing the engine speed – which is rather counter-intuitive as a common mental model of vehicle drivers is that an increase in gas pedal deflection leads to more torque from the engine until any external resistance can be overcome.
In our study, the different machine setups (as described in section 4.1) are using this phenomenon to create machines with three different levels of maximum engine speed during bucket filling, translating to different levels of perceived ease of use, depending on the operators’ individual skills.
Another general challenge for wheel loader operators exists in that the hydraulic levers control the speed of the hydraulic cylinders, not the force exerted by them. In an old-fashioned less energy-efficient hydraulic system of the Open Centre type a higher external load would result in a lower cylinder speed for the same amount of lever actuation. This would give the operator an indication of the external load acting on the cylinder. This is no longer the case in a modern load-sensing hydraulic system.
In summary, there are many interdependencies and it thus takes a certain amount of training to be able to use a wheel loader efficiently and with high productivity. It is therefore of great interest to investigate machine operability closer and to develop operator-assisting functions.
3 Quantifying human workload with psychophysiological measurements
Operating a wheel loader involves both physical and mental workload. Even though the operator sits still and the controls do not demand a large amount of physical strength he/she has to keep balance and be prepared. Mentally the operator has to maintain attention and respond appropriately all the time. Measuring this workload therefore calls for a measure that handles several physiological signals.
As mentioned in the introduction, the short-term goal is to enable test engineers to derive a less subjective measure of how easy a machine is to operate. With the personnel involved in machine testing usually not being trained in performing and analysing measurements of psycho-physiological parameters, the scope needs to be limited to signals that are easy to measure and handle.
There are many aspects of how our physiological systems interact with physical and mental workload. Heart rate (HR) and respiration rate (RR) are classical measures of physical workload where a higher HR and RR result in a better supply of oxygen to the working body. Both HR and RR also interact with mental workload.
Other physiological measures involved mainly in mental workload are skin conductance level (SCL) derived from palm sweat gland release and peripheral temperature (typically measured in fingers), derived from smooth muscles constricting the peripheral blood vessels. A higher workload is associated with higher SCL and lower finger temperature. However, the magnitude of changes is dependent on individual vasoconstriction and sweat gland activities.
All physiological parameters are highly influenced by autonomic nervous system (ANS) activity and mainly by the sympathetic branch but heart rate variability (HRV) and respiratory sinus arrhythmia (the portion of HRV that is related to breathing) are associated with both sympathetic and parasympathetic nervous system activity.
Respiration is regulated in a more complex way which includes cognitive, chemical, and metabolic systems as well as the ANS. When subjected to mental or physical challenges, ventilation increases, which in turn results in a drop in plasma pCO2. The pCO2 level can therefore be used to assess whether breathing is in excess of metabolic demands resulting in a low pCO2, which is the definition of hyperventilation [2]. A change in pCO2 level is the result of changes in RR and/or tidal volume. Some researchers have pointed out that CO2 level can be an advantageous measure of psychosocial stress, since it can differentiate between metabolic and psychosocial demands, which in most other measures generate the same response [3]. The pCO2-level is often, as in our study, measured as end-tidal CO2 (EtCO2) which is satisfactorily correlated to pCO2 and permits assessment of breath by breath variation. The physiological systems mentioned interact with each other in a complex way, cooperating with and compensating for each other [4]. In case of immense stressful events people tend to stop
breathing, with a direct impact on several regulatory systems as a consequence.
4 Method
4.1 Machine setup
The wheel loader used was a Volvo L70F equipped with a general purpose bucket with a load capacity of 2.3m3. The total operating weight of the machine is approximately 13.4t.
In order to study the effect of the previously mentioned interdependencies during bucket filling, the wheel loader software used in this study was modified to limit engine speed, and thus traction force, whenever the transmission’s 1st gear was automatically engaged, which occurs only during bucket filling (all machines normally start in 2nd gear).
The first limitation of engine speed was chosen so that maximum traction force was reduced to 62% in 1st gear, which resulted in a maximum engine speed that was comparable to what expert operators on average used the wheel loader at. This setting also prevented wheel spin. There was a slight impact on the speed of the hydraulic functions (due to the rotational speeds of the engine, torque converter and hydraulic pump being connected, see Figure 3 and the explanation in an earlier section).
In the other condition, engine speed was limited such that maximum traction force was reduced to 47% in 1st gear. We deliberately used an engine speed limit below what was needed for the working task planned, which also affected the speed of the hydraulic functions more noticeably. Furthermore, the maximum obtainable traction force in 1st gear was even lower than what was available in 2nd gear, all of which an operator would experience as clearly negative.
In both conditions the counteracting effect of the traction force is clearly less pronounced so that even at maximum use of the traction force available the lifting force is never cancelled out completely. This should be experienced positively, especially by less experienced operators (but the question is whether this positive aspect outweighs the artificial limitation of maximum available traction force).
The test machine’s automatic functions were set to gear-dependent BSS (Boom Sus-pension System is deactivated when in 1st gear), Automatic Power Shift (automatic gear shifting of the transmission) and Auto Kick-down enabled (automatically changing base gear from 2nd to 1st when needed). We also disabled the function for automatic bucket tilt-in stop at level position.
A more detailed description of the technical setup of our study can be found in [5].
The radio and most of the external displays were turned off in order to not distract the operator from the working task. However, the display for the load weighing system had to stay turned-on and since there were other people and machines present at the proving ground, we also decided to turn on the rear camera monitor for increased safety.
4.2 Apparatus and sensor placements
Our study also included another part, reported in [5] and therefore not further presented here, in which the hypothesis was tested that the operator’s use of the controls available (gas pedal, lift lever and tilt lever) is indicative of a working machine’s operability and that a measure for comparative operability can thus be derived based on the operator’s control commands. That study required essentially the same type of data and equipment (and operators) as the one presented in this article, which led to the decision to run both studies concurrently.
During all sessions various data were recorded off the wheel loader’s CAN bus, onto which data from externally mounted sensors were also merged (thus providing signals of interest that were not readily available in a standard machine). Vector Informatik’s CANcaseXL equipment and CANalyzer software were used for the recording of all traffic on the machine’s CAN bus to a laptop placed inside the cab. The need for particular signals required in some cases modification of the software for engine and transmission control, while in other cases an external ECU (Parker IQAN MDL) was used to place calculated signals on the CAN bus. The latter was also used to acquire additional data from externally mounted sensors for lift and tilt cylinder stroke and lever position for lift and tilt. A modified LoadTronic load weighing system from AADI was used to measure the net weight of the bucket. The data were transmitted to the machine controller via SAE J1587 protocol and then merged into the data stream on the CAN bus.
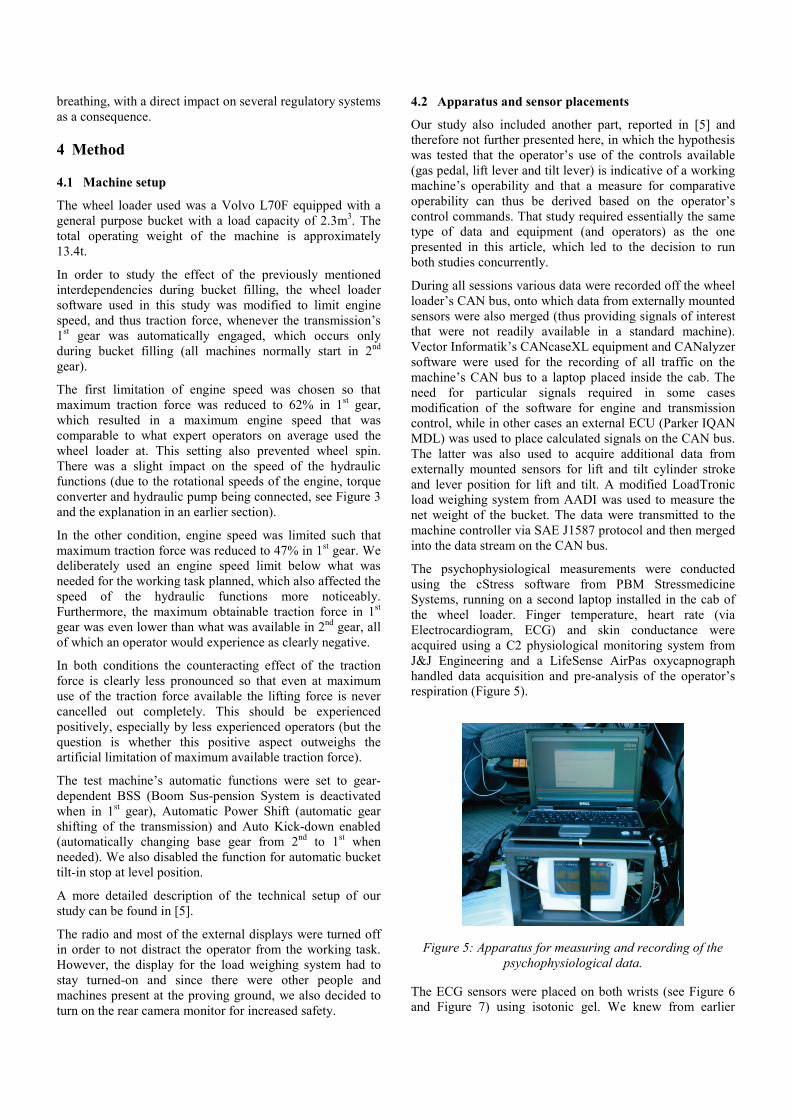
The psychophysiological measurements were conducted using the cStress software from PBM Stressmedicine Systems, running on a second laptop installed in the cab of the wheel loader. Finger temperature, heart rate (via Electrocardiogram, ECG) and skin conductance were acquired using a C2 physiological monitoring system from J&J Engineering and a LifeSense AirPas oxycapnograph handled data acquisition and pre-analysis of the operator’s respiration (Figure 5).
Figure 5: Apparatus for measuring and recording of the psychophysiological data.
The ECG sensors were placed on both wrists (see Figure 6 and Figure 7) using isotonic gel. We knew from earlier

measurements that these sensors need to be secured against relative movement in order to avoid misreadings. Since the operator in a wheel loader cab is exposed to vibrations and accelerations of various frequencies and magnitudes, potentially rendering ECG measurements impossible to perform in this environment, we were pleased to find that good data could be acquired when using the suspended chair’s integrated arm rests to support the operator’s lower arms and asking the operator to control the machine’s articulation angle (for steering) and forward/reverse gear not through the steering wheel and main gear shift lever but by using the controls on the left side of the chair instead (see Figure 7).
Figure 6: Right hand controls and sensor placement on right wrist.
Figure 7: Left hand controls and sensor placement on left wrist and fingers.
Figure 7 also shows the placement of the other sensors. The operator’s finger temperature was acquired by a thermistor taped to the top of the left little finger (the tape did not restrict the blood flow). The sensors for measuring galvanic skin response were attached to the inner phalanges of the ring and middle fingers of the left hand, again using isotonic gel. The operator’s respiration was sampled by a nasal sample line, inserted some millimetres into the left nostril; in connection with this the operator was asked to exclusively breathe through the nose.
All tests were also recorded on video using an externally placed digital video camera and later synchronised with all other acquired data. Synchronising video to CAN data was possible by using stationary points in the recorded data for
bucket height and wheel speed. Synchronisation of machine data (recorded in CANalyzer) and psychophysiological data (recorded in cStress) proved a little more challenging. In the end we chose an offline semi-manual approach: at the beginning and end of each test recording we would press two buttons simultaneously, where activation of the first button was logged on the CAN bus and the other logged as an event in cStress. These synchronisation markers were later used to automatically merge both data streams.
A simple kitchen timer counted backwards and sounded an alarm when the required operating time was reached. Both the timer and all measuring equipment were placed so that the operator was unable to look at the displays.
4.3 Working cycle
With the intriguing facts visualised in Figure 2 (fuel consumption in a loading cycle), Figure 3 (hydraulics and drivetrain as parallel power systems), and Figure 4 (interaction of traction force and hydraulics) in mind, we specifically wanted to study the wheel loader operator during the bucket filling phase. We therefore chose to modify the short loading cycle such that the operator was instructed to still go through most of the motions, but not to use steering (as mentioned previously) and thus empty the bucket at the same spot where it was filled. Since the material used was sorted gravel which does not stick together like for example clay, and is thus fairly easy to handle, this procedure did not introduce any skewing of the test results as far as the bucket filling phase is concerned.
Not using steering also solved another problem that would have had an impact on the results: inexperienced operators are unused to using the joystick rather than the steering wheel, and forcing them to do so would have introduced additional workload, thus potentially skewing the test results. The decision not to use the steering function at all solved this dilemma.
4.4 Psychophysiological Stress Profile
Every human being has an individual response to workload, which means that some sort of reference or calibration is needed in order to be able to correctly evaluate the results of psychophysiological measurements. While not common procedure in the research community, establishing a PSP (Psychophysiological Stress Profile) has proven to be valuable in our (Olsson and von Schéele) clinical work with patients with stress-related dysfunctions.
The PSP shown in Table 1 is essentially taken from [6] and has been implemented in the cStress software. It contains 15 minutes of data recording, guiding the patient (or in our case the wheel loader operator) through six steps.
In step 1 we provided the operator with a neutral text to read, informing him that this was not an exam and while we asked him to read carefully and try to understand the text, he was not required to read all of it or even remember anything. This put some workload on the operator, but far from enough to induce stress. (In our case the text handed out was a newspaper article about the Nobel Prize for Literature and
whether receiving it means the end of an author’s career – it is fair to state that this text was neutral as none of the operators got overly excited by reading it).
Table 1: Psychophysiological Stress Profile (PSP)
# Designation Time Description 1 Base line 3 min Relaxed silent reading of a neutral
text 2 Deep breathing 2 min Deep breathing under guidance,
approx. 6 bpm 3 Nonverbal
stress 2+2 min Two periods of thinking about a
stressful situation, feedback and guidance in-between
4 Relaxing 2 min Relaxing with closed eyes, normal breathing
5 Math stress 2 min Counting aloud backwards from 2500 in steps of 7
6 Relaxing 2 min Relaxing with closed eyes, normal breathing
During step 2 the person was guided to breathe slowly and deeply (using the stomach) with about 6 breaths per minute (with small individual deviations), and by this means attained a very relaxed state.
Step 3 is called “Verbal stress” in [6] and according to that paper in the first half of this step the person is to be instructed to relate some stressful event that they have experienced. During the second half, the person shall then, instead of talking, just think about the same negative and stressful event. However, in our case the test leader (Filla) is a close colleague and personal friend of all of the operators, who in turn were not patients with psychological problems in need of treatment. Therefore, modifying this step into a phase of non-verbal stress seemed more appropriate. At the beginning of this step we therefore asked the operator to think of a negative and stressful event, real or imaginary, and keep thinking of it for two minutes. After this time the test leader approached the person again, gave feedback and asked him to continue for two more minutes, but this time to also breathe irregularly as if was stressed.
In the following phase, step 4, the operator was asked to close his eyes and just relax thoroughly, using individual techniques without any other requirement e.g. on breathing. The results show how quickly the person recovers from stress.
In step 5 the person was tested for reaction to directly induced stress, coming from the requirement to count aloud backwards from 2500 in steps of 7. To increase the pressure the operator was told that it would be noted how many subtractions he would manage to perform during the two minutes of testing and that each mistake would be noted, required to correct before being allowed to continue. (It was interesting to see that this indeed induced an enormous amount of stress in some individuals, but not all.)
Step 6, the last step within the PSP, is a repetition of step 4, i.e. relaxing without any other requirement.
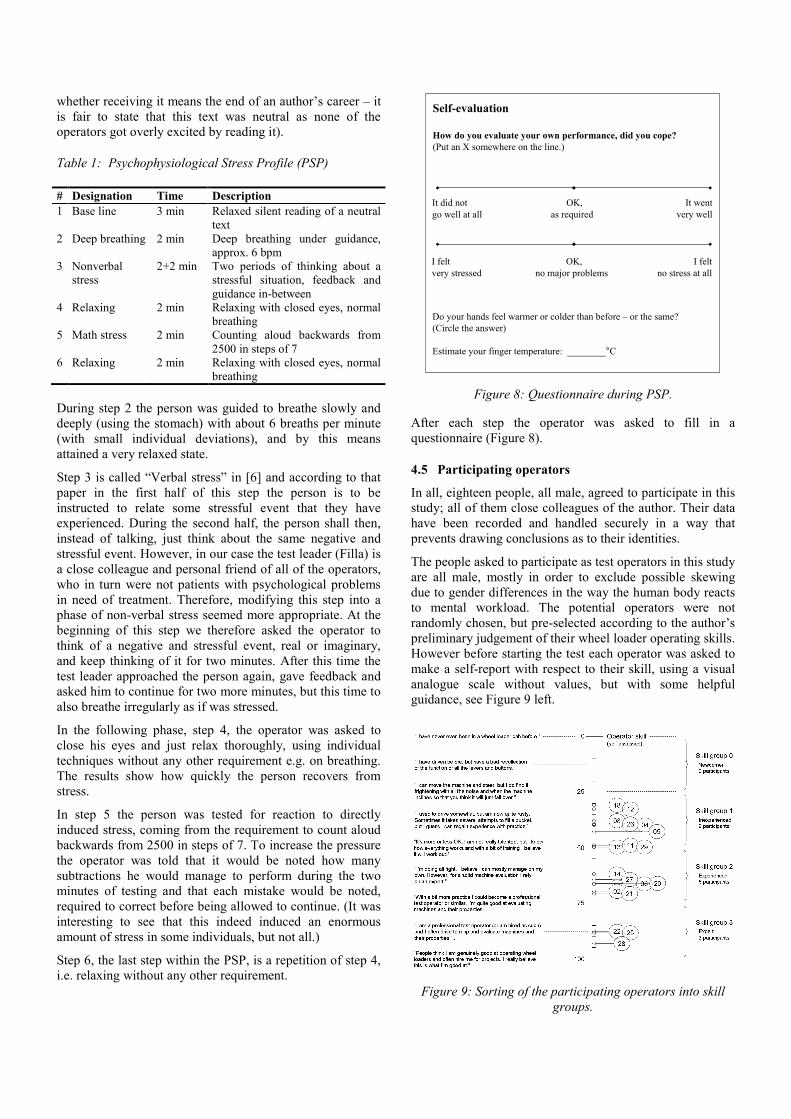
Figure 8: Questionnaire during PSP.
After each step the operator was asked to fill in a questionnaire (Figure 8).
4.5 Participating operators
In all, eighteen people, all male, agreed to participate in this study; all of them close colleagues of the author. Their data have been recorded and handled securely in a way that prevents drawing conclusions as to their identities.
The people asked to participate as test operators in this study are all male, mostly in order to exclude possible skewing due to gender differences in the way the human body reacts to mental workload. The potential operators were not randomly chosen, but pre-selected according to the author’s preliminary judgement of their wheel loader operating skills. However before starting the test each operator was asked to make a self-report with respect to their skill, using a visual analogue scale without values, but with some helpful guidance, see Figure 9 left.
Figure 9: Sorting of the participating operators into skill groups.
Self-evaluation
How do you evaluate your own performance, did you cope? (Put an X somewhere on the line.)
It did not OK, It wentgo well at all as required very well
I felt OK, I feltvery stressed no major problems no stress at all
Do your hands feel warmer or colder than before – or the same? (Circle the answer)
Estimate your finger temperature: ________°C
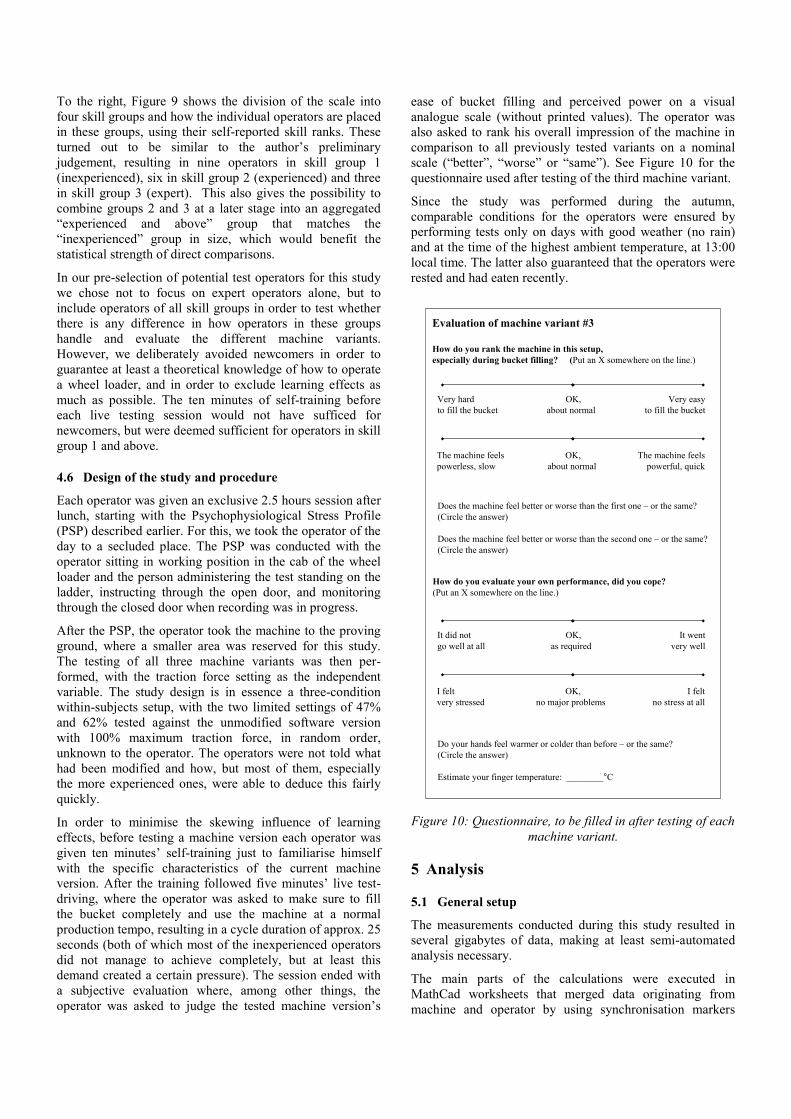
To the right, Figure 9 shows the division of the scale into four skill groups and how the individual operators are placed in these groups, using their self-reported skill ranks. These turned out to be similar to the author’s preliminary judgement, resulting in nine operators in skill group 1 (inexperienced), six in skill group 2 (experienced) and three in skill group 3 (expert). This also gives the possibility to combine groups 2 and 3 at a later stage into an aggregated “experienced and above” group that matches the “inexperienced” group in size, which would benefit the statistical strength of direct comparisons.
In our pre-selection of potential test operators for this study we chose not to focus on expert operators alone, but to include operators of all skill groups in order to test whether there is any difference in how operators in these groups handle and evaluate the different machine variants. However, we deliberately avoided newcomers in order to guarantee at least a theoretical knowledge of how to operate a wheel loader, and in order to exclude learning effects as much as possible. The ten minutes of self-training before each live testing session would not have sufficed for newcomers, but were deemed sufficient for operators in skill group 1 and above.
4.6 Design of the study and procedure
Each operator was given an exclusive 2.5 hours session after lunch, starting with the Psychophysiological Stress Profile (PSP) described earlier. For this, we took the operator of the day to a secluded place. The PSP was conducted with the operator sitting in working position in the cab of the wheel loader and the person administering the test standing on the ladder, instructing through the open door, and monitoring through the closed door when recording was in progress.
After the PSP, the operator took the machine to the proving ground, where a smaller area was reserved for this study. The testing of all three machine variants was then per-formed, with the traction force setting as the independent variable. The study design is in essence a three-condition within-subjects setup, with the two limited settings of 47% and 62% tested against the unmodified software version with 100% maximum traction force, in random order, unknown to the operator. The operators were not told what had been modified and how, but most of them, especially the more experienced ones, were able to deduce this fairly quickly.
In order to minimise the skewing influence of learning effects, before testing a machine version each operator was given ten minutes’ self-training just to familiarise himself with the specific characteristics of the current machine version. After the training followed five minutes’ live test-driving, where the operator was asked to make sure to fill the bucket completely and use the machine at a normal production tempo, resulting in a cycle duration of approx. 25 seconds (both of which most of the inexperienced operators did not manage to achieve completely, but at least this demand created a certain pressure). The session ended with a subjective evaluation where, among other things, the operator was asked to judge the tested machine version’s
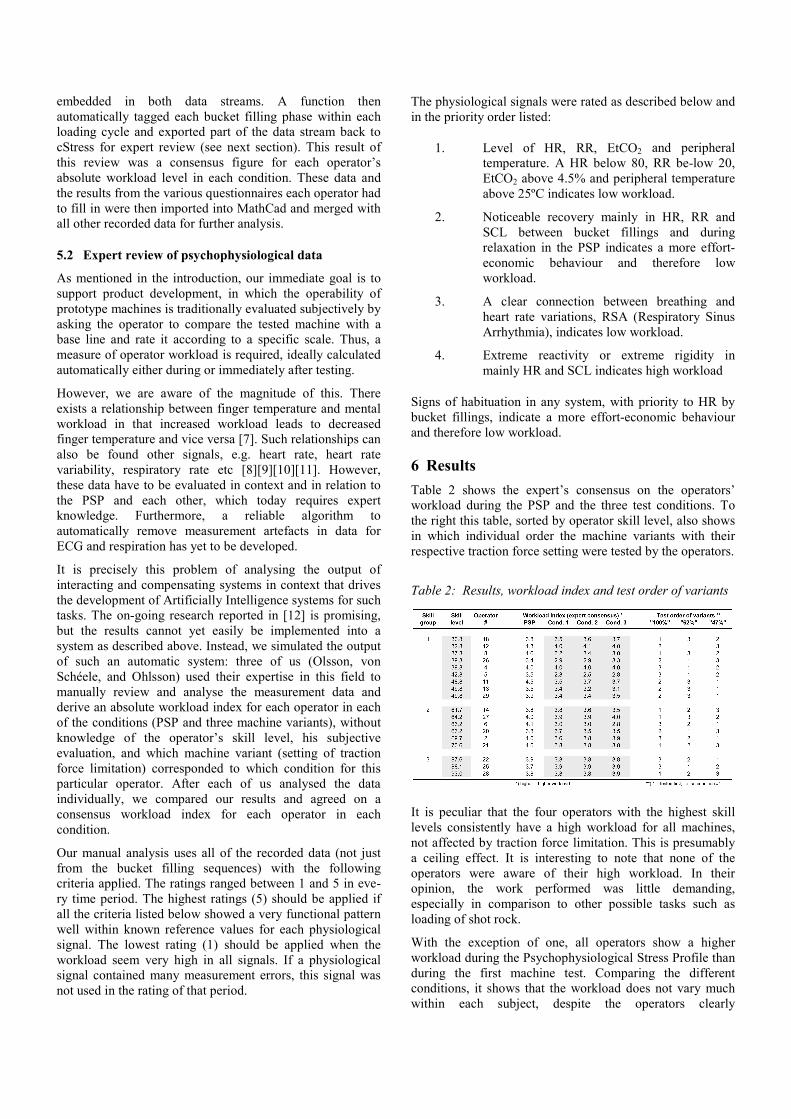
ease of bucket filling and perceived power on a visual analogue scale (without printed values). The operator was also asked to rank his overall impression of the machine in comparison to all previously tested variants on a nominal scale (“better”, “worse” or “same”). See Figure 10 for the questionnaire used after testing of the third machine variant.
Since the study was performed during the autumn, comparable conditions for the operators were ensured by performing tests only on days with good weather (no rain) and at the time of the highest ambient temperature, at 13:00 local time. The latter also guaranteed that the operators were rested and had eaten recently.
Figure 10: Questionnaire, to be filled in after testing of each machine variant.
5 Analysis
5.1 General setup
The measurements conducted during this study resulted in several gigabytes of data, making at least semi-automated analysis necessary.
The main parts of the calculations were executed in MathCad worksheets that merged data originating from machine and operator by using synchronisation markers
Evaluation of machine variant #3
How do you rank the machine in this setup, especially during bucket filling? (Put an X somewhere on the line.)
Very hard OK, Very easyto fill the bucket about normal to fill the bucket
The machine feels OK, The machine feelspowerless, slow about normal powerful, quick
Does the machine feel better or worse than the first one – or the same? (Circle the answer)
Does the machine feel better or worse than the second one – or the same? (Circle the answer)
How do you evaluate your own performance, did you cope? (Put an X somewhere on the line.)
It did not OK, It wentgo well at all as required very well
I felt OK, I feltvery stressed no major problems no stress at all
Do your hands feel warmer or colder than before – or the same? (Circle the answer)
Estimate your finger temperature: ________°C
embedded in both data streams. A function then automatically tagged each bucket filling phase within each loading cycle and exported part of the data stream back to cStress for expert review (see next section). This result of this review was a consensus figure for each operator’s absolute workload level in each condition. These data and the results from the various questionnaires each operator had to fill in were then imported into MathCad and merged with all other recorded data for further analysis.
5.2 Expert review of psychophysiological data
As mentioned in the introduction, our immediate goal is to support product development, in which the operability of prototype machines is traditionally evaluated subjectively by asking the operator to compare the tested machine with a base line and rate it according to a specific scale. Thus, a measure of operator workload is required, ideally calculated automatically either during or immediately after testing.
However, we are aware of the magnitude of this. There exists a relationship between finger temperature and mental workload in that increased workload leads to decreased finger temperature and vice versa [7]. Such relationships can also be found other signals, e.g. heart rate, heart rate variability, respiratory rate etc [8][9][10][11]. However, these data have to be evaluated in context and in relation to the PSP and each other, which today requires expert knowledge. Furthermore, a reliable algorithm to automatically remove measurement artefacts in data for ECG and respiration has yet to be developed.
It is precisely this problem of analysing the output of interacting and compensating systems in context that drives the development of Artificially Intelligence systems for such tasks. The on-going research reported in [12] is promising, but the results cannot yet easily be implemented into a system as described above. Instead, we simulated the output of such an automatic system: three of us (Olsson, von Schéele, and Ohlsson) used their expertise in this field to manually review and analyse the measurement data and derive an absolute workload index for each operator in each of the conditions (PSP and three machine variants), without knowledge of the operator’s skill level, his subjective evaluation, and which machine variant (setting of traction force limitation) corresponded to which condition for this particular operator. After each of us analysed the data individually, we compared our results and agreed on a consensus workload index for each operator in each condition.
Our manual analysis uses all of the recorded data (not just from the bucket filling sequences) with the following criteria applied. The ratings ranged between 1 and 5 in eve-ry time period. The highest ratings (5) should be applied if all the criteria listed below showed a very functional pattern well within known reference values for each physiological signal. The lowest rating (1) should be applied when the workload seem very high in all signals. If a physiological signal contained many measurement errors, this signal was not used in the rating of that period.
The physiological signals were rated as described below and in the priority order listed:
1. Level of HR, RR, EtCO2 and peripheral temperature. A HR below 80, RR be-low 20, EtCO2 above 4.5% and peripheral temperature above 25ºC indicates low workload.
2. Noticeable recovery mainly in HR, RR and SCL between bucket fillings and during relaxation in the PSP indicates a more effort-economic behaviour and therefore low workload.
3. A clear connection between breathing and heart rate variations, RSA (Respiratory Sinus Arrhythmia), indicates low workload.
4. Extreme reactivity or extreme rigidity in mainly HR and SCL indicates high workload
Signs of habituation in any system, with priority to HR by bucket fillings, indicate a more effort-economic behaviour and therefore low workload.
6 Results Table 2 shows the expert’s consensus on the operators’ workload during the PSP and the three test conditions. To the right this table, sorted by operator skill level, also shows in which individual order the machine variants with their respective traction force setting were tested by the operators.
Table 2: Results, workload index and test order of variants
It is peculiar that the four operators with the highest skill levels consistently have a high workload for all machines, not affected by traction force limitation. This is presumably a ceiling effect. It is interesting to note that none of the operators were aware of their high workload. In their opinion, the work performed was little demanding, especially in comparison to other possible tasks such as loading of shot rock.
With the exception of one, all operators show a higher workload during the Psychophysiological Stress Profile than during the first machine test. Comparing the different conditions, it shows that the workload does not vary much within each subject, despite the operators clearly
commenting on experiencing the machine variants differently, as shown in Table 3.
Table 3: Results, questionnaire responses on personal satisfaction and stress-free operation
No clear overall trend emerges when comparing the operators’ answers in the questionnaire on how well they felt they had managed (“personal satisfaction”) and how stress-free they felt during the operation with the experts’ consensus on the operators’ workload.
The operators’ responses related to the tested machines, evaluated for their ease of bucket filling, overall impression of power and comparative rank are shown in Table 4. Here again, no clear trend is immediately obvious.
Table 4: Results, questionnaire responses on subjective machine evaluations
In conclusion, the workload index, derived from the psychophysiological measurements, mostly shows no obvious variation with any of the independent or other dependent variables. Naturally, the next step to take as a researcher interested in discovering any correlation would be to employ sophisticated statistical methods, such as principal component analysis or structural equation modelling.
However, the purpose of our study was not to show whether a correlation between self-assessed ease of bucket filling and measured workload index could be established at all, using such sophisticated statistical methods. Rather, the goal was to study whether such possible correlation was strong
enough for application-oriented test engineers without research background to employ simple statistical methods for converting measured workload indices back to degrees of machine operability, without having the operators performing any self-assessment. In other words, if the possible correlation is that weak and fragile, that in order for it to be discovered sophisticated statistics is required, then no engineer in the field will be able to make any use of it.
Despite this, we do not plan to abandon the data generated by the measurements performed during this study. Further statistical analysis is still planned, but its results will have to be reported in a later paper. As for now, the findings do not give support for our vision of using psychophysiological measurements as a complement to traditional subjective evaluations of a machine’s operability and even less for using such measurements for workload-adaptive operator assistance; instead they indicate that also other factors have a great influence on the operator workload.
7 Discussion of possible sources of error While performing the measurements, as well as during analysis and reporting, we significantly improved our knowledge with regard to appropriateness of equipment and procedures. This will be discussed in the following.
7.1 Procedure
We were able to secure a specific machine and a dedicated test area for our study, thus ensuring that all operators were operating under the same conditions.
During the testing phase we tried to keep the environmental conditions as similar as possible. We only tested on days with good weather (no rain) and at the time of the highest ambient temperature, i.e. immediately after lunch (which also ensured that the operators were rested). But since this study was performed in mid-autumn, temperatures were generally lower; during the testing around 5-10°C. The machine was parked outside overnight and had therefore cooled quite substantially by the morning. Together with 20-30 minutes’ engine warm-up each day (about two hours before testing) and a 1.5km drive to the testing site, the first ten minutes of self-training should provide enough waste heat to warm up the machine (engine, transmission, axles, and hydraulics), so that testing conditions were similar for all cycles, independent of order.
At the proving ground we had a dedicated area, but were at times surrounded by other machines using the same facilities. This may have distracted the operator and generated higher workload.
During testing, the wheel loader’s automatic functions were fixed at gear-dependent BSS (Boom Suspension System), automatic APS (Automatic Power Shift), and with Auto Kick-down enabled. Of course, the BSS is only deactivated when in 1st gear, which means it is activated during the first seconds of the bucket filling phase, until the transmission automatically shifts from 2nd to 1st gear. This is done via an adaptive algorithm, which might differ between operators.
Perhaps one of the pre-defined fixed APS settings L (low power), M (medium power) or H (high power) should have been used instead. Or perhaps the automatic kick-down function might have better been disabled altogether, in order to give the operator the freedom to choose when to shift gear.
The operators were asked to use the machine for three times 10 + 5 minutes, in total 45 minutes. There is a risk of fatigue, especially for the less experienced operators, but we can at best only find weak support for this in the workload index data.
Furthermore, in spite of the ten minutes of self-training before each live testing session, a learning effect might still be present, especially for the less experienced operators.
The significance of a Psychophysiological Stress Profile is to see the individual dynamic variation, as well as record the base line and review the subject’s ability to relax. Before testing at the proving ground, we took the operator of the day to a secluded place to establish the PSP. While this location was isolated visually, it was not so audibly, since it was still within hearing distance of the proving ground, a nearby motorway and the R&D workshop’s busy prototype parking area (with the backing alarm of a machine driving in reverse being a particularly disruptive sound). This may have influenced the PSP measurement data. A possible improvement may also be to establish a PSP in a non-work place environment for comparison.
7.2 Measuring equipment and data acquisition
The measuring equipment used to acquire the psychophysiological data was originally developed for clinical applications, i.e. use in a stationary, stable and clean environment. Using it, as we have done, in a mobile environment, exposed to large and frequent accelerations might have introduced measurement errors other than what is discussed below.
As explained earlier, the operators were instructed to lay their lower arms on the arm rests attached to the suspended chair. This dramatically lowered the amount of measurement artefacts in the ECG signal, yet some still occurred and had to be accounted for manually in the analysis phase.
Many measurement artefacts were found in the respiratory signal, which was acquired with a nasal sample line, inserted some millimetres into the left nostril and secured by a piece of tape. However, in a few cases the operator’s facial hair prevented good adhesion, leading to a temporary detachment of the cannula and thus giving erroneous readings. For some operators we therefore used a nasal cannula that could be secured via the operator’s ears. With only three such nasal cannulas available, we had to decide in which cases to employ this alternative method.
During both the PSP session and machine operation the operator was asked to exclusively breathe through the nose. However, we suspect that some of the artefacts in the respiratory data are due to the operator unintentionally breathing through the mouth (which itself is a sign of high
workload and stress, but hard to clearly identify in retrospect).
The PSP was conducted with the operator sitting in working position in the cab of the wheel loader and the person administering the test standing on the ladder, instructing him through the open door, and monitoring through the closed door when recording was in progress. With the colder ambient temperatures, yet still strong sunshine, this led to a cooling of the cab’s interior while instructing the operator, yet gradual warm-up during execution of the PSP steps – both of which had an impact on at least the finger temperature measurements. In some cases operators complained about low temperature and wanted to turn on the heating and air conditioning system. But since this would have required a running engine, which might have distracted the operator from the required task, the decision was taken to only do so during the instruction phases before each PSP step.
Furthermore, we discovered that the finger temperature readings were affected by heat influx from the sun and by the flow of cold/warm air from the cabin’s heating and air conditioning system, both during the PSP sessions and at the proving ground. Some operators even deliberately directed air flow to their hands to cool/warm them during operation of the machine. This discovery discredited the finger temperature readings enough for us to decide to completely disregard them when determining the workload index.
With regard to the above discussed we were still able to obtain satisfactory data from all subjects to estimate their psychophysiological functioning based on ocular analysis.
7.3 General considerations
There are several general considerations to make with regard to this study. To begin with, the workload index we derived is a compound measure that does not only reflect the necessary mental effort of the operator to handle different traction force settings of a wheel loader. With the lack of distinct results at hand, it is thus probable that other effects had a larger influence on the psychophysiological data we acquired.
Operators themselves commented on distracting elements, such as poor gear shifting quality of the automatic kick-down function, other machines nearby which required one to look out when driving in reverse, or looking straight into the sun when turning the head in order to check that nobody was standing behind the machine (even though we specifically instructed him to check the rear-view camera monitor). These are normal for a working place, but it might be that the impact of the different traction force settings was too small to be registered in measurements with durations of a mere five to six minutes. Next time we should consider aiming for 30 minutes or more.
Related to this the question arises of when to consider a workload to be different, e.g. whether or not a difference of 0.1 in value is to be considered significant, and how this relates to testing time.

In the future we need to consider measuring other data known to be indicative of workload. The quality of our measurements of finger temperature was too poor to use the data acquired. But as finger temperature is normally an important measure of activity in the sympathetic nervous system, SNS, we should try to vary the sensor placement for increased reliability and validity. Although heart rate and heart rate variability can change within seconds, reliable measurements are obtained for periods with a minimum of 30-40 seconds (i.e. four times longer than a typical bucket filling sequence), and a maximum of 5 minutes. It is warned that sensitivity decreases for shorter or longer periods [9].
Respiratory Sinus Arrhythmia, RSA [13] can be analysed dynamically and is the most sophisticated way to analyse activity in the autonomous nervous system, ANS. This is very complex and at the moment there are no automatic analysis methods available, but we included RSA in our manual estimation of the subjects’ workload index, based on our understanding of the problem.
Finally, we need to reassess the working cycle. It could be that the workload index was impacted so little by even the severe traction force limitation in the “47%” machine because there were no immediate consequences of falling behind in pace or bucket load. In reality, for instance at a saw mill or an asphalt processing plant, trucks would be arriving continuously to be filled by the wheel loader. A decrease in productivity is clearly visible in a constantly lengthening line of trucks waiting their turn. Furthermore, when truck and wheel loader are properly matched it takes four buckets to fill a truck. Again, the productivity decrease is clearly visible if an operator needs a fifth run. In our study the operators would have to face none of these stress-increasing consequences. We need to consider either more closely representing the situation at real working places or introducing consequences by artificially adding some productivity-related feedback by visual or acoustic means.
There was also the ambivalence of our instructions to keep “a normal cycle time of 20-25 seconds” (again, without consequences for not doing so) and the conflicting requirements of both keeping pace and completely filling the bucket each time, especially for the “47%” machine variant with severely limited traction force which simply does not permit a bucket to be filled as fast and as much in comparison with the unmodified “100%” machine. Each operator handled this trade-off individually. Some operators chose to keep the bucket fill factor constant, which led them to spend more time at the gravel pile. Others chose to keep the pace with the consequence of less material in the bucket.
8 Conclusion and outlook At the beginning of this article we described our vision of using psychophysiological measurements to assess operator workload in sufficiently detail to use it as a complement to traditional subjective evaluations, but also use such measurements in a workload-adaptive operator assistance system in a longer perspective. Even though the data allow for some interesting observations at both individual and skill group level, the results of this study indicate that measures
other than ones based on heart rate, finger temperature, skin conductance and respiratory air flow should be considered. All of these parameters seem hard to measure reliably in the tough environment of a mobile working machine, but will be less prone to artefacts in the controlled environment of a human-in-the-loop simulator. This of course requires the use of a simulator that has both the fidelity required to produce correct results on the machine side and the immersiveness required to produce correct results on the side of the operator. The research summarised in [14] shows that this is possible in principle.
In a simulator as well as in reality it is important to provide relevant test scenarios. We suspect that the operators in our study did not experience enough pressure, because there were no immediate consequences for not keeping the set cycle pace or not filling the bucket completely. In the future we will try to add this pressure by either more closely representing a real working place or by adding productivity-related feedback artificially, for example by tactile, acoustic or visual means.
We also found that the sensitivity of the psychophysio-logical measurements conducted appears to be too low for our requirements. On the other hand, promising research is been done on the use of Artificial Intelligence techniques (such as Case-Based Reasoning) to evaluate data from psychophysiological measurements [12][16]. With proper input, perhaps such systems can provide the sensitivity we require and might then also be able to recognise measurement artefacts. The need to automatically analyse all acquired data in context is the major driver for such AI-based analyses, since a manual review of multiple channels with data from interacting and compensating systems can today only be performed by experts, relying on clinical data which cannot very easily be transformed into complex work situations.
We and others, for example [15], also work with the development of new wireless sensors that can be deployed without distracting the operator from the working task, while at the same time being able to acquire data without the amount of measuring artefacts we have to cope with today.
References [1] Filla, R. (2011) “Quantifying Operability of Working
machines”. Doctoral thesis, Department of Management and Engineering, Linköping University, Sweden. http://urn.kb.se/resolve?urn=urn:nbn:se:liu:diva-70394
[2] Ley, R. (1999) “The modification of breathing behavior. Pavlovian and operant control in emotion and cognition”. Behavior Modification. Vol. 23(3), pp 441-479. http://dx.doi.org/10.1177/0145445599233006
[3] Schleifer, L. M., Ley, R., Spalding, T. W. (2002). “A hyperventilation theory of job stress and musculoskeletal disorders”. American Journal of Industrial Medicine. Vol. 41(5), pp 420-432. http://dx.doi.org/10.1002/ajim.10061
[4] Von Schéele, B. H. C. and von Schéele, I. A. M. (1999) “The Measurement of Respiratory and Metabolic Parameters of Patients and Controls Before and After Incremental Exercise on Bicycle: Supporting the Effort Syndrome Hypothesis?”. Applied Psychophysiology and Biofeedback. Vol. 24(3), pp 167-177. http://dx.doi.org/10.1023/A:1023484513455
[5] Filla, R. (2012) “Study of a Method for Assessing Operability of Working Machines in Physical and Virtual Testing”. International Journal of Vehicle Systems Modelling and Testing, vol. 7, no. 3, pp 209-234, 2012. http://dx.doi.org/10.1504/IJVSMT.2012.048939
[6] Begum, S., Ahmed M. U., Funk, P., Xiong, N. and von Schéele, B. (2006) “Using Calibration and Fuzzification of Cases for Improved Diagnosis and Treatment of Stress”. Proceedings of the 8th European Conference on Case-Based Reasoning, pp 113-122. http://citeseerx.ist.psu.edu/viewdoc/summary?doi=10.1.1.97.4004
[7] Begum, S. (2011) “A Personalised Case-Based Stress Diagnosis System Using Physiological Sensor Signals”. Doctoral thesis, Mälardalen University, Västerås, Sweden. http://urn.kb.se/resolve?urn=urn:nbn:se:mdh:diva-12257
[8] De Waard, D. (1996) “The Measurement of Driver’s Mental Workload”. Doctoral thesis, University of Groningen, The Netherlands. http://irs.ub.rug.nl/ppn/297329391
[9] Castor, M., Hanson, E., Svensson, E., Nählinder, S., Le Blaye, P., MacLeod, I., Wright, N., Alfredson, J., Ågren, L., Berggren, P., Juppet, V., Hilburn, B., Ohlsson, K. (2003) “GARTEUR Handbook of Mental Workload Measurement”, Final Report for Flight Mechanics Group of Responsibles (FM GoR) of the Group for Aeronautical Research and Technology in Europe (GARTEUR) by GARTEUR Action Group FM AG13.
[10] Park, B. (2009) “Psychophysiology as a Tool for HCI Research: Promises and Pitfalls”. Proceedings of HCII 2009: New Trends, LNCS 5610, pp 141-148. http://dx.doi.org/10.1007/978-3-642-02574-7_16
[11] Di Stasi, L. L. (2010) “Mental Workload in HMI”. Doctoral thesis, Departamento de Psicología Experimental y Fisiología del Comportamiento, Universidad de Granada, Granada, Spain. http://hdl.handle.net/10481/15439
[12] Begum, S., Ahmed, M. U., Funk, P., Filla, R. (2012) “Driver’s Mental State Monitoring System Using CBR Based on Heart Rate Variability Analysis”. Proceedings from the 7th International Symposium Advances in Artificial Intelligence and Applications (AAIA'12). http://fedcsis.org/proceedings/fedcsis2012/pliks/407.pdf
[13] Von Schéele, B. H. C. (1995) “Respiratory Sinus Arrhythmia as a Diagnostic Tool, a Treatment Goal, a Rule for Treatment Planning, a Cool Biofeedback, and an Out-Come Variable”. Biofeedback and Self Regulation. Vol. 20(3), pp 308-309.
[14] Nählinder, S. (2009) “Flight Simulator Training: Assessing the Potential”. Doctoral thesis, Department of Management and Engineering, Linköping University, Sweden. http://urn.kb.se/resolve?urn=urn:nbn:se:liu:diva-17546
[15] Voskamp, J. and Urban, B. (2009) “Measuring Cognitive Workload in Non-military Scenarios. Criteria for Sensor Technologies”. Proceedings of HCII 2009: Foundations of Augmented Cognition - Neuroergonomics and Operational Neuroscience, LNCS 5638, pp 304-310. http://dx.doi.org/10.1007/978-3-642-02812-0_36
[16] Begum, S., Barua, S., Filla, R., Ahmed, M. U. (2013) “Classification of Physiological Signals for Wheel Loader Operators Using Multi-Scale Entropy Analysis and Case-Based Reasoning”. To be published in Expert Systems with Applications.
(Internet links updated and verified on March 11, 2013)


![Research Article Psychophysiological Associations between ... · etiological factors in comorbid tinnitus and sleep disorders [ ]. Primary or psychophysiological insomnia insomnia](https://img.pdfslide.us/doc/110x75/5e988286df96d863364cf528/research-article-psychophysiological-associations-between-etiological-factors.jpg)