Embed Size (px)
Citation preview
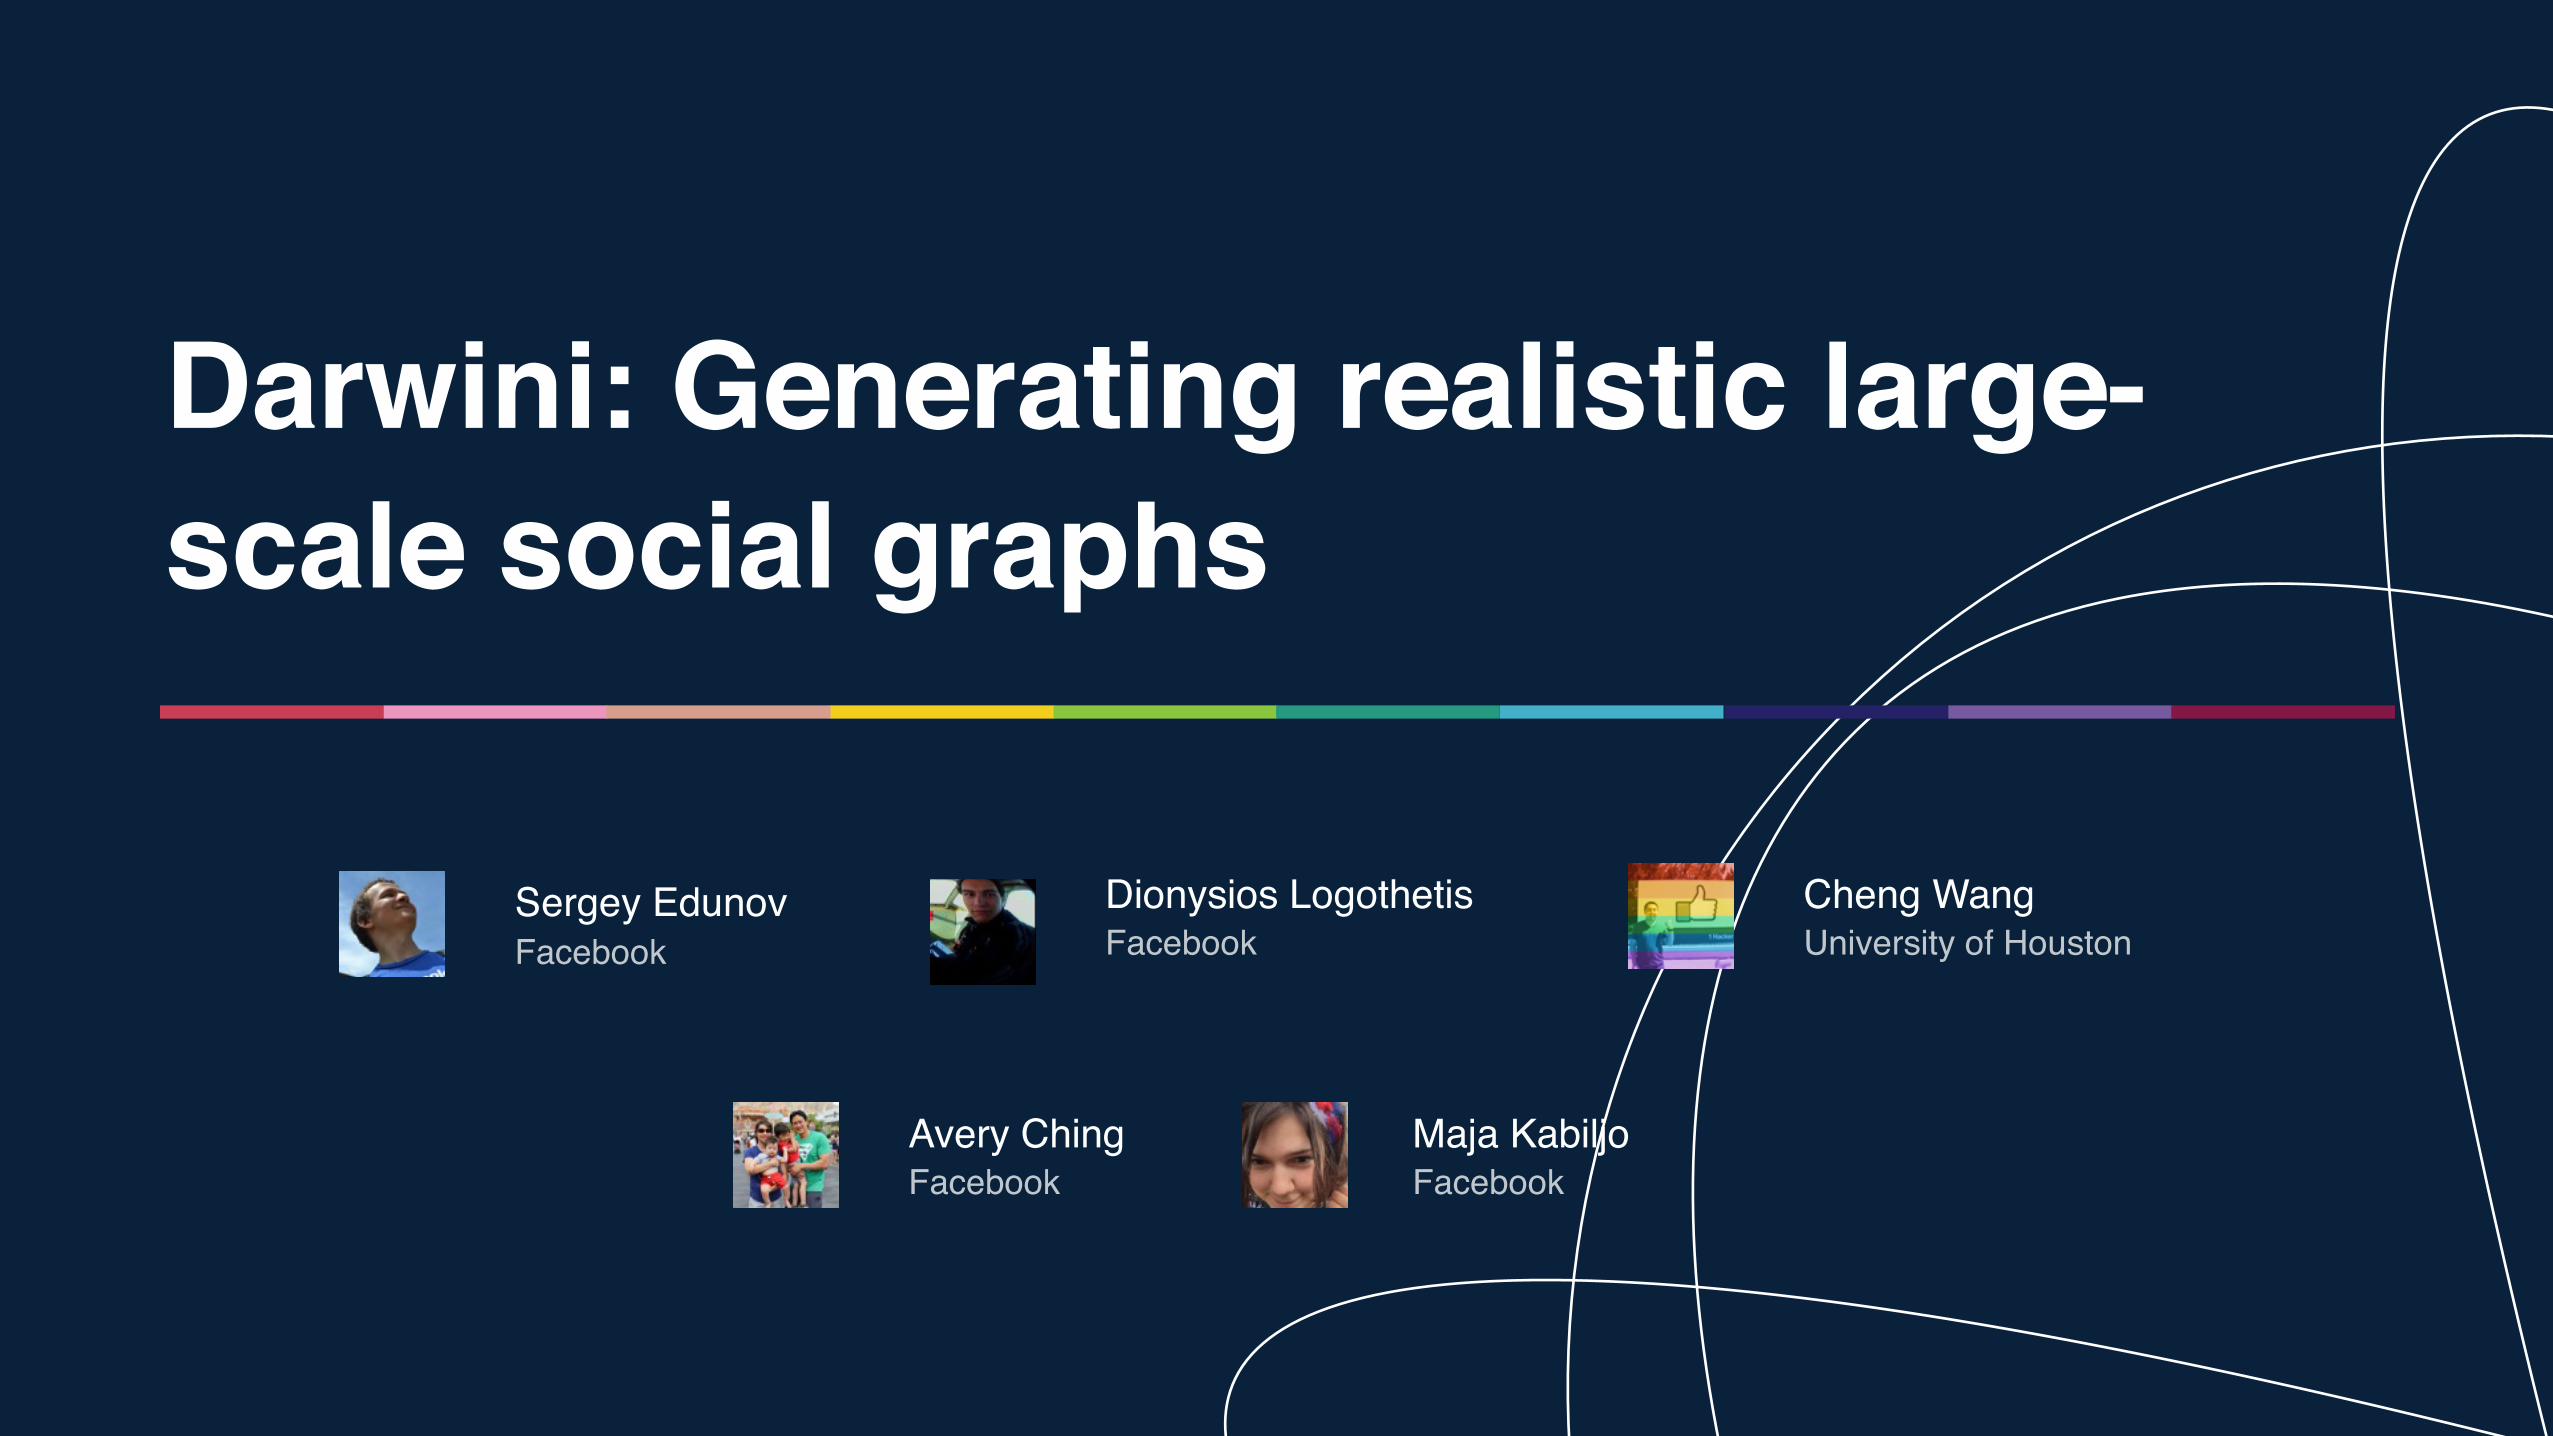
Darwini: Generating realistic large-scale social graphs
Avery ChingFacebook
Cheng WangUniversity of Houston
Sergey EdunovFacebook
Maja KabiljoFacebook
Dionysios LogothetisFacebook

Why?
1) Capacity planning
2) Fair evaluation
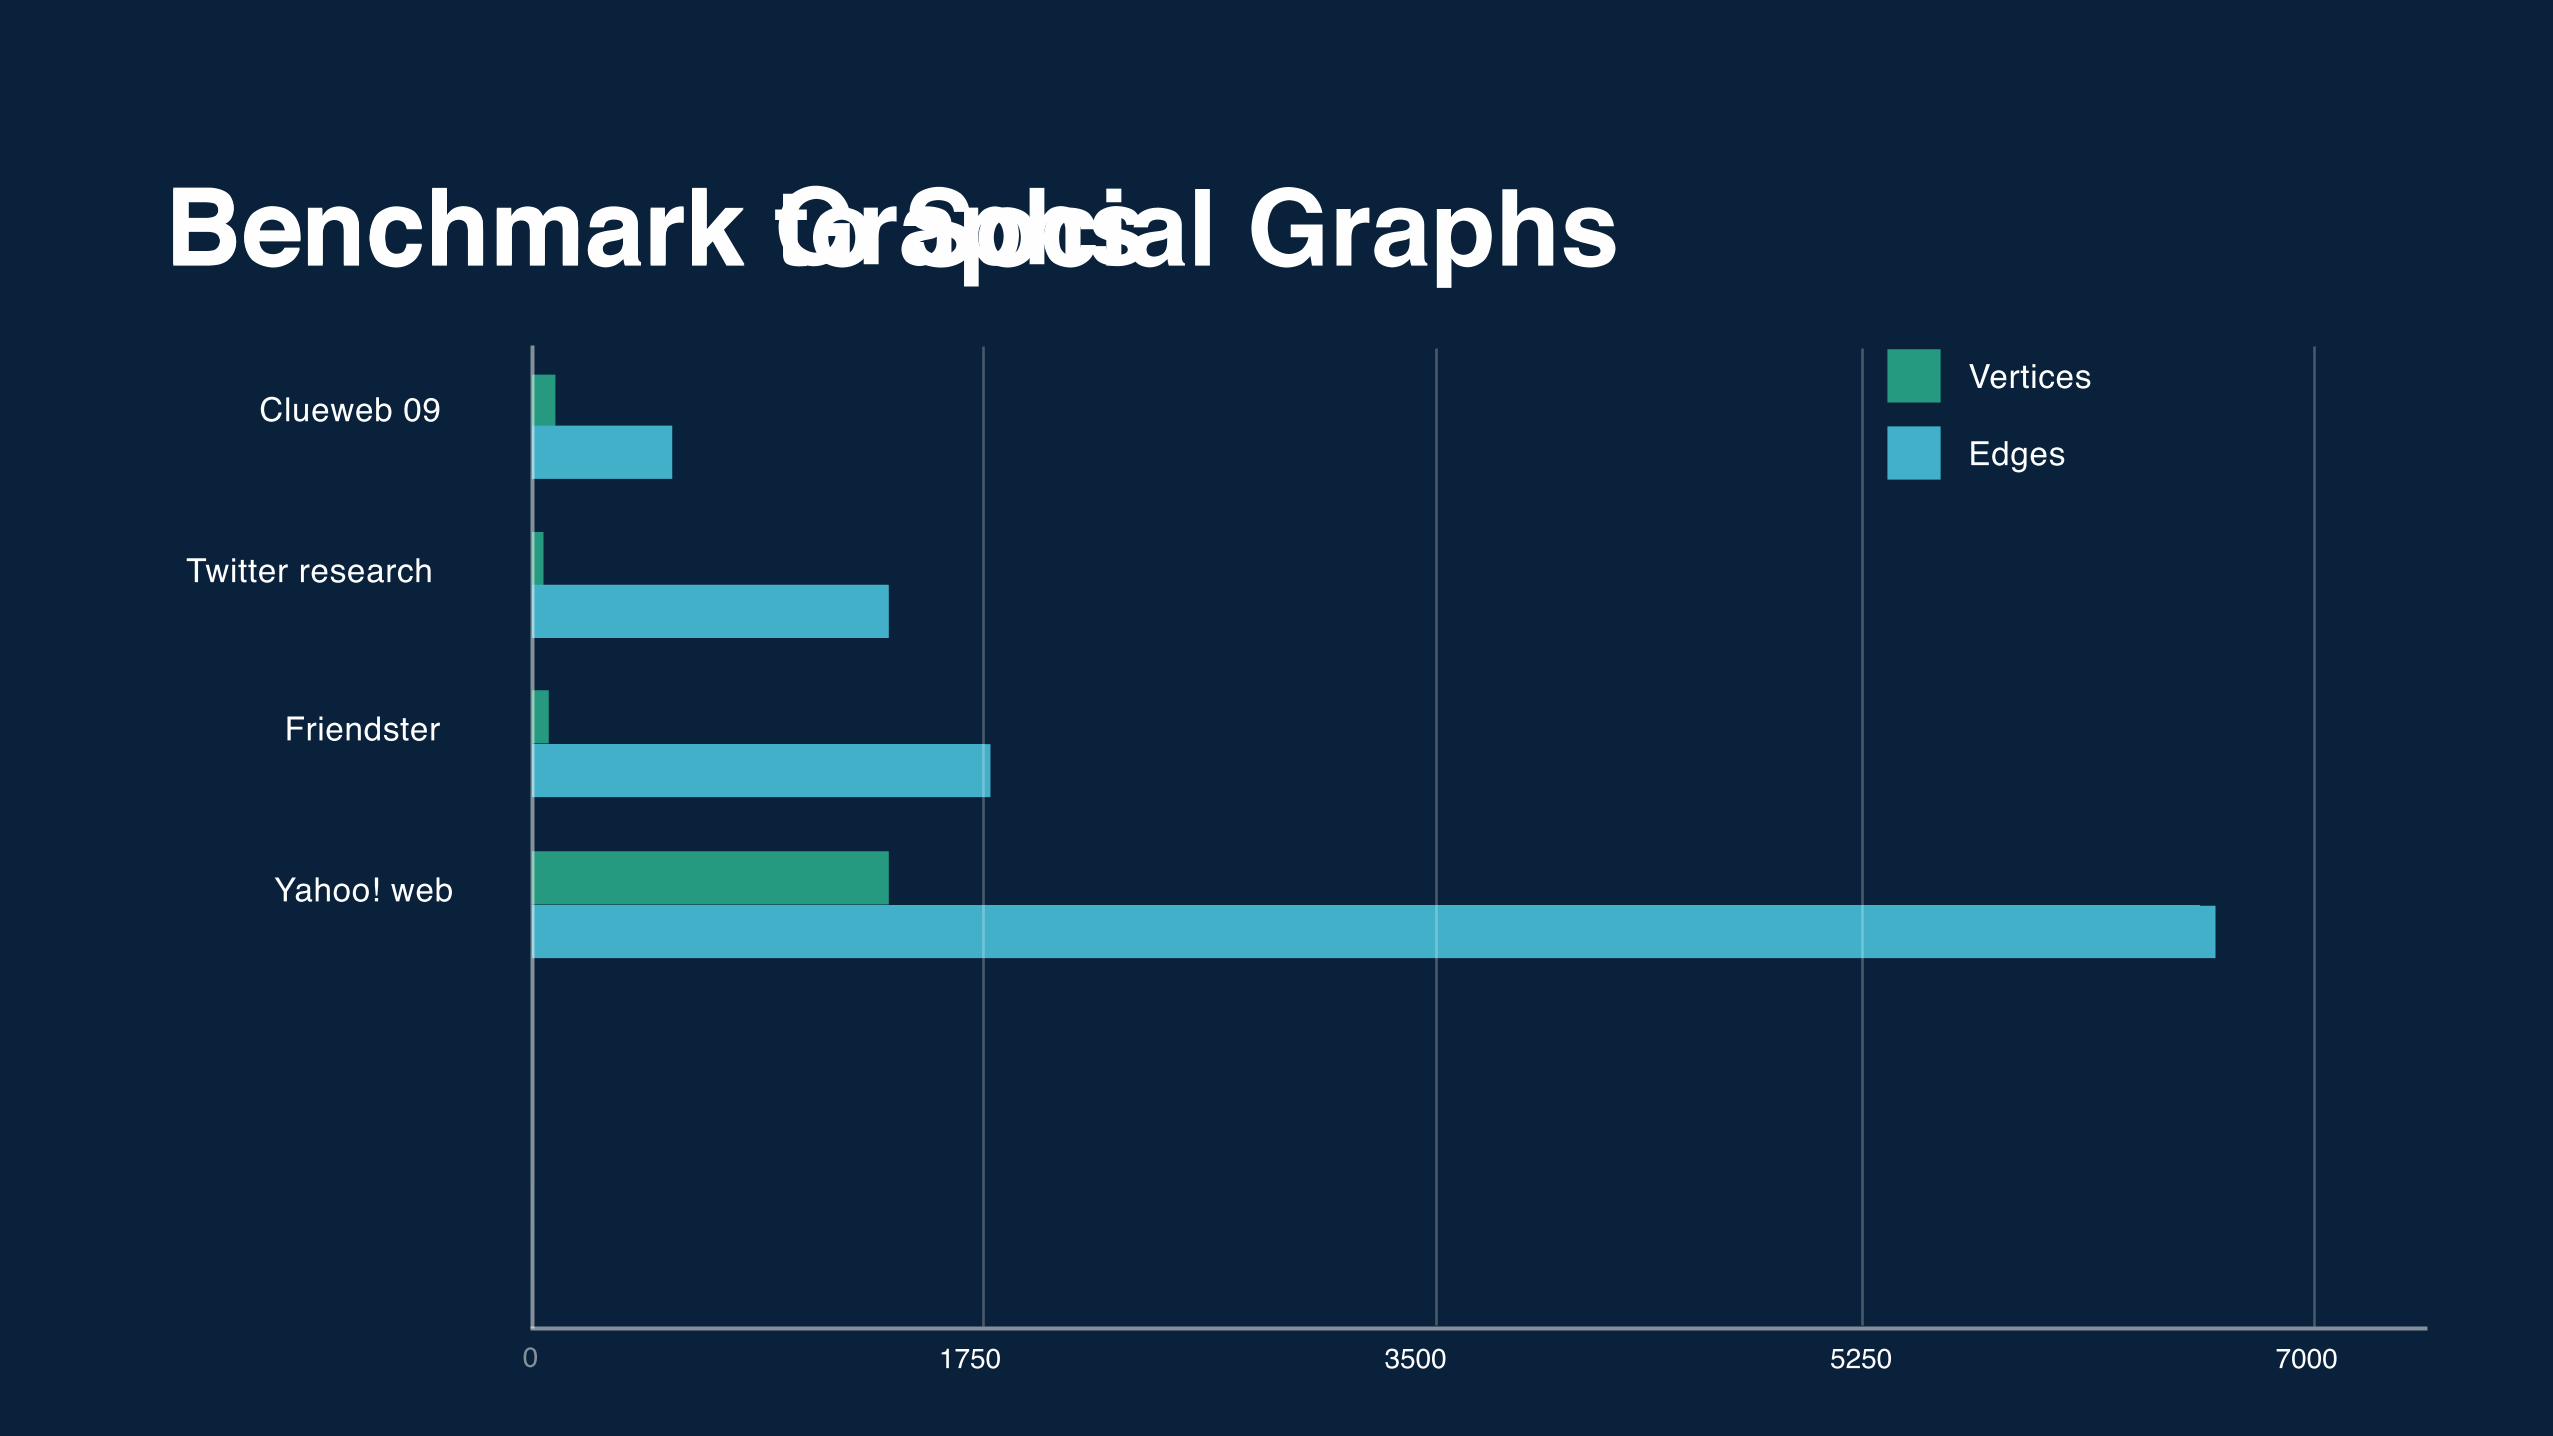
Benchmark GraphsClueweb 09
Twitter research
Friendster
Yahoo! web
0 1750 3500 5250 7000
Edges
Vertices
Benchmark to Social Graphs
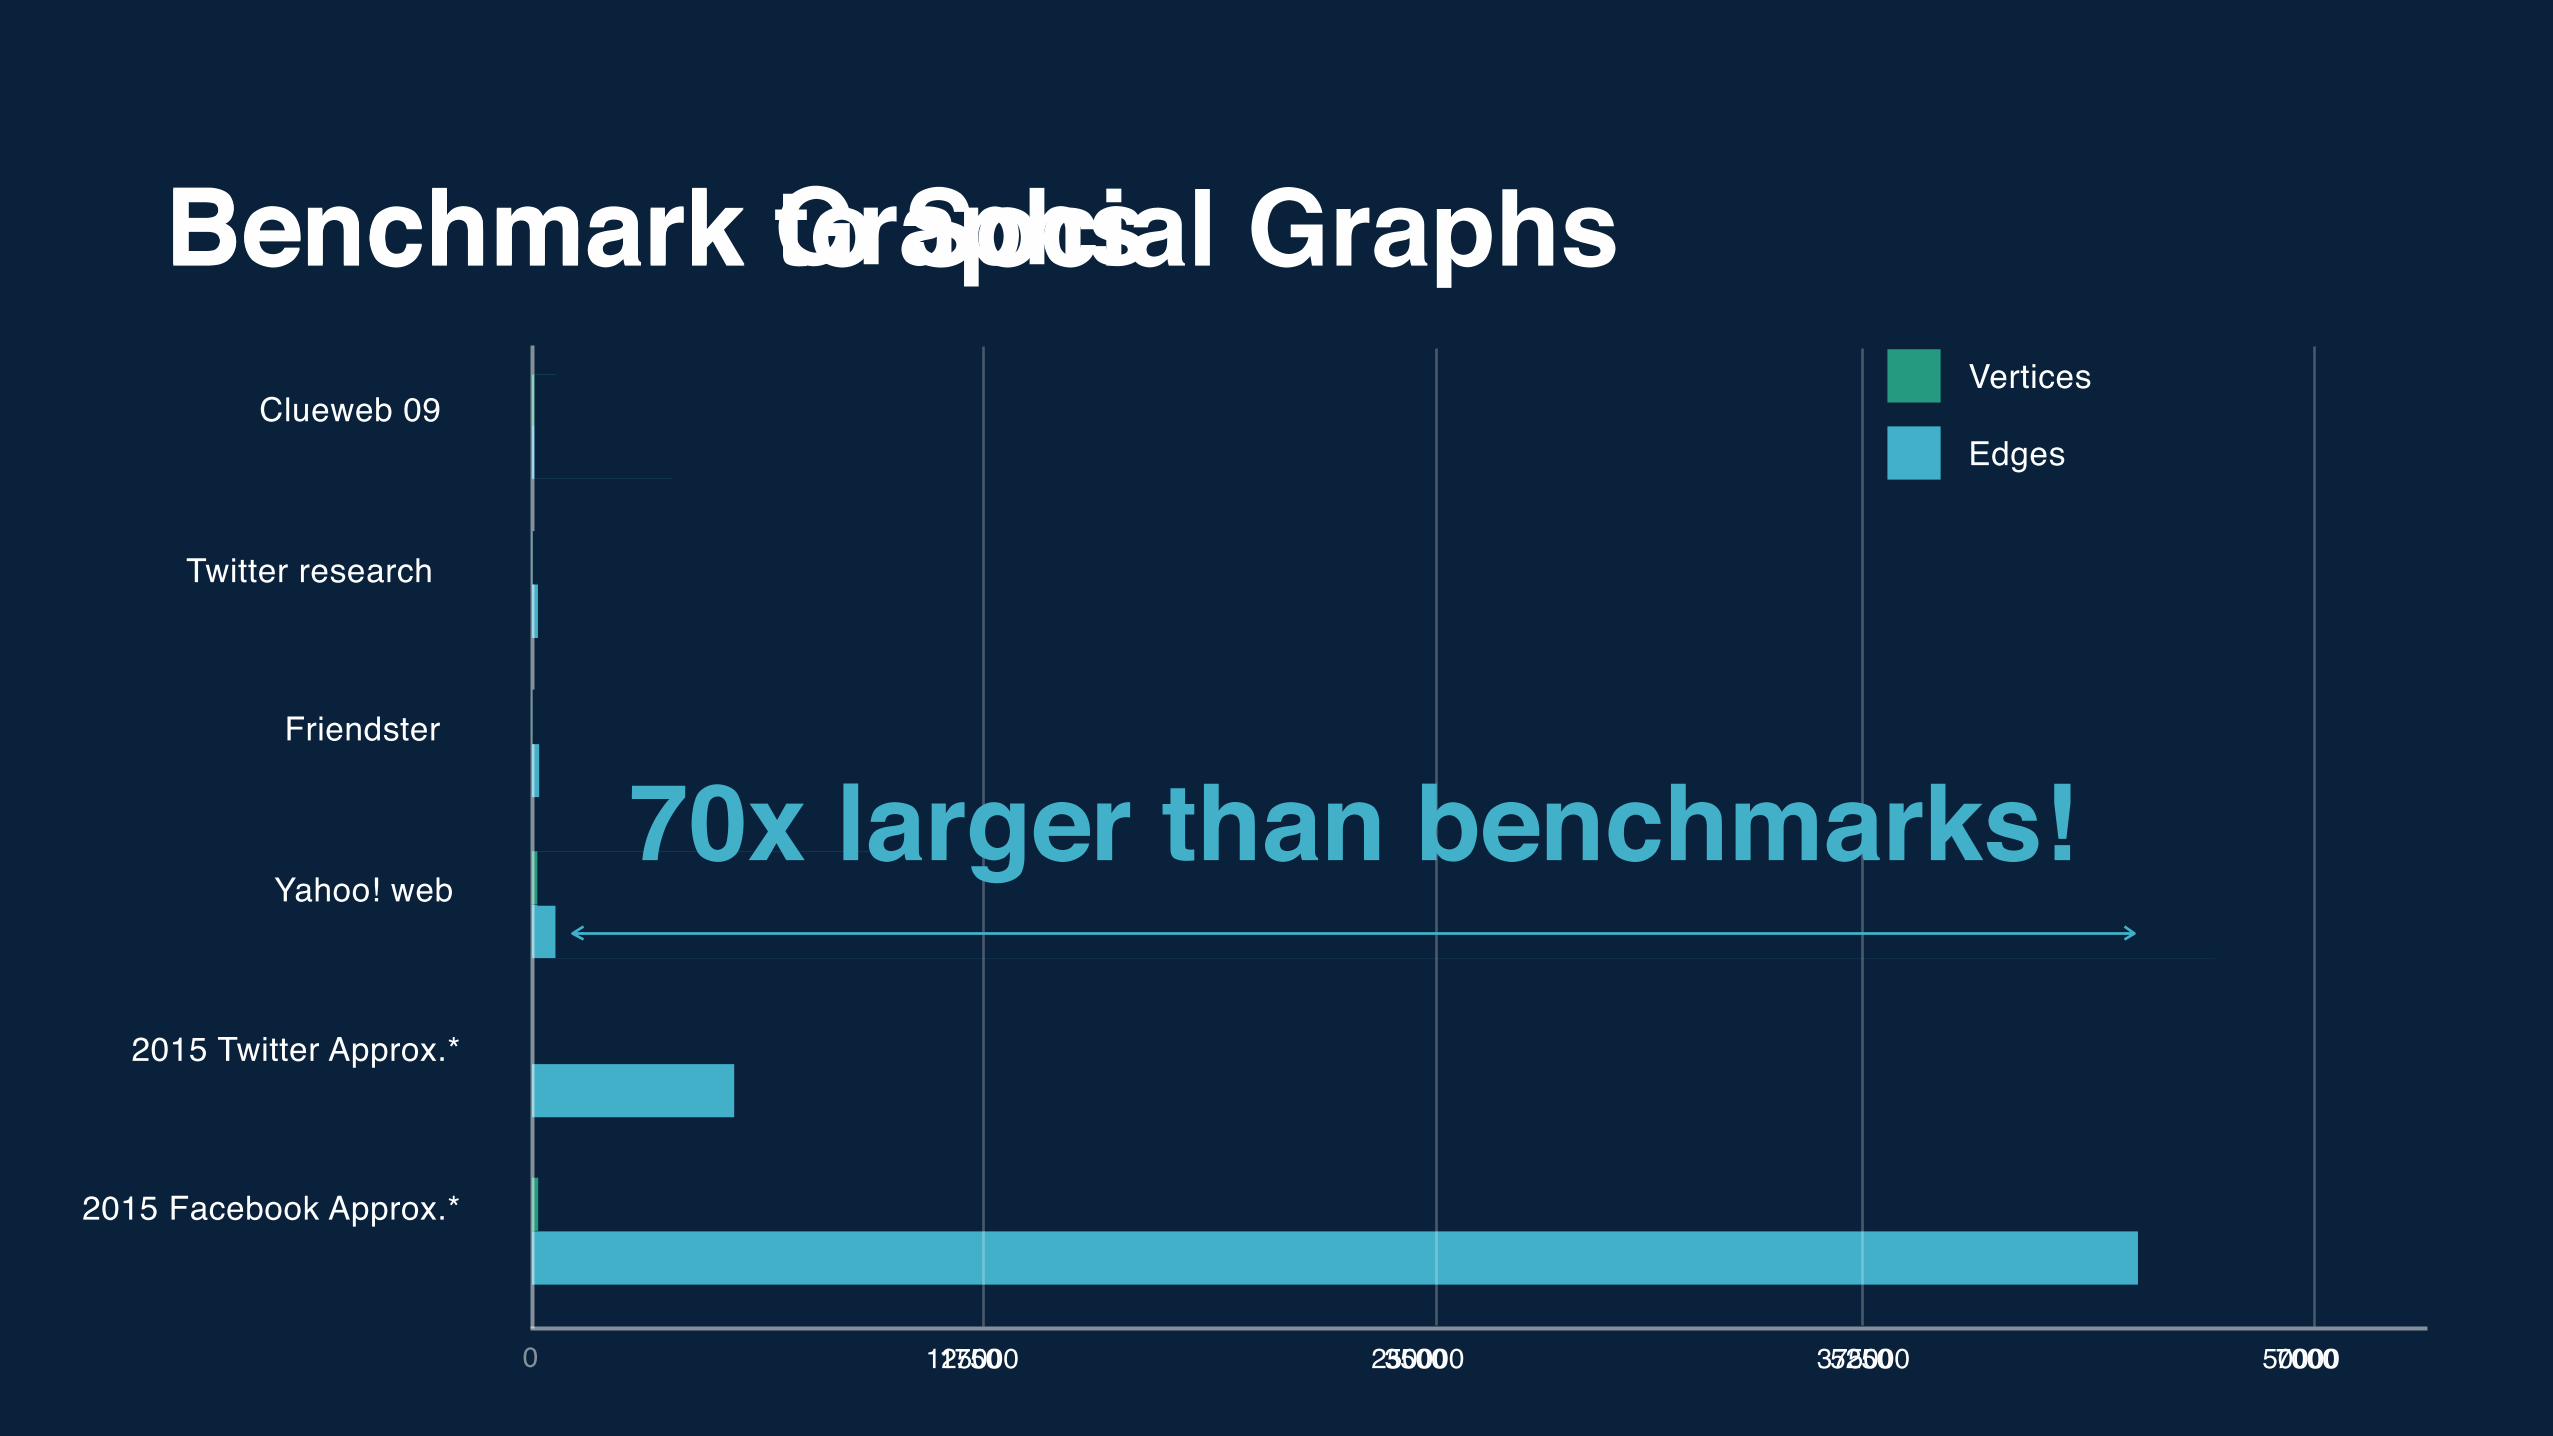
Benchmark GraphsClueweb 09
Twitter research
Friendster
Yahoo! web
2015 Twitter Approx.*
2015 Facebook Approx.*
0 1750 3500 5250 7000125000 250000 375000 50000
Edges
Vertices
70x larger than benchmarks!
Benchmark to Social Graphs
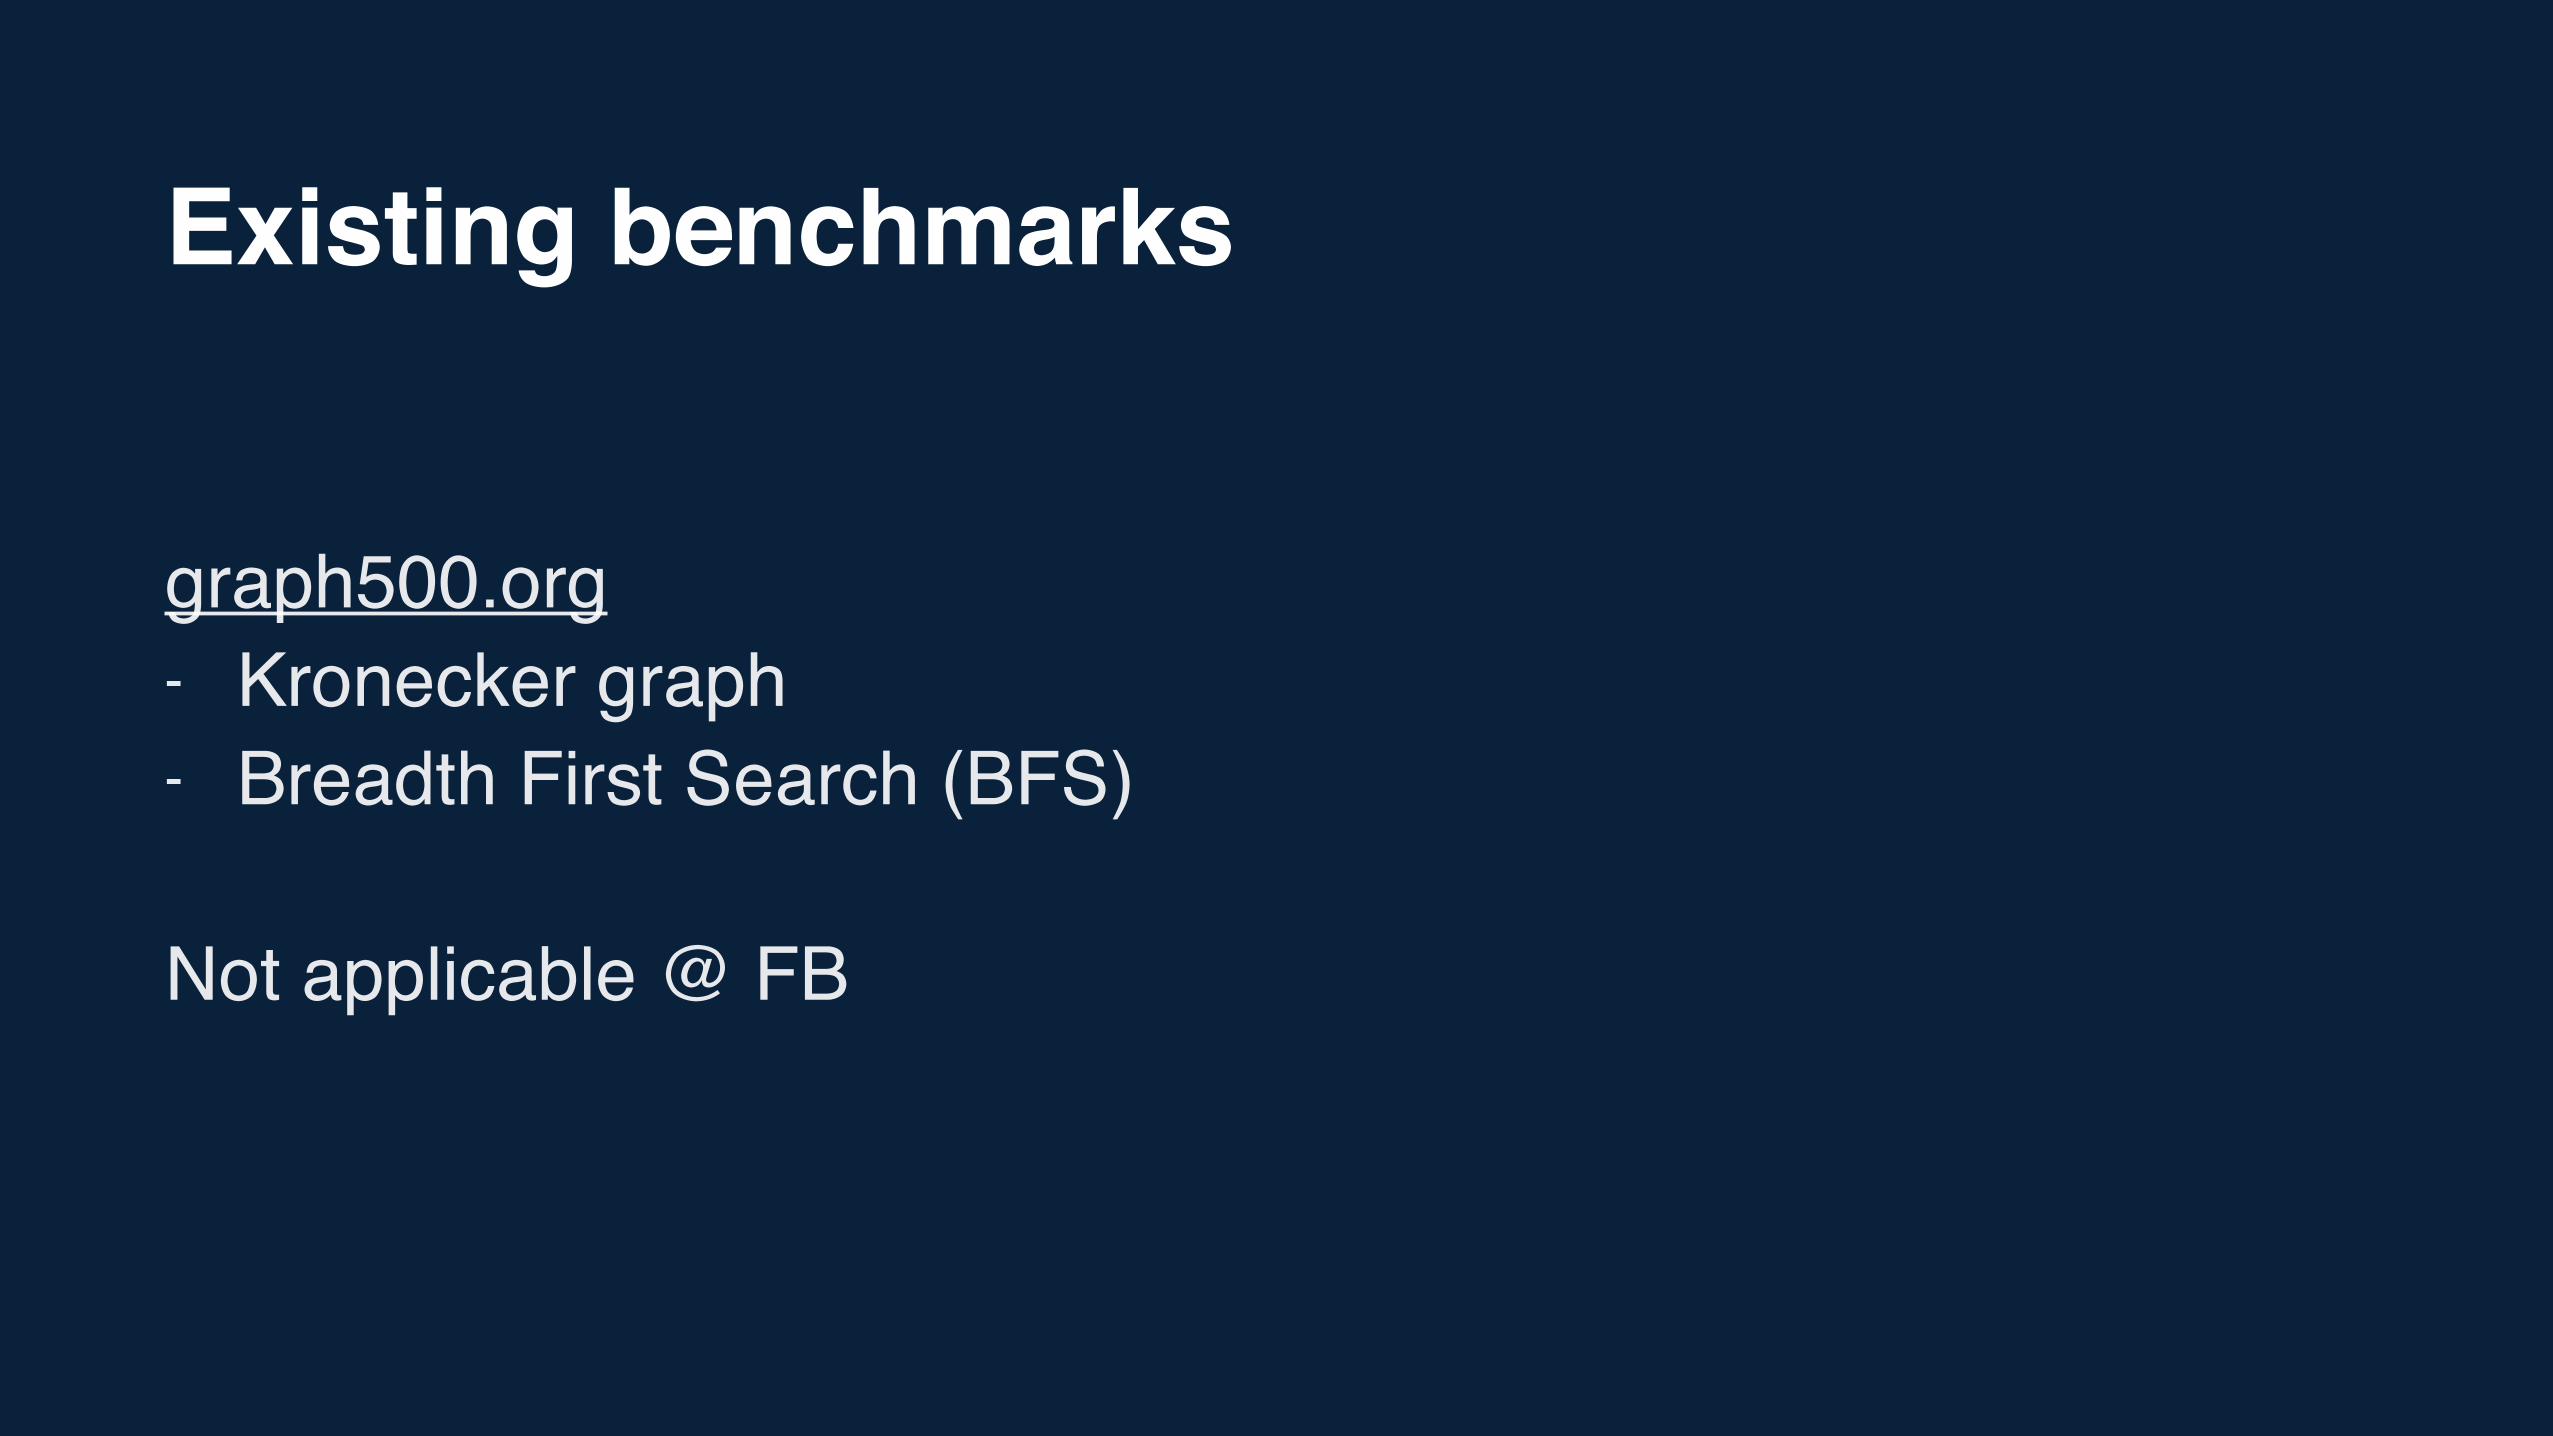
Existing benchmarks
graph500.org - Kronecker graph- Breadth First Search (BFS)
Not applicable @ FB
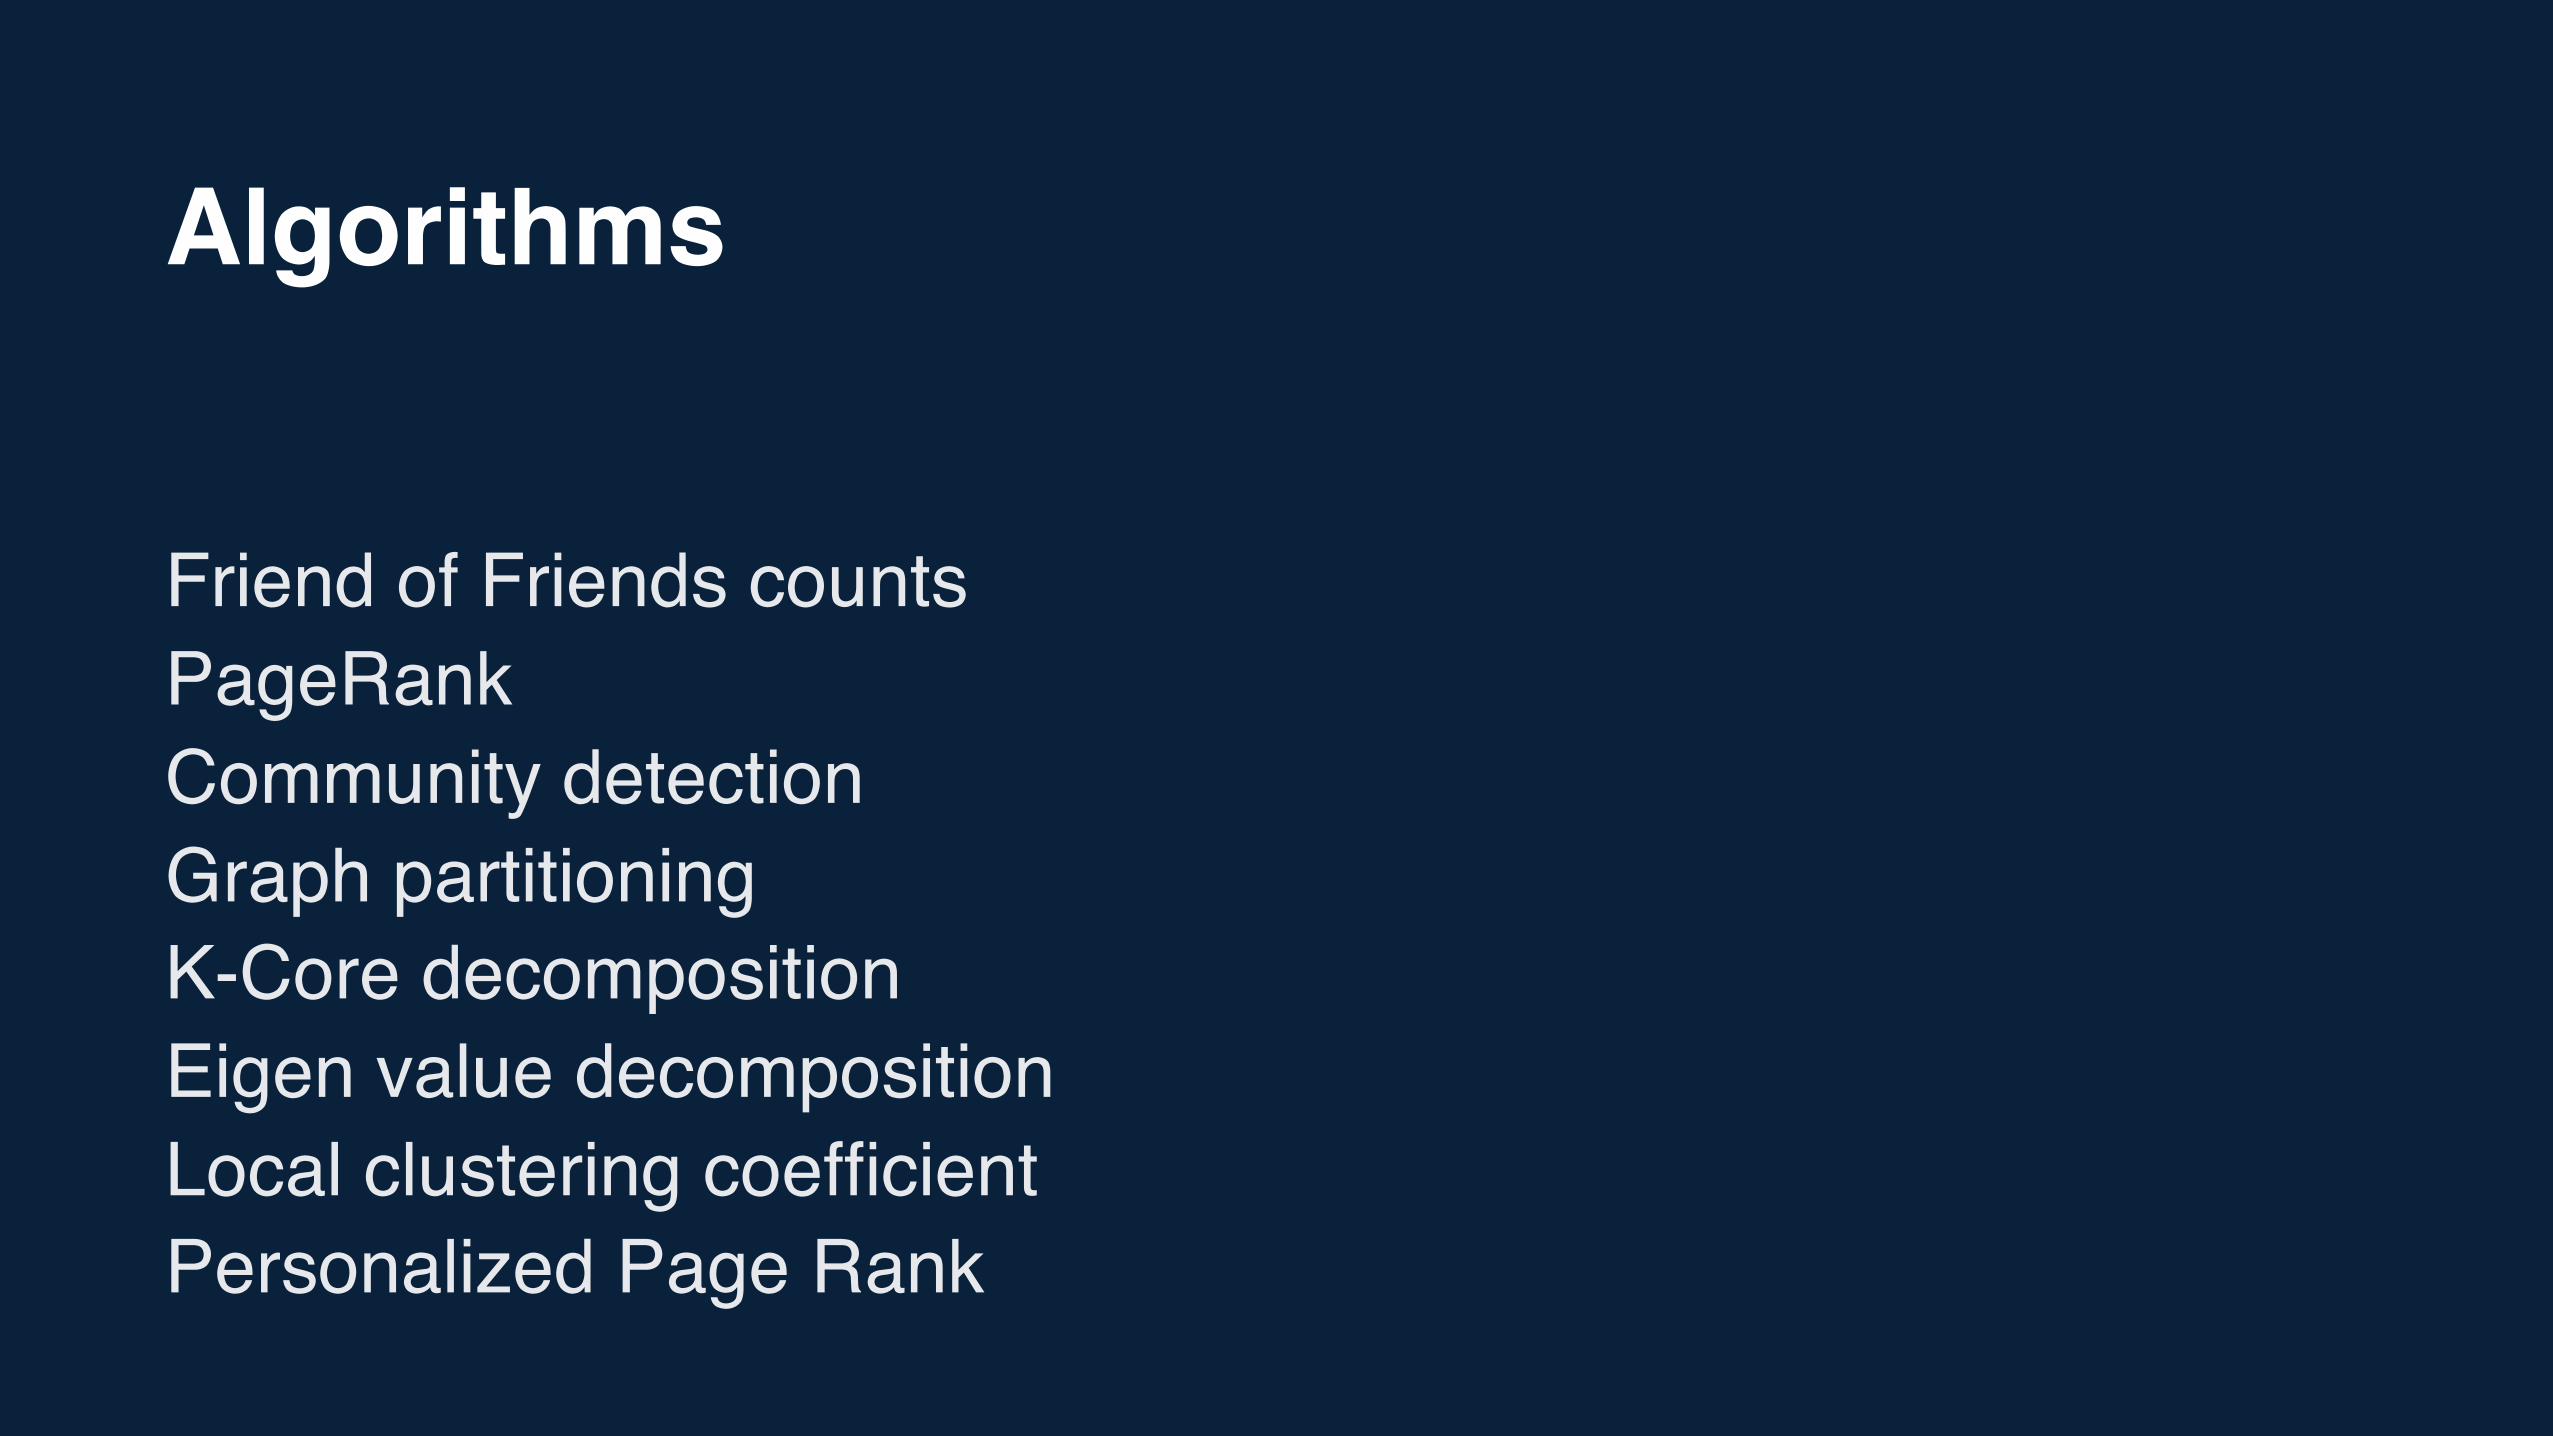
Algorithms
Friend of Friends countsPageRankCommunity detection Graph partitioningK-Core decompositionEigen value decompositionLocal clustering coefficientPersonalized Page Rank
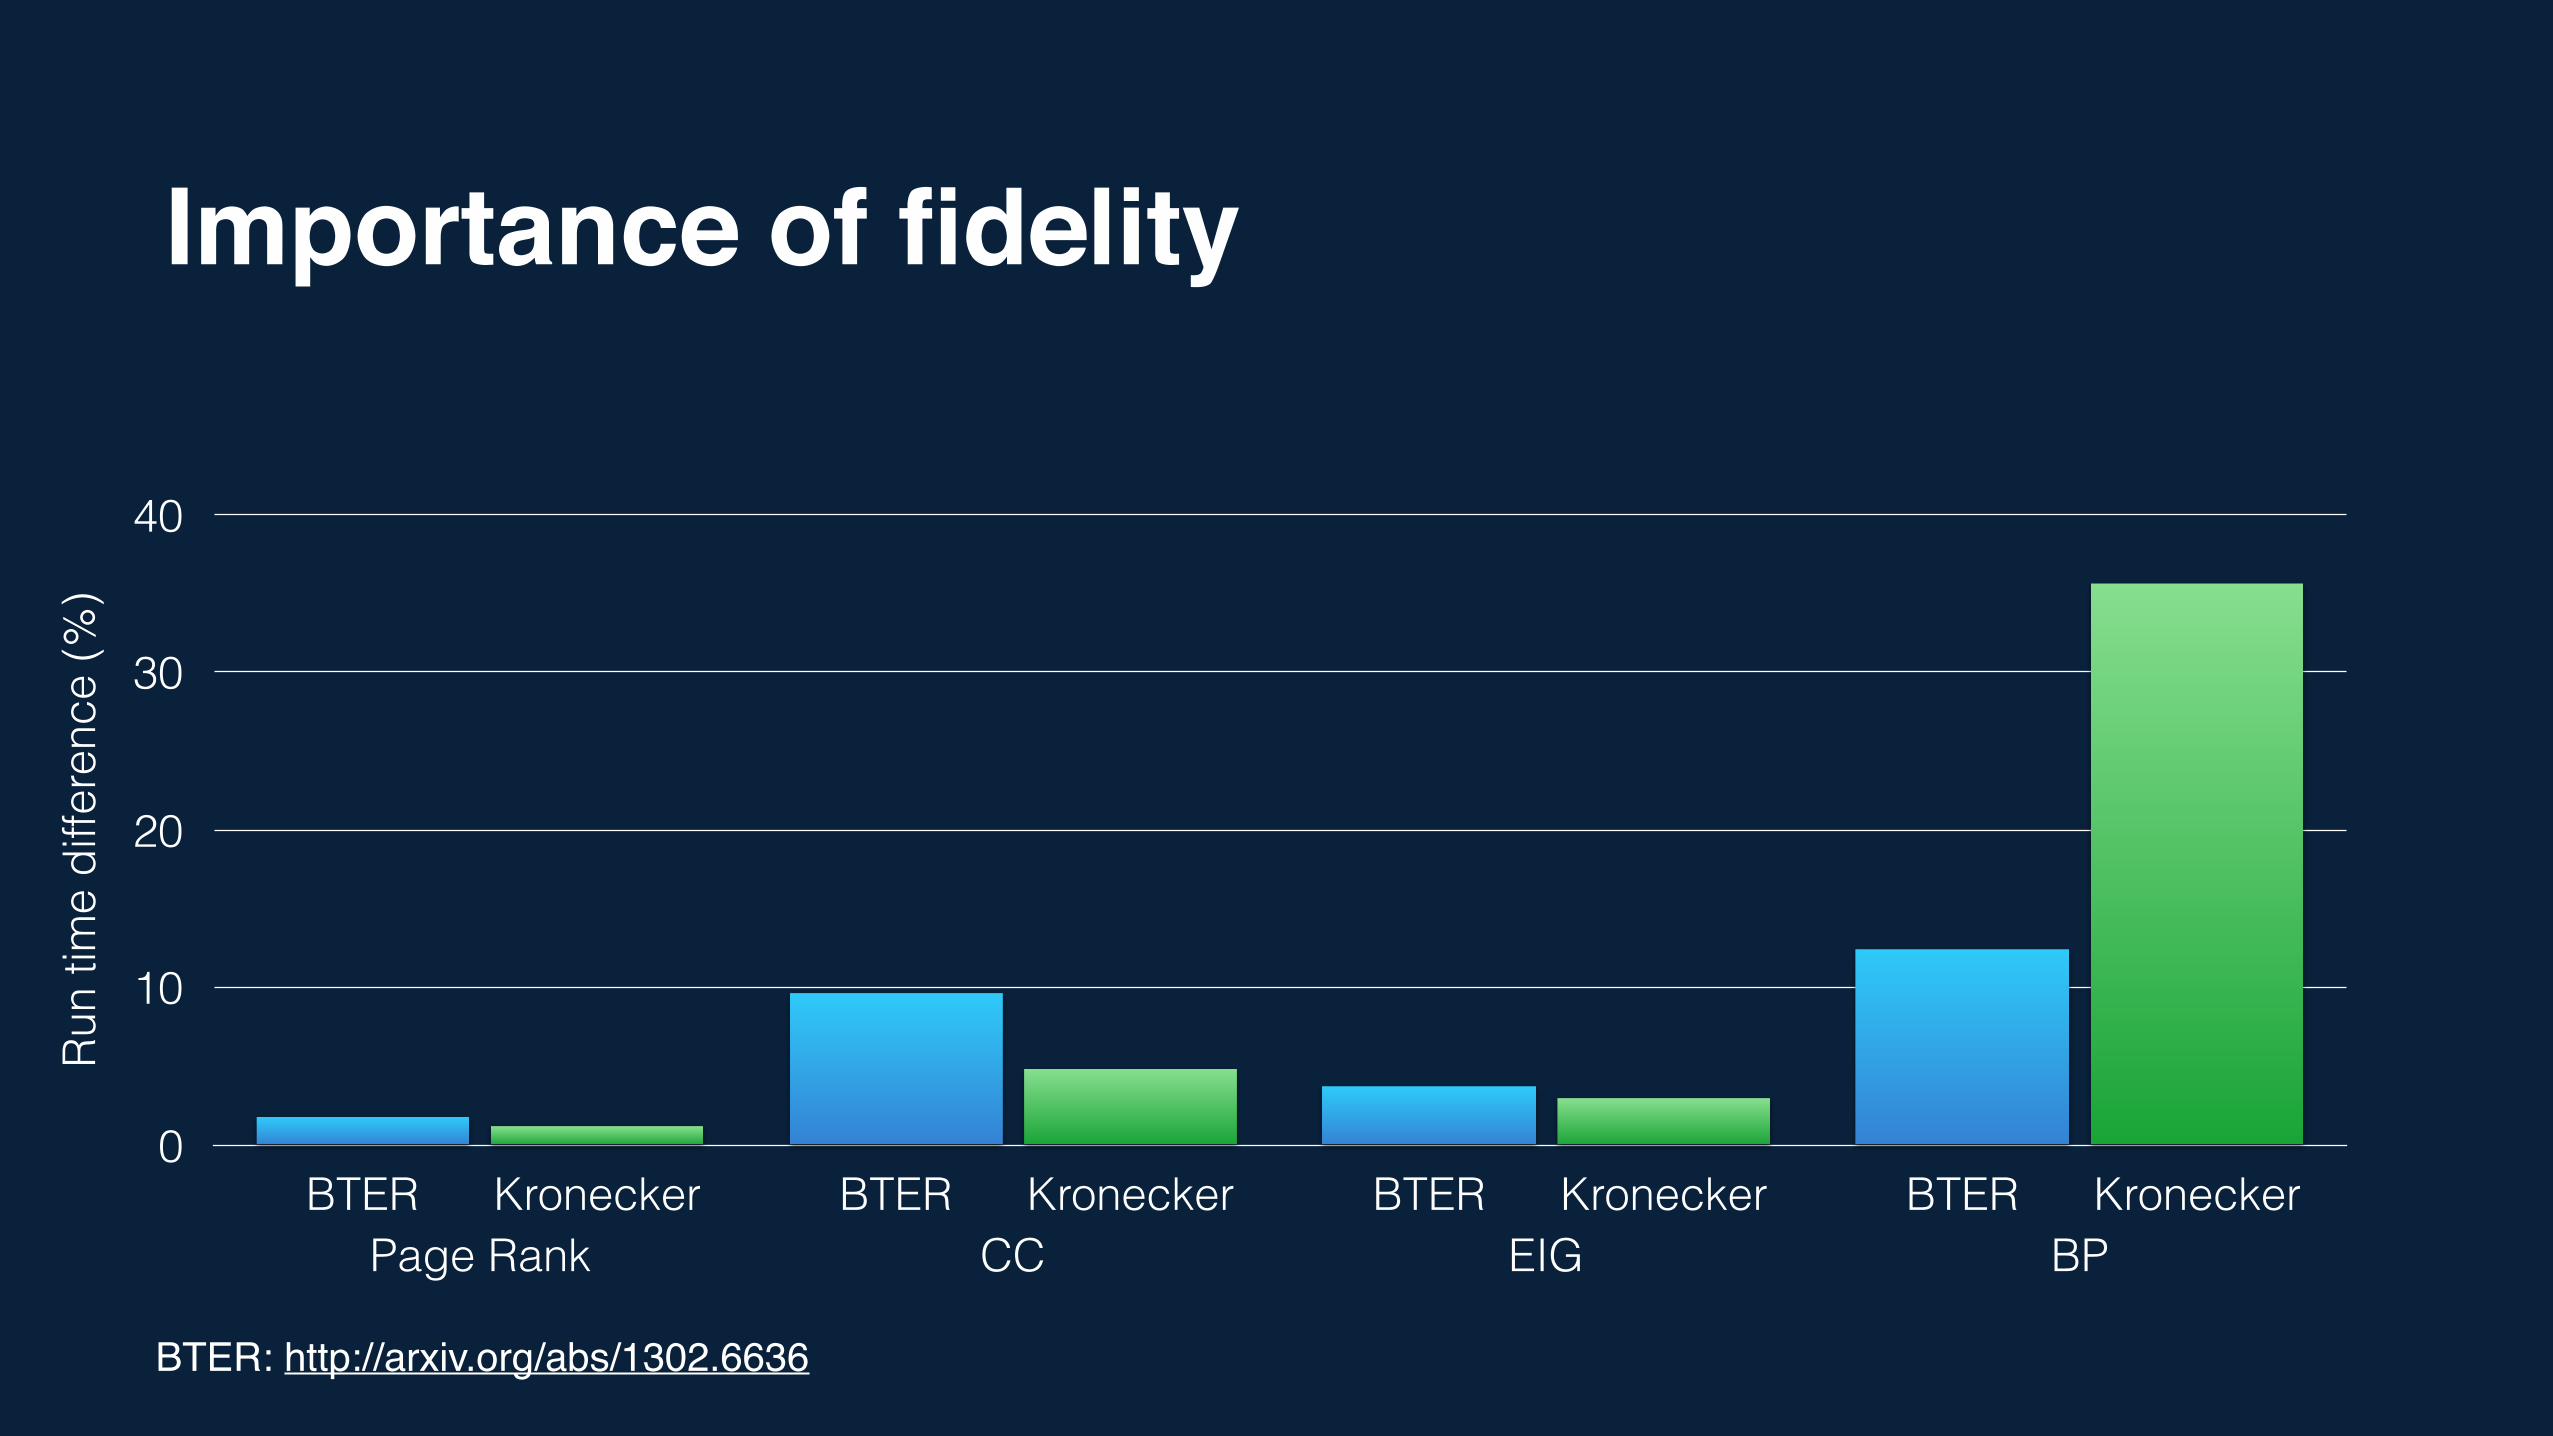
Importance of fidelityRu
n tim
e di
ffere
nce
(%)
0
10
20
30
40
Page Rank CC EIG BPBTER Kronecker BTER Kronecker BTER Kronecker BTER Kronecker
BTER: http://arxiv.org/abs/1302.6636
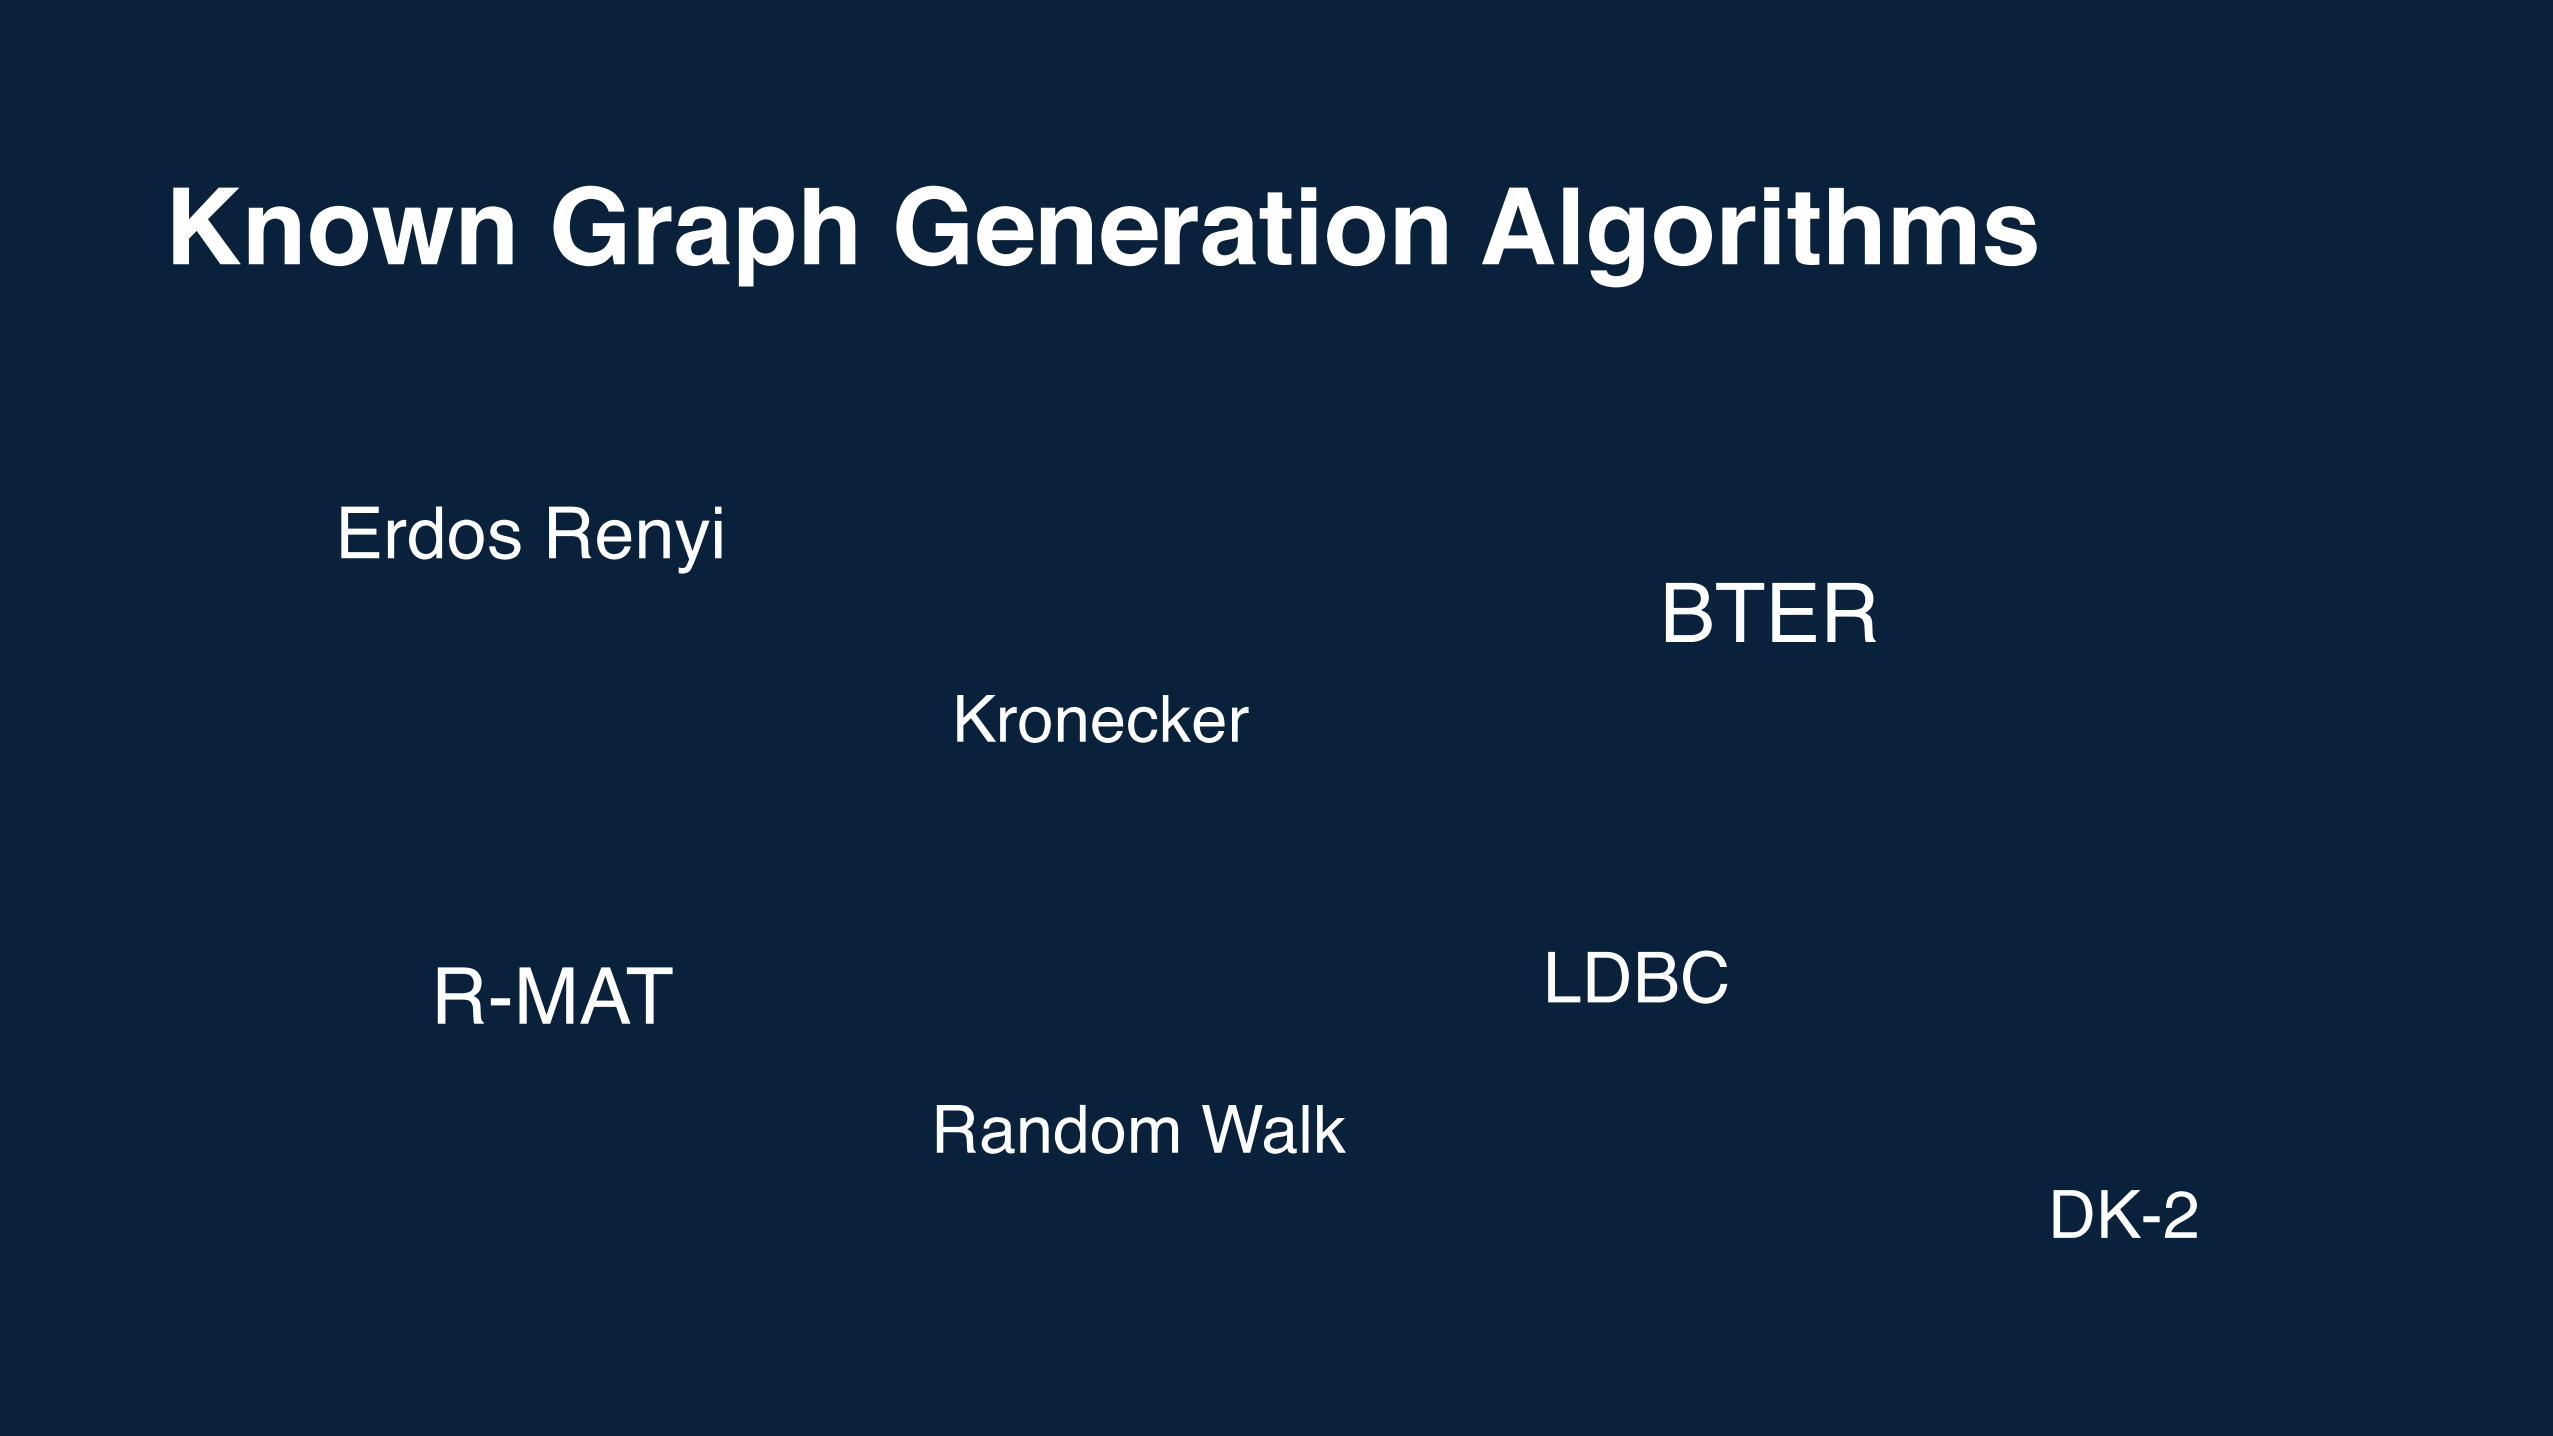
Known Graph Generation Algorithms
Erdos Renyi
KroneckerBTER
R-MAT LDBC
Random WalkDK-2
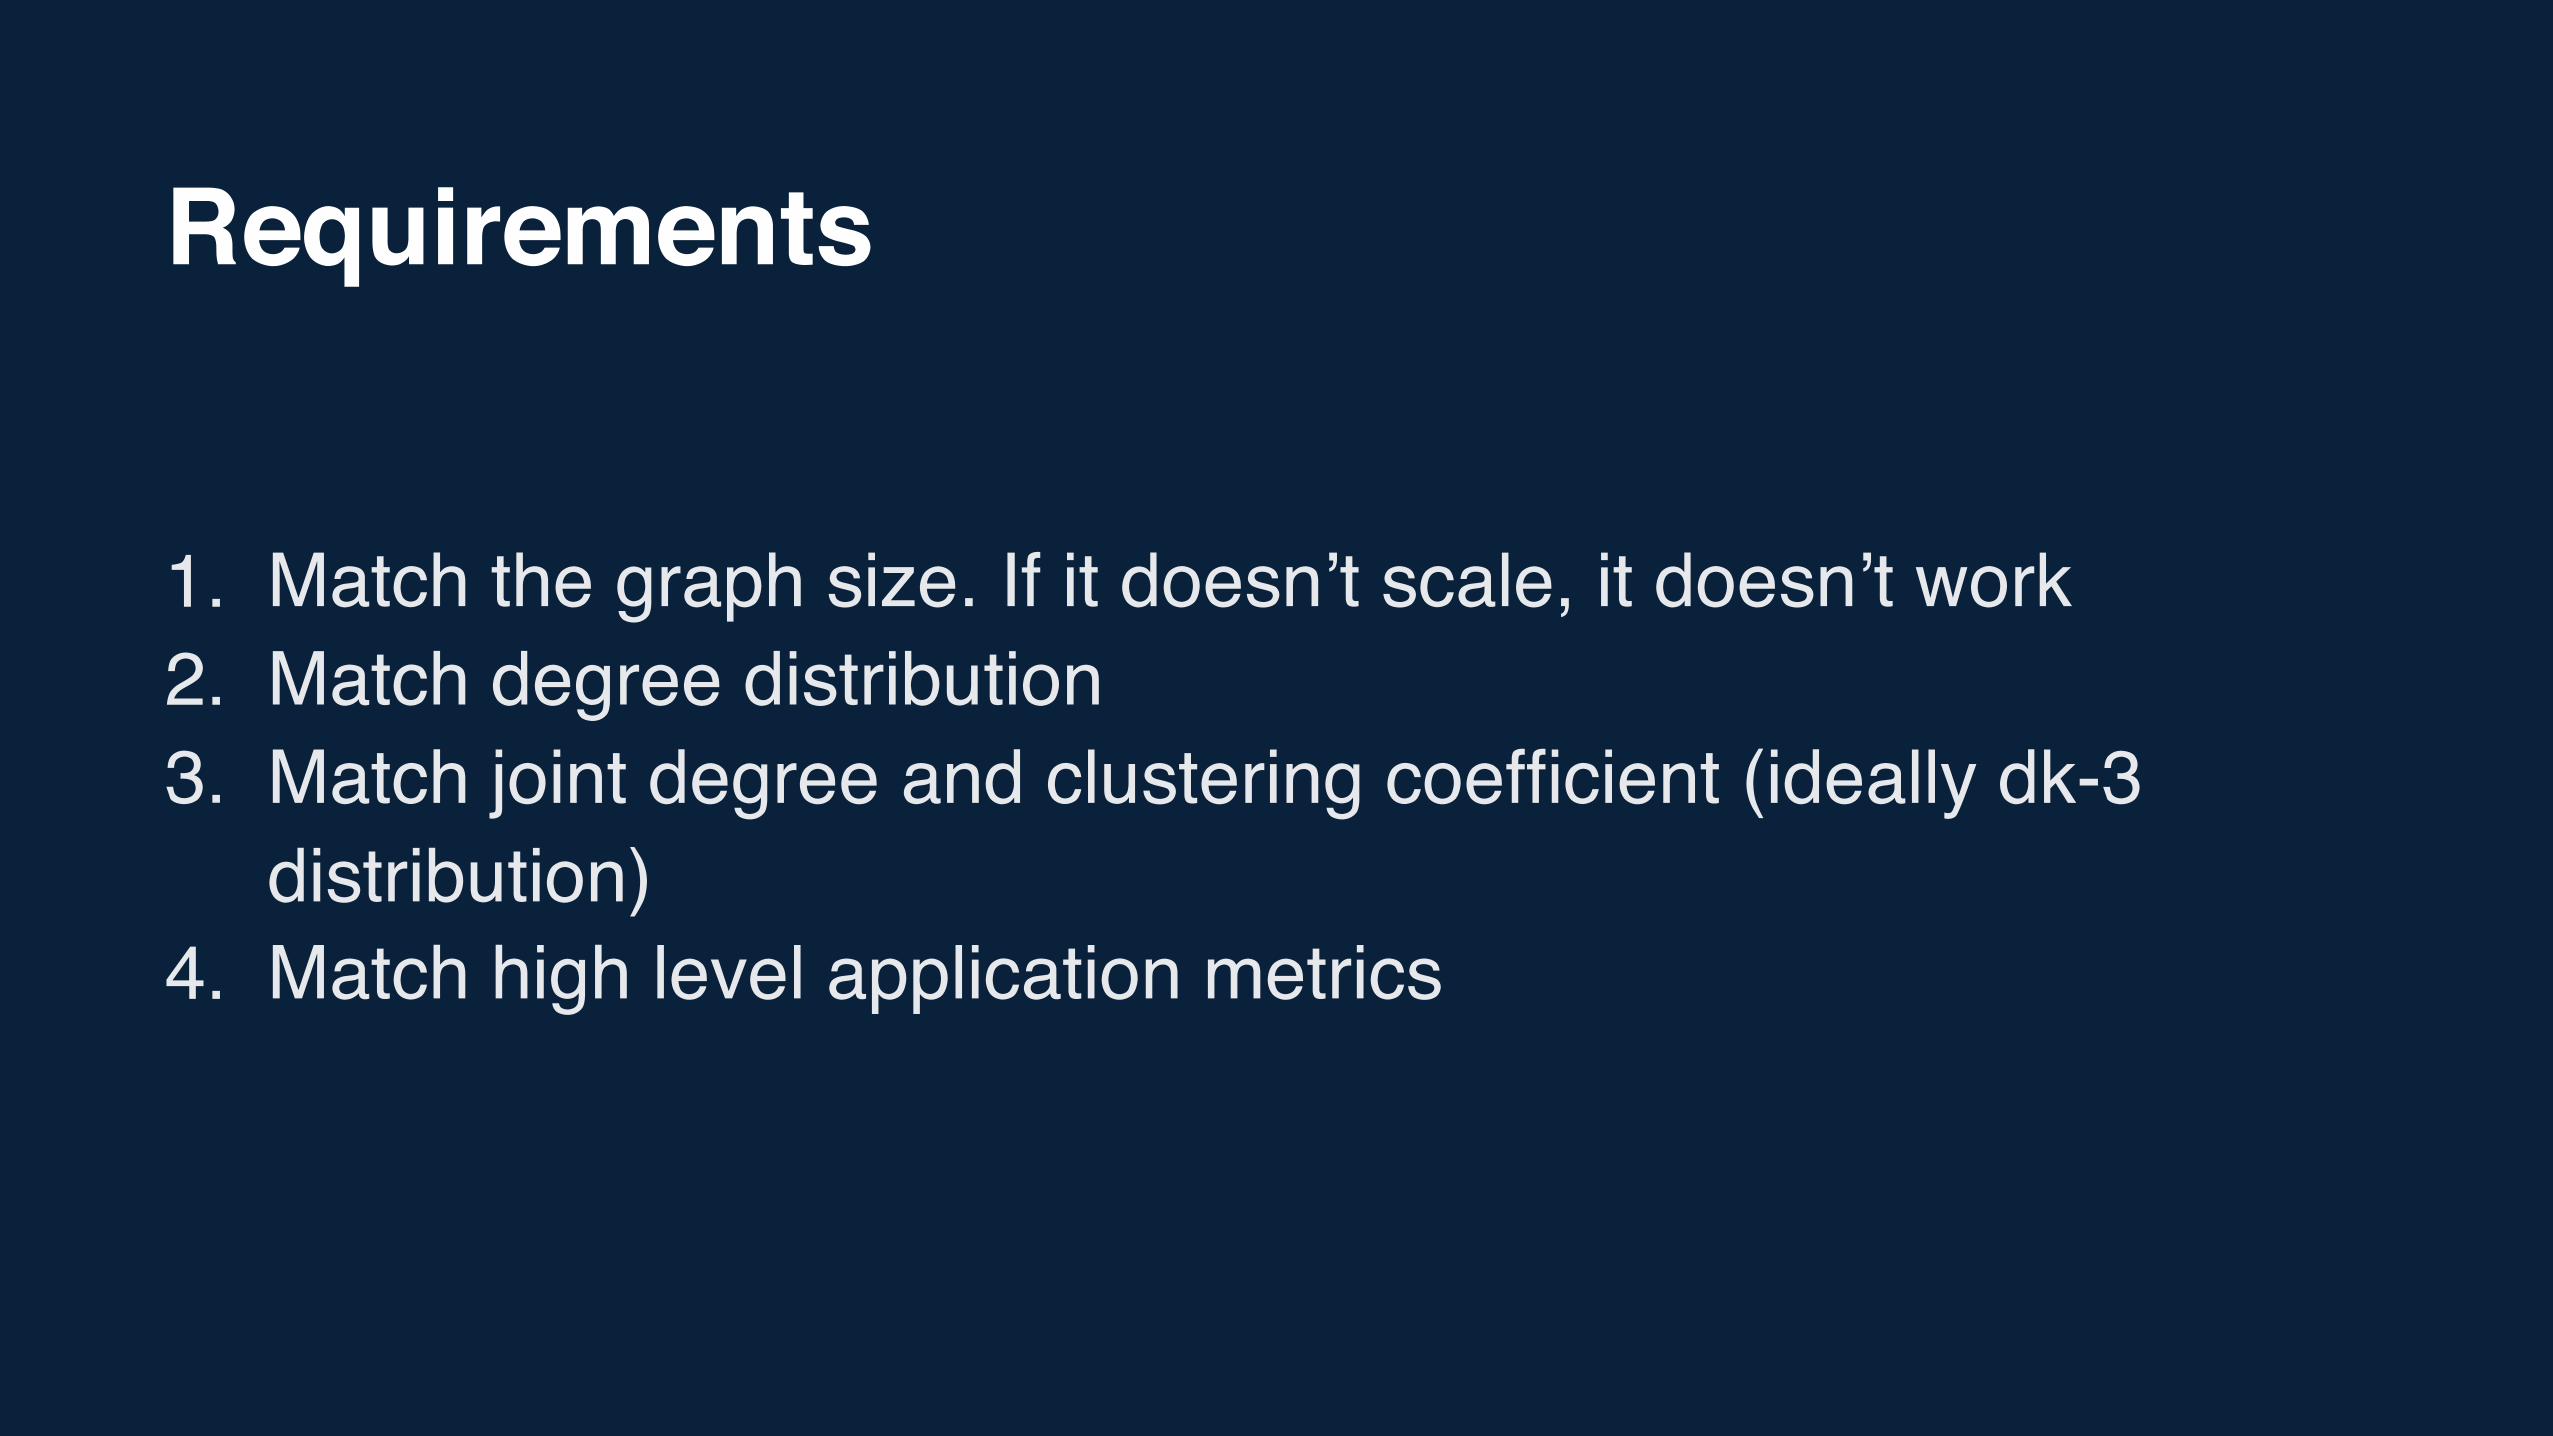
Requirements
1. Match the graph size. If it doesn’t scale, it doesn’t work2. Match degree distribution3. Match joint degree and clustering coefficient (ideally dk-3
distribution) 4. Match high level application metrics
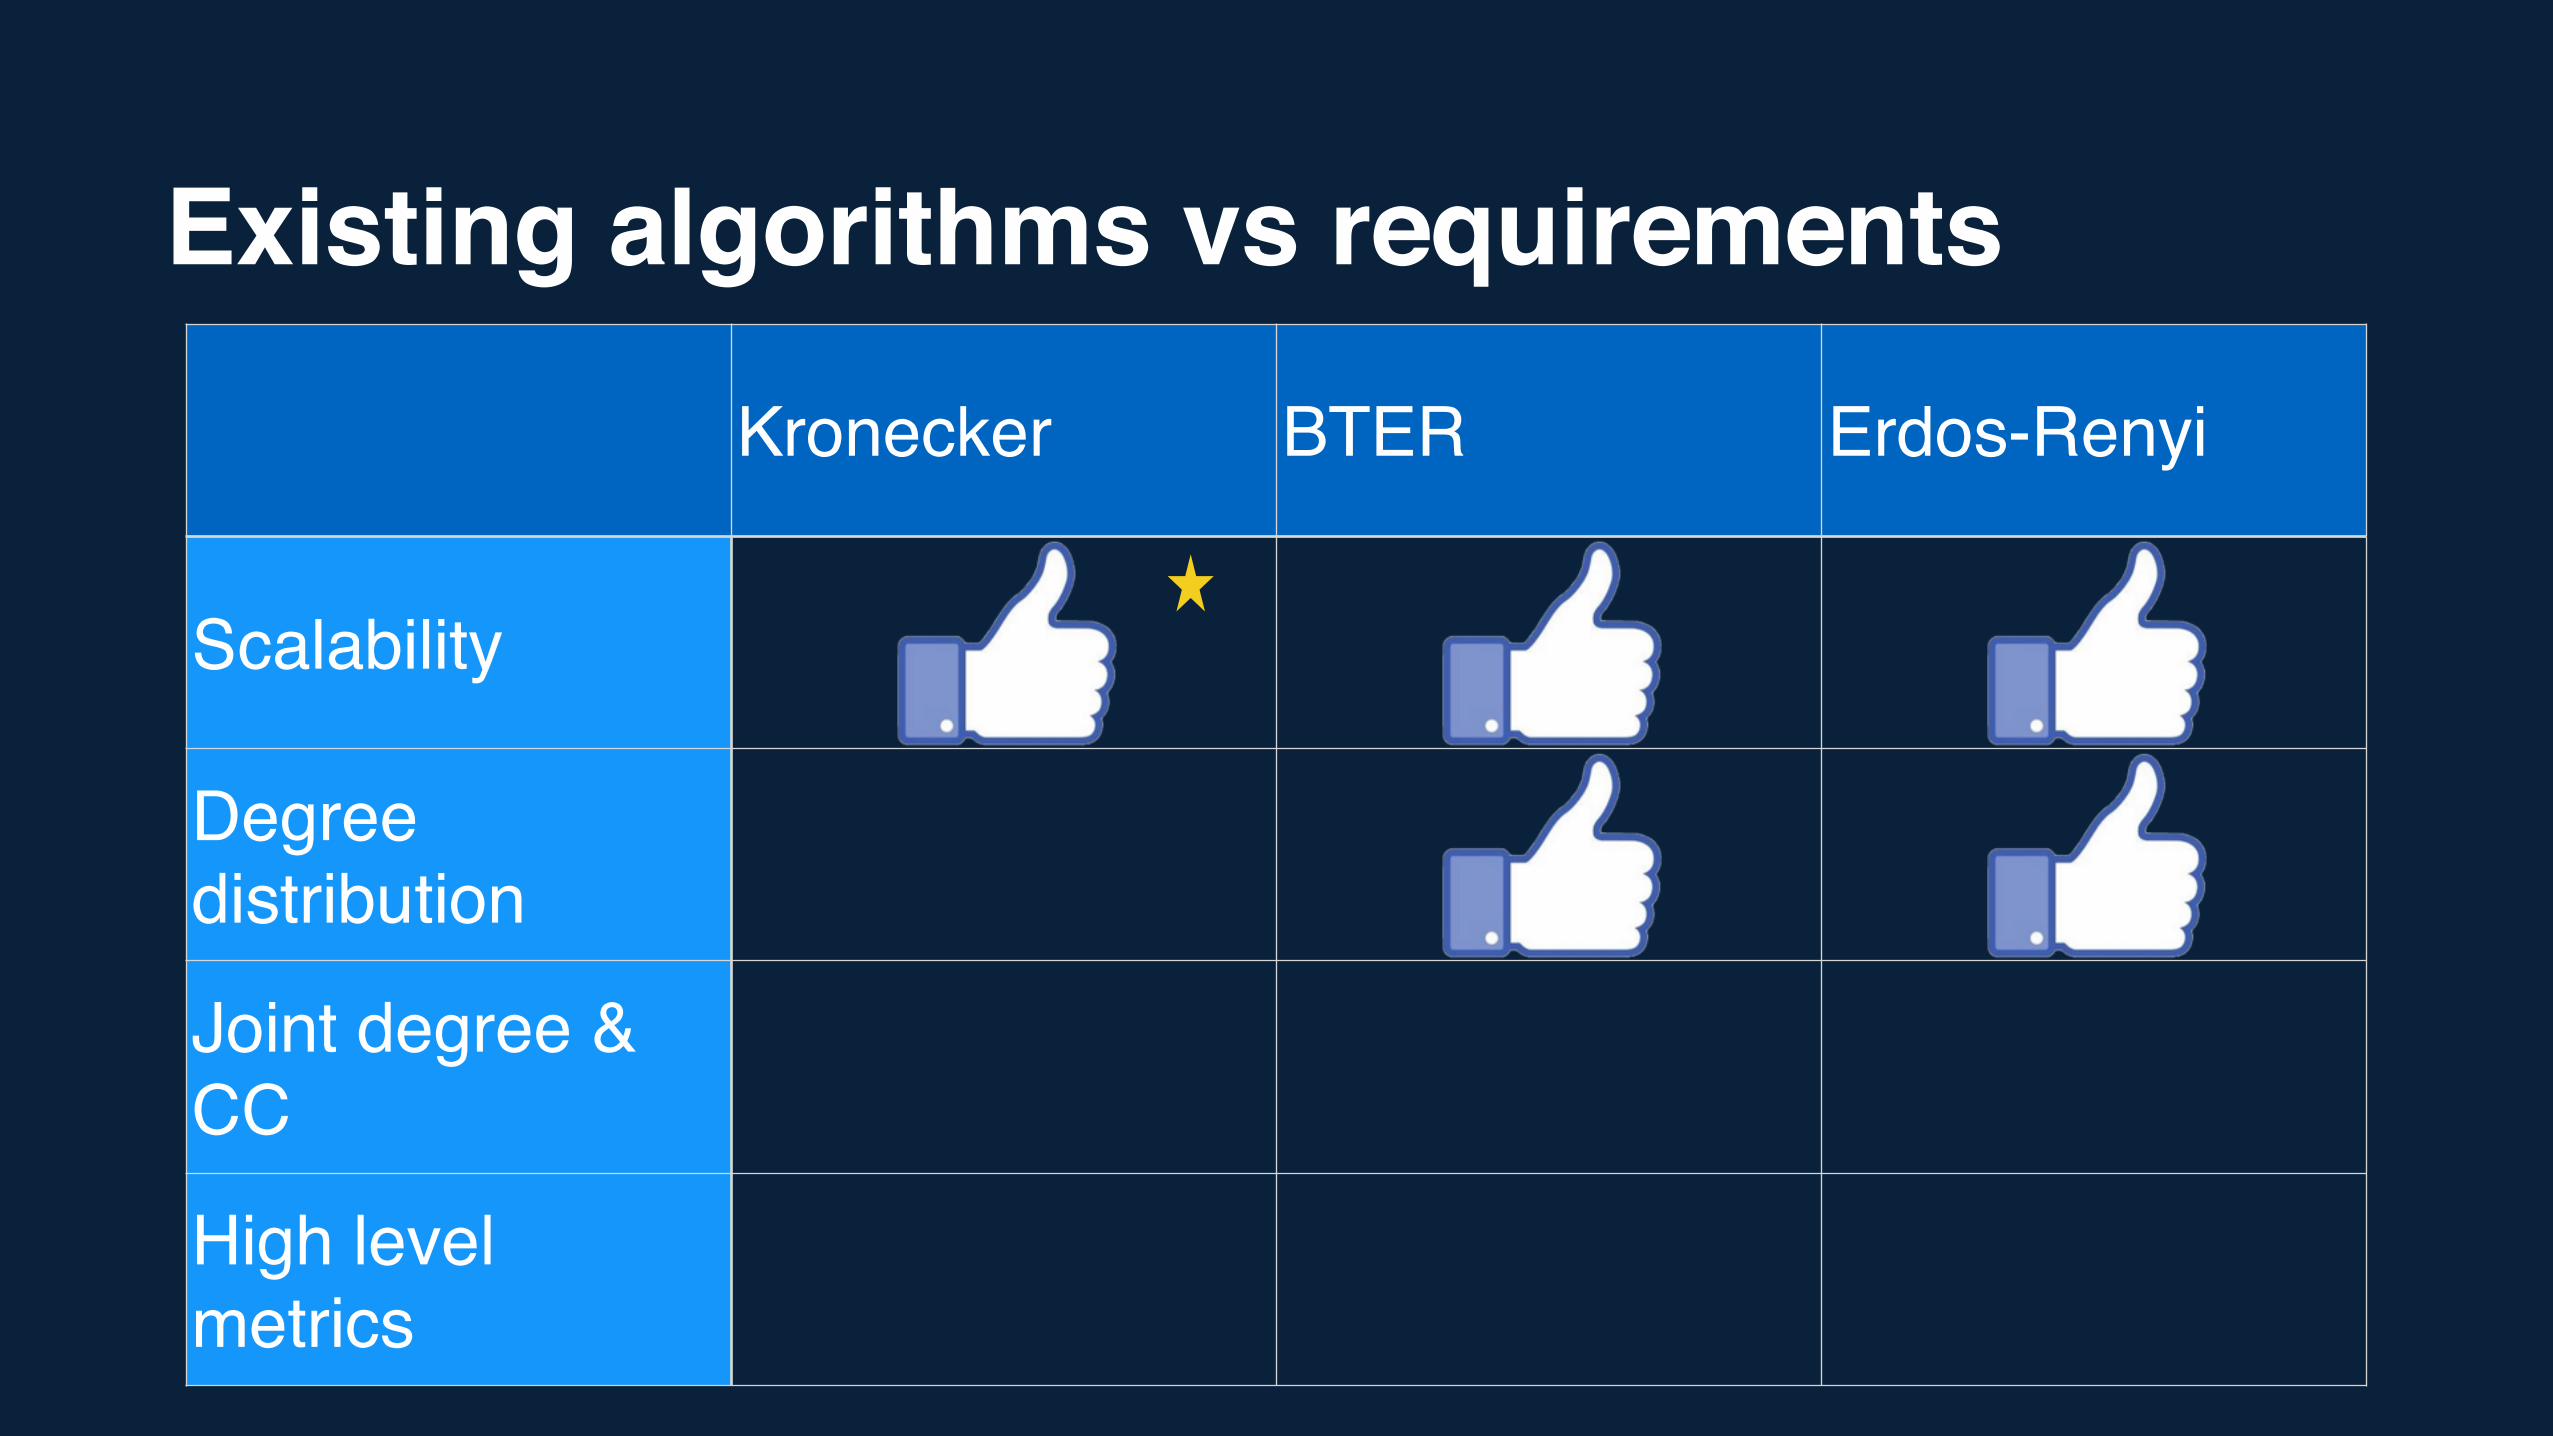
Existing algorithms vs requirementsKronecker BTER Erdos-Renyi
Scalability
Degree distribution
Joint degree & CC
High level metrics
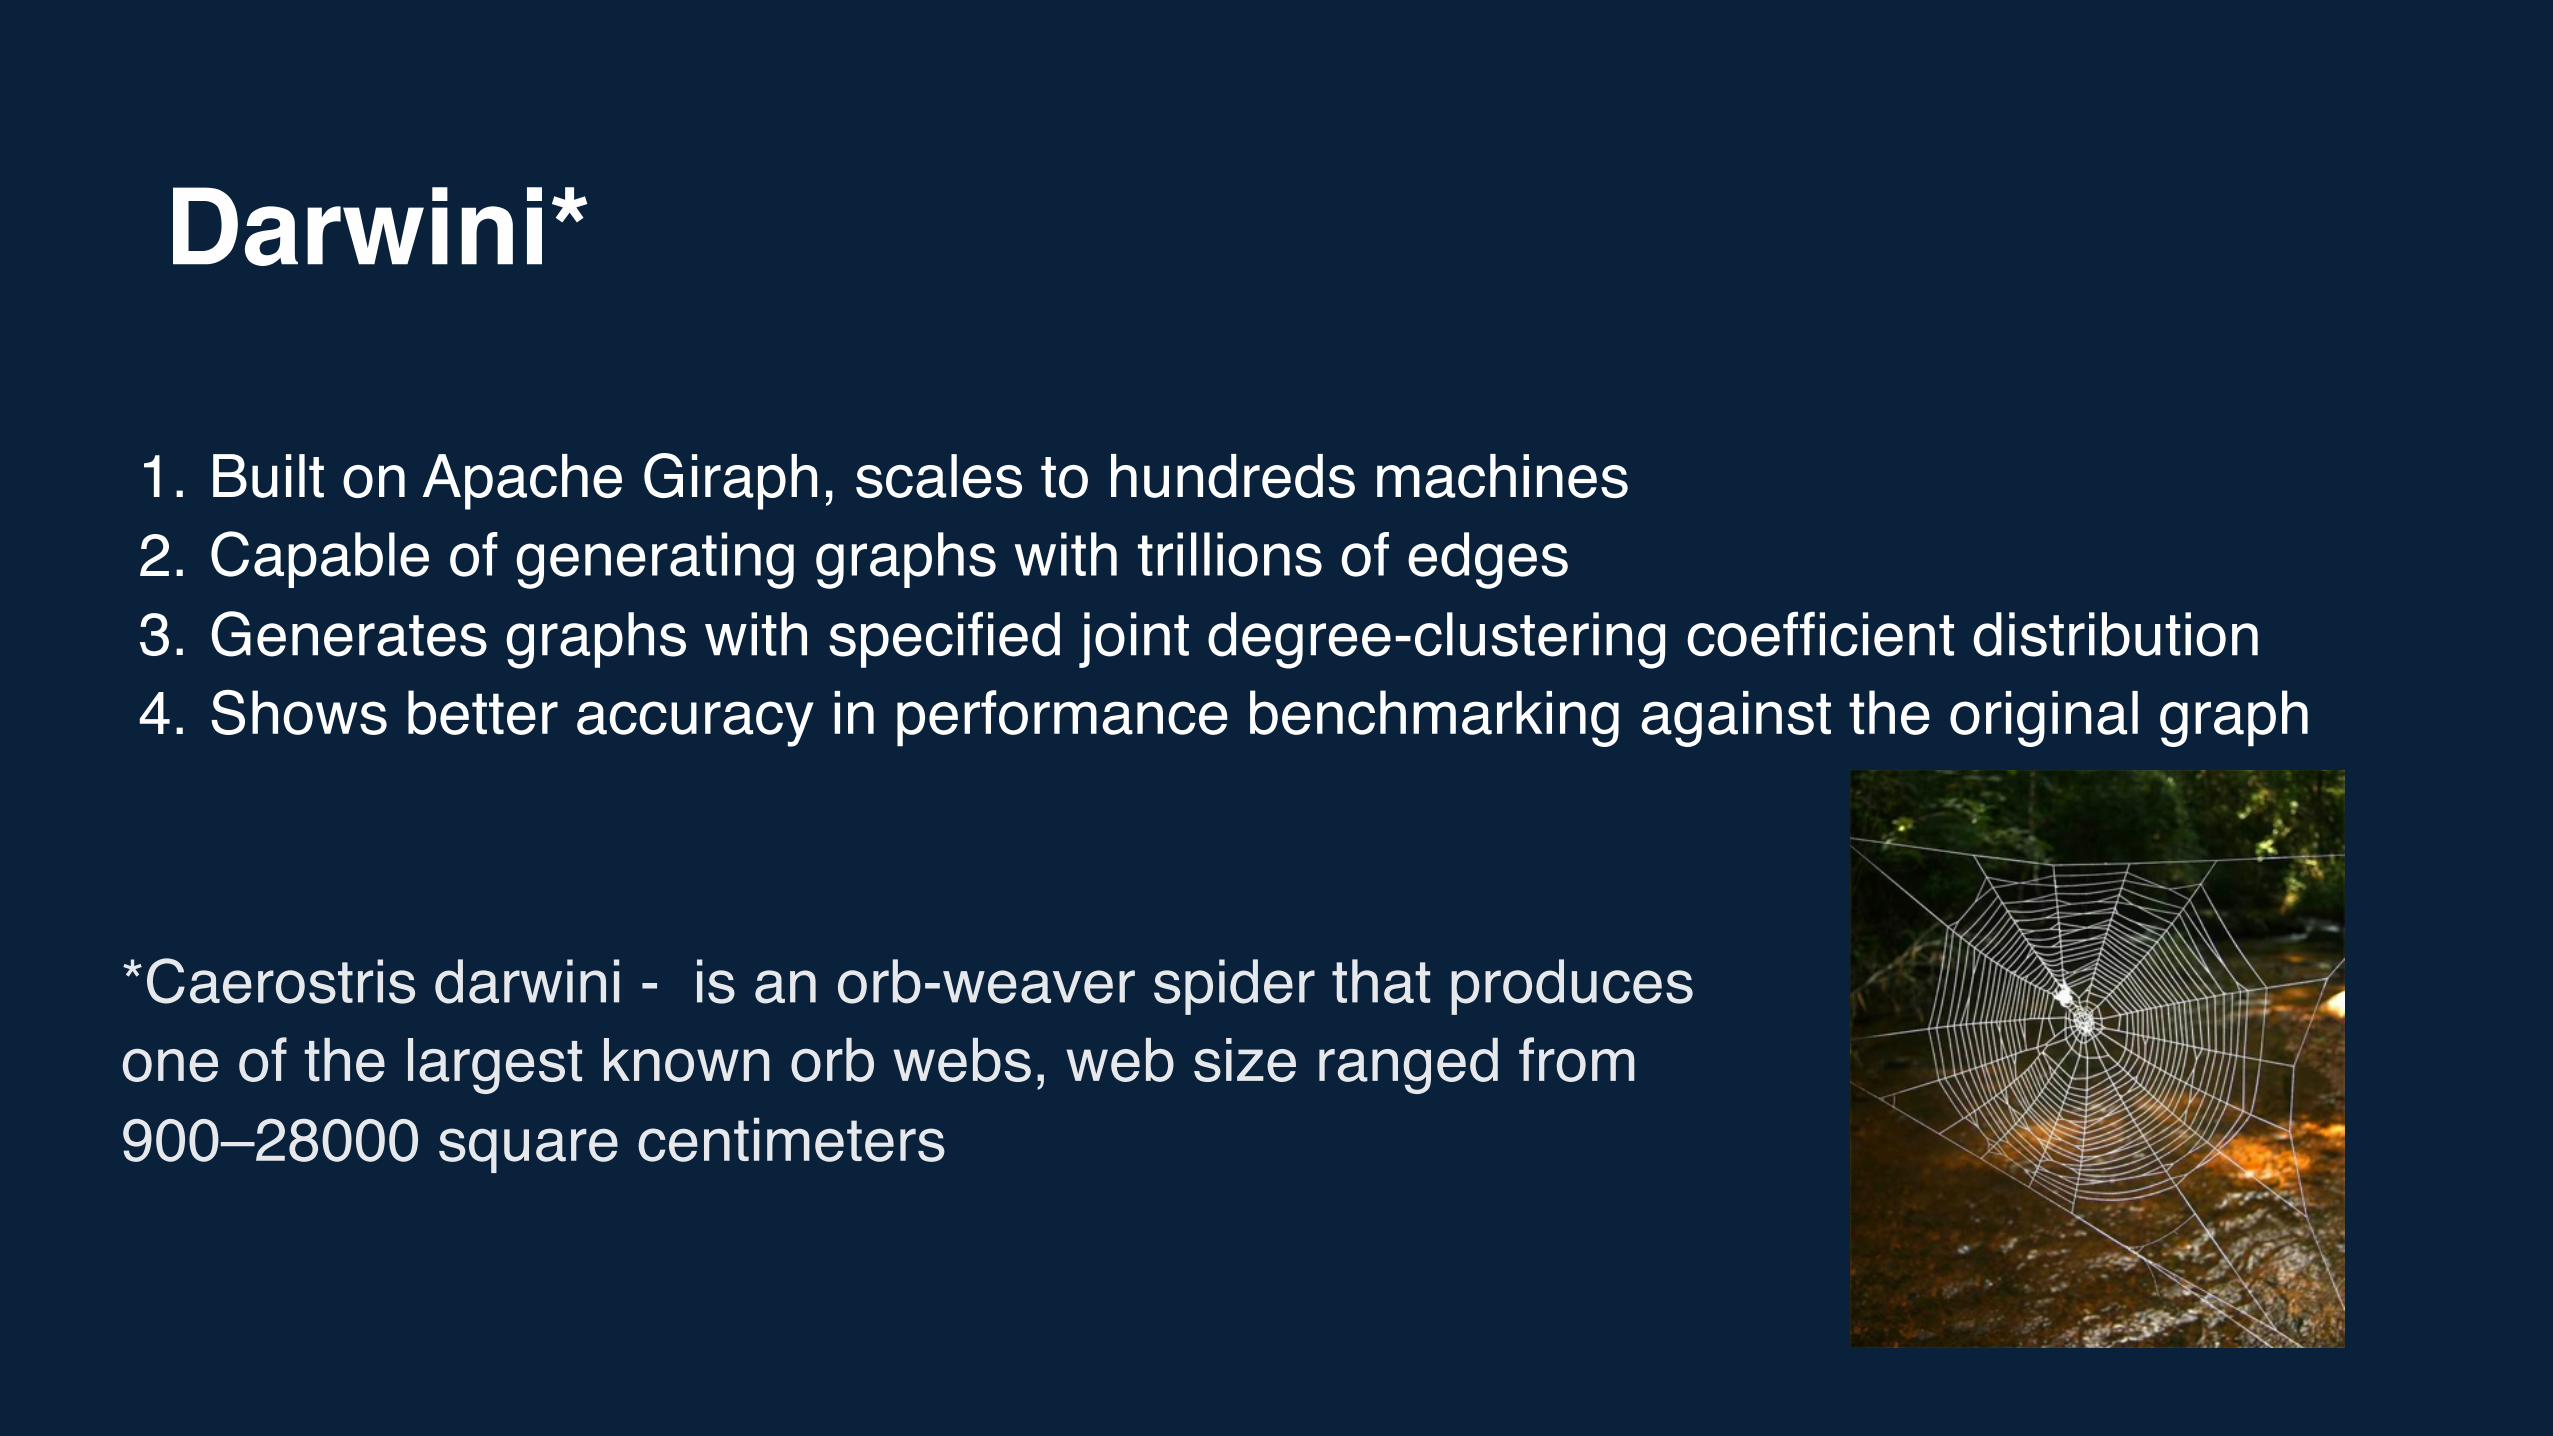
Darwini*
*Caerostris darwini - is an orb-weaver spider that produces one of the largest known orb webs, web size ranged from 900–28000 square centimeters
1. Built on Apache Giraph, scales to hundreds machines2. Capable of generating graphs with trillions of edges3. Generates graphs with specified joint degree-clustering coefficient distribution4. Shows better accuracy in performance benchmarking against the original graph
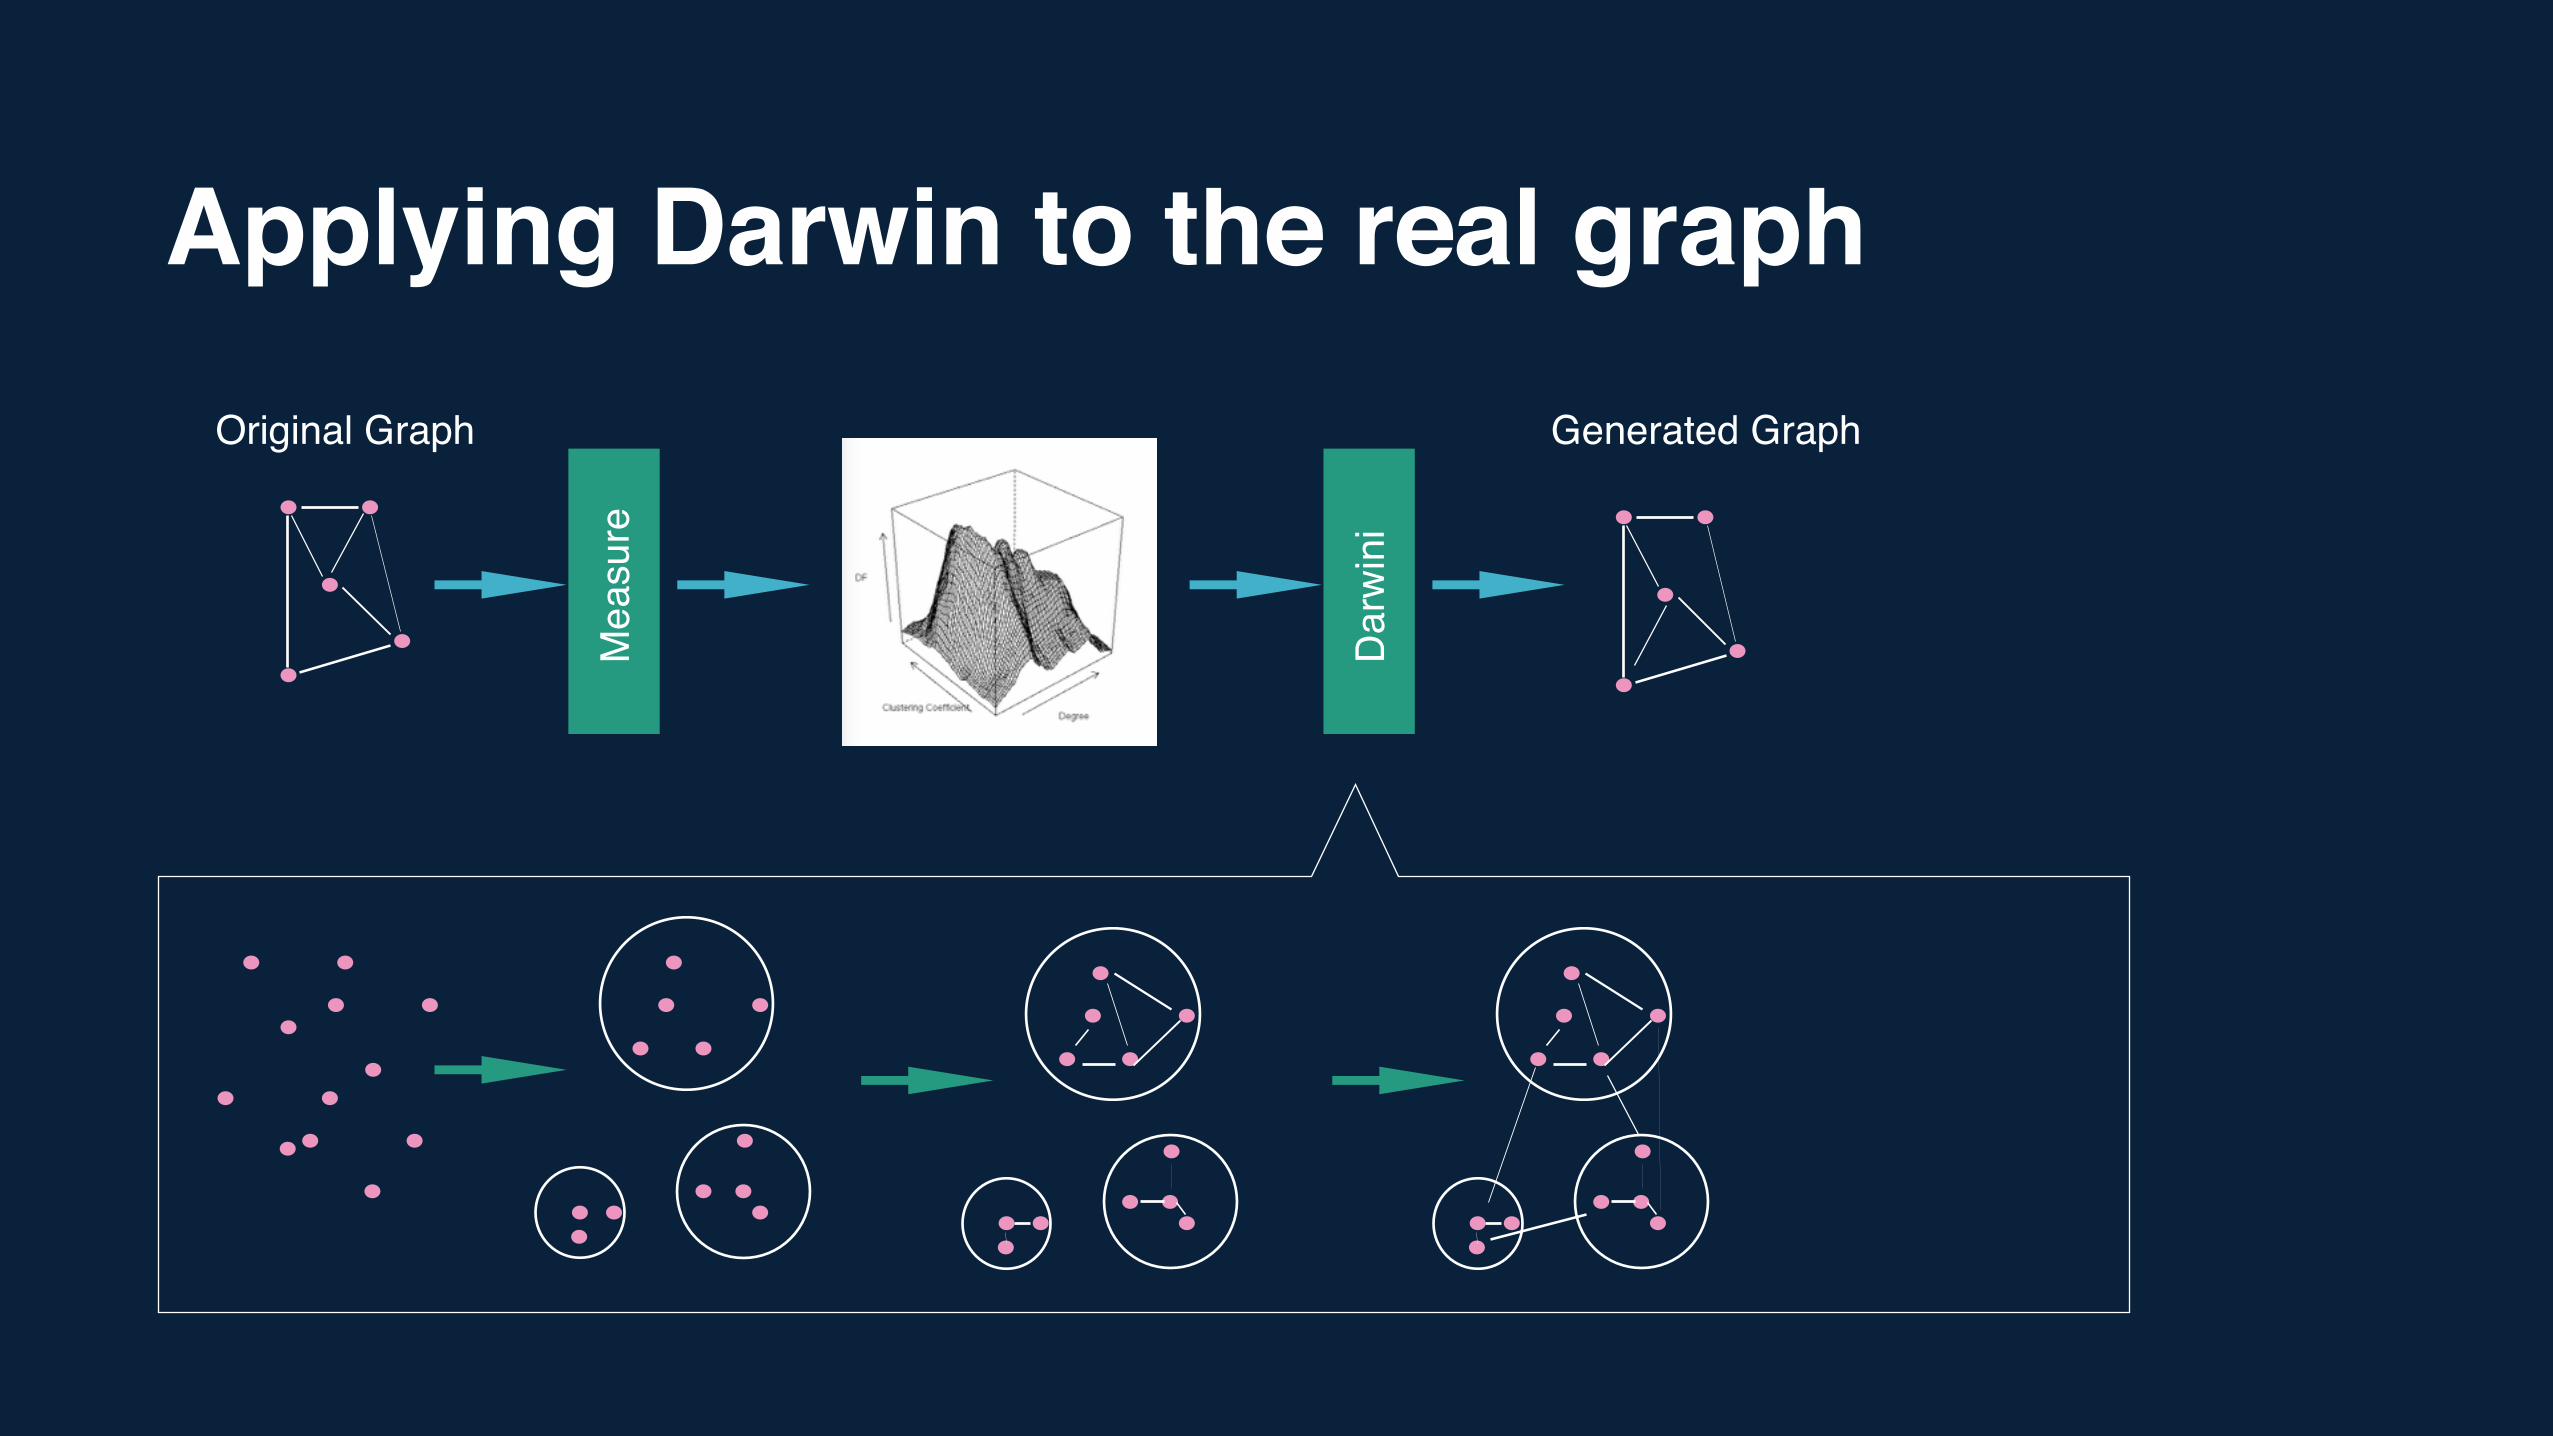
Applying Darwin to the real graphOriginal Graph
Mea
sure
Dar
win
i
Generated Graph
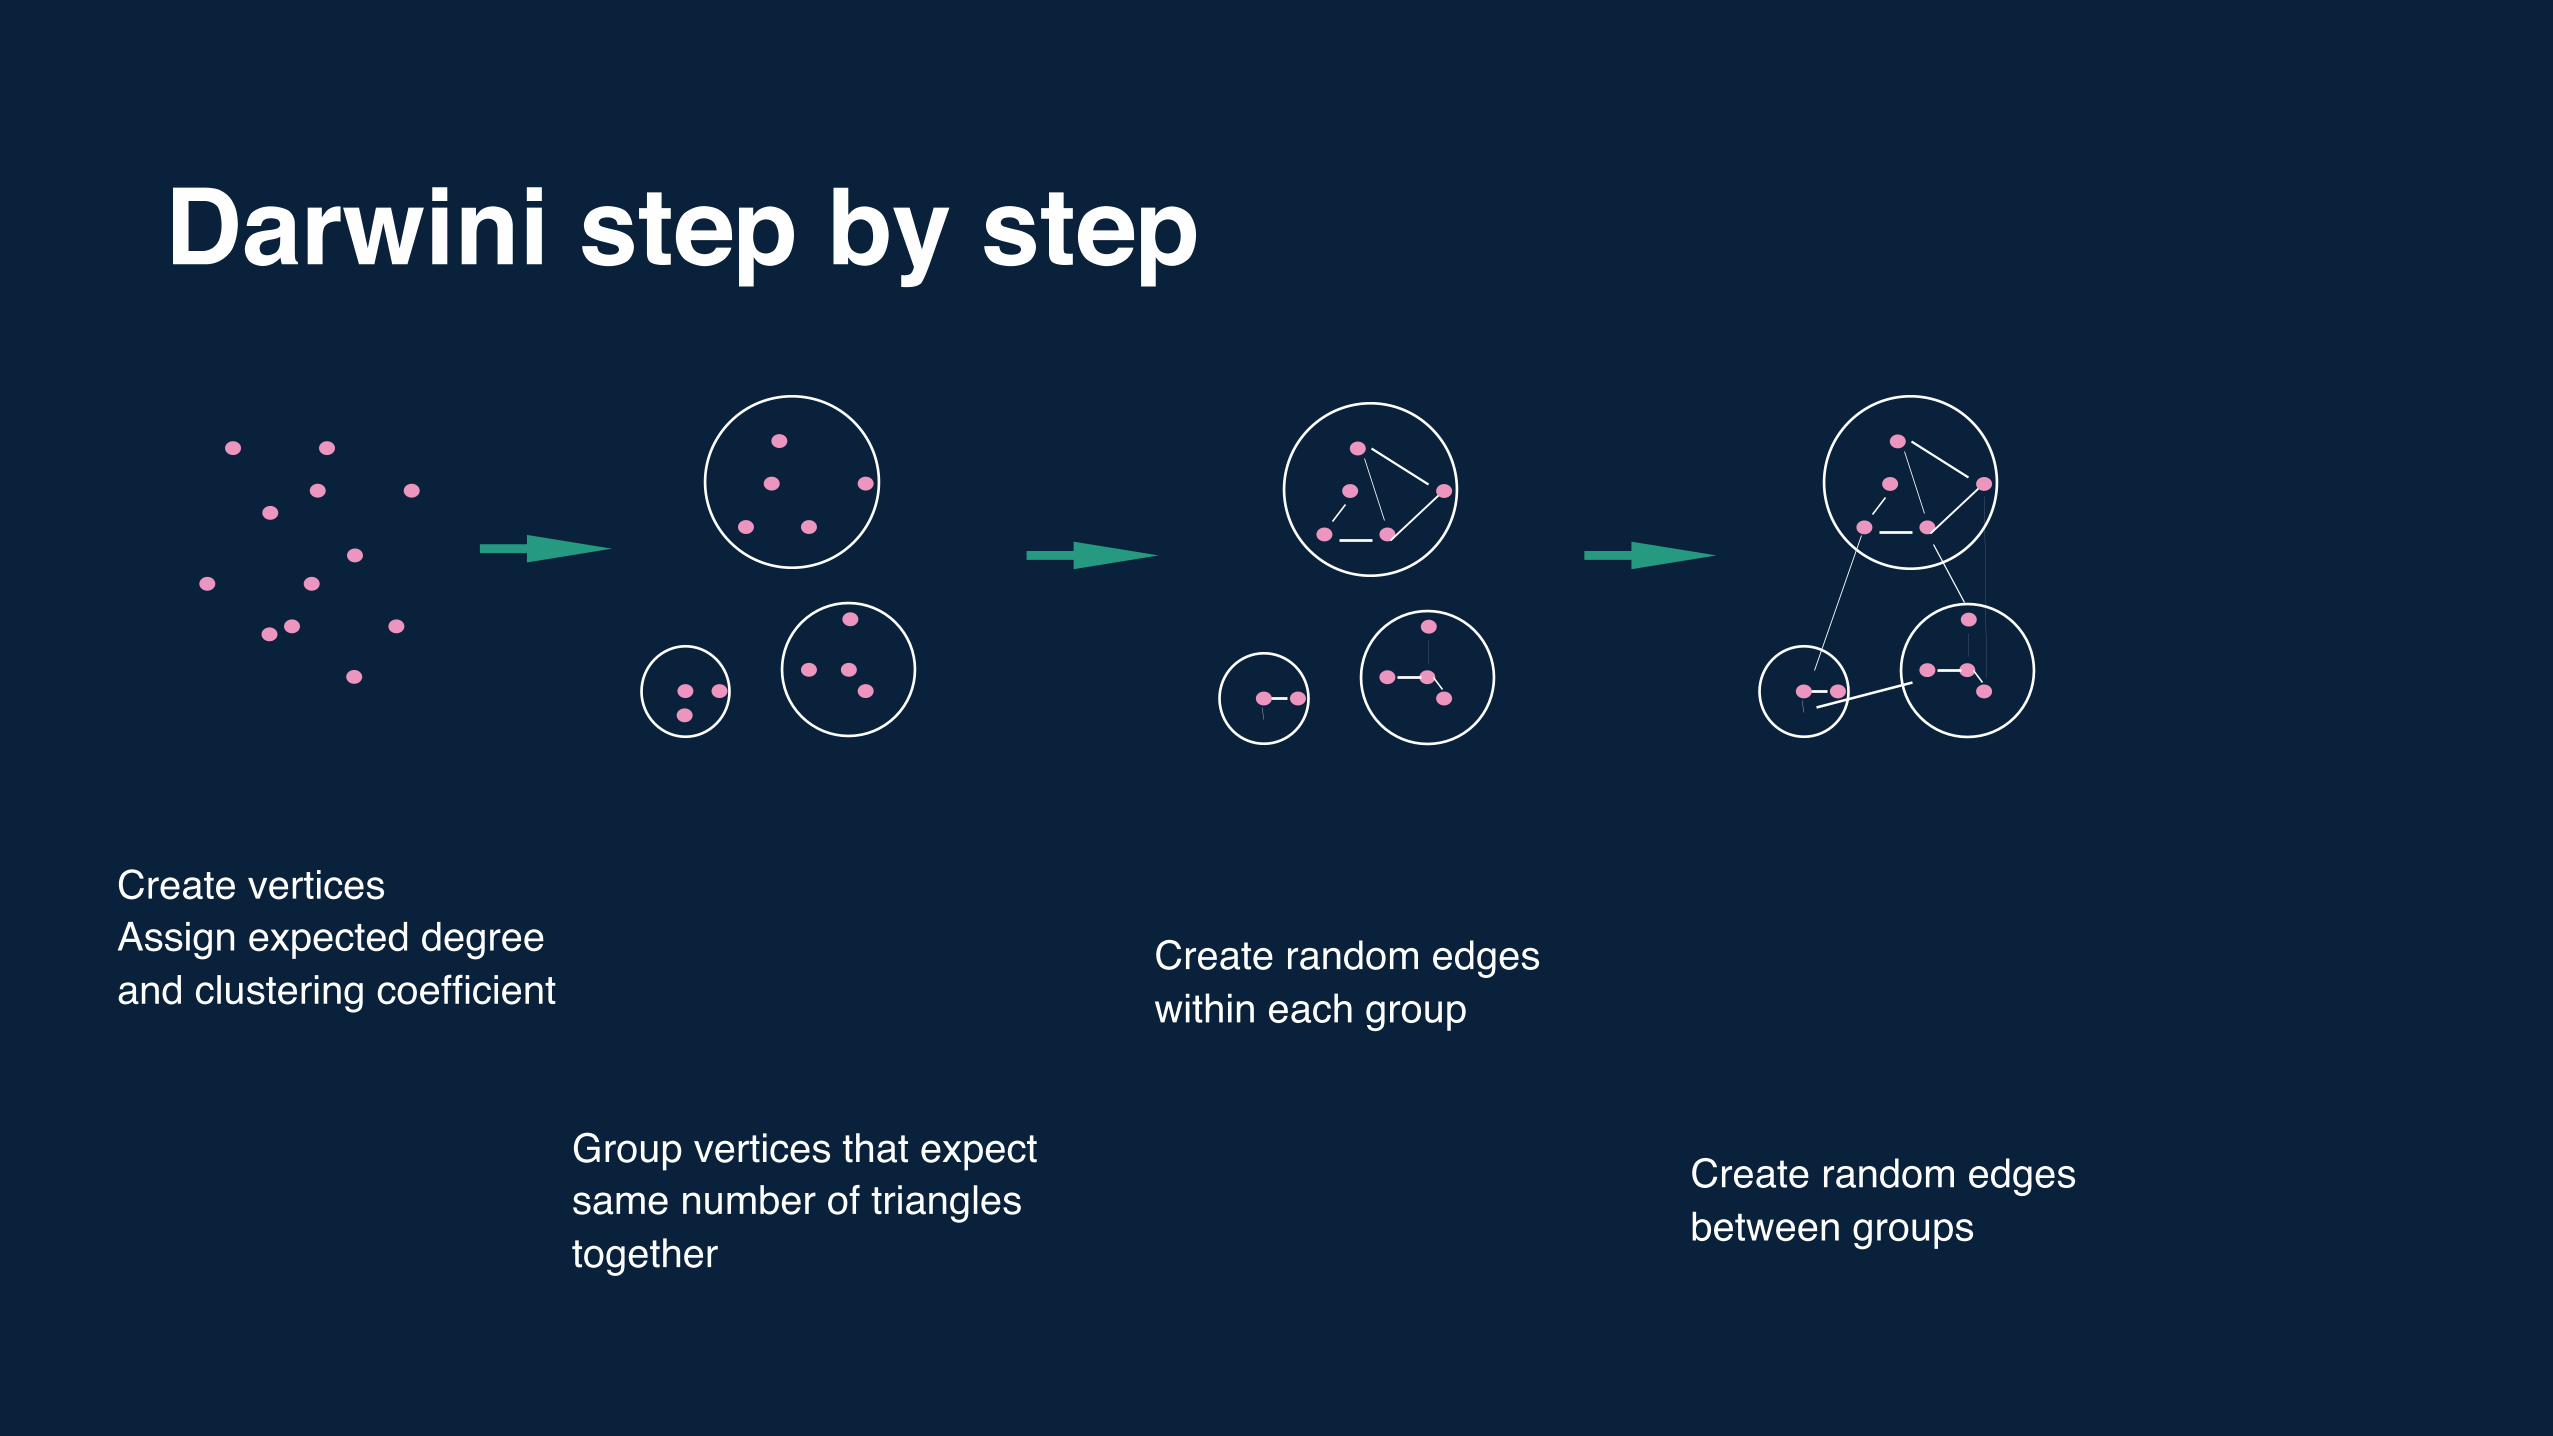
Darwini step by step
Create verticesAssign expected degreeand clustering coefficient
Group vertices that expect same number of triangles together
Create random edgeswithin each group
Create random edgesbetween groups
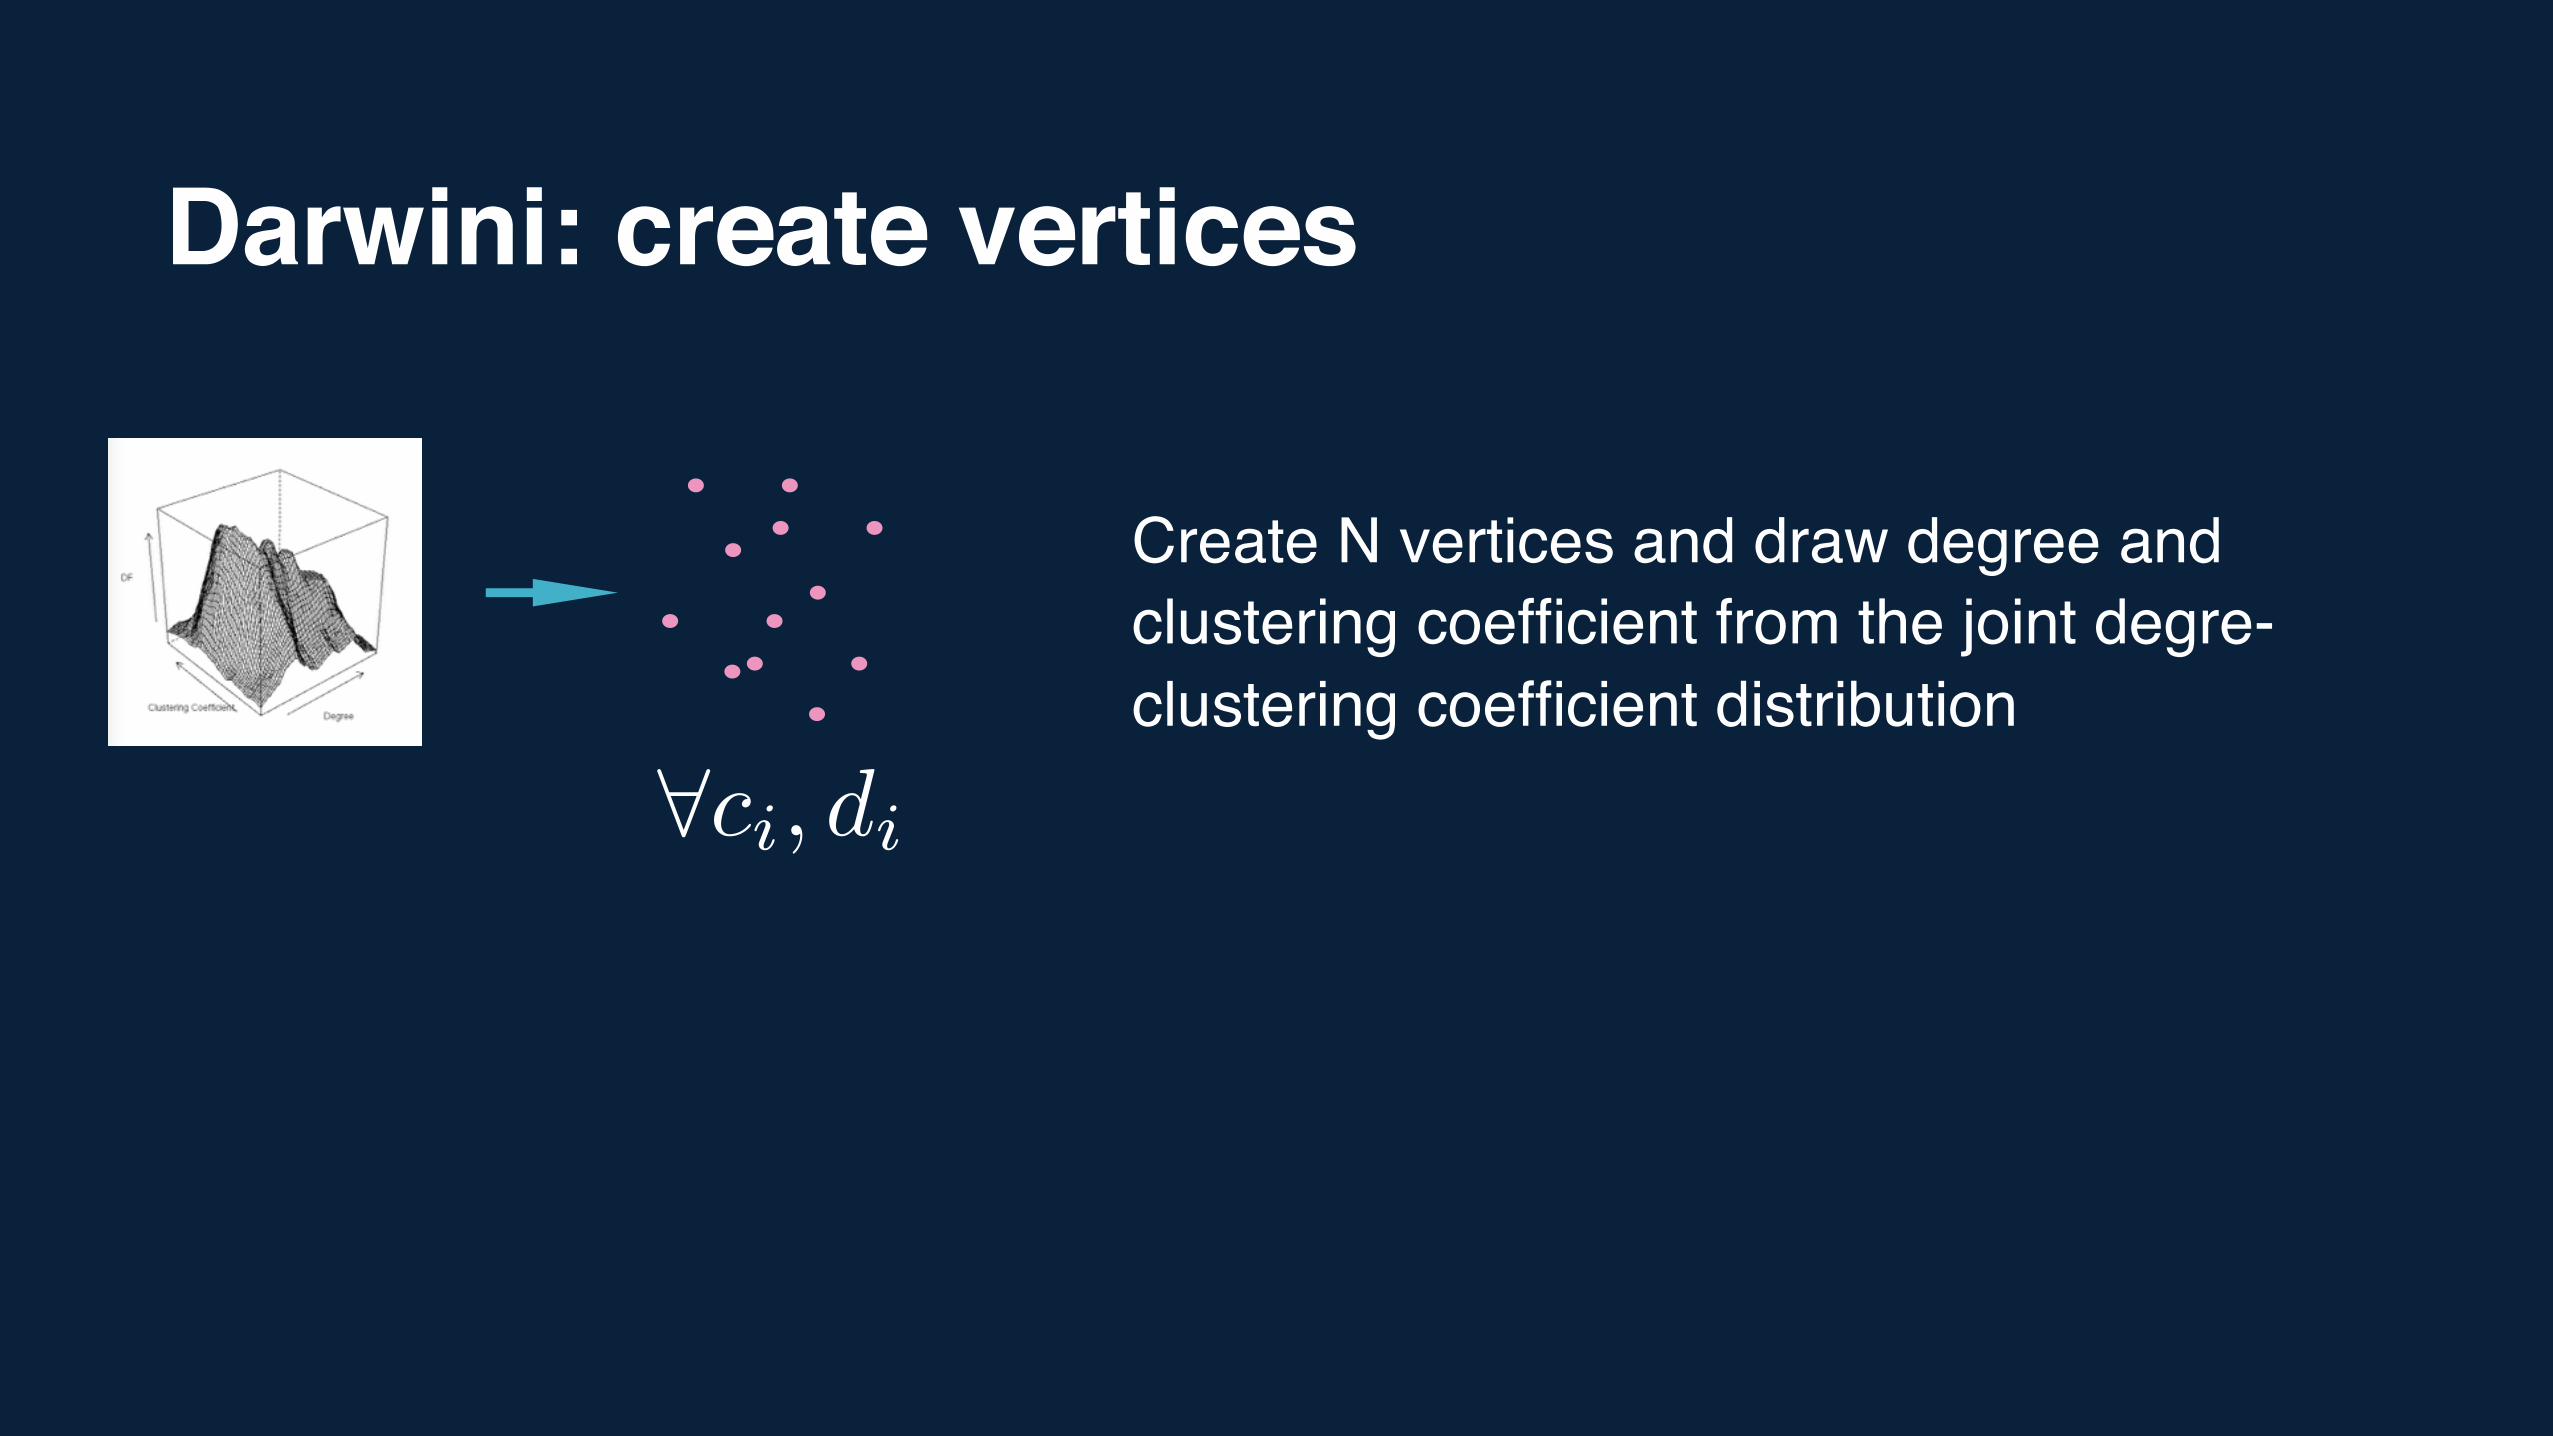
Darwini: create vertices
Create N vertices and draw degree and clustering coefficient from the joint degre-clustering coefficient distribution
8ci, di
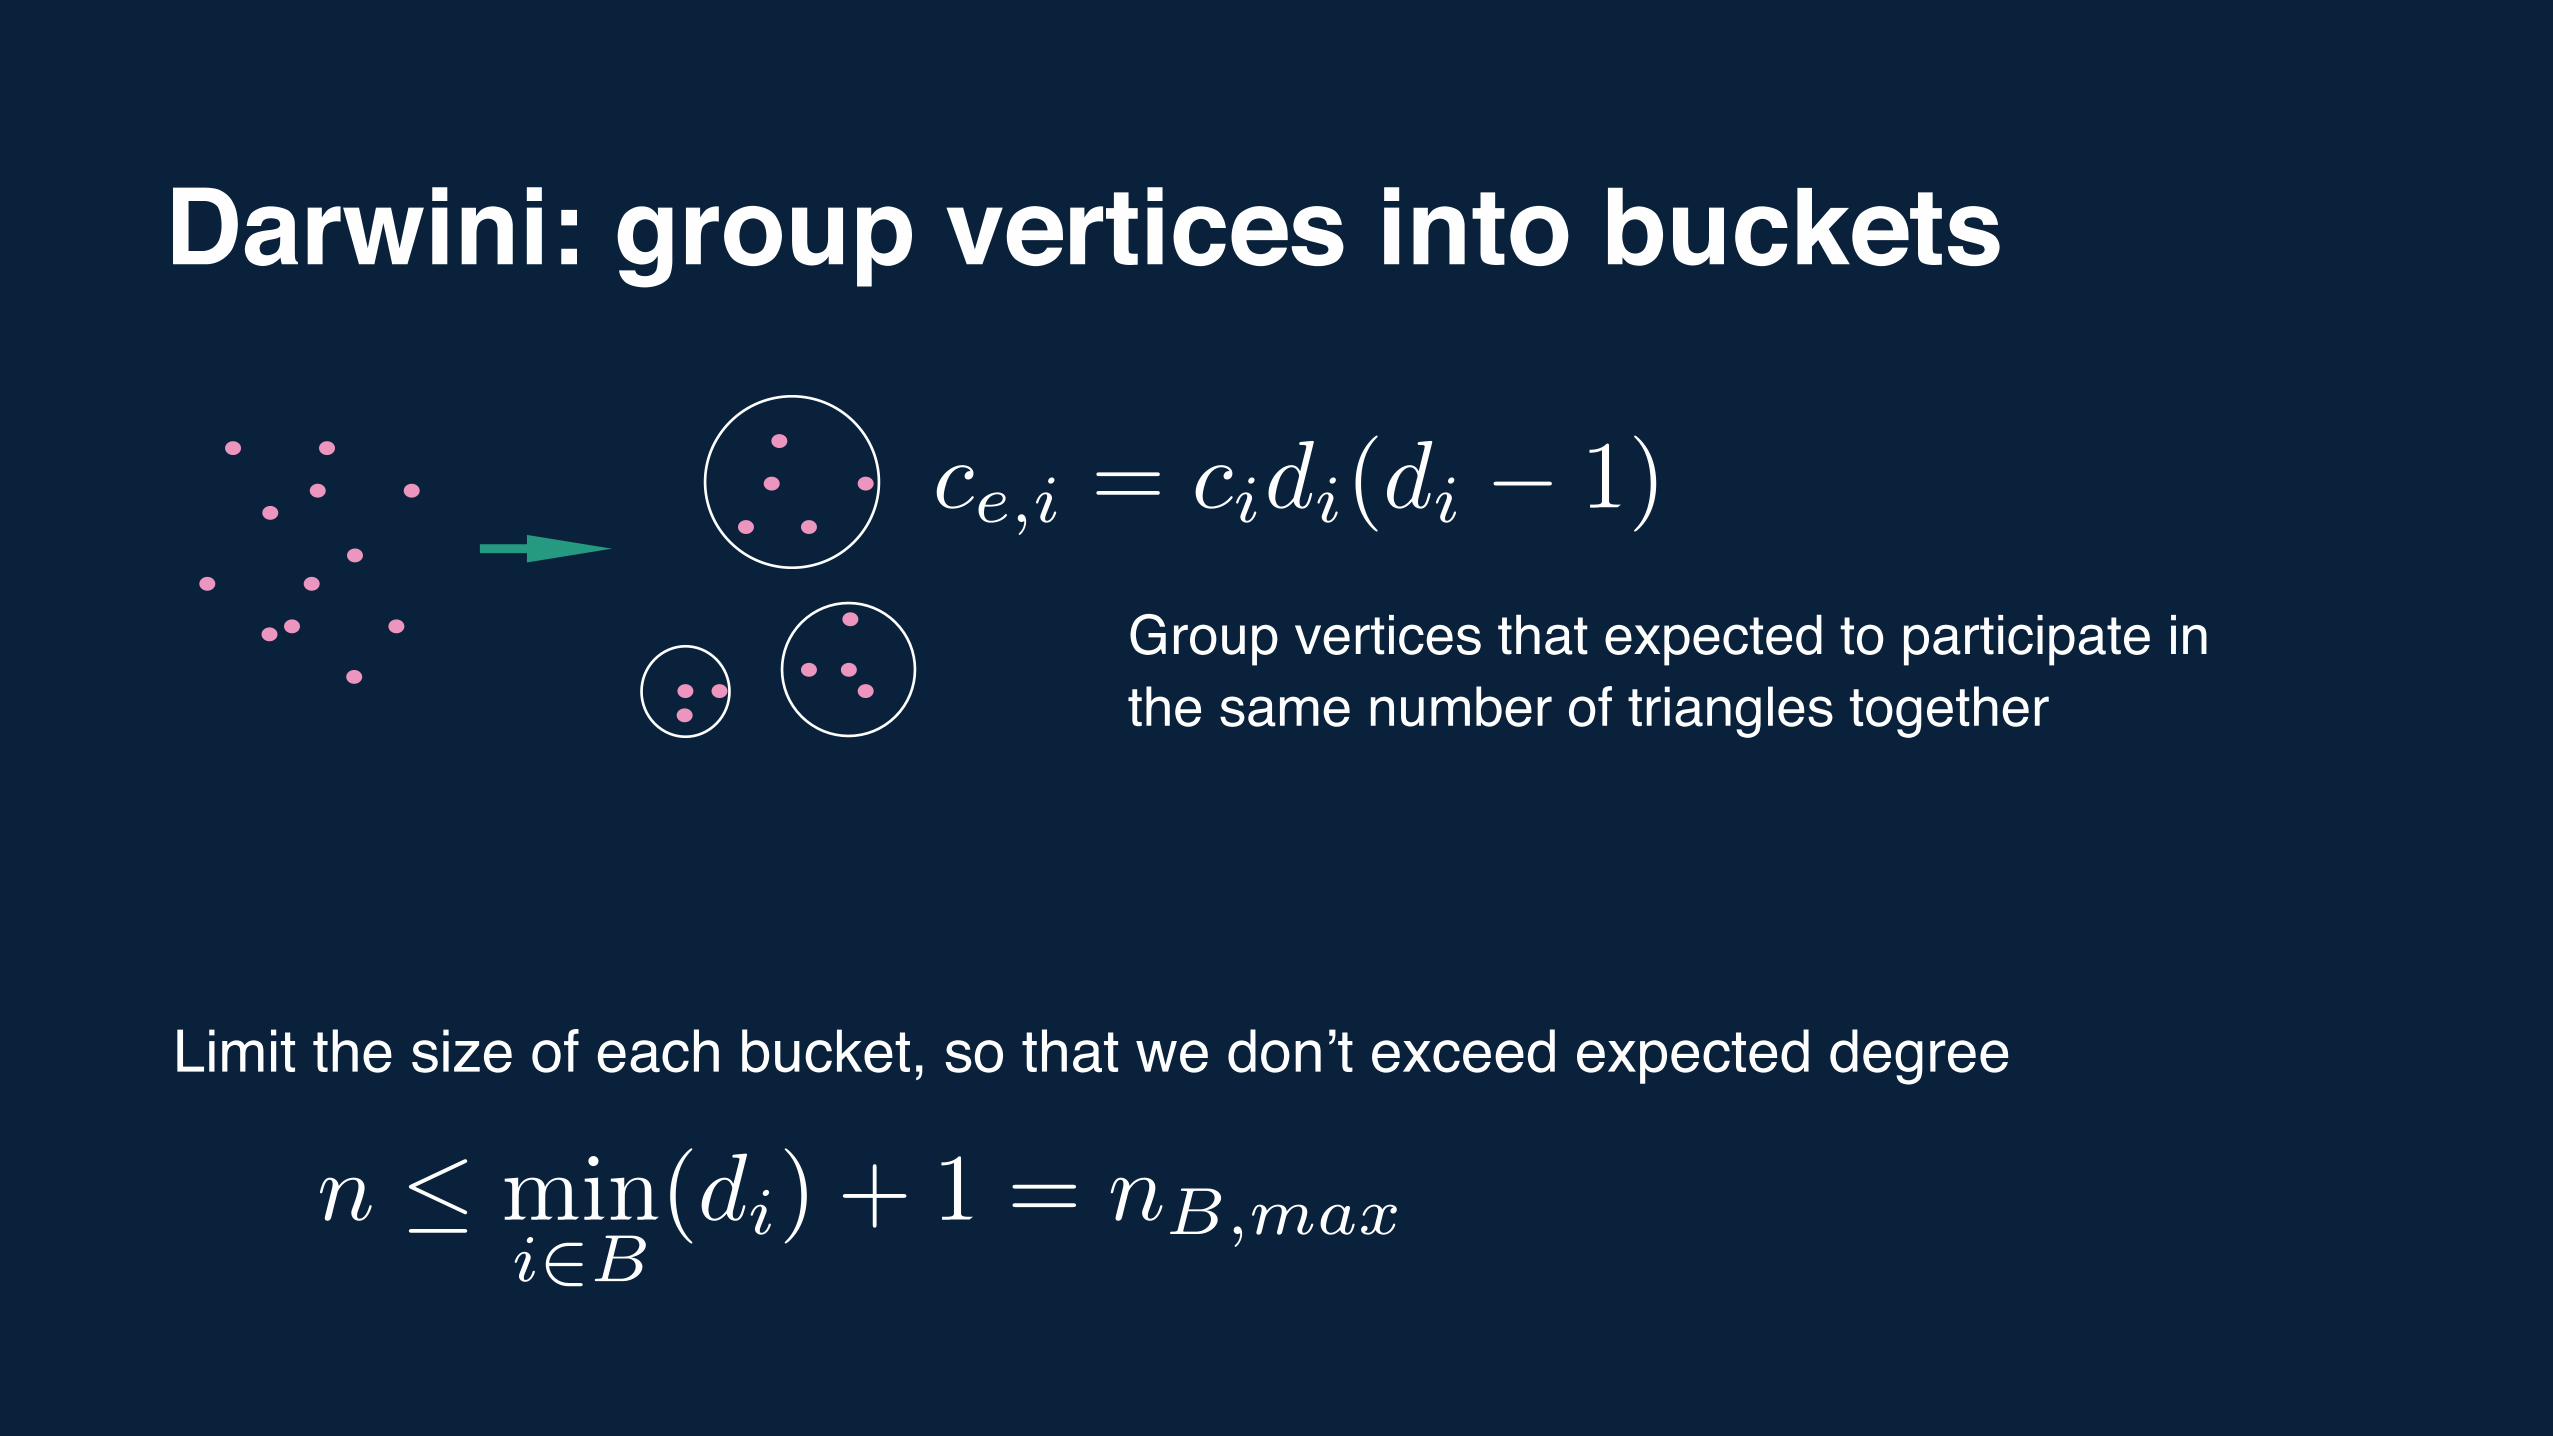
Darwini: group vertices into buckets
ce,i = cidi(di � 1)
Group vertices that expected to participate in the same number of triangles together
n mini2B
(di
) + 1 = nB,max
Limit the size of each bucket, so that we don’t exceed expected degree
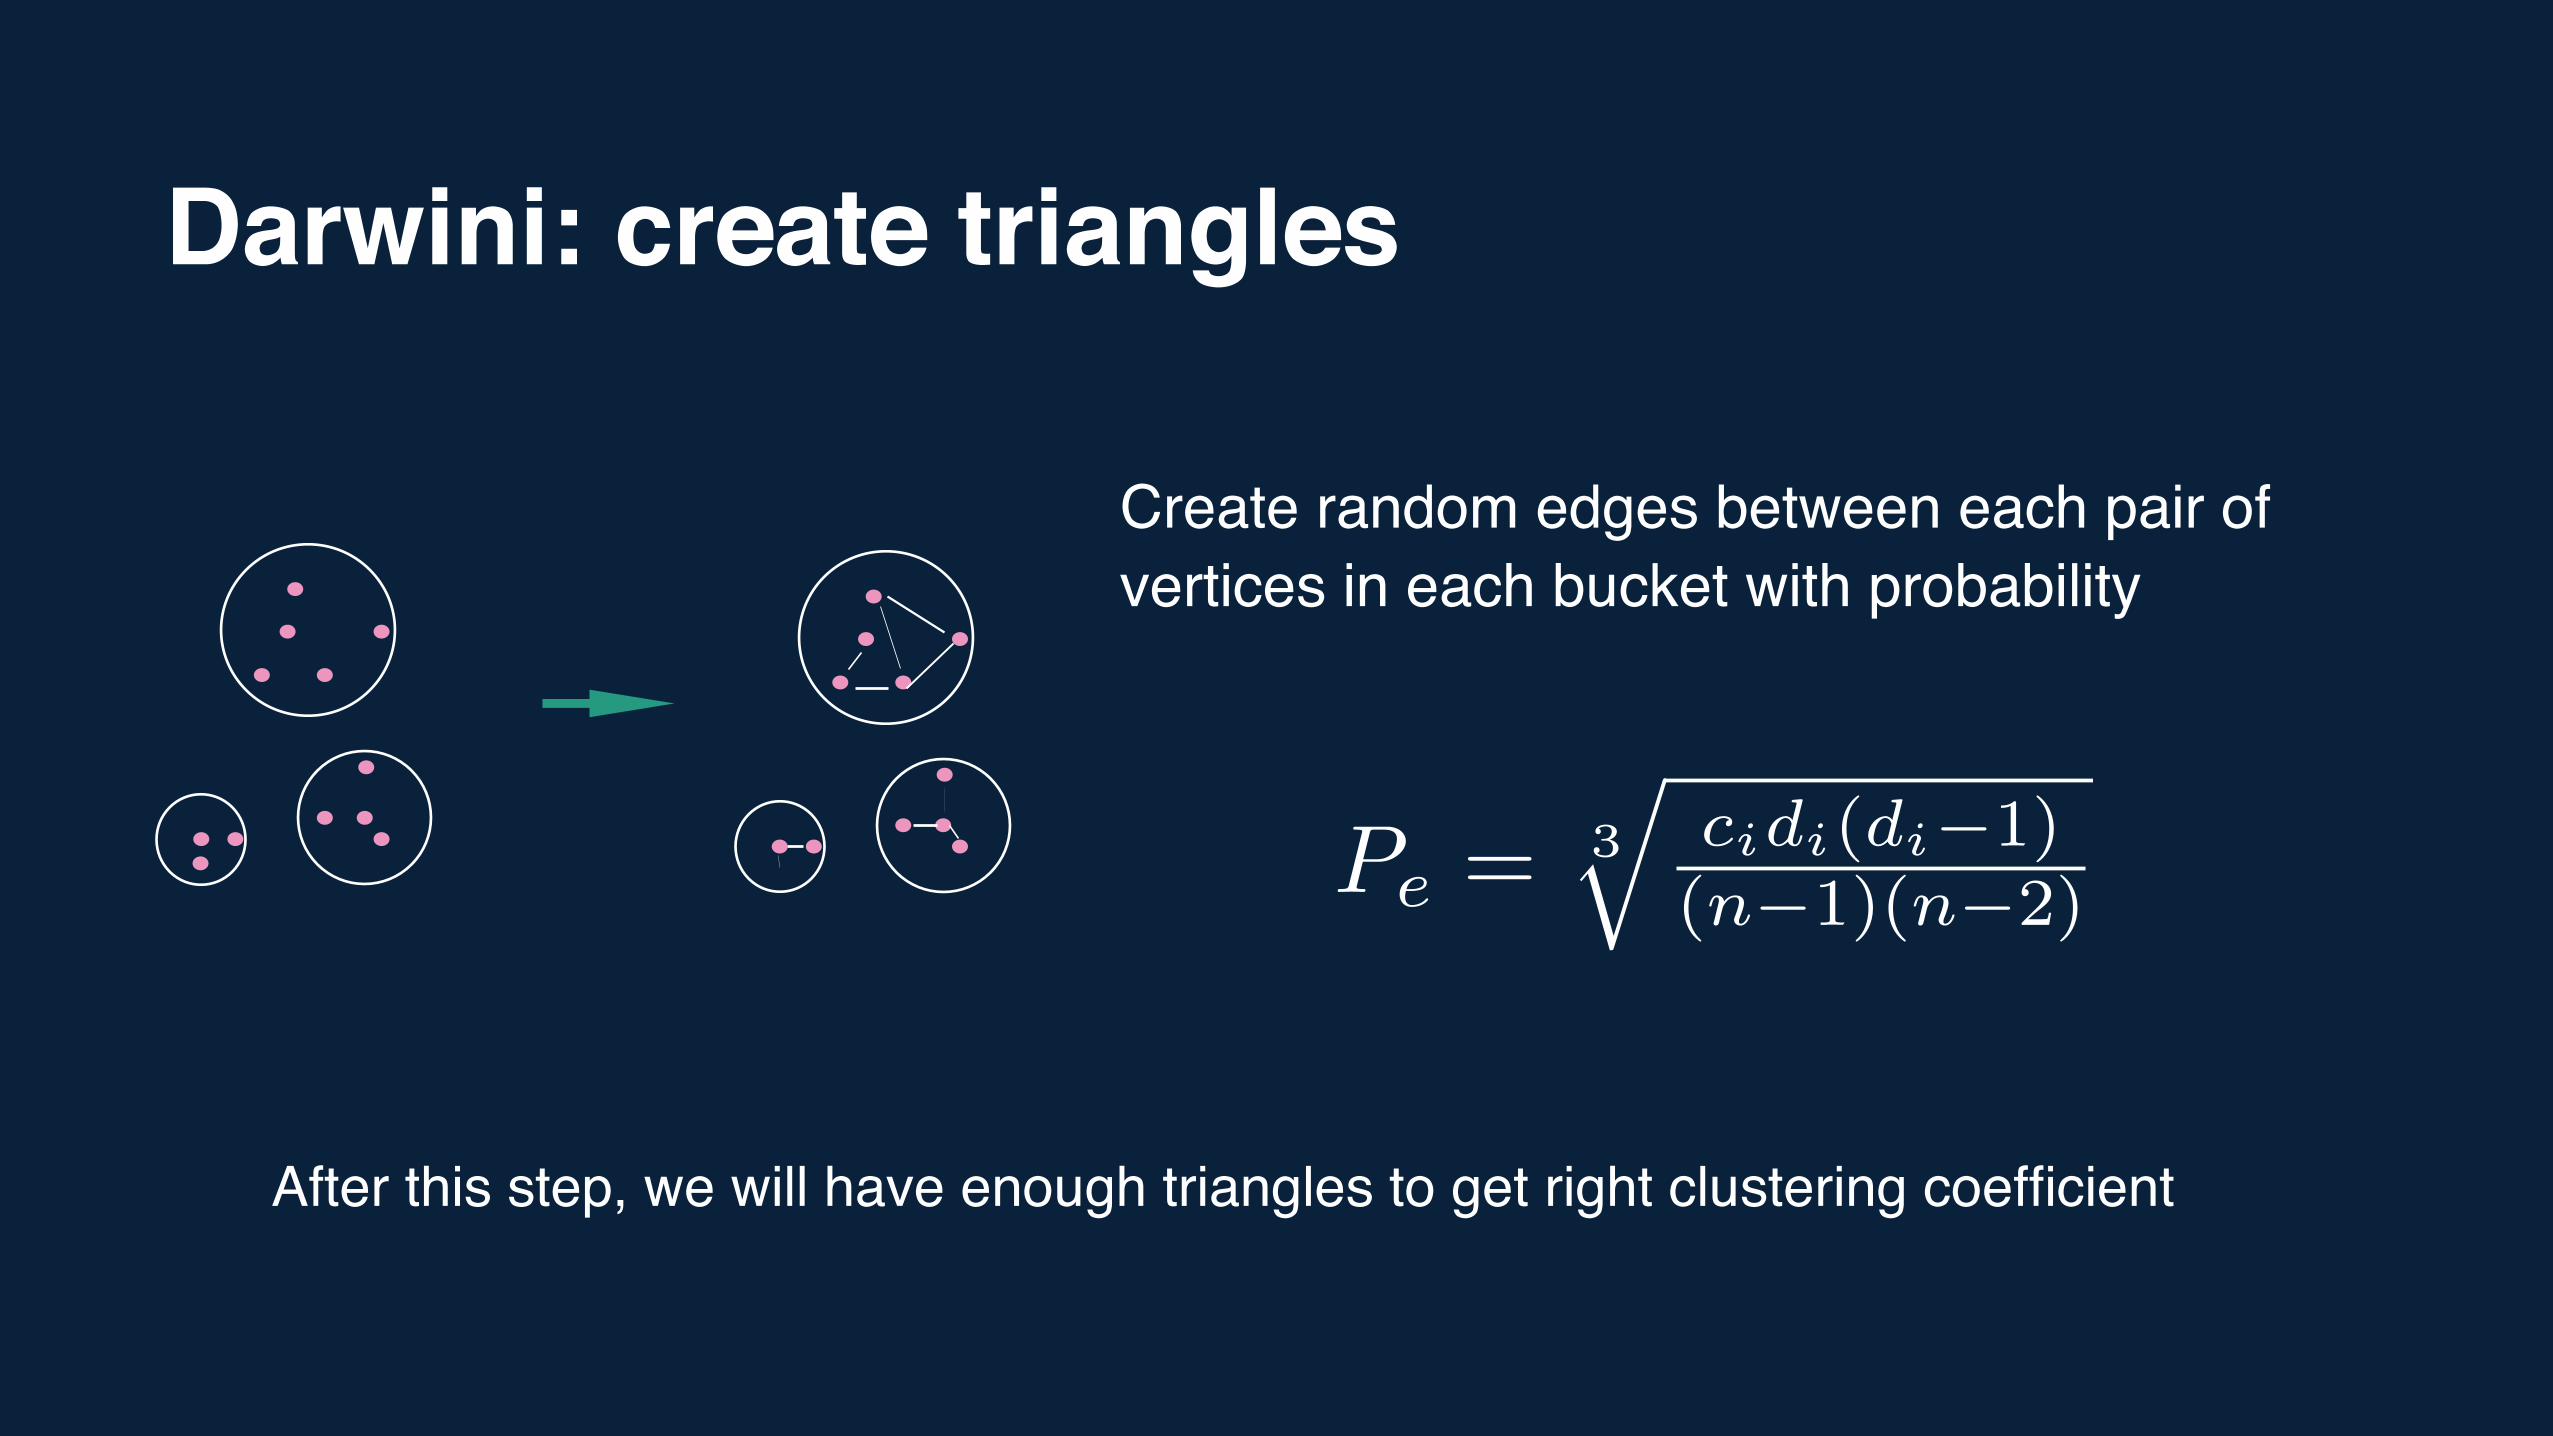
Darwini: create triangles
Pe = 3
qcidi(di�1)(n�1)(n�2)
Create random edges between each pair of vertices in each bucket with probability
After this step, we will have enough triangles to get right clustering coefficient
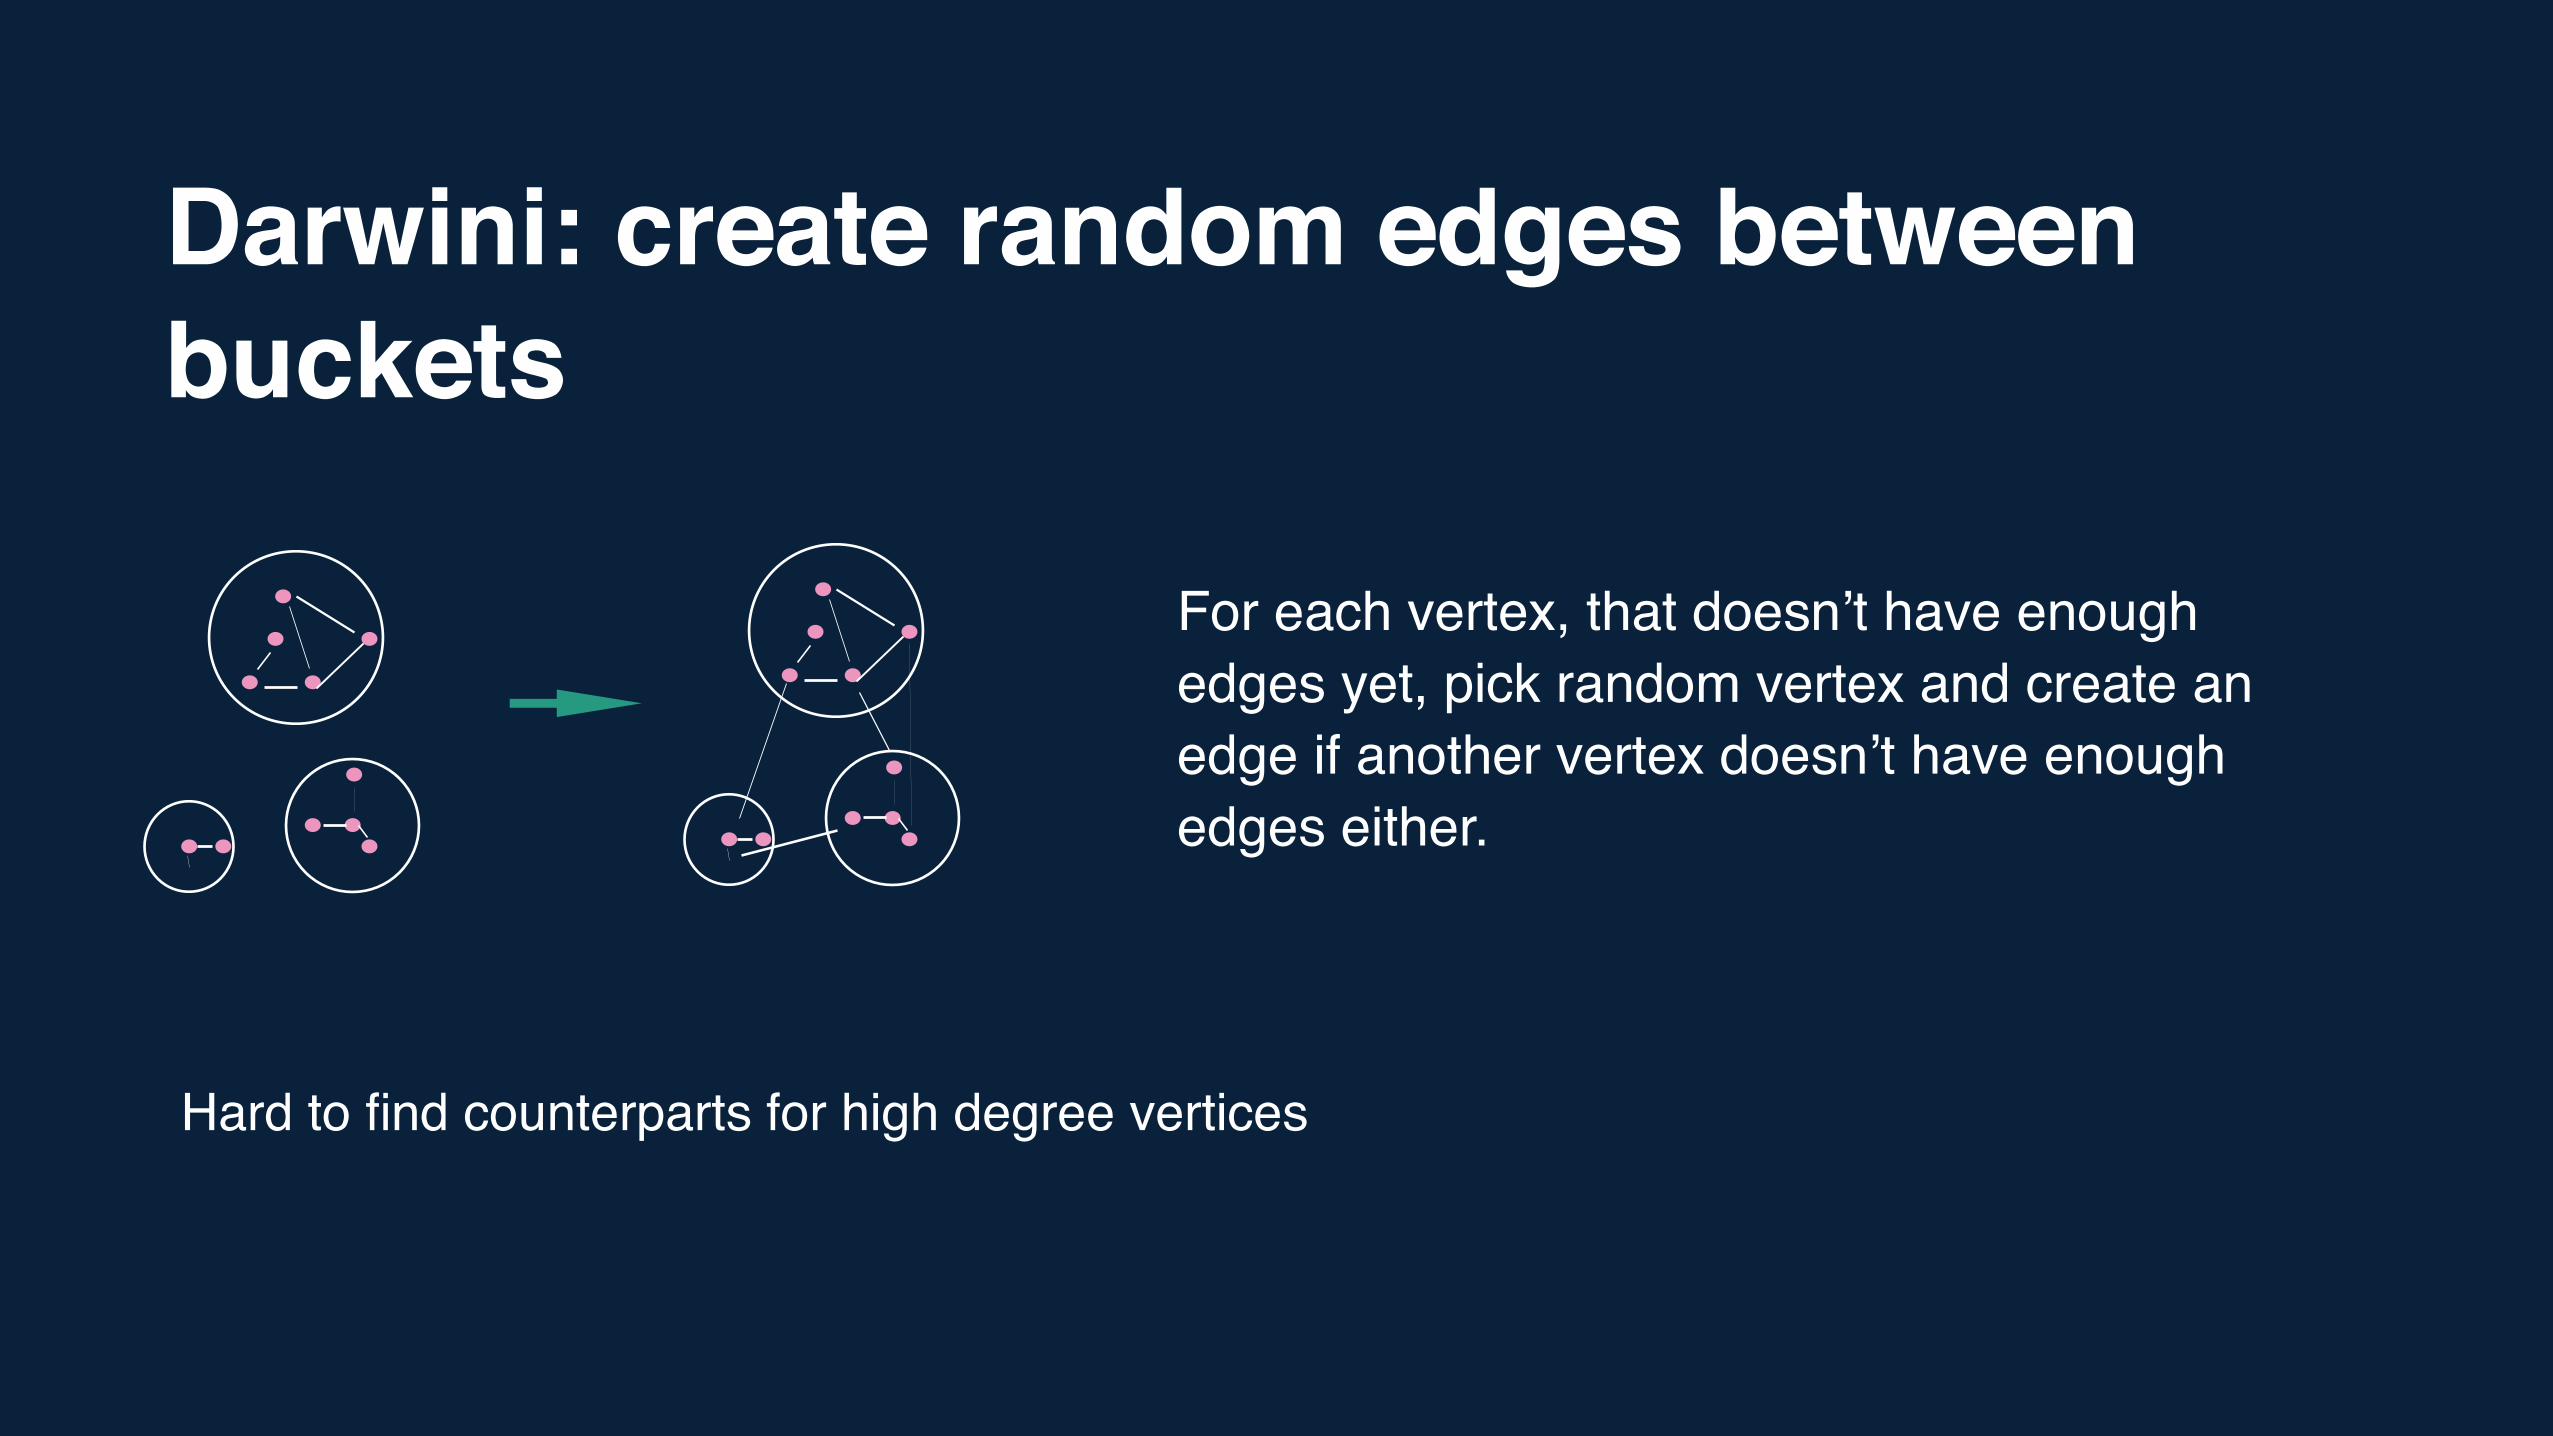
Darwini: create random edges between buckets
For each vertex, that doesn’t have enough edges yet, pick random vertex and create an edge if another vertex doesn’t have enough edges either.
Hard to find counterparts for high degree vertices
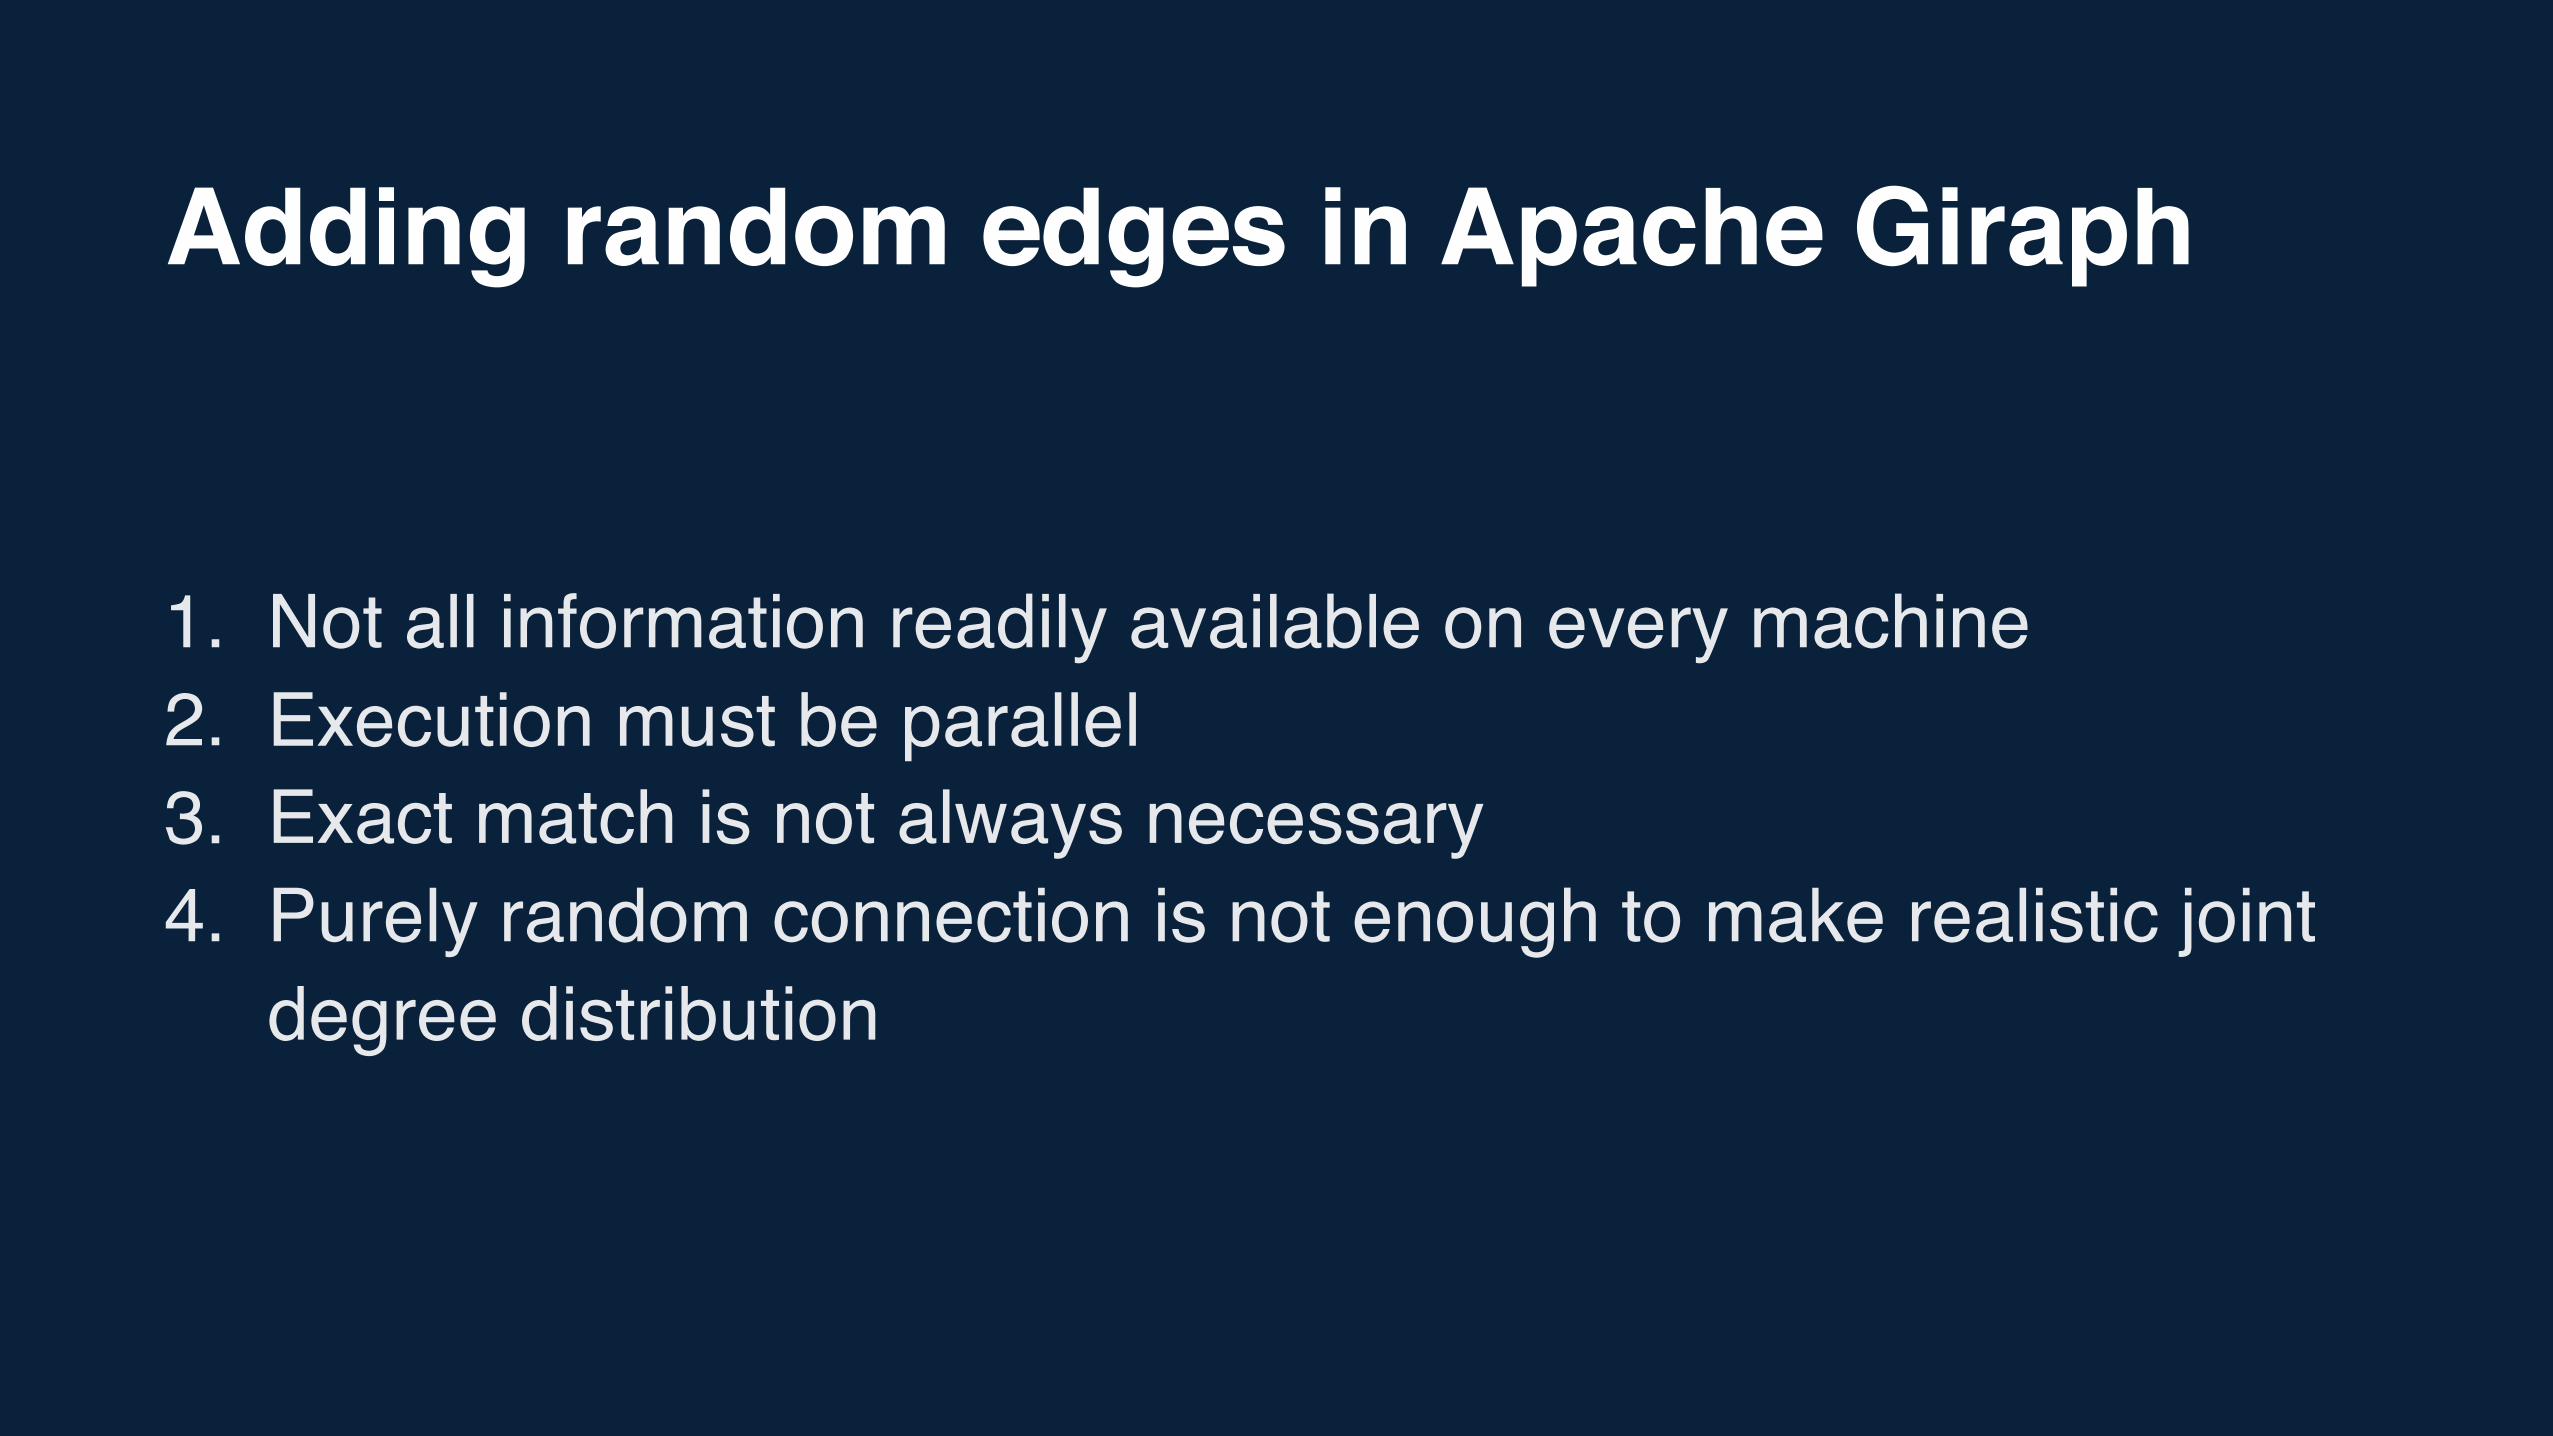
Adding random edges in Apache Giraph
1. Not all information readily available on every machine2. Execution must be parallel3. Exact match is not always necessary4. Purely random connection is not enough to make realistic joint
degree distribution
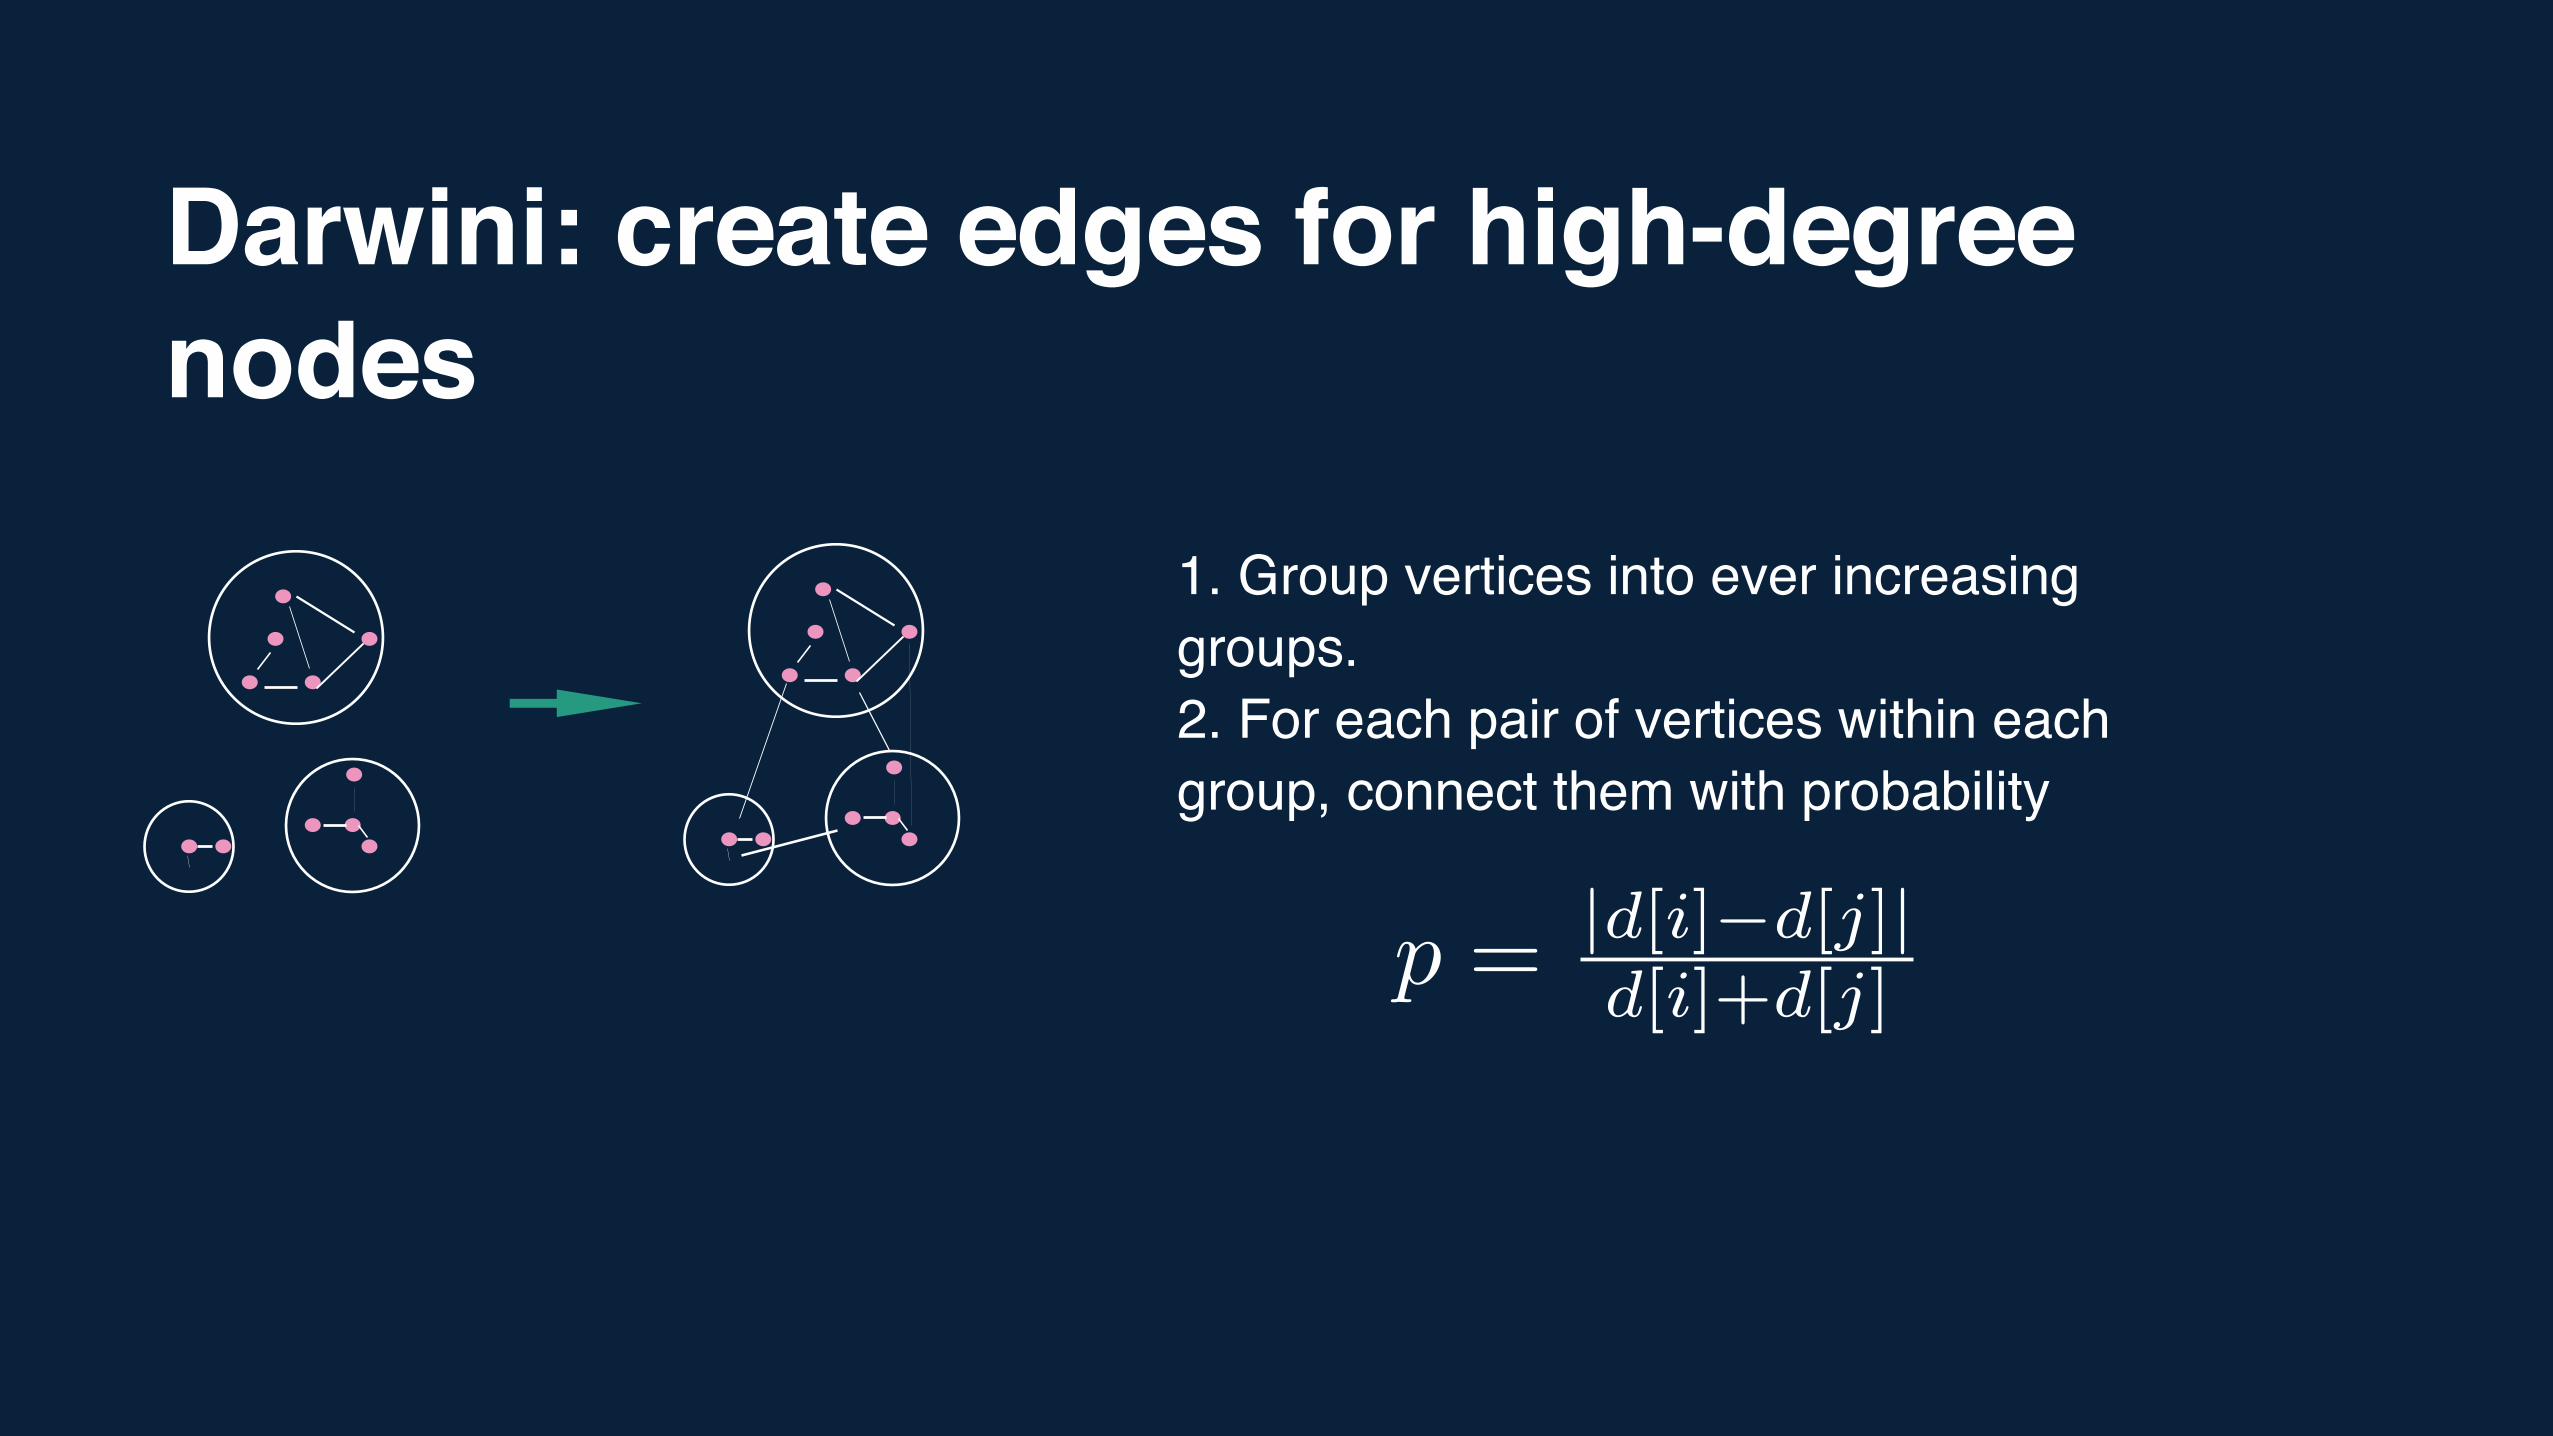
Darwini: create edges for high-degree nodes
1. Group vertices into ever increasing groups.2. For each pair of vertices within each group, connect them with probability
p = |d[i]�d[j]|d[i]+d[j]
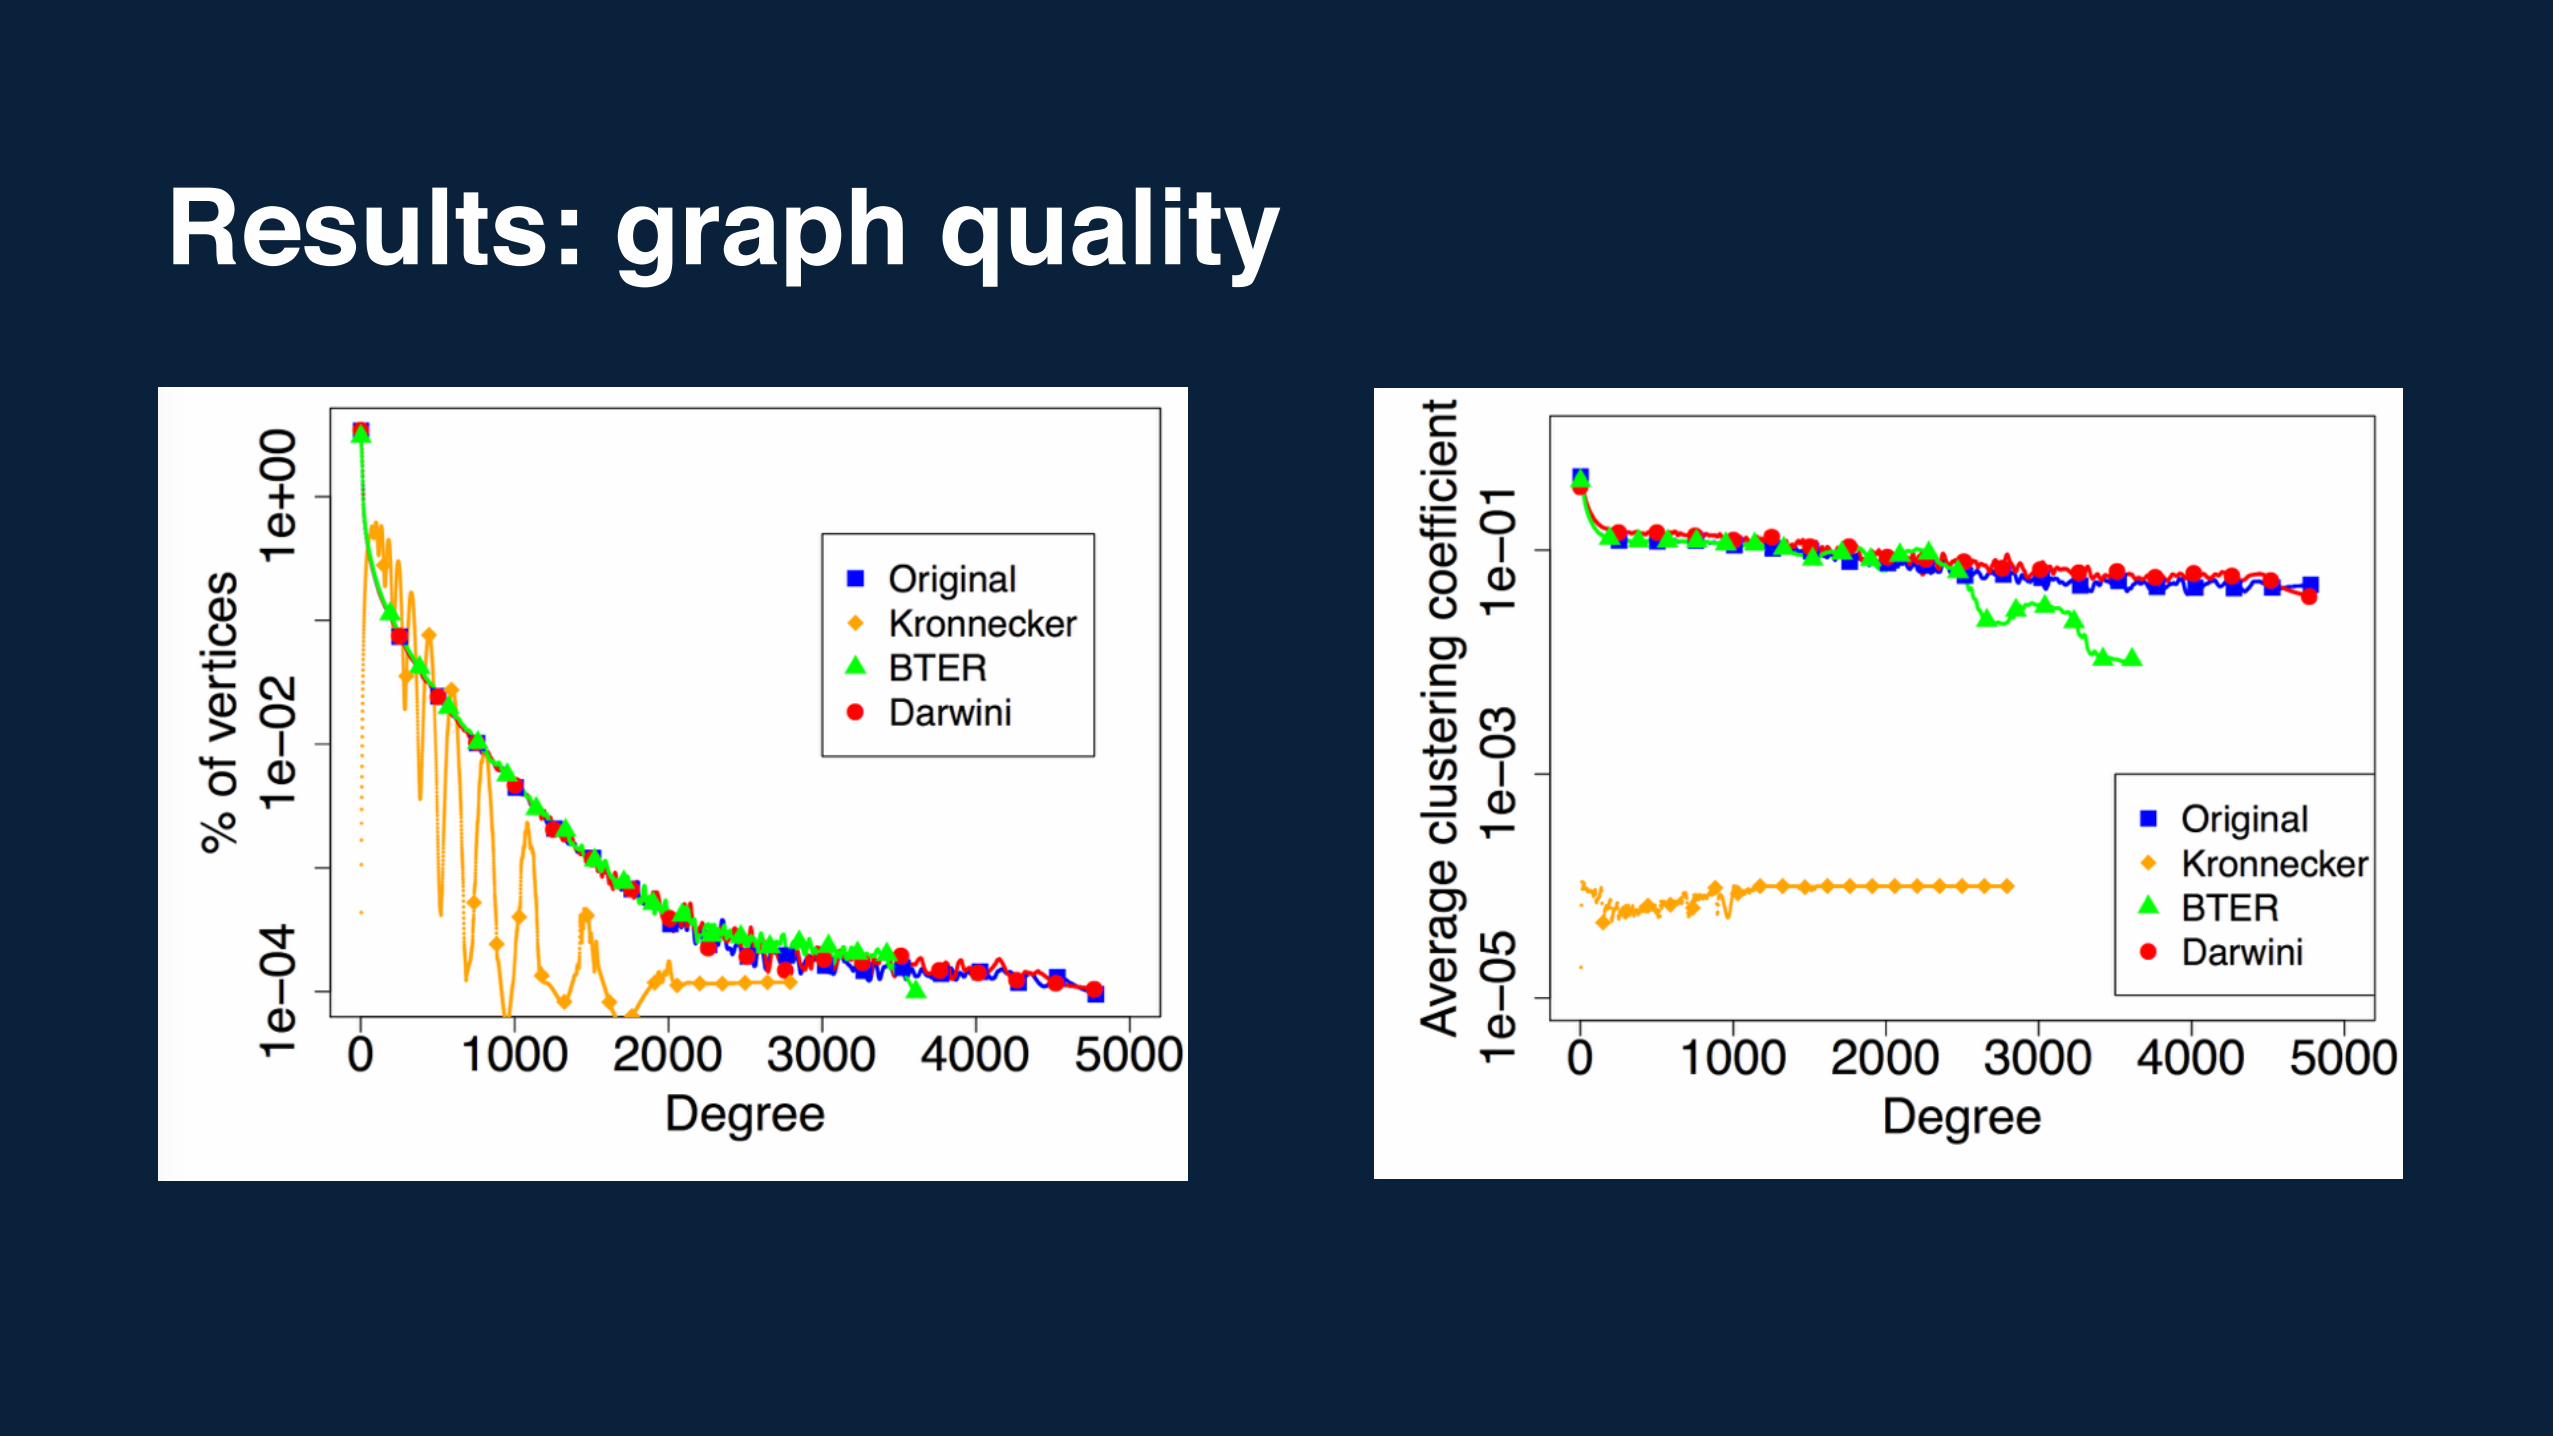
Results: graph quality
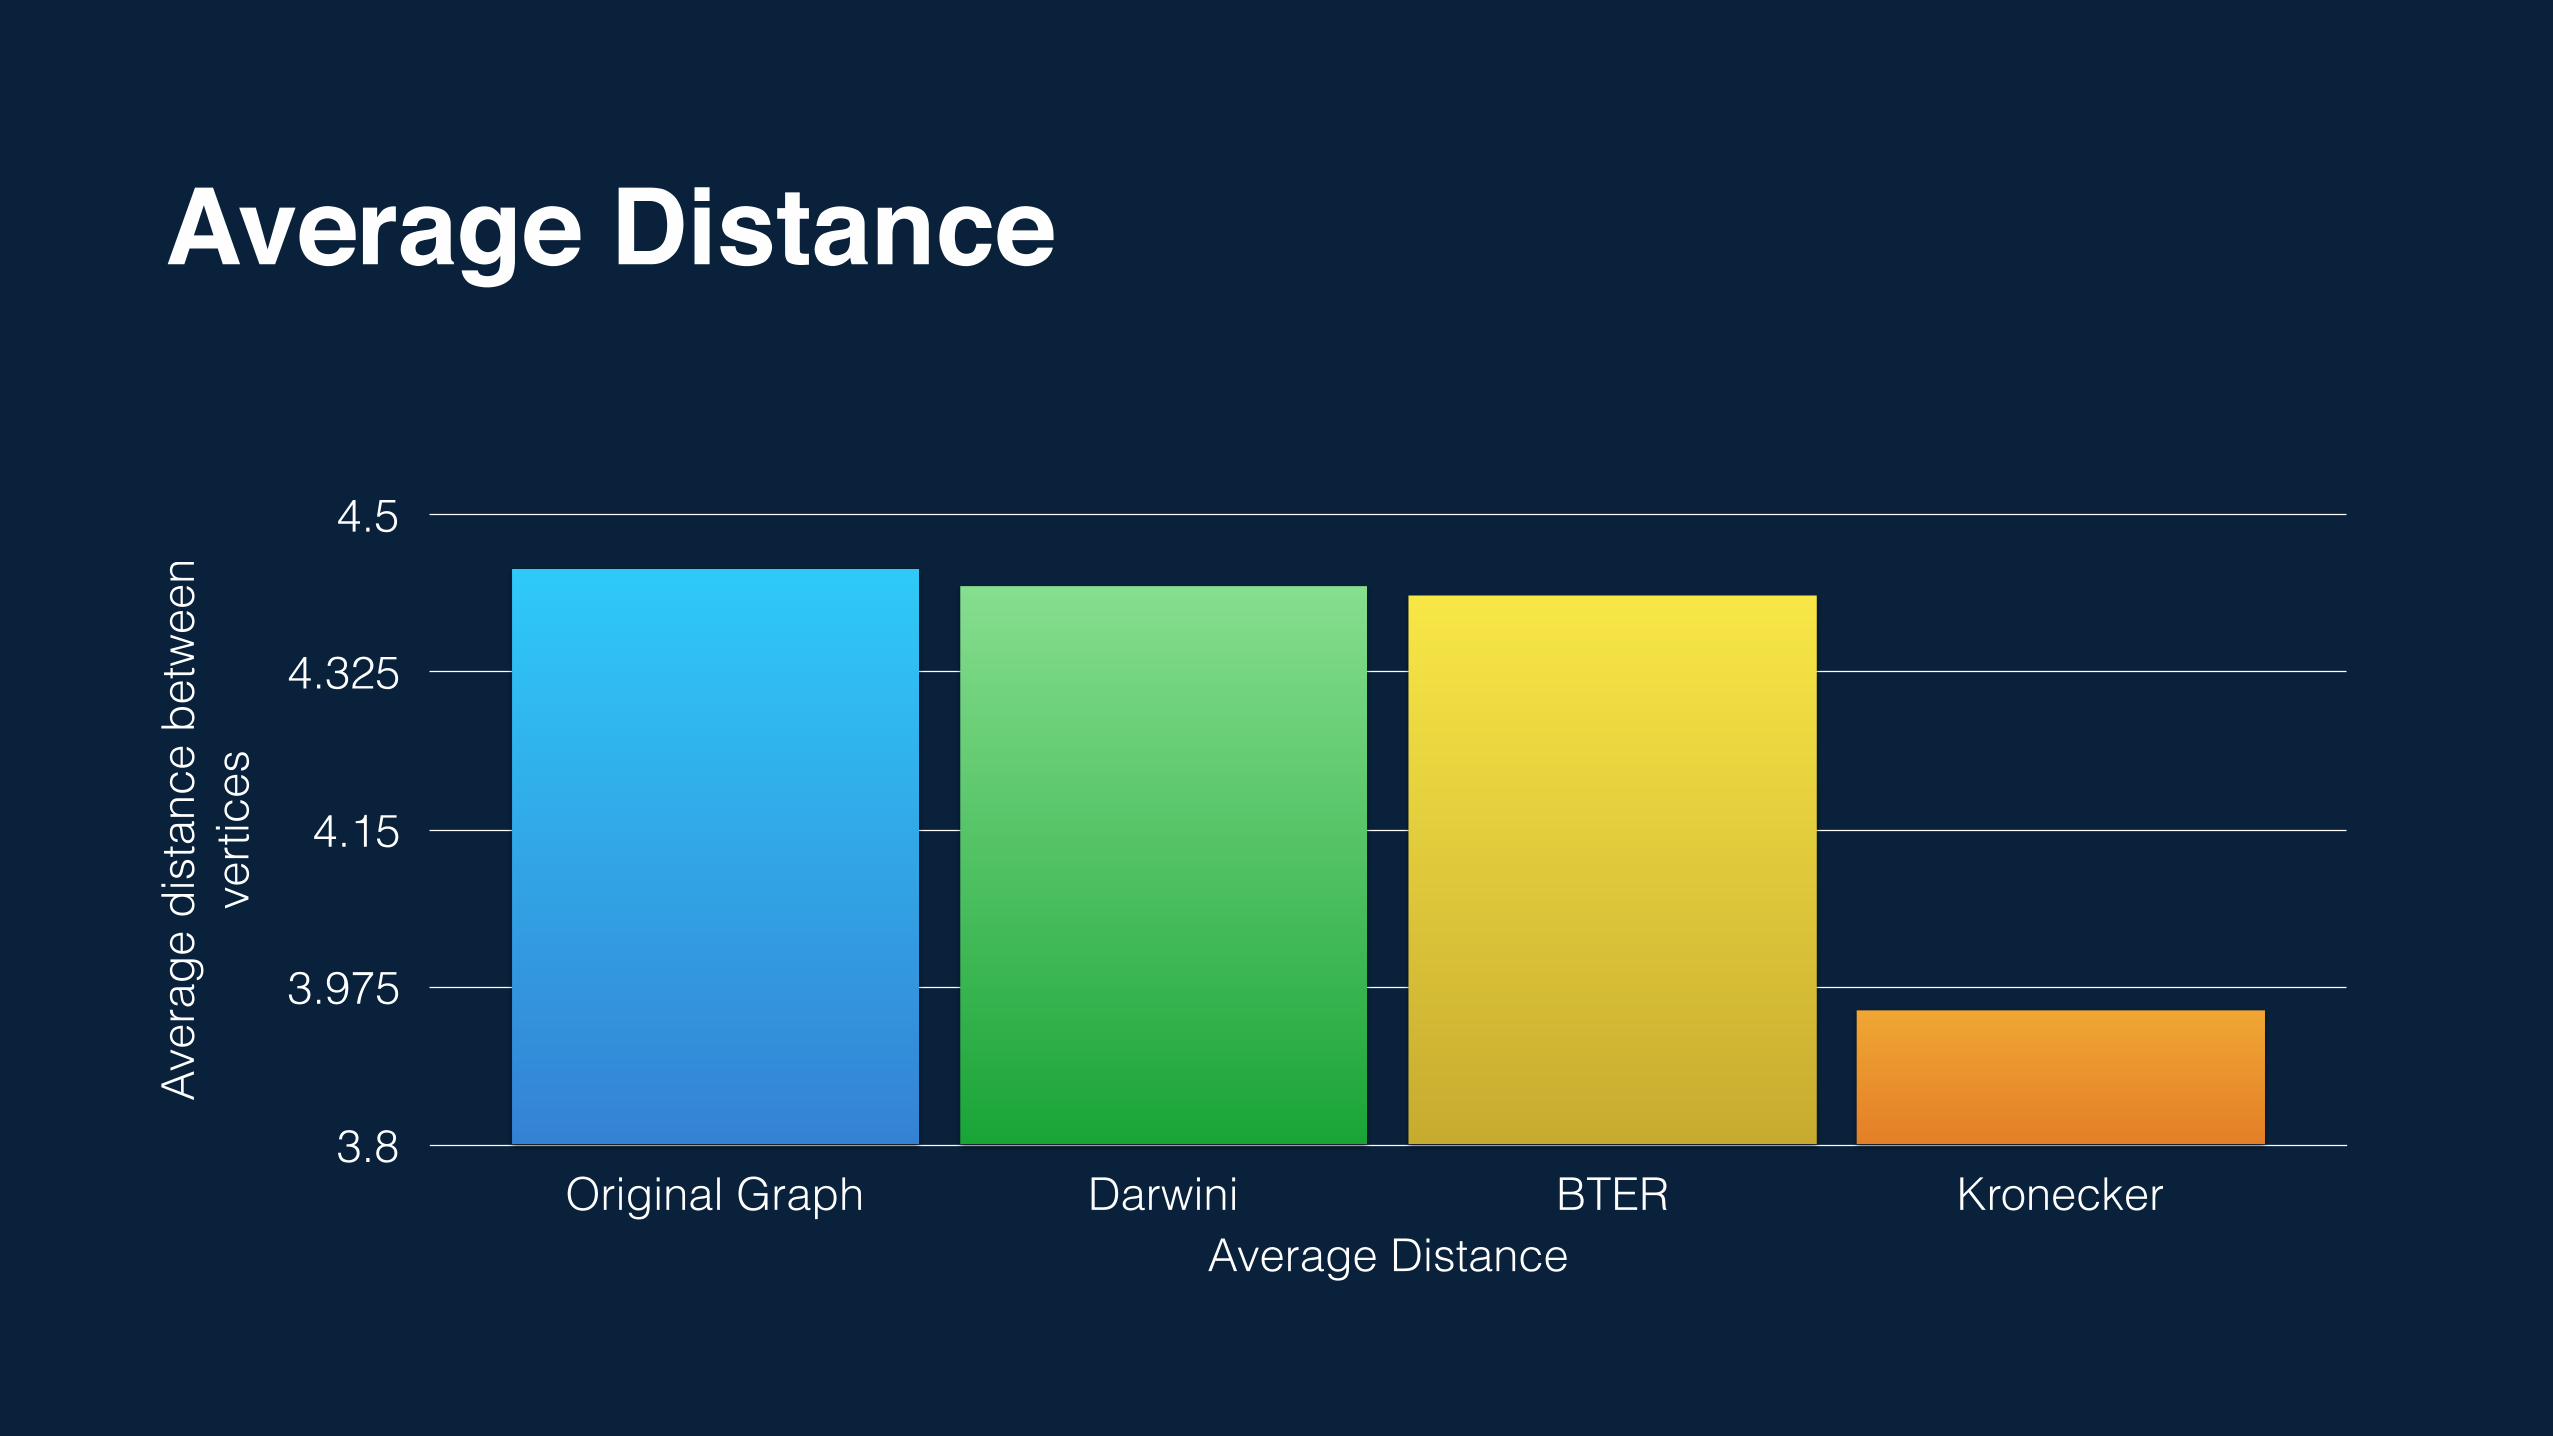
Average Distance Av
erag
e di
stan
ce b
etw
een
verti
ces
3.8
3.975
4.15
4.325
4.5
Average DistanceOriginal Graph Darwini BTER Kronecker
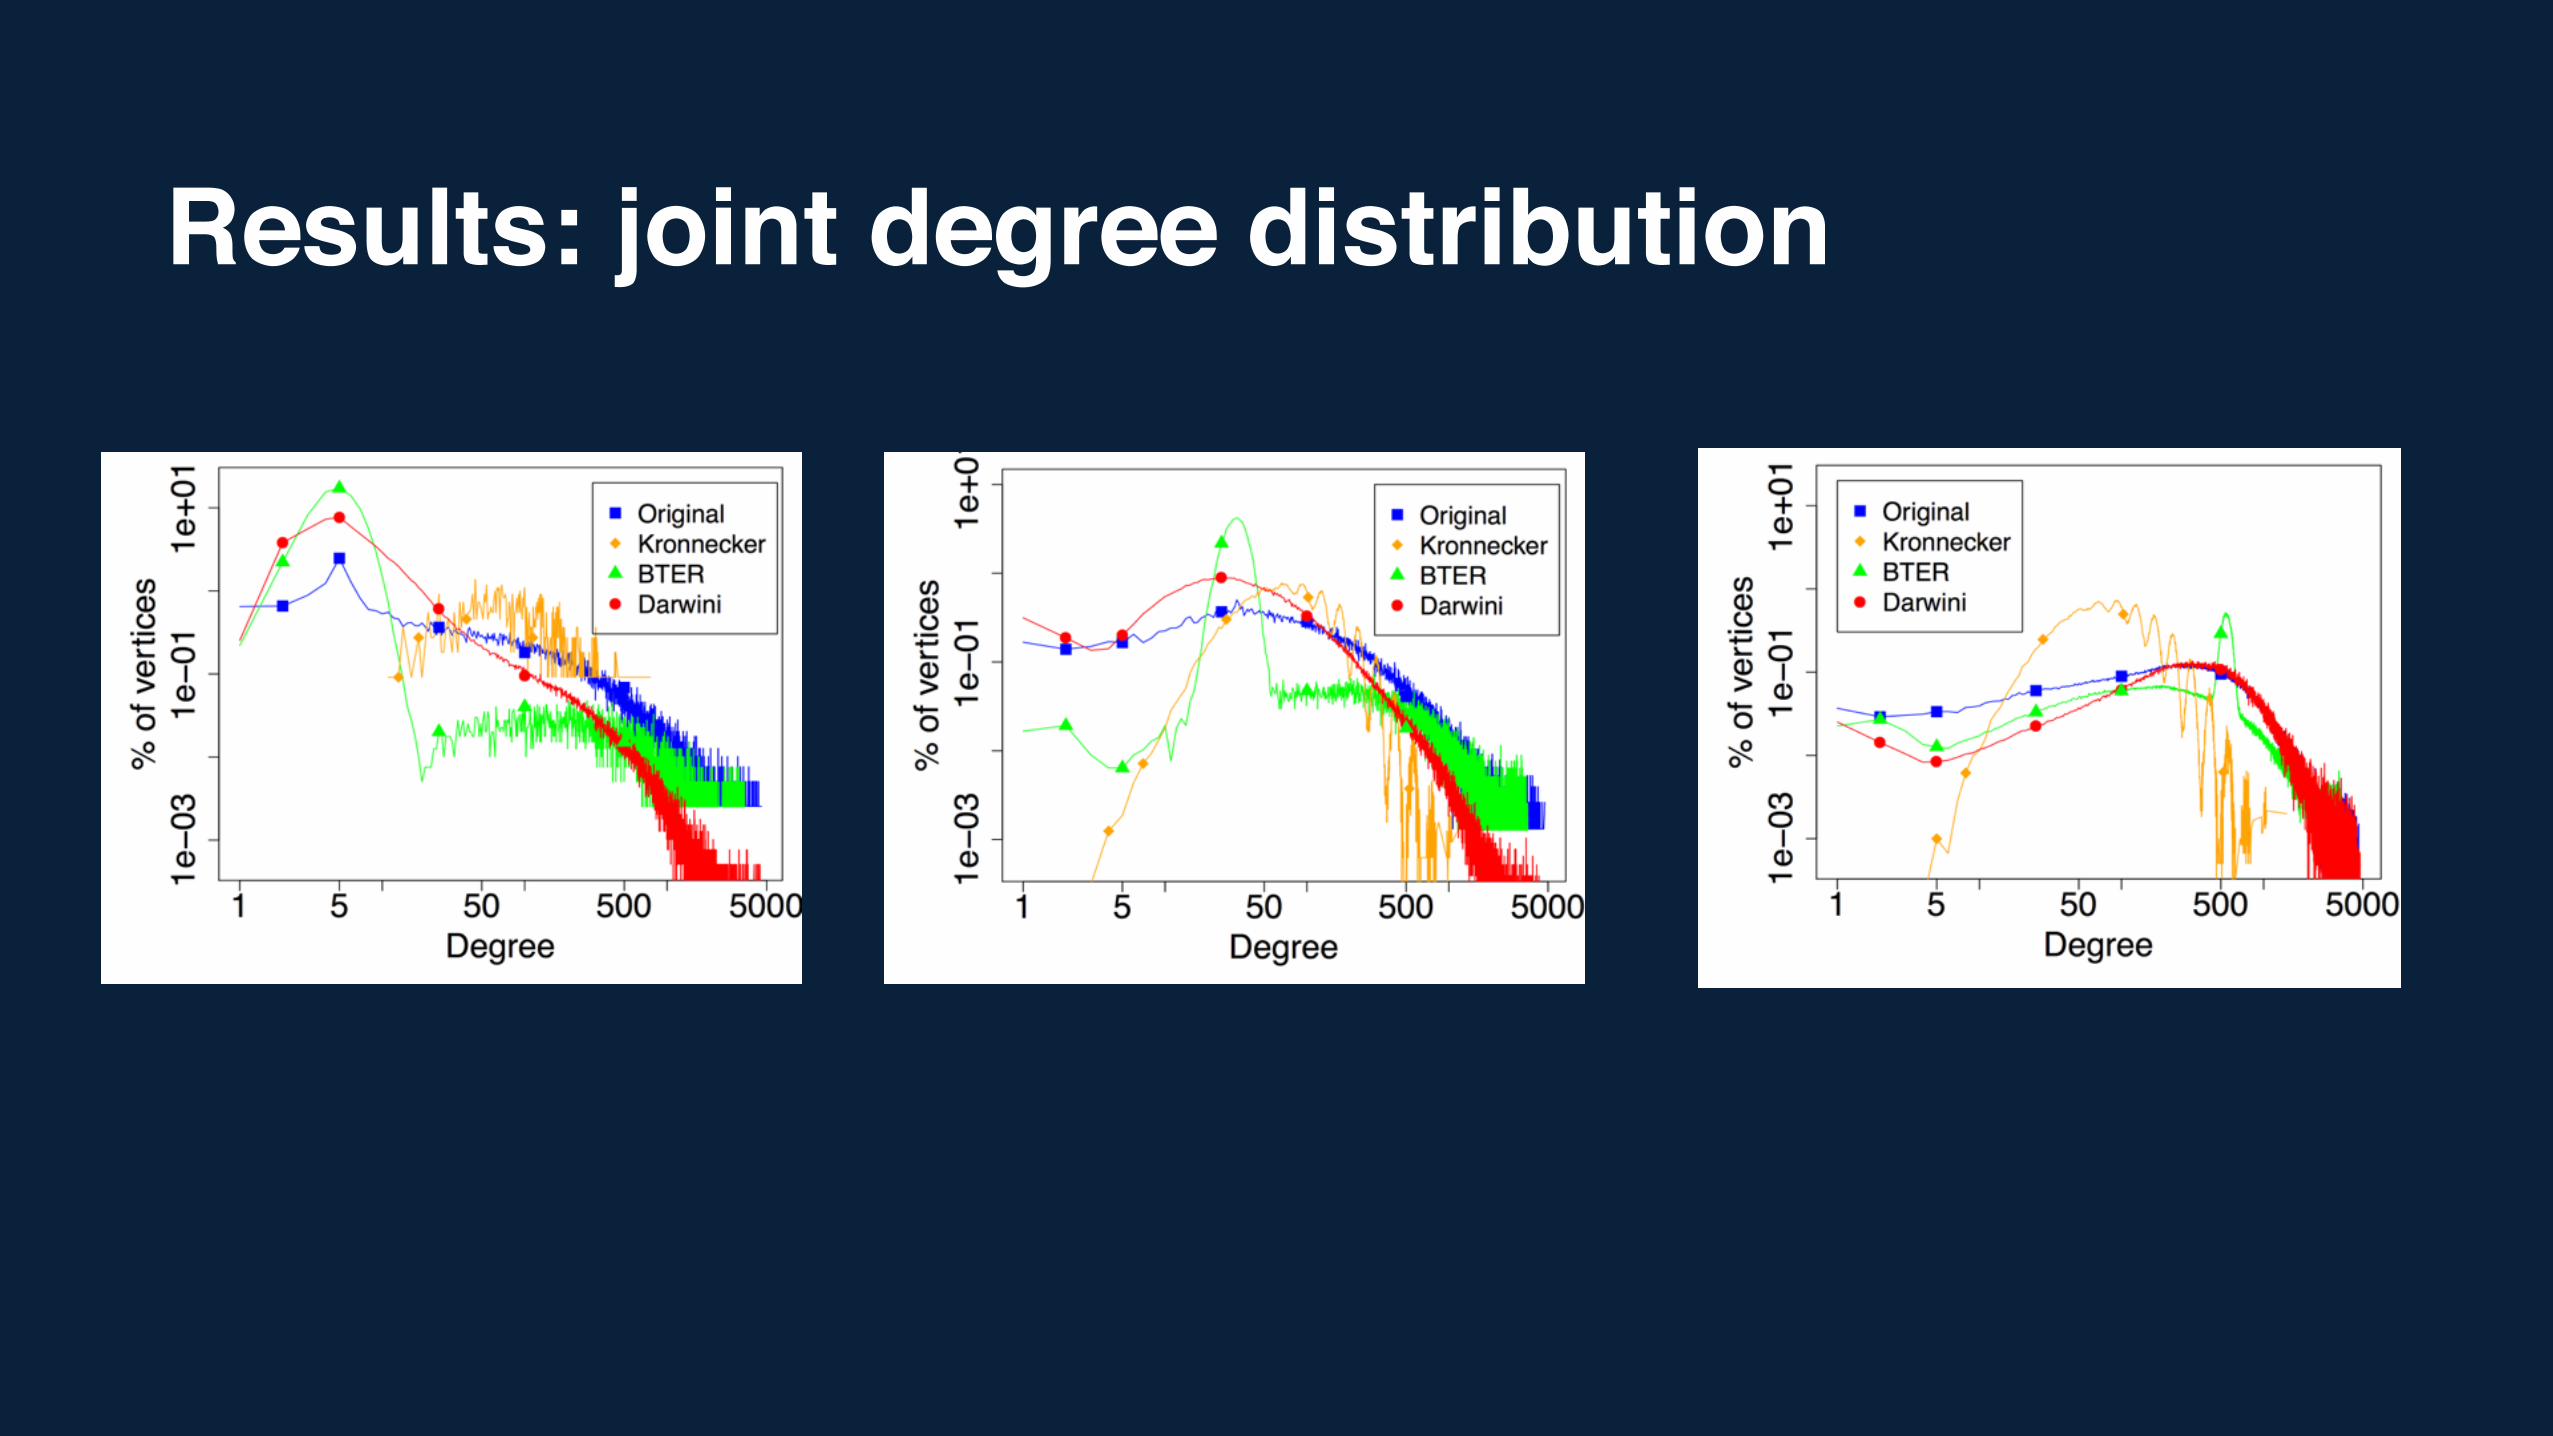
Results: joint degree distribution
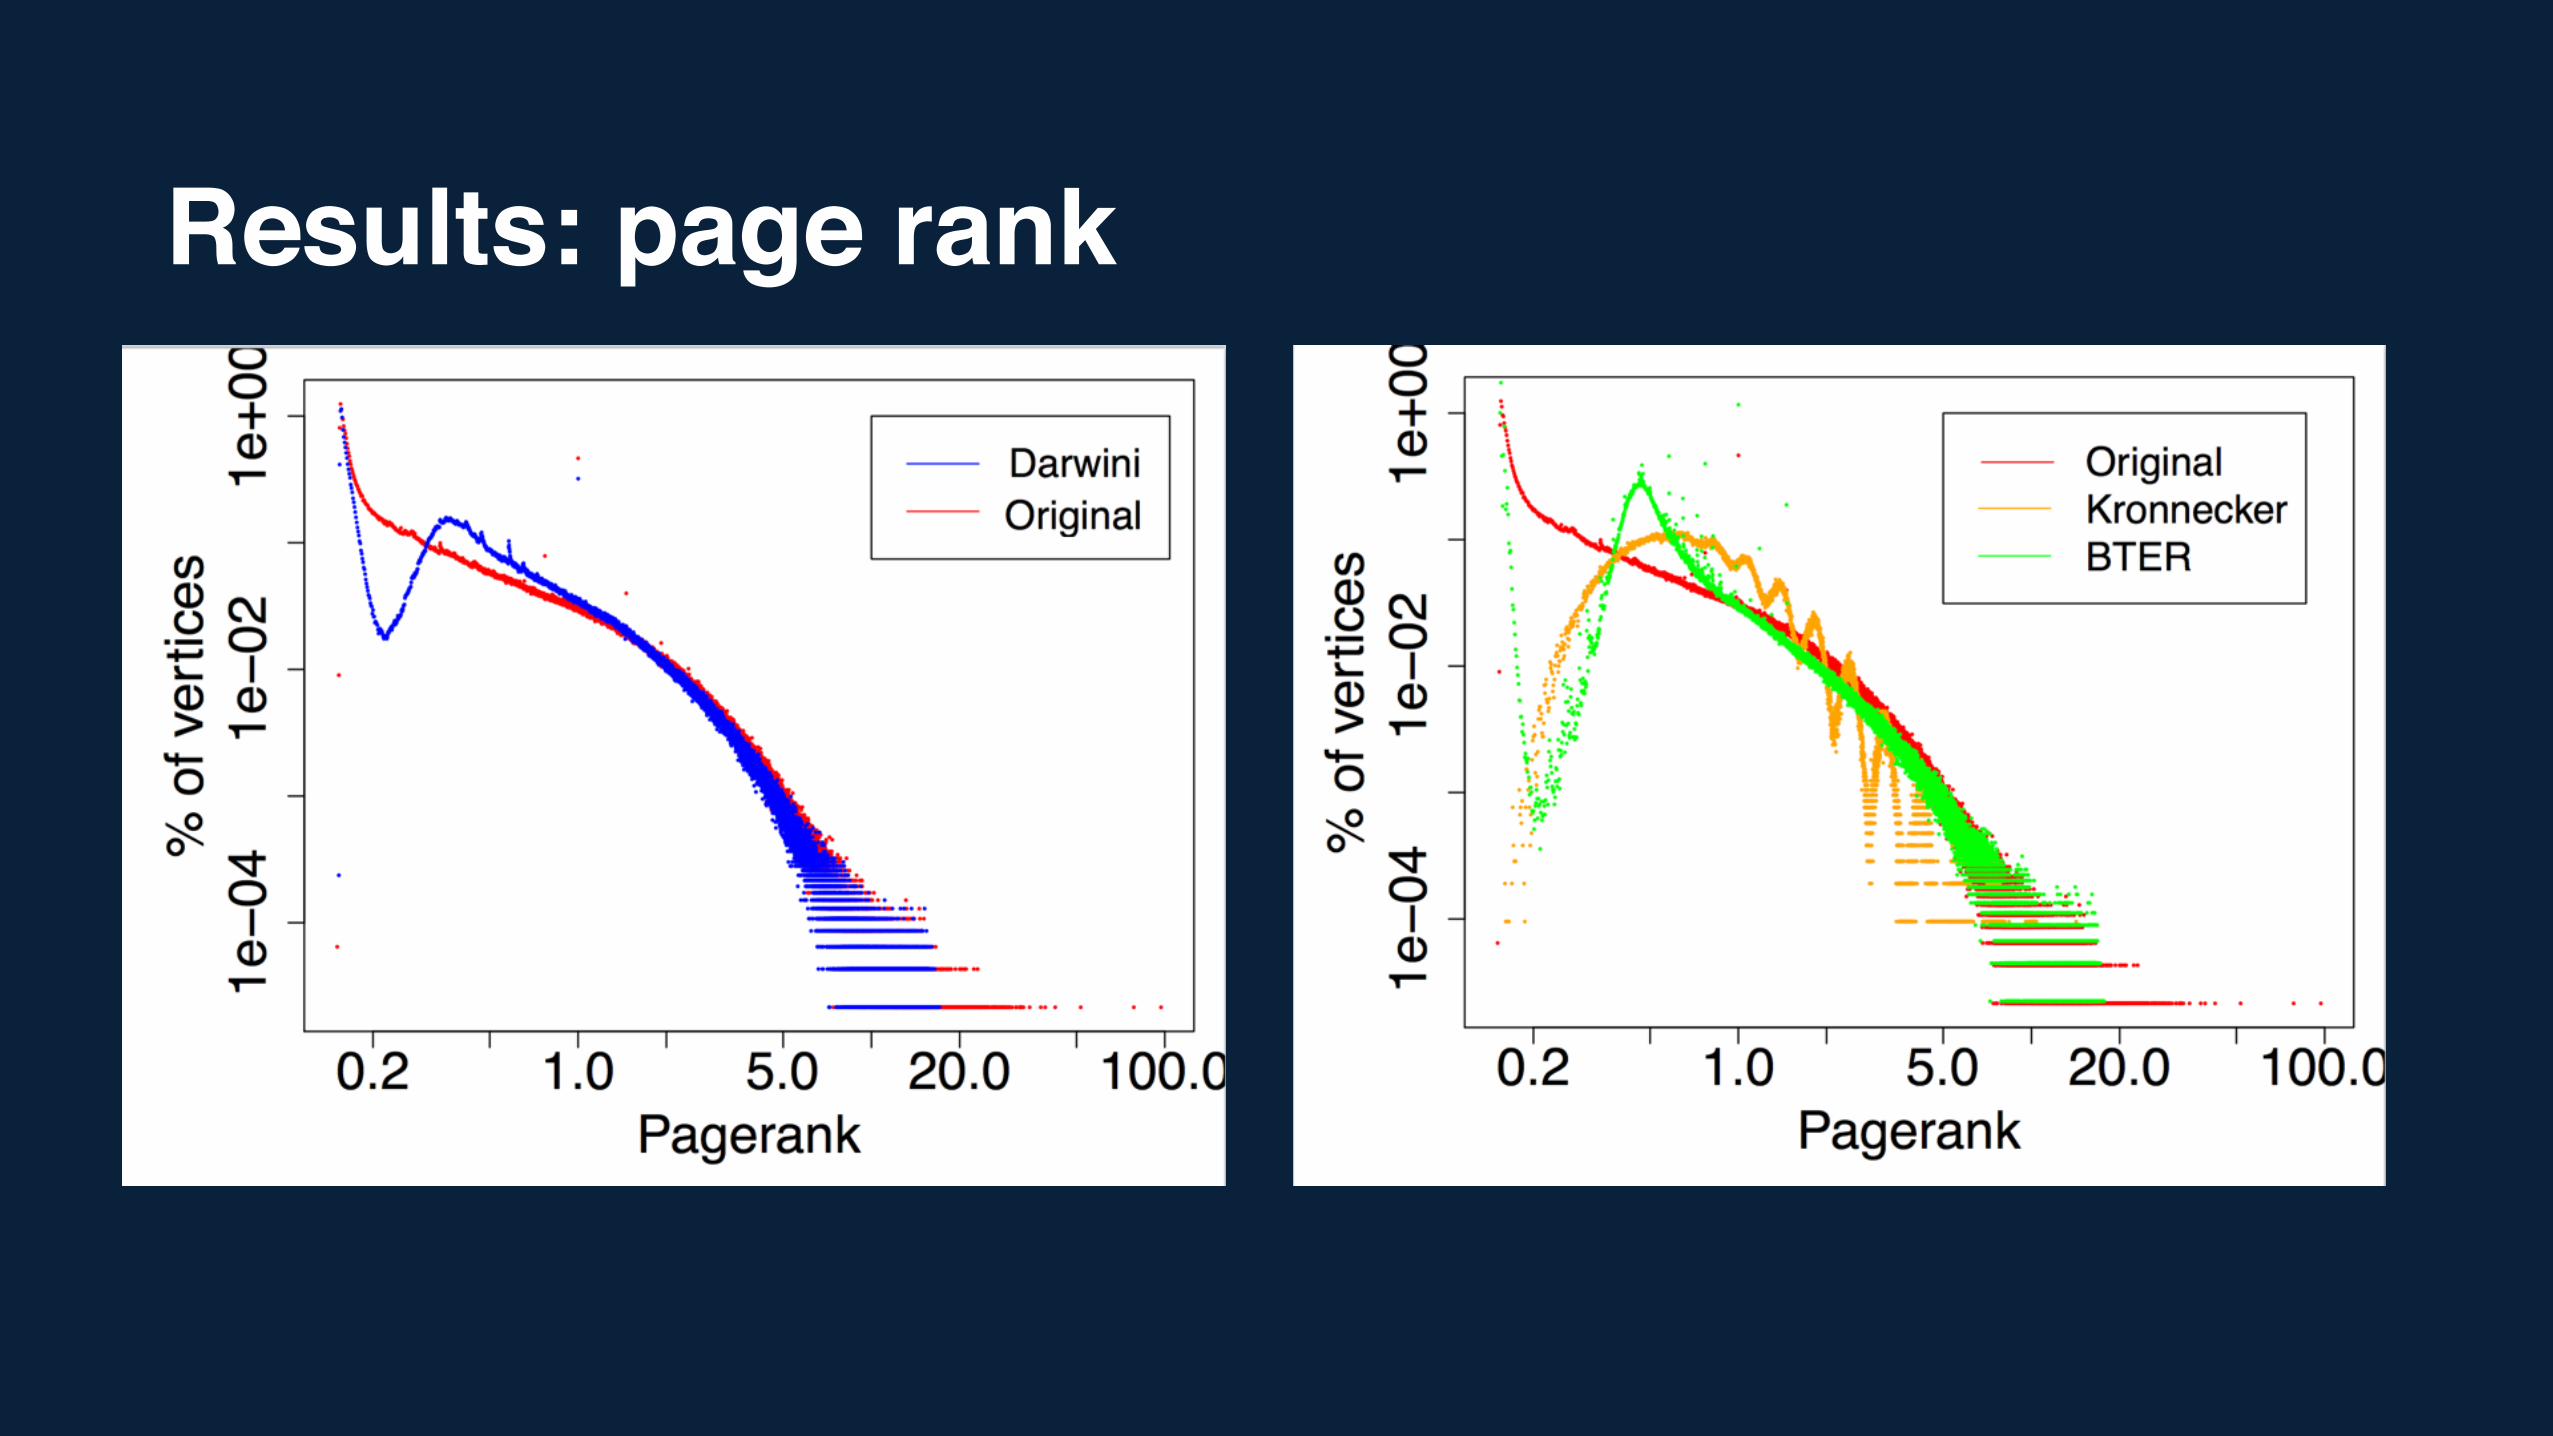
Results: page rank
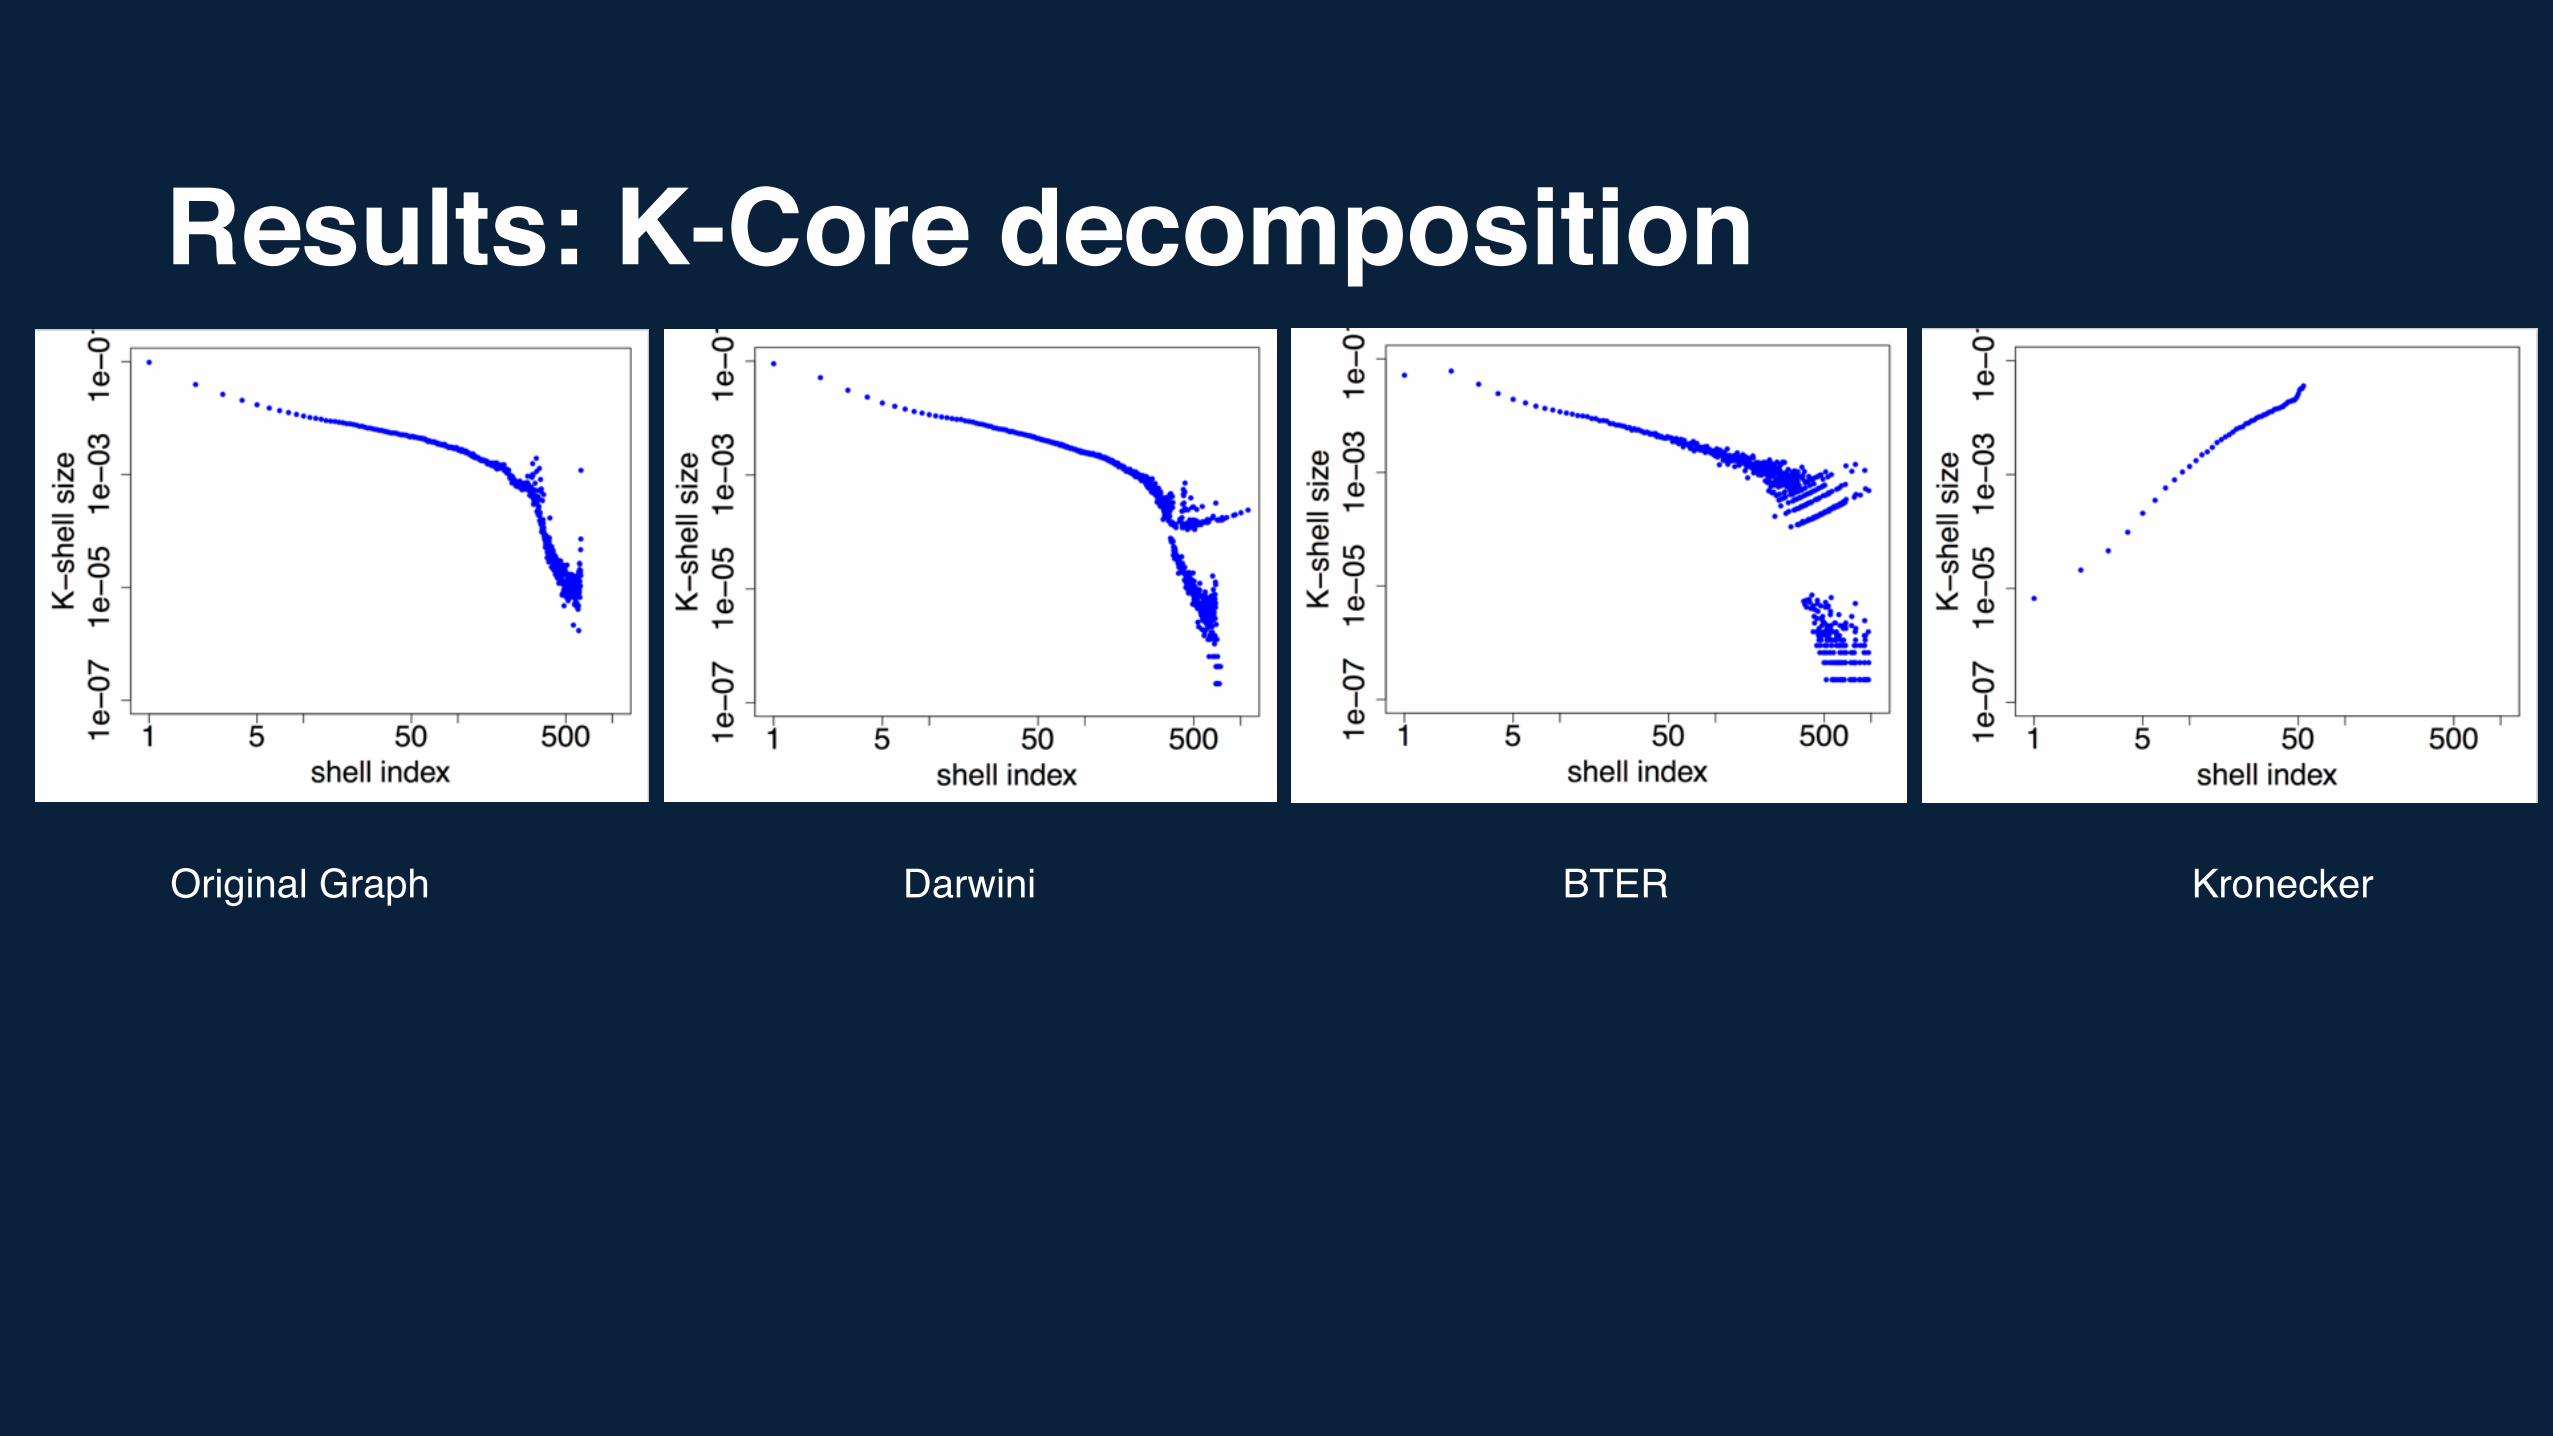
Results: K-Core decomposition
Original Graph Darwini BTER Kronecker
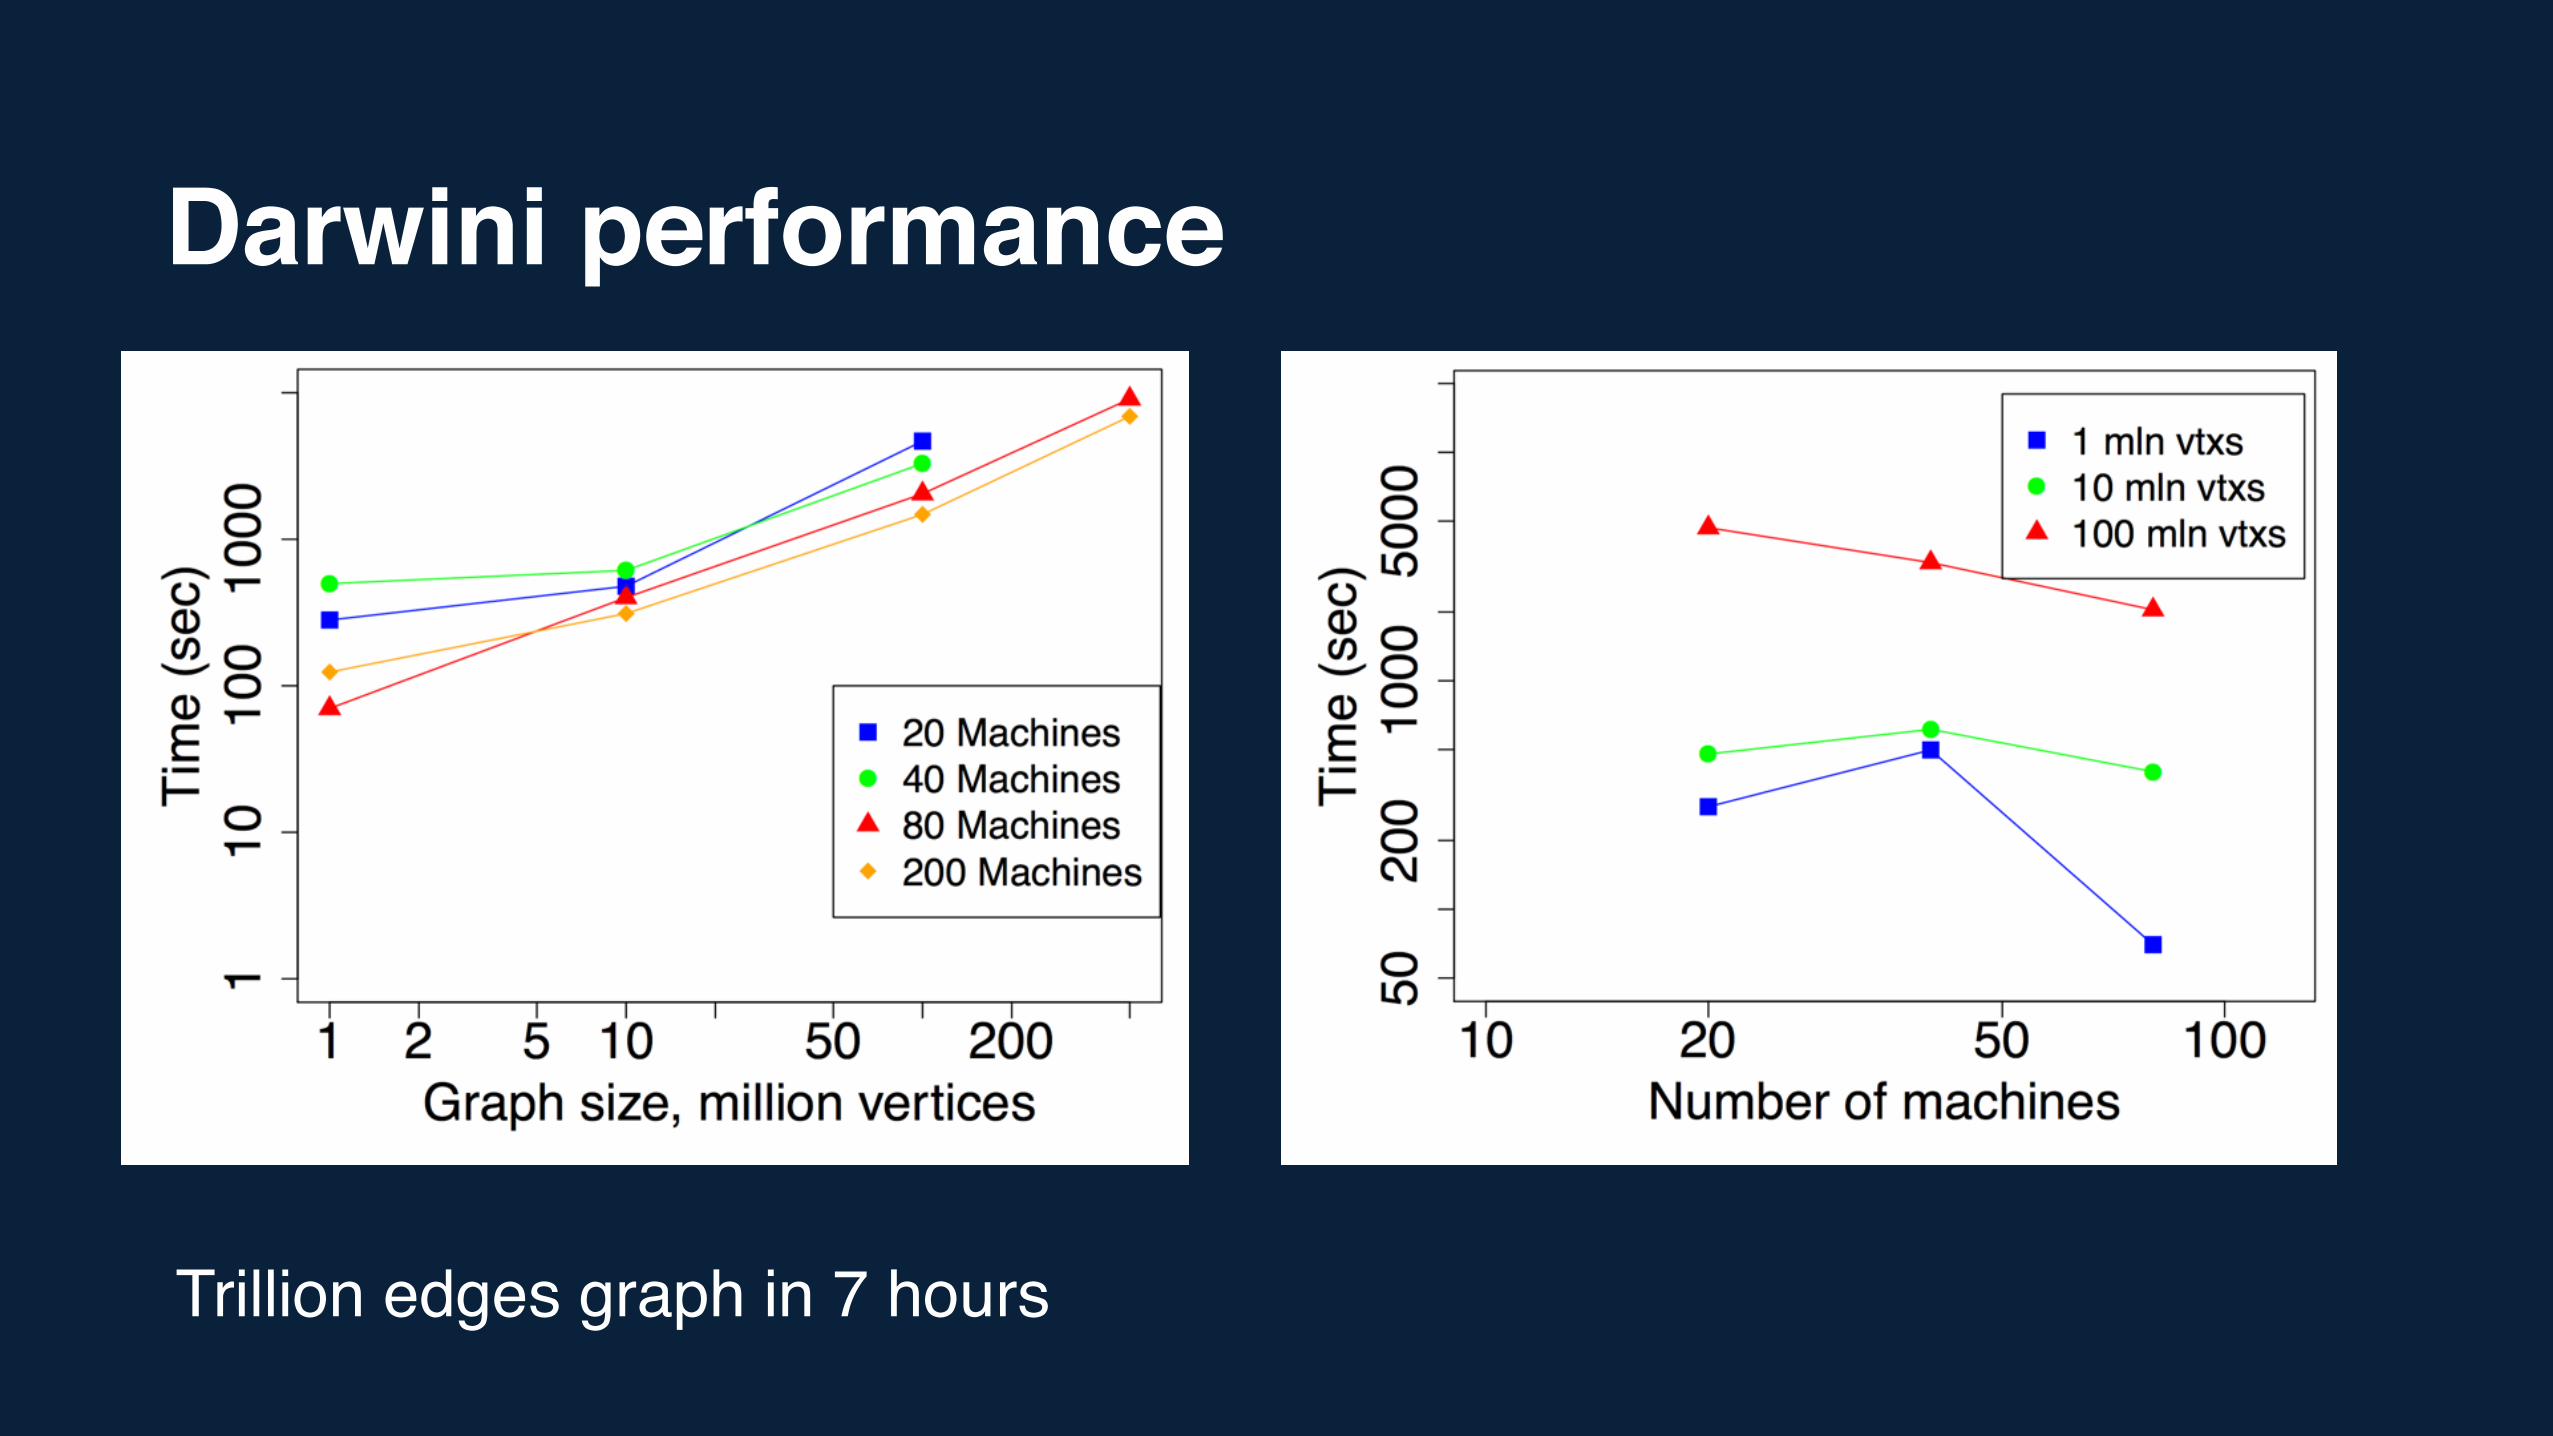
Darwini performance
Trillion edges graph in 7 hours
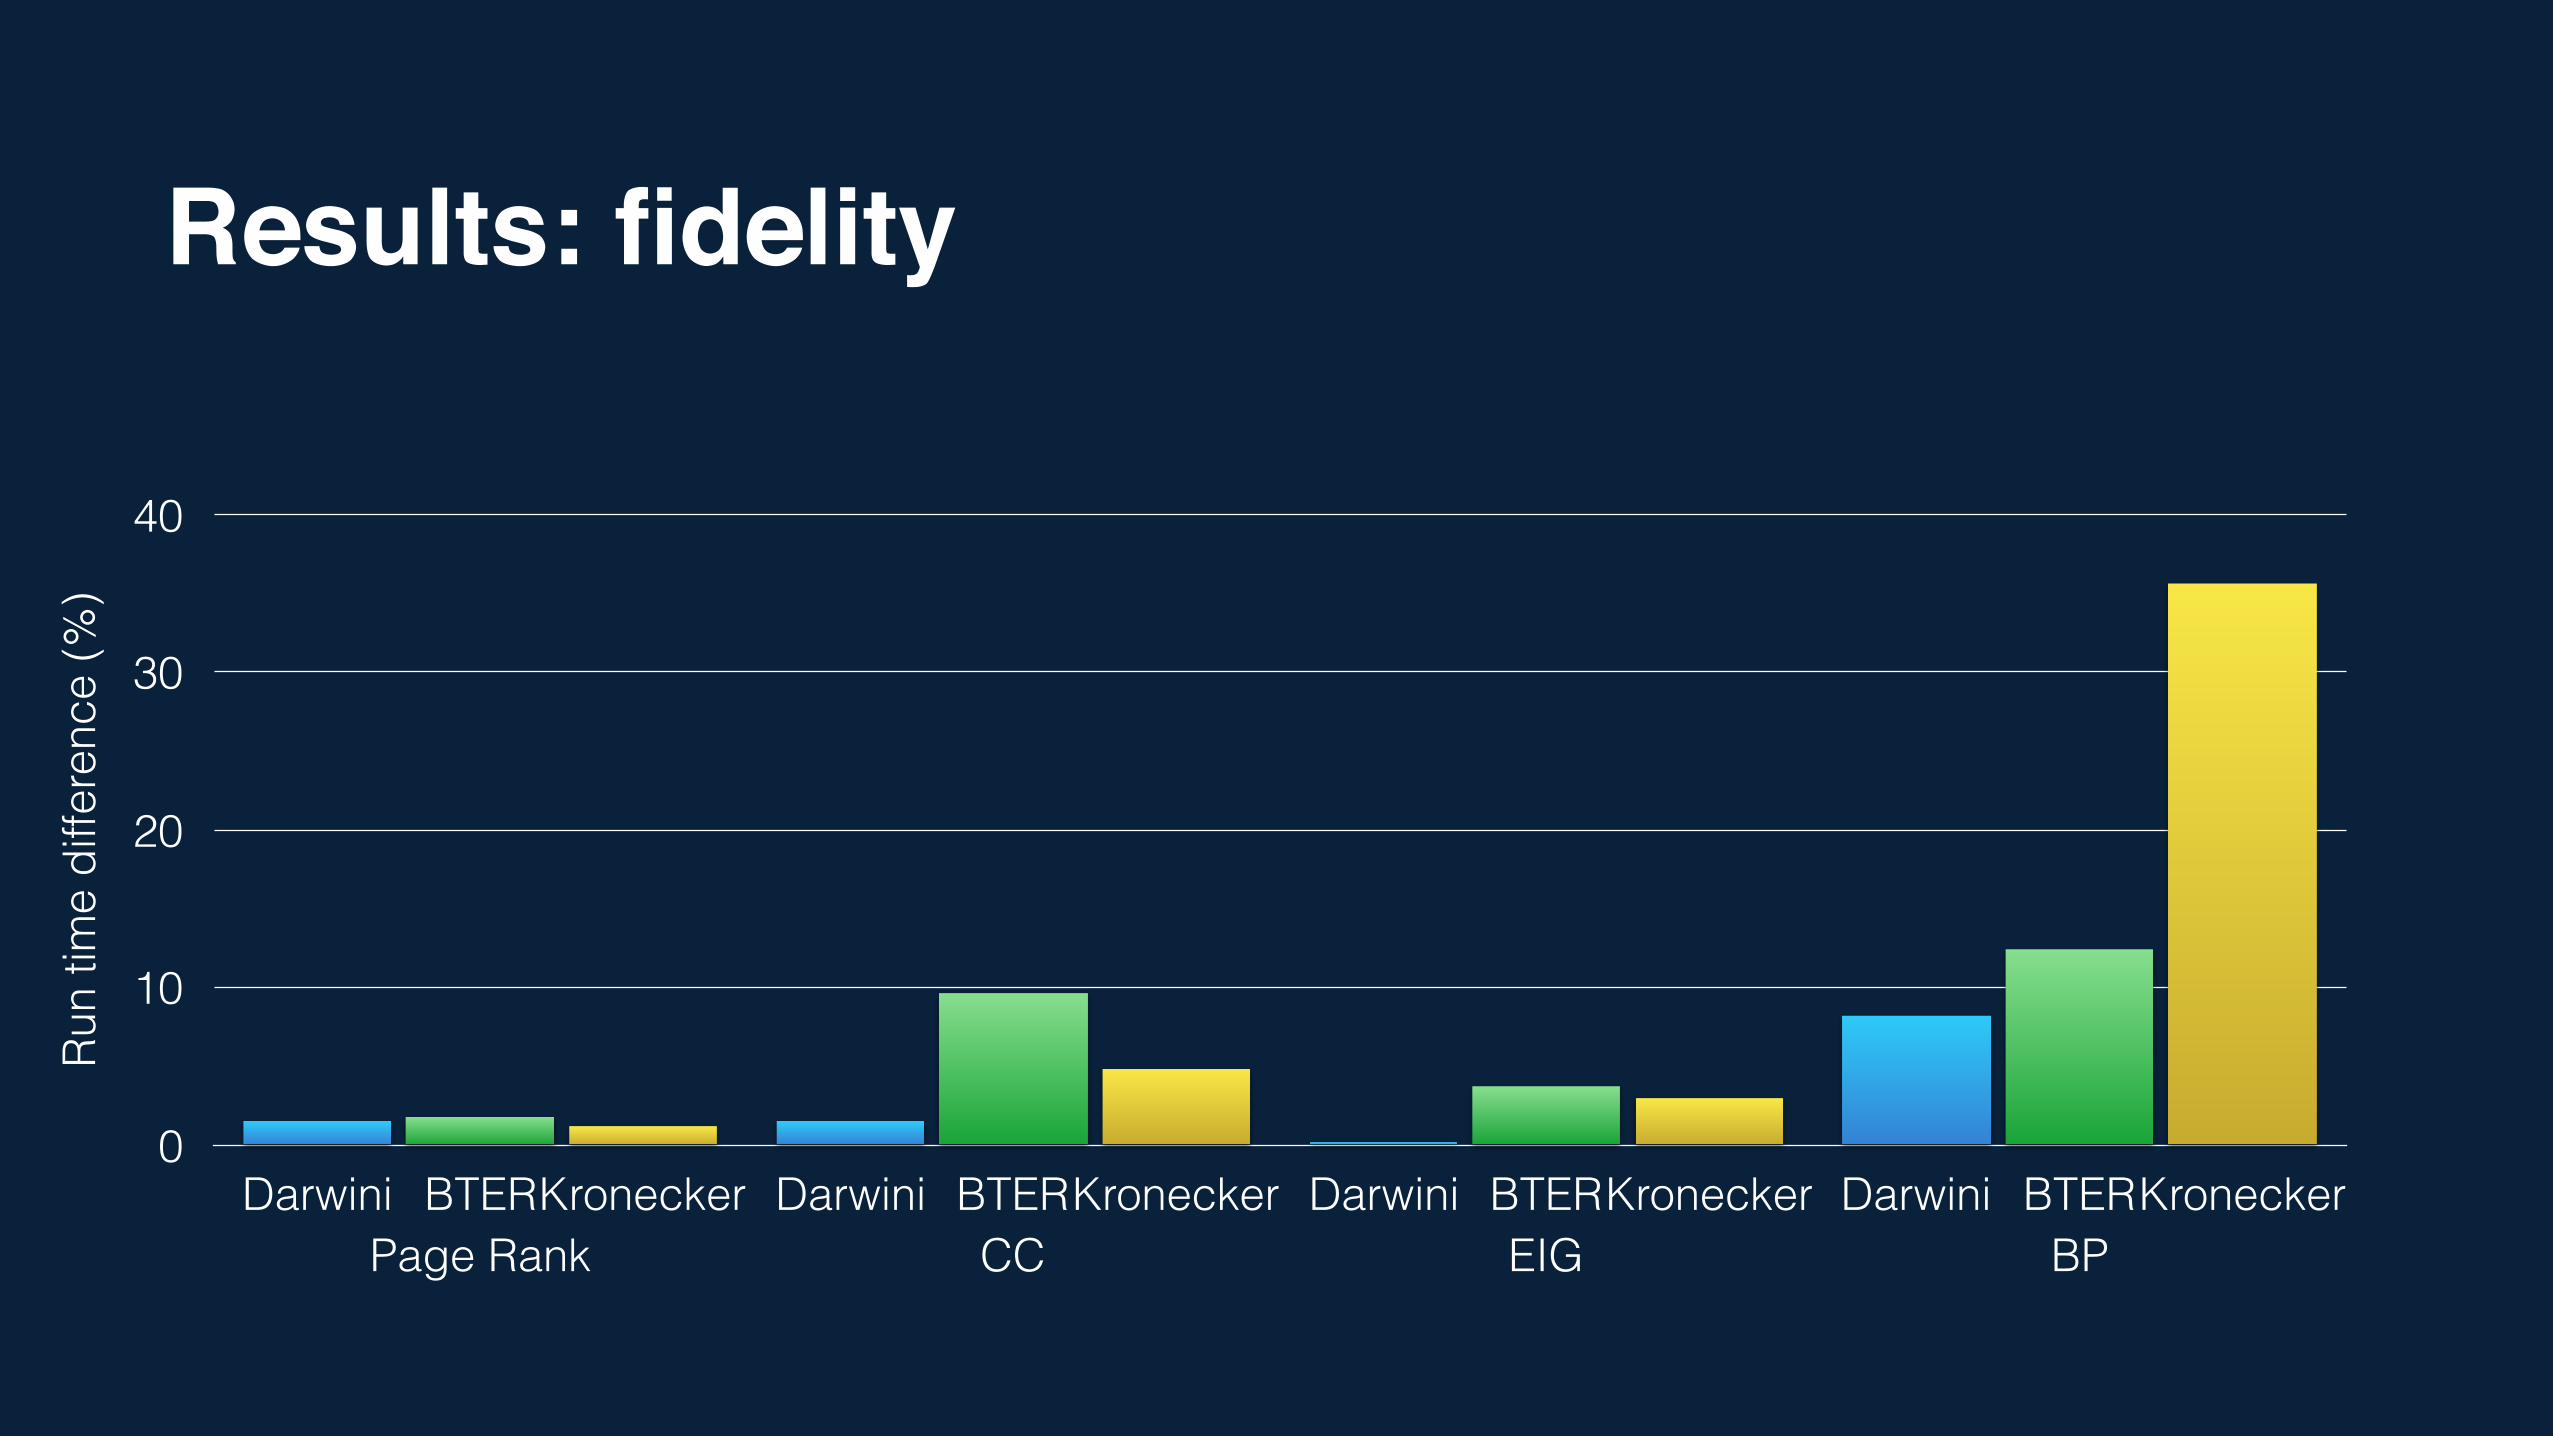
Results: fidelityRu
n tim
e di
ffere
nce
(%)
0
10
20
30
40
Page Rank CC EIG BPDarwini BTERKronecker Darwini BTERKronecker Darwini BTERKronecker Darwini BTERKronecker

Thank You