Embed Size (px)
Citation preview

Performance Monitoring/analysis tools

Network Platforms Group
Legal Disclaimer
General Disclaimer:
© Copyright 2015 Intel Corporation. All rights reserved. Intel, the Intel logo, Intel Inside, the Intel Inside logo, Intel. Experience What’s Inside are trademarks of Intel. Corporation in the U.S. and/or other countries. *Other names and brands may be claimed as the property of others.
FTC Disclaimer:
Intel technologies’ features and benefits depend on system configuration and may require enabled hardware, software or service activation. Performance varies depending on system configuration. No computer system can be absolutely secure. Check with your system manufacturer or retailer or learn more at [intel.com].
Software and workloads used in performance tests may have been optimized for performance only on Intel microprocessors. Performance tests, such as SYSmark and MobileMark, are measured using specific computer systems, components, software, operations and functions. Any change to any of those factors may cause the results to vary. You should consult other information and performance tests to assist you in fully evaluating your contemplated purchases, including the performance of that product when combined with other products. For more complete information visit http://www.intel.com/performance.

System tuning tips

Network Platforms Group 4
Xeon E5-2600 Uncore Sub-System
Ring-style interconnect links cores, last level cache, PCIe and Integrated Memory Controller (IMC). The bus is made up of four independent rings: • a data ring• request ring• acknowledge ring• snoop ring.Unlike the prior generation, the L3 cachenow runs at the core clock speed
Everything is counted (thousands Internal registers)

Network Platforms Group 5
System tuning tips
• Decide on HT
• Decide on Power management
• Measure h/w prefetcher influence
• Disable irqbalancer:− cat /proc/interrupts− service irqbalance stop (distro specific)− most interrupts will go to core0− edit /proc/irq/IRQ_NUMBER/smp_affinity
• Don’t let Linux schedule usermode on DPDK cores:− kernel param isolcpus=list− then pin DPDK processes/threads to this cpus, setaffinity/cpuset
• Decide on Intel compiler

Network Platforms Group 6
Profiling
• System wide or packet processing kernel only
• Kernel only – VTune with micro-benchmark, ICC, IACA
• System wide – PCMMonitor, VTune or Linux perf.− VTune and Linux perf can go down to source (DPDK, your application and Linux kernel)− PCMMonitor is quicker to use to get counter/metric.

Intel® VTune™ Amplifier XE 2015
https://software.intel.com/en-us/intel-vtune-amplifier-xe

Network Platforms Group 8
The New Intel® VTune™ Amplifier XE 2015VTune Amplifier XE features:− Multiple Collection Types
>Hotspots (statistical call tree)>Thread Concurrency>Locks and Waits Analysis>Event-based Sampling
− Timeline View Integrated into all Analysis Types
− Source/Assembly Viewing− Compatible with C/C++, Fortran,
Assembly, .NET− Does not profile all Interrupts− Visual Studio Integration, Command-line, or Standalone interface for Windows* or Linux*

Network Platforms Group 9
VTune, preconfigured profiles
Microarchitecture Analysis: General Exploration profileshould be used for a top-level analysis of potential issues
All the events required are preconfigured – no researchneeded! Simply click Start to run the analysis.

Network Platforms Group 10
VTune, Complexities of Performance MeasurementTwo features of the 2nd generation Intel® Core™ processor family have a significant effect on performance measurement:
−Intel® Hyper-Threading Technology−Intel® Turbo Boost 2.0 Technology
• With these features enabled, it is more complex to measure and interpret performance data
− Most events are counted per thread, some events per core− See VTune Amplifier XE Help for specific events
• Some experts prefer to analyze performance with these features disabled, then re-enable them once optimizations are complete.

Network Platforms Group 11
The “Software on Hardware” Tuning Process
1. Identify Hotspots− Determine efficiency of hotspots> If inefficient, identify architectural reason for
inefficiency
2. Optimize the issue
3. Repeat from step 1!

Network Platforms Group 12
Step 1: Identify the Hotspots
What:
Hotspots are where your application spends the most time
Why:
You should aim your optimization efforts there!>Why improve a function that only takes 2% of your application’s runtime?
How:
VTune Amplifier XE Hotspots or Lightweight Hotspots analysis type>Usually hotspots are defined in terms of the CPU_CLK_UNHALTED.THREAD event (“clockticks”)

Network Platforms Group 13
Step 2: Determine Efficiency
Determine efficiency of the hotspot using one of three methods:
• % Pipeline Slots Retired / Cycle
• Changes in CPI
• Code Examination
Note: Some of these methods are more appropriate for certain codes than others…

Network Platforms Group 14
Method 1: % Retired Pipeline Slots / CycleWhy: Helps you understand how efficiently your app is using the processors
How: General Exploration profile, Metric: Retired Pipeline Slots
What Now: For a given hotspot:
In general, > 90% retiring(.9 or higher) is good. Goto efficiency method 3.
50 - 90% for client apps -Consider investigating stallreduction using thefollowing issue slides.
< 60% for server apps – consider investigating stall reduction.

Network Platforms Group 15
Method 2: Changes in Cycles per Instruction (CPI)Why: Another measure of efficiency that can be useful when comparing 2 runs>Shows average time it takes one of your workload’s instructions to execute
How: General Exploration profile,Metric: CPI
What Now:
>CPI can vary widely dependingon the application and platform!
>If code size stays constant,optimizations should focuson reducing CPI

Network Platforms Group 16
Method 3: Code Examination
Why: Methods 1 and 2 measurehow long it takes instructionsto execute. The other type ofinefficiency is executingtoo many instructions.
How: Use VTune Amplifier XE’scapability as a source anddisassembly viewer

Network Platforms Group
Front-end bound
Cancelled
Retired
Back-end bound
17
Step 3: Identify architectural reason for inefficiency
If Methods 1 or 2 are used to determine code is inefficient, investigate potential issues in rough order of likelihood
− Cache Misses− Contested Accesses− Other Data Access Issues
Blocked Loads, Cache Line Splits, 4K Aliasing Conflicts, DTLB Misses− Allocation Stalls
− Microcode Assists
− Branch Mispredicts, Machine Clears
− Front End Stalls
Network Platforms Group 18
VTune resources
VTune User Forums:
http://software.intel.com/en-us/forums/intel-vtune-performance-analyzer
VTune Amplifier XE Tutorials:
https://software.intel.com/en-us/articles/intel-vtune-amplifier-tutorials
Intel® 64 and IA-32 Architecture Software Developer’s ManualsSoftware Optimization Reference Manual
http://www.intel.com/products/processor/manuals/index.htm

Performance Monitoring
Intel® 64 and IA-32 Architectures Software Developer’s Manual. Volume 3. System Programming Guide. Chapter 18: Performance MonitoringPerformance Analysis Guide: http://software.intel.com/sites/products/collateral/hpc/vtune/performance_analysis_guide.pdf

Network Platforms Group 20
Intel® Performance Counter Monitor (PCM)
Intel® PCM version 2.8 is now available and adds support for the Intel® Xeon® E5 series processors based on Intel microarchitecture code-named Haswell EP/EN/E.
www.intel.com/software/pcm
In contrast to other existing frameworks like PAPI* and Linux* "perf" Intel® PCM supports not only core but also uncore PMUs of Intel processors (including the recent Intel® Xeon® E7 processor series). The uncore is the part of the processor that contains the integrated memory controller and the Intel® QuickPath Interconnect to the other processors and the I/O hub. In total, the following metrics are supported:
• Core: instructions retired, elapsed core clock ticks, core frequency including Intel® Turbo boost technology, L2 cache hits and misses, L3 cache misses and hits.
• Uncore: read bytes from memory controller(s), bytes written to memory controller(s), data traffic transferred by the Intel® QuickPath Interconnect links.

Network Platforms Group 21
Intel® PCM, pcm-memory.x---------------------------------------||----------------------------------------- Socket 0 --||-- Socket 1 -----------------------------------------||------------------------------------------------------------------------------||------------------------------------------------------------------------------||----------------------------------------- Memory Performance Monitoring --||-- Memory Performance Monitoring -----------------------------------------||----------------------------------------- Mem Ch 0: Reads (MB/s): 0.64 --||-- Mem Ch 0: Reads (MB/s): 1.00 ---- Writes(MB/s): 0.09 --||-- Writes(MB/s): 1.46 ---- Mem Ch 1: Reads (MB/s): 0.62 --||-- Mem Ch 1: Reads (MB/s): 0.93 ---- Writes(MB/s): 0.09 --||-- Writes(MB/s): 1.43 ---- Mem Ch 2: Reads (MB/s): 0.66 --||-- Mem Ch 2: Reads (MB/s): 1.06 ---- Writes(MB/s): 0.10 --||-- Writes(MB/s): 1.50 ---- Mem Ch 3: Reads (MB/s): 7.32 --||-- Mem Ch 3: Reads (MB/s): 6.64 ---- Writes(MB/s): 6.76 --||-- Writes(MB/s): 7.12 ---- ND0 Mem Read (MB/s): 9.24 --||-- ND1 Mem Read (MB/s): 9.62 ---- ND0 Mem Write (MB/s) : 7.03 --||-- ND1 Mem Write (MB/s): 11.52 ---- ND0 P. Write (T/s) : 104163 --||-- ND1 P. Write (T/s): 91287 ---- ND0 Memory (MB/s): 16.27 --||-- ND1 Memory (MB/s): 21.14 -----------------------------------------||----------------------------------------- System Read Throughput(MB/s): 18.87 ---- System Write Throughput(MB/s): 18.55 ---- System Memory Throughput(MB/s): 37.42 -----------------------------------------||---------------------------------------
mempool on S0, 10GbE port on S0

Network Platforms Group 22
Intel® PCM, pcm-memory.x---------------------------------------||----------------------------------------- Socket 0 --||-- Socket 1 -----------------------------------------||------------------------------------------------------------------------------||------------------------------------------------------------------------------||----------------------------------------- Memory Performance Monitoring --||-- Memory Performance Monitoring -----------------------------------------||----------------------------------------- Mem Ch 0: Reads (MB/s): 308.26 --||-- Mem Ch 0: Reads (MB/s): 0.71 ---- Writes(MB/s): 305.20 --||-- Writes(MB/s): 1.23 ---- Mem Ch 1: Reads (MB/s): 304.79 --||-- Mem Ch 1: Reads (MB/s): 0.65 ---- Writes(MB/s): 306.95 --||-- Writes(MB/s): 1.19 ---- Mem Ch 2: Reads (MB/s): 316.52 --||-- Mem Ch 2: Reads (MB/s): 0.75 ---- Writes(MB/s): 301.24 --||-- Writes(MB/s): 1.27 ---- Mem Ch 3: Reads (MB/s): 316.47 --||-- Mem Ch 3: Reads (MB/s): 0.93 ---- Writes(MB/s): 311.46 --||-- Writes(MB/s): 1.46 ---- ND0 Mem Read (MB/s): 1246.03 --||-- ND1 Mem Read (MB/s): 3.04 ---- ND0 Mem Write (MB/s) : 1224.86 --||-- ND1 Mem Write (MB/s): 5.16 ---- ND0 P. Write (T/s) : 105213 --||-- ND1 P. Write (T/s): 6458 ---- ND0 Memory (MB/s): 2470.89 --||-- ND1 Memory (MB/s): 8.19 -----------------------------------------||----------------------------------------- System Read Throughput(MB/s): 1249.07 ---- System Write Throughput(MB/s): 1230.02 ---- System Memory Throughput(MB/s): 2479.09 -----------------------------------------||---------------------------------------
mempool on S0, 10GbE port on S1

Network Platforms Group 23
Intel® PCM, pcm.x, DPDK - S0, NIC - S0Core (SKT) | EXEC | IPC | FREQ | AFREQ | L3MISS | L2MISS | L3HIT | L2HIT | L3CLK | L2CLK | READ | WRITE | TEMP
0 0 2.99 2.99 1.00 1.00 3916 6469 0.39 0.52 0.00 0.00 N/A N/A 671 0 0.00 0.30 0.00 1.00 1109 2559 0.57 0.12 0.41 0.12 N/A N/A 642 0 1.70 1.70 1.00 1.00 1429 4132 0.65 0.61 0.00 0.00 N/A N/A 633 0 0.00 0.29 0.00 1.00 1271 3140 0.60 0.09 0.34 0.11 N/A N/A 664 0 2.13 2.13 1.00 1.00 1432 4336 0.67 0.25 0.00 0.00 N/A N/A 635 0 0.00 0.71 0.00 1.00 1667 10 K 0.84 0.33 0.07 0.08 N/A N/A 636 0 0.00 0.57 0.00 1.00 1125 2765 0.59 0.15 0.26 0.08 N/A N/A 687 0 0.00 0.71 0.00 1.00 989 6059 0.84 0.52 0.06 0.06 N/A N/A 668 1 0.00 0.28 0.00 0.71 2247 6937 0.68 0.24 0.30 0.12 N/A N/A 699 1 0.00 1.17 0.00 0.98 9616 18 K 0.49 0.32 0.32 0.06 N/A N/A 70
10 1 0.00 0.29 0.00 0.94 1020 3479 0.71 0.19 0.29 0.14 N/A N/A 6811 1 0.01 0.82 0.01 0.70 40 K 103 K 0.61 0.32 0.29 0.09 N/A N/A 6512 1 0.01 1.53 0.01 0.98 7352 61 K 0.88 0.58 0.06 0.10 N/A N/A 6913 1 0.01 1.45 0.01 0.99 19 K 66 K 0.71 0.35 0.23 0.15 N/A N/A 7014 1 0.00 0.30 0.00 0.81 1317 5391 0.76 0.25 0.23 0.14 N/A N/A 6715 1 0.00 0.90 0.00 0.95 2765 8962 0.69 0.62 0.11 0.05 N/A N/A 68
-------------------------------------------------------------------------------------------------------------------SKT 0 0.85 2.27 0.38 1.00 12 K 39 K 0.68 0.41 0.00 0.00 0.01 0.01 62SKT 1 0.00 1.16 0.00 0.85 84 K 274 K 0.69 0.42 0.20 0.10 0.00 0.01 65
-------------------------------------------------------------------------------------------------------------------TOTAL * 0.43 2.26 0.19 1.00 96 K 312 K 0.69 0.42 0.00 0.00 0.01 0.01 N/A
EXEC : instructions per nominal CPU cycleIPC : instructions per CPU cycleFREQ : relation to nominal CPU frequency='unhalted clock ticks'/'invariant timer ticks' (includes Intel Turbo Boost)AFREQ : relation to nominal CPU frequency while in active state (not in power-saving C state)='unhalted clock ticks'/
‘invariant timer ticks while in C0-state' (includes Intel Turbo Boost)
Network Platforms Group 24
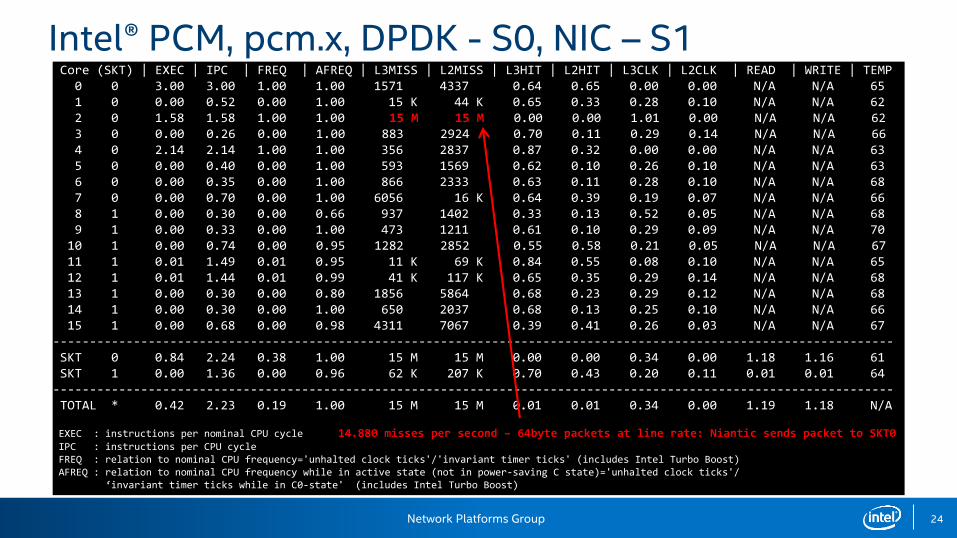
Intel® PCM, pcm.x, DPDK - S0, NIC – S1Core (SKT) | EXEC | IPC | FREQ | AFREQ | L3MISS | L2MISS | L3HIT | L2HIT | L3CLK | L2CLK | READ | WRITE | TEMP
0 0 3.00 3.00 1.00 1.00 1571 4337 0.64 0.65 0.00 0.00 N/A N/A 651 0 0.00 0.52 0.00 1.00 15 K 44 K 0.65 0.33 0.28 0.10 N/A N/A 622 0 1.58 1.58 1.00 1.00 15 M 15 M 0.00 0.00 1.01 0.00 N/A N/A 623 0 0.00 0.26 0.00 1.00 883 2924 0.70 0.11 0.29 0.14 N/A N/A 664 0 2.14 2.14 1.00 1.00 356 2837 0.87 0.32 0.00 0.00 N/A N/A 635 0 0.00 0.40 0.00 1.00 593 1569 0.62 0.10 0.26 0.10 N/A N/A 636 0 0.00 0.35 0.00 1.00 866 2333 0.63 0.11 0.28 0.10 N/A N/A 687 0 0.00 0.70 0.00 1.00 6056 16 K 0.64 0.39 0.19 0.07 N/A N/A 668 1 0.00 0.30 0.00 0.66 937 1402 0.33 0.13 0.52 0.05 N/A N/A 689 1 0.00 0.33 0.00 1.00 473 1211 0.61 0.10 0.29 0.09 N/A N/A 70
10 1 0.00 0.74 0.00 0.95 1282 2852 0.55 0.58 0.21 0.05 N/A N/A 6711 1 0.01 1.49 0.01 0.95 11 K 69 K 0.84 0.55 0.08 0.10 N/A N/A 6512 1 0.01 1.44 0.01 0.99 41 K 117 K 0.65 0.35 0.29 0.14 N/A N/A 6813 1 0.00 0.30 0.00 0.80 1856 5864 0.68 0.23 0.29 0.12 N/A N/A 6814 1 0.00 0.30 0.00 1.00 650 2037 0.68 0.13 0.25 0.10 N/A N/A 6615 1 0.00 0.68 0.00 0.98 4311 7067 0.39 0.41 0.26 0.03 N/A N/A 67
-------------------------------------------------------------------------------------------------------------------SKT 0 0.84 2.24 0.38 1.00 15 M 15 M 0.00 0.00 0.34 0.00 1.18 1.16 61SKT 1 0.00 1.36 0.00 0.96 62 K 207 K 0.70 0.43 0.20 0.11 0.01 0.01 64
-------------------------------------------------------------------------------------------------------------------TOTAL * 0.42 2.23 0.19 1.00 15 M 15 M 0.01 0.01 0.34 0.00 1.19 1.18 N/A
EXEC : instructions per nominal CPU cycle 14.880 misses per second – 64byte packets at line rate: Niantic sends packet to SKT0IPC : instructions per CPU cycleFREQ : relation to nominal CPU frequency='unhalted clock ticks'/'invariant timer ticks' (includes Intel Turbo Boost)AFREQ : relation to nominal CPU frequency while in active state (not in power-saving C state)='unhalted clock ticks'/
‘invariant timer ticks while in C0-state' (includes Intel Turbo Boost)

Network Platforms Group 25
Intel® PCM, pcm.x, BIOS with QPI counters enabled
Note: In most cases QPI counters are not enabled in BIOS and not available for editing, contact your HW vendor to get BIOS version with QPI counter enabled
Intel(r) QPI data traffic estimation in bytes (data traffic coming to CPU/socket through QPI links):
QPI0 QPI1 | QPI0 QPI1
----------------------------------------------------------------------------------------------
SKT 0 175 K 162 K | 0% 0%
SKT 1 137 K 151 K | 0% 0%
----------------------------------------------------------------------------------------------
Total QPI incoming data traffic: 627 K QPI data traffic/Memory controller traffic: 0.04
Intel(r) QPI traffic estimation in bytes (data and non-data traffic outgoing from CPU/socket through QPI links):
QPI0 QPI1 | QPI0 QPI1
----------------------------------------------------------------------------------------------
SKT 0 544 K 522 K | 0% 0%
SKT 1 523 K 483 K | 0% 0%
----------------------------------------------------------------------------------------------
Total QPI outgoing data and non-data traffic: 2073 K
DPDK running on S0, NIC connected to S0:

Network Platforms Group 26
Intel® PCM, pcm.x, BIOS with QPI counters enabled
According to the definition the "QPI data traffic/Memory controller traffic" should be interpreted as follows:If all memory accesses are local then QPI data traffic should be negligible (zero). Then the metric is close to 0.If all memory accesses are remote then they must go through QPI, in this case QPI data traffic could be even >= memory controller traffic. The metric is then >= 1. The metric is an indicator for the NUMA-awareness of the applications running on the system. NUMA-optimized applications should have close to 0 metric value.
Intel(r) QPI data traffic estimation in bytes (data traffic coming to CPU/socket through QPI links):
QPI0 QPI1 | QPI0 QPI1
----------------------------------------------------------------------------------------------
SKT 0 536 M 510 M | 3% 3% <- ~8.4 Gbits: Niantic sends packet from SKT1
SKT 1 130 M 117 M | 0% 0% <- A lot of MMIO requests from SKT0 to Niantic over QPI
----------------------------------------------------------------------------------------------
Total QPI incoming data traffic: 1292 M QPI data traffic/Memory controller traffic: 0.51
Intel(r) QPI traffic estimation in bytes (data and non-data traffic outgoing from CPU/socket through QPI links):
QPI0 QPI1 | QPI0 QPI1
----------------------------------------------------------------------------------------------
SKT 0 279 M 291 M | 1% 1%
SKT 1 716 M 750 M | 4% 4% <- ~11G bits (data and non-data): Niantic sends packet to SKT0
----------------------------------------------------------------------------------------------
Total QPI outgoing data and non-data traffic: 2038 M
DPDK running on S0, NIC connected to S1:

NUMA Monitoring

Network Platforms Group 28
NUMATOPNumaTOP is an observation tool for runtime memory locality characterization andanalysis of processes and threads running on a NUMA system. It helps the usercharacterize the NUMA behavior of processes and threads and identify where theNUMA-related performance bottlenecks reside. The tool uses Intel performance countersampling technologies and associates the performance data with Linux system runtimeinformation to provide real-time analysis for production systems.
numatop supports the Intel® Xeon® processors:• 5500-series, 6500/7500-series, 5600 series• E7-x8xx-series• E5-16xx/24xx/26xx/46xx-series
https://01.org/numatop
Note: PEBS (Precise Event Based Sampling) must be enabled in Linux kernel

Network Platforms Group 29
NUMATOP, monitoring a process

Network Platforms Group 30
NUMATOP, monitoring memory areas

Network Platforms Group 31
NUMATOP, memory break down

Network Platforms Group 32
NUMATOP, call-chain

KVM monitoring

Network Platforms Group 34
KVM statisticsThe kvm_stat command is a python script which retrieves runtime statistics from the kvm kernel module. The kvm_stat command can be used to diagnose guest behavior visible to kvm. In particular, performance related issues with guests. Currently, the reported statistics are for the entire system; the behaviour of all running guests is reported.
exitsThe count of all VMEXIT calls.
mmio_exitsNumber of guest exits due to memory mapped I/O (MMIO) accesses.
mmu_cache_missNumber of KVM MMU shadow pages created.
mmu_shadow_zappedNumber of invalidated shadow pages.
remote_tlb_flushNumber of remote (sibling CPU) TLB flush requests.
tlb_flushNumber of tlb_flush operations performed by the hypervisor.
# kvm_stat
kvm statistics
efer_reload 94 0exits 4003074 31272fpu_reload 1313881 10796halt_exits 14050 259halt_wakeup 4496 203host_state_reload 1638354 24893insn_emulation 1093850 1909insn_emulation_fail 0 0invlpg 75569 0io_exits 1596984 24509irq_exits 21013 363irq_injections 48039 1222irq_window 24656 870largepages 0 0mmio_exits 11873 0pf_fixed 697731 3150pf_guest 279349 0remote_tlb_flush 5 0signal_exits 1 0tlb_flush 200190 0
http://docs.fedoraproject.org/en-US/Fedora_Draft_Documentation/0.1/html/Virtualization_Administration_Guide/ch20s02.html

Network Platforms Group 35
Huge pages & KVM TLB shootdowns
If you are running multiple VM’s using EPT/VT-d huge pages (2MB/1G) on KVM, it is very important (from a performance standpoint) to disable Kernel Same-page Merging (CONFIG_KSM). This has shown to cause significant performance degradation when combined with running DPDK in the VM’s.
You can monitor your TLB shootdowns with the following command:
watch -n 1 -d "cat /proc/interrupts | grep TLB"
If you have CONFIG_KSM compiled into your kernel and you are seeing large amounts ( > 100/s) of shootdowns, you can do a quick test to see if it solves your problem by:
echo 0 > /sys/kernel/mm/ksm/run

HW Monitoring

Network Platforms Group 37
POWERTOP
PowerTOP is a Linux tool to diagnose issues with power consumptionand power management.

Network Platforms Group 38
POWERTOP

Network Platforms Group 39
hwloc (http://www.open-mpi.org/projects/hwloc)The Portable Hardware Locality (hwloc) software package provides a portableabstraction (across OS, versions, architectures, ...) of the hierarchical topology ofmodern architectures, including NUMA memory nodes, sockets, shared caches, coresand simultaneous multithreading. It also gathers various system attributes such as cacheand memory information as well as the locality of I/O devices such as networkinterfaces, InfiniBand HCAs or GPUs. It primarily aims at helping applications withgathering information about modern computing hardware so as to exploit it accordinglyand efficiently.
Command line tools:lstopo – Displaying topologieshwloc-calc – Compute CPU setshwloc-bind – Bind processes and threads
hwloc tutorials http://runtime.bordeaux.inria.fr/hwloc/tutorials

Network Platforms Group 40
lstopo (part of hwloc package)
Default output is graphical (X11) if DISPLAYis set, console otherwise.
Supported output file formats: console, txt, fig, pdf, ps,png, svg, xml, synthetic
Some filtering options:--no-caches Do not show caches--no-io Do not show any I/O device or bridge--no-bridges Do not any I/O bridge except
hostbridges--whole-io Show all I/O devices and bridges

Using DPPD for Packets generation

Network Platforms Group 42
Intel® Data Plane Performance Demonstrators
• Linux user space applications based upon the Intel® Data Plane Development Kit (Intel® DPDK).
• Use small and readable configuration files for configuring tasks as
• Load balance based on packet fields
• Routing
• QoS
• GRE encap/decap
• QinQ encap/decap IPv4/IPv6
• Packets generation
https://01.org/intel-data-plane-performance-demonstrators

Network Platforms Group 43
DPPD, packets generation overview• DPPD is open source, running on COTS HW
• Generate traffic close to line rate, for any packet size (64, 128…, 1518 bytes), for multiple 10Gbps interfaces.
• Receive packets at line rate for 10Gbs.
• Support multiple network interfaces (only requires two CPU cores per port (one for RX, one for TX).
• Using PCAP file, any packet type can be generated (stateless protocols)
• No TCP stateful support
• Measure latency, accuracy around 5 microseconds
• Supports receiving commands from TCP socket (for scripting/automation)

Network Platforms Group 44
DPPD, main screen
$sudo -E ./build/dppd -f /config/ng-4ports.pkt

Network Platforms Group 45
DPPD, latency screen

references

Network Platforms Group 47
ReferencesIntel® 64 and IA-32 Architectures Software Developer’s Manual Combined Volumes: 1, 2A, 2B, 2C, 3A, 3B and 3C. Volume 3, Chapters 2.5, 4, 11, 18, 28… :
http://www.intel.com/content/www/us/en/processors/architectures-software-developer-manuals.html
Intel® 64 and IA-32 Architectures Optimization Reference Manual
http://www.intel.com/content/www/us/en/architecture-and-technology/64-ia-32-architectures-optimization-manual.html
Intel® Xeon® Processor E5-2600/4600 Product Family Technical Overview
http://software.intel.com/en-us/articles/intel-xeon-processor-e5-26004600-product-family-technical-overview
Intel® Xeon® Processor E5-1600/E5-2600/E5-4600 Product Families
Datasheet - Volume One http://www.intel.ie/content/dam/www/public/us/en/documents/datasheets/xeon-e5-1600-2600-vol-1-datasheet.pdf
Datasheet - Volume Two http://www.intel.ie/content/dam/www/public/us/en/documents/datasheets/xeon-e5-1600-2600-vol-2-datasheet.pdf
Intel® Xeon® Processor E5 v3 Family Uncore Performance Monitoring
http://www.intel.com/content/www/us/en/processors/xeon/xeon-e5-v3-uncore-performance-monitoring.html
Performance Analysis Guide for Intel® Core™ i7 Processor and Intel® Xeon™ 5500 processors http://software.intel.com/sites/products/collateral/hpc/vtune/performance_analysis_guide.pdf