Embed Size (px)
Citation preview

C H A P T E R 3
A V E R A G E S A N D V A R I A T I O N
3.2 Measures of Variation
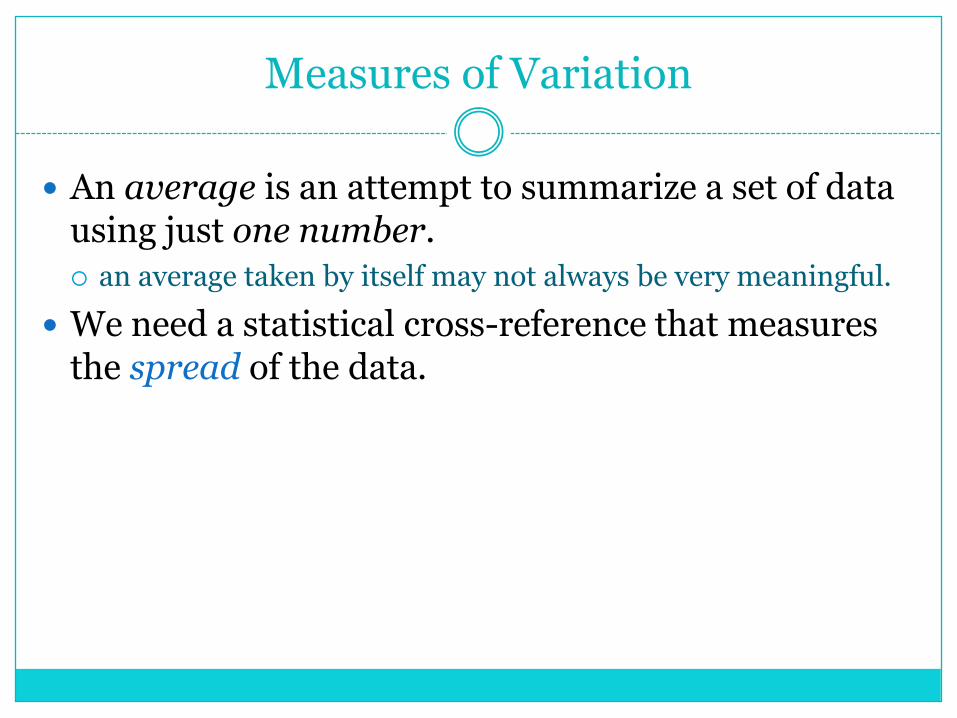
Measures of Variation
An average is an attempt to summarize a set of data using just one number.
an average taken by itself may not always be very meaningful.
We need a statistical cross-reference that measures the spread of the data.

Measures of Variation
Two sets could have the same mean and look very different in terms of spread.
Example:Set A: 10, 10, 11, 12, 12Set B: 2, 4, 11, 18, 20
Both have a mean of 11.

The Range
The range is a measure of variation, it is the difference between the largest and smallest values of a data distribution.
Does not tell how much other values vary from one another or from the mean

Variance and Standard Deviation

Defining Formulas
Sample Variance
Sample Standard DeviationAP Formula Sheet:
To find variance: square the result
Hint: When using these formulas, it helps to use a chart for the intermediate work.
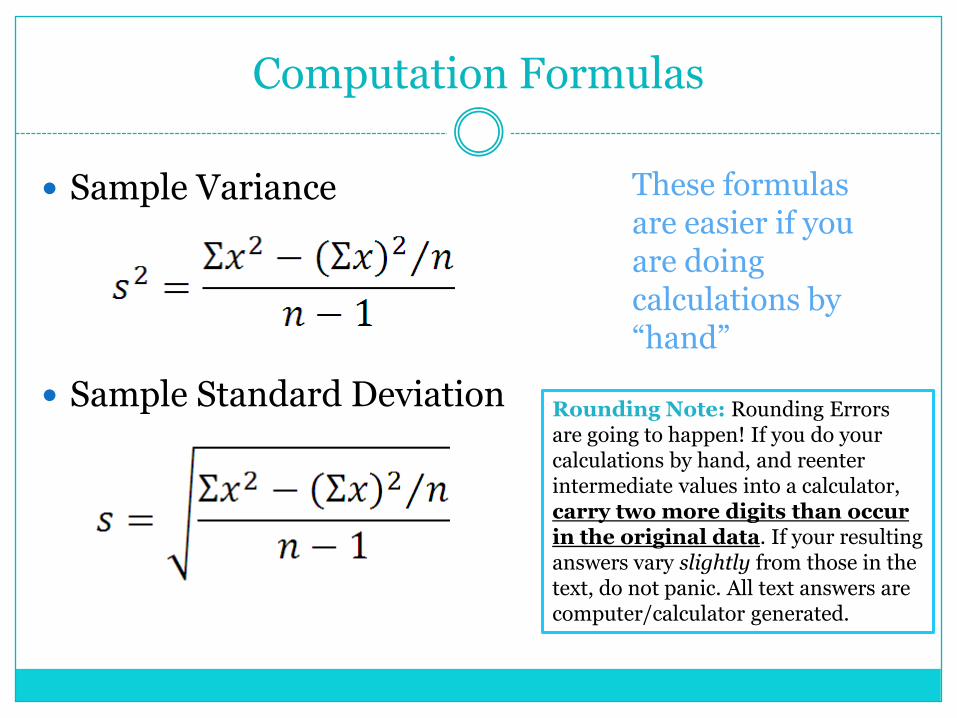
Computation Formulas
Sample Variance
Sample Standard Deviation
These formulas are easier if you are doing calculations by “hand”
Rounding Note: Rounding Errors are going to happen! If you do your calculations by hand, and reenter intermediate values into a calculator, carry two more digits than occur in the original data. If your resulting answers vary slightly from those in the text, do not panic. All text answers are computer/calculator generated.

Page 94When doing calculations by hand, it is helpful to use a table to keep track of everything.


Example 6 – Sample Standard Deviation
Big Blossom Greenhouse was commissioned to develop an extra large rose for the Rose Bowl Parade. A random sample of blossoms from Hybrid A bushes yielded the following diameters (in inches) for mature peak blooms.
2 3 3 8 10 10
Use the defining formula to find the sample variance and standard deviation.
Page 96

x x – x (x – x)2
2
3
3
8
8
10
10
∑x ∑(x – x)2
Solution– Sample Standard Deviation

Population Variance and Population Standard Deviation
In most applications of statistics, we work with a random sample of data rather than the entire population of all possible data values.
If we have data for the entire population, we cancompute the population mean , population variance 2, and population standard deviation (lowercase Greek letter sigma)

Population Mean
Population Variance
Population Standard Deviation
Population Variance and Population Standard Deviation

Using the Calculator
1. Enter the data in L1
2. Hit STAT, tab over to CALC, choose 1: 1-VarStats
3. Hit 2nd 1 ENTER
Sample Standard Deviation
Population Standard Deviation
Read “Rounding Note” on page 98
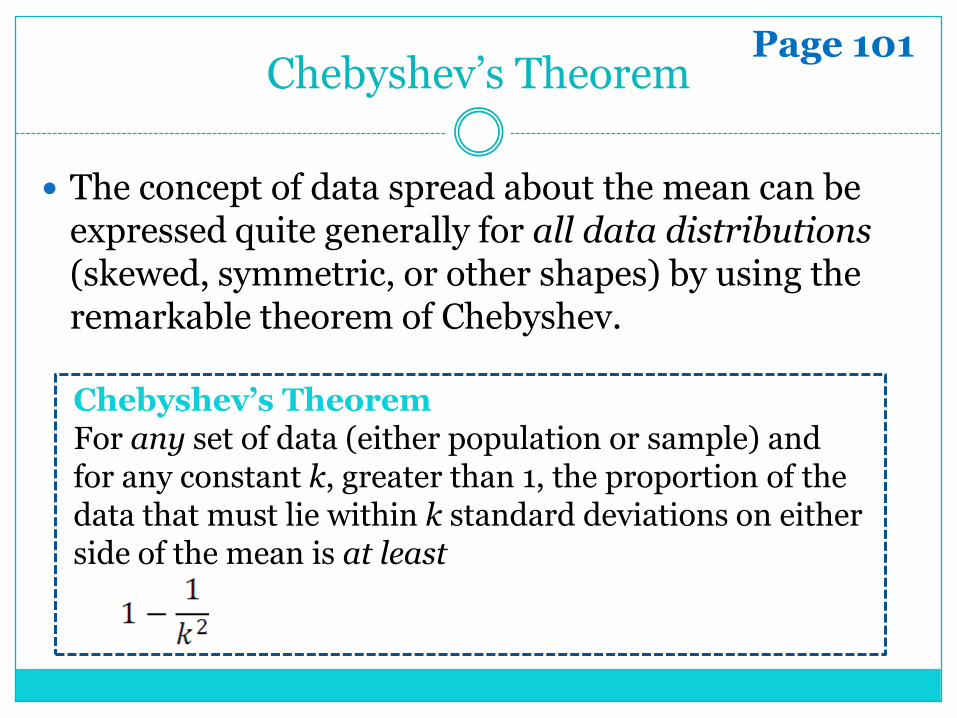
Chebyshev’s Theorem
The concept of data spread about the mean can be expressed quite generally for all data distributions (skewed, symmetric, or other shapes) by using the remarkable theorem of Chebyshev.
Chebyshev’s TheoremFor any set of data (either population or sample) and for any constant k, greater than 1, the proportion of the data that must lie within k standard deviations on either side of the mean is at least
Page 101

Results of Chebyshev’s Theorem
For any set of data
At least 75% of the data fall in the interval from μ – 2σ to μ + 2σ
At least 88.9% of the data fall in the interval from μ – 3σ to μ + 3σ
At least 93.8% of the data fall in the interval from μ – 4σ to μ + 4σ
Chebyshev’s TheoremPage 102
Notice that Chebyshev’s theorem refers to the minimum percentage of data that must fall within the specified number of standard deviations of the mean.
If the distribution is mound-shaped, an even greater percentage of data will fall into the specified intervals. (Chapter 6)

Example 8 – Chebyshev’s Theorem
Students Who Care is a student volunteer program in which college students donate work time to various community projects such as planting trees. Professor Gill is the faculty sponsor for this student volunteer program. For several years, Dr. Gill has kept a careful record of x = total number of work hours volunteered by a student in the program each semester. For a random sample of students in the program, the mean number of hours was x = 29.1 hours each semester, with a standard deviation s= 1.7 of hours each semester.
Find an interval A to B for the number of hours volunteered into which at least 75% of the students in this program would fit.
Page 102

Homework
Page 104
#1 – 4
#5 (by hand)
#10, 11, 12, 13
#17 & 18 (a, b, c)