Embed Size (px)
Citation preview

MassTech_MTCIndex Sig #1 - Low Folio - Front
MassTech_MTCIndex Sig #34 - Low Folio - Front
235008_MassTech_MTCIndex - Work-and-turn 1 - 12/19/14 08:41:21 - Black 235008_MassTech_MTCIndex - Work-and-turn 1 - 12/19/14 08:41:21 - Cyan 235008_MassTech_MTCIndex - Work-and-turn 1 - 12/19/14 08:41:21 - Magenta 235008_MassTech_MTCIndex - Work-and-turn 1 - 12/19/14 08:41:21 - Yellow
Key
2K
ey 3
Key
4
Key
5K
ey 6
Key
7K
ey 8
Key
9K
ey 1
0K
ey 1
1K
ey
12
Key
13
Key
14
Key
15
Key
16
Key
17
Key
18
Key
19
Key
21
Key
2
0K
ey 2
2
KC
MY
M1
M2
M1
M2
M1
M2
M1
M2
M1
M2
M1
M2
M1
M2
M1
M2
M1
M2
M1
M2
M1
M2
2525
M1
M2
25M
1M
225
2525
50M
1M
2M
1M
250
5050
5050
M1
M2
M1
M2
5075
7575
7575
75G
RA
YG
RA
YG
RA
YG
RA
YG
RA
YK
CM
YK
CM
YK
CM
YK
CM
YK
CM
YK
CM
YY
+M
Y+
CC
+M
KC
MY
KC
MY
KC
MY
KP
CM
YK
CM
YK
CM
YK
CM
YK
CM
YK
CM
YK
CM
YG
RA
YK
CM
YM
1M
2M
1M
2M
1M
2M
1M
275
7575
7575
75G
RA
YG
RA
YK
CM
YK
CM
YK
CM
Y
Key
1
KC
MY
M1
M2
50
Key
23M
1M
2st
arst
arK
CM
Y
Kom
ori/G
AT
F
Par
t No.
K-2
8-6(
D)
1/2/
3/4
K1
2
34
1/2/
3/4
C1
2
34
1/2/
3/4
M1
2
34
1/2/
3/4
M1
1/2/
3/4
Y1
2
34
12
34
1/2/
3/4
M2
12
34

The Index of the Massachusetts Innovation Economy, published annually since 1997, is the premier fact-based benchmark for measuring the performance of the Massachusetts knowledge economy.
To view the Index online visit our InnovationIndex portal at: index.masstech.org.
For more information on the Massachusetts innovation economy visit our website at:www.masstech.org
MassTech_MTCIndex Sig #1 - Low Folio - Front
MassTech_MTCIndex Sig #34 - Low Folio - Front
235008_MassTech_MTCIndex - Work-and-turn 1 - 12/19/14 08:41:21 - Black235008_MassTech_MTCIndex - Work-and-turn 1 - 12/19/14 08:41:21 - Cyan235008_MassTech_MTCIndex - Work-and-turn 1 - 12/19/14 08:41:21 - Magenta235008_MassTech_MTCIndex - Work-and-turn 1 - 12/19/14 08:41:21 - Yellow
Key 2
Key 3
Key 4
Key 5
Key 6
Key 7
Key 8
Key 9
Key 10
Key 11
Key 12
Key 13
Key 14
Key 15
Key 16
Key 17
Key 18
Key 19
Key 21
Key 20
Key 22
KC
MY
M1
M2
M1
M2
M1
M2
M1
M2
M1
M2
M1
M2
M1
M2
M1
M2
M1
M2
M1
M2
M1
M2
2525
M1
M2
25M
1M
225
2525
50M
1M
2M
1M
250
5050
5050
M1
M2
M1
M2
5075
7575
7575
75G
RA
YG
RA
YG
RA
YG
RA
YG
RA
YK
CM
YK
CM
YK
CM
YK
CM
YK
CM
YK
CM
YY
+M
Y+
CC
+M
KC
MY
KC
MY
KC
MY
KP
CM
YK
CM
YK
CM
YK
CM
YK
CM
YK
CM
YK
CM
YG
RA
YK
CM
YM
1M
2M
1M
2M
1M
2M
1M
275
7575
7575
75G
RA
YG
RA
YK
CM
YK
CM
YK
CM
Y
Key 1
KC
MY
M1
M2
50
Key 23 M
1M
2star
starK
CM
Y
Kom
ori/GA
TF
P
art No. K
-28-6(D)
1/2/3/4 K1
2
34
1/2/3/4 C1
2
34
1/2/3/4 M1
2
34
1/2/3/4 M1
1/2/3/4 Y1
2
34
12
34
1/2/3/4 M2
12
34
Gregory BialeckiChair, Board of Directors, Massachusetts Technology CollaborativeSecretary, Executive Office of Housing and Economic Development
Massachusetts USALeading the Innovation Revolution
Dear Friends,
It is once again my pleasure to welcome you to the 2014 Index of the Massachusetts Innovation Economy. Published annually by the Mass Tech Collaborative, the Index is one of the Commonwealth’s most important tools for assessing the performance of the key industry sectors that comprise the innovation economy. Since 1997, the Index has been enabling analysis of the growth and sustainability of the state’s Innovation Economy while also examining its strengths. In addition, the Index focuses on areas that need to be addressed in order for the Commonwealth to remain at the forefront of innovation and generate the economic development necessary to maintaining a high quality of life.
With the lingering effects of the recession mostly diminished, the Commonwealth is confronted with the challenge of accelerating innovation and job growth in the face of growing competition from other states. A collaborative, strategic approach to innovation-based economic development in Massachusetts continues to be critical to our state’s future growth. In this year’s edition we are highlighting the Commonwealth’s regional strengths in innovation and their effects on this economic development. Regions outside of Greater Boston play an important, if sometimes overlooked role in the Commonwealth’s economy. The Index stimulates rich dialogue that helps us to better understand the dynamism of the state’s ecosystem, its impact on the competitiveness of industries, and its ability to generate shared prosperity and opportunity in regions throughout the Commonwealth. It is our hope that this year’s Special Analysis will raise awareness leading to action that enables Massachusetts to strengthen innovation statewide, increasing prosperity throughout the Commonwealth.
I invite you to read the Index and join the conversation.
MassTech_MTCIndex Sig #2 - Low Folio - Front
MassTech_MTCIndex Sig #3 - Low Folio - Front
MassTech_MTCIndex Sig #4 - Low Folio - Front
MassTech_MTCIndex Sig #5 - Low Folio - Front235008_MassTech_MTCIndex - Front 2 - 12/19/14 08:41:24 - Black 235008_MassTech_MTCIndex - Front 2 - 12/19/14 08:41:24 - Cyan 235008_MassTech_MTCIndex - Front 2 - 12/19/14 08:41:24 - Magenta 235008_MassTech_MTCIndex - Front 2 - 12/19/14 08:41:24 - Yellow
Key
2K
ey 3
Key
4
Key
5K
ey 6
Key
7K
ey 8
Key
9K
ey 1
0K
ey 1
1K
ey
12
Key
13
Key
14
Key
15
Key
16
Key
17
Key
18
Key
19
Key
21
Key
2
0K
ey 2
2
KC
MY
M1
M2
M1
M2
M1
M2
M1
M2
M1
M2
M1
M2
M1
M2
M1
M2
M1
M2
M1
M2
M1
M2
2525
M1
M2
25M
1M
225
2525
50M
1M
2M
1M
250
5050
5050
M1
M2
M1
M2
5075
7575
7575
75G
RA
YG
RA
YG
RA
YG
RA
YG
RA
YK
CM
YK
CM
YK
CM
YK
CM
YK
CM
YK
CM
YY
+M
Y+
CC
+M
KC
MY
KC
MY
KC
MY
KP
CM
YK
CM
YK
CM
YK
CM
YK
CM
YK
CM
YK
CM
YG
RA
YK
CM
YM
1M
2M
1M
2M
1M
2M
1M
275
7575
7575
75G
RA
YG
RA
YK
CM
YK
CM
YK
CM
Y
Key
1
KC
MY
M1
M2
50
Key
23M
1M
2st
arst
arK
CM
Y
Kom
ori/G
AT
F
Par
t No.
K-2
8-6(
D)
1/2/
3/4
K1
2
34
1/2/
3/4
C1
2
34
1/2/
3/4
M1
2
34
1/2/
3/4
M1
1/2/
3/4
Y1
2
34
12
34
1/2/
3/4
M2
12
34

MASSTECH: WHO WE AREThe Massachusetts Technology Collaborative, or MassTech, is an innovative public economic development agency which works to support a vibrant, growing economy across Massachusetts. Through our three major divisions - the InnovationInstitute, Massachusetts eHealth Institute and the Massachusetts Broadband Institute - MassTech is fostering innovation and helping shape a vibrant economy.
We develop meaningful collaborations across industry, academia and government which serve as powerful catalysts, helping turn good ideas into economic opportunity. We accomplish this in three key ways, by:
FOSTERING the growth of dynamic, innovative businesses and industry clusters in the Commonwealth, by accelerating the creation and expansion of firms in technology-growth sectors;
ACCELERATING the use and adoption of technology, by ensuring connectivity statewide and by promoting competitiveness; and
HARNESSING the value of effective insight by supporting and funding impactful research initiatives.
MASSTECH: OUR MISSIONOur mission is to strengthen the innovation economy in Massachusetts, for the purpose of generating more high-paying jobs, higher productivity, greater economic growth and improved social welfare.
THE INNOVATION INSTITUTE AT MASSTECHThe Innovation Institute at MassTech was created in 2003 to improve conditions for growth in the innovation economy by: • Enhancing industry competitiveness; • Promoting conditions which enable growth; and • Providing data and analysis to stakeholders in the Massachusetts innovation economy that promotes understanding and informs policy development.
The Innovation Institute convenes with and invests in academic, research, business, government and civic organizations which share the vision of enhancing the Commonwealth’s innovation economy.
Using an innovative, stakeholder-led process, we have been implementing a “cluster development” approach to economic development. Projects, initiatives and strategic investments in key industry clusters throughout all regions of the Commonwealth are creating conditions for continued economic growth.
Our mission is to strengthen the innovation economy in Massachusetts, for the purpose of generating more high-paying jobs, higher productivity, greater economic growth and improved social welfare. The Institute manages programs which focus on Advanced Manufacturing in the state, driving support for emerging sectors such as Big Data and Robotics and spurring programs which keep talented workers in the Commonwealth, whether through the Intern Partnership program or on entrepreneurship mentoring.
MASSACHUSETTS TECHNOLOGY COLLABORATIVE
235008_MassTech_MTCIndex - Back 2 - 12/19/14 08:41:27 - Black235008_MassTech_MTCIndex - Back 2 - 12/19/14 08:41:27 - Cyan235008_MassTech_MTCIndex - Back 2 - 12/19/14 08:41:27 - Magenta235008_MassTech_MTCIndex - Back 2 - 12/19/14 08:41:27 - Yellow
Key 2
Key 3
Key 4
Key 5
Key 6
Key 7
Key 8
Key 9
Key 10
Key 11
Key 12
Key 13
Key 14
Key 15
Key 16
Key 17
Key 18
Key 19
Key 21
Key 20
Key 22
KC
MY
M1
M2
M1
M2
M1
M2
M1
M2
M1
M2
M1
M2
M1
M2
M1
M2
M1
M2
M1
M2
M1
M2
2525
M1
M2
25M
1M
225
2525
50M
1M
2M
1M
250
5050
5050
M1
M2
M1
M2
5075
7575
7575
75G
RA
YG
RA
YG
RA
YG
RA
YG
RA
YK
CM
YK
CM
YK
CM
YK
CM
YK
CM
YK
CM
YY
+M
Y+
CC
+M
KC
MY
KC
MY
KC
MY
KP
CM
YK
CM
YK
CM
YK
CM
YK
CM
YK
CM
YK
CM
YG
RA
YK
CM
YM
1M
2M
1M
2M
1M
2M
1M
275
7575
7575
75G
RA
YG
RA
YK
CM
YK
CM
YK
CM
Y
Key 1
KC
MY
M1
M2
50
Key 23 M
1M
2star
starK
CM
Y
Kom
ori/GA
TF
P
art No. K
-28-6(D)
1/2/3/4 K1
2
34
1/2/3/4 C1
2
34
1/2/3/4 M1
2
34
1/2/3/4 M1
1/2/3/4 Y1
2
34
12
34
1/2/3/4 M2
12
34
CONTENTS
INTRODUCTION .................................................................................................................................................................................... Highlights ......................................................................................................................................................................................................
10 Year Overview ........................................................................................................................................................................................
Dashboard ....................................................................................................................................................................................................
Leading Technology States (LTS) ..........................................................................................................................................................
SPECIAL ANALYSIS ...............................................................................................................................................................................................
ECONOMIC IMPACT .............................................................................................................................................................................................. Indicator 1: Industry Cluster Employment and Wages ................................................................................................................
Indicator 2: Occupations and Wages .................................................................................................................................................
Indicator 3: Household Income ...........................................................................................................................................................
Indicator 4: Productivity .........................................................................................................................................................................
Indicator 5: Exports ..................................................................................................................................................................................
RESEARCH .................................................................................................................................................................................................................. Indicator 6: Research and Development ..........................................................................................................................................
Indicator 7: Academic Article Output ................................................................................................................................................
Indicator 8: Patenting ..............................................................................................................................................................................
Indicator 9: Technology Patents ...........................................................................................................................................................
TECHNOLOGY DEVELOPMENT .................................................................................................................................................................... Indicator 10: Technology Licensing ....................................................................................................................................................
Indicator 11: SBIR/STTR Awards ...........................................................................................................................................................
BUSINESS DEVELOPMENT ............................................................................................................................................................................... Indicator 12: Business Formation ........................................................................................................................................................
Indicator 13: IPO and M&A .....................................................................................................................................................................
CAPITAL ....................................................................................................................................................................................................................... Indicator 14: Federal Funding for Academic and Health R&D ..................................................................................................
Indicator 15: Industry Funding of Academic Research ...............................................................................................................
Indicator 16: Venture Capital ................................................................................................................................................................
TALENT ......................................................................................................................................................................................................................... Indicator 17: Educational Level of the Workplace .........................................................................................................................
Indicator 18: Education Level of the Workforce .............................................................................................................................
Indicator 19: Public Investment in K-16 ............................................................................................................................................
Indicator 20: STEM Career Choices and Degrees ...........................................................................................................................
Indicator 21: Talent Flow and Attraction ...........................................................................................................................................
Indicator 22: Housing Affordability ....................................................................................................................................................
Indicator 23: Infrastructure ....................................................................................................................................................................
APPENDIX ...................................................................................................................................................................................................................
6
6
8
9
10
12
19
20
22
24
25
26
27
2830
31
32
33
34
35
3738
39
41
42
43
44
46
47
48
49
50
51
52
53
55
MassTech_MTCIndex Sig #2 - Low Folio - Front
MassTech_MTCIndex Sig #3 - Low Folio - Front
MassTech_MTCIndex Sig #4 - Low Folio - Front
MassTech_MTCIndex Sig #5 - Low Folio - Front
235008_MassTech_MTCIndex - Front 2 - 12/19/14 08:41:24 - Black 235008_MassTech_MTCIndex - Front 2 - 12/19/14 08:41:24 - Cyan 235008_MassTech_MTCIndex - Front 2 - 12/19/14 08:41:24 - Magenta 235008_MassTech_MTCIndex - Front 2 - 12/19/14 08:41:24 - Yellow
Key
2K
ey 3
Key
4
Key
5K
ey 6
Key
7K
ey 8
Key
9K
ey 1
0K
ey 1
1K
ey
12
Key
13
Key
14
Key
15
Key
16
Key
17
Key
18
Key
19
Key
21
Key
2
0K
ey 2
2
KC
MY
M1
M2
M1
M2
M1
M2
M1
M2
M1
M2
M1
M2
M1
M2
M1
M2
M1
M2
M1
M2
M1
M2
2525
M1
M2
25M
1M
225
2525
50M
1M
2M
1M
250
5050
5050
M1
M2
M1
M2
5075
7575
7575
75G
RA
YG
RA
YG
RA
YG
RA
YG
RA
YK
CM
YK
CM
YK
CM
YK
CM
YK
CM
YK
CM
YY
+M
Y+
CC
+M
KC
MY
KC
MY
KC
MY
KP
CM
YK
CM
YK
CM
YK
CM
YK
CM
YK
CM
YK
CM
YG
RA
YK
CM
YM
1M
2M
1M
2M
1M
2M
1M
275
7575
7575
75G
RA
YG
RA
YK
CM
YK
CM
YK
CM
Y
Key
1
KC
MY
M1
M2
50
Key
23M
1M
2st
arst
arK
CM
Y
Kom
ori/G
AT
F
Par
t No.
K-2
8-6(
D)
1/2/
3/4
K1
2
34
1/2/
3/4
C1
2
34
1/2/
3/4
M1
2
34
1/2/
3/4
M1
1/2/
3/4
Y1
2
34
12
34
1/2/
3/4
M2
12
34

INTRODUCTION
HIGHLIGHTS
MASSACHUSETTS INNOVATION ECONOMY ANNUAL INDEX INTRODUCTION
ECONOMIC IMPACTMassachusetts sees greater economicimpact from the innovation economy thanany other state. Nearly 38% of the state’sworkforce is employed within an innovation economy sector, a much higher percentage than any other state. Innovation economy wages are typically much higher than average wages and Massachusetts innovation economy employees earn more than their counterparts in the average LTS.Massachusetts output per capita is greater than the LTS average in all 11 sectors.However, wages are stagnant in manysectors and non-innovation economyemployment is growing faster thaninnovation economy employment inMassachusetts and the LTS.
TECHNOLOGY & BUSINESSDEVELOPMENTThe number and value of Small BusinessInnovation and Research/TechnologyTransfer (SBIR/STTR) awards hasdecreased over the last three years. However, Massachusetts remains a clear leader in award dollars as a percentage of GDP, with more than twice the level of the next closest LTS. Massachusetts continues to see strong growth in patents and remains the leader in patents issued per capita. Massachusetts ranks first in patent growth per capita and placed in the top 4 of the LTS in each category of technology patents per capita. Massachusetts’ research institutions and universities have seen sustained growth in revenue from technology licensing and execute more licenses and options than any other LTS.
Massachusetts continues to be one of the most innovative and prosperous states in the country. The Commonwealth’s innovation economy is the largest in the U.S. when measured as a percent of employment and it continues to grow, led by biopharmaceuticals & medical device manufacturing, postsecondary education, software and healthcare. Massachusetts’ innovation economy sectors generally produce more output per capita than their counterparts in the Leading Technology States (LTS) and the Commonwealth’s innovation economy wages have continued to grow in the wake of the recession, even in the face of stagnant household income statewide. Massachusetts continues to perform well above the LTS average in measures of research inputs and outputs and its rate of technology licensing and start-up formation is at the top of the LTS. A highly educated labor force and robust research and development (R&D) environment continue to keep Massachusetts at the leading edge of innovation.
However, you will see in this year’s Index that innovation economy employment is growing slower than employment as whole, a trend that affects the majority of the LTS. In addition, other states are catching up to and even exceeding Massachusetts on key measures. States are becoming more innovative and competition is increasing in areas in which Massachusetts has been historically strong. Though Massachusetts maintains a strong commitment to public K-12 education funding, it has experienced a significant decline in the past 5 years along with most of the LTS. Massachusetts produces more college graduates per capita and has a higher percentage of college educated workers than any other state, but has seen declining high school attainment over the last three years while other states have seen increases. The innovation economy is continually in flux and Massachusetts will need to adapt to shifting trends if it is to maintain its highly competitive position.
235008_MassTech_MTCIndex - Back 2 - 12/19/14 08:41:27 - Black235008_MassTech_MTCIndex - Back 2 - 12/19/14 08:41:27 - Cyan235008_MassTech_MTCIndex - Back 2 - 12/19/14 08:41:27 - Magenta235008_MassTech_MTCIndex - Back 2 - 12/19/14 08:41:27 - Yellow
Key 2
Key 3
Key 4
Key 5
Key 6
Key 7
Key 8
Key 9
Key 10
Key 11
Key 12
Key 13
Key 14
Key 15
Key 16
Key 17
Key 18
Key 19
Key 21
Key 20
Key 22
KC
MY
M1
M2
M1
M2
M1
M2
M1
M2
M1
M2
M1
M2
M1
M2
M1
M2
M1
M2
M1
M2
M1
M2
2525
M1
M2
25M
1M
225
2525
50M
1M
2M
1M
250
5050
5050
M1
M2
M1
M2
5075
7575
7575
75G
RA
YG
RA
YG
RA
YG
RA
YG
RA
YK
CM
YK
CM
YK
CM
YK
CM
YK
CM
YK
CM
YY
+M
Y+
CC
+M
KC
MY
KC
MY
KC
MY
KP
CM
YK
CM
YK
CM
YK
CM
YK
CM
YK
CM
YK
CM
YG
RA
YK
CM
YM
1M
2M
1M
2M
1M
2M
1M
275
7575
7575
75G
RA
YG
RA
YK
CM
YK
CM
YK
CM
Y
Key 1
KC
MY
M1
M2
50
Key 23 M
1M
2star
starK
CM
Y
Kom
ori/GA
TF
P
art No. K
-28-6(D)
1/2/3/4 K1
2
34
1/2/3/4 C1
2
34
1/2/3/4 M1
2
34
1/2/3/4 M1
1/2/3/4 Y1
2
34
12
34
1/2/3/4 M2
12
34
HIGHLIGHTS
MASSACHUSETTS INNOVATION ECONOMY ANNUAL INDEX INTRODUCTION
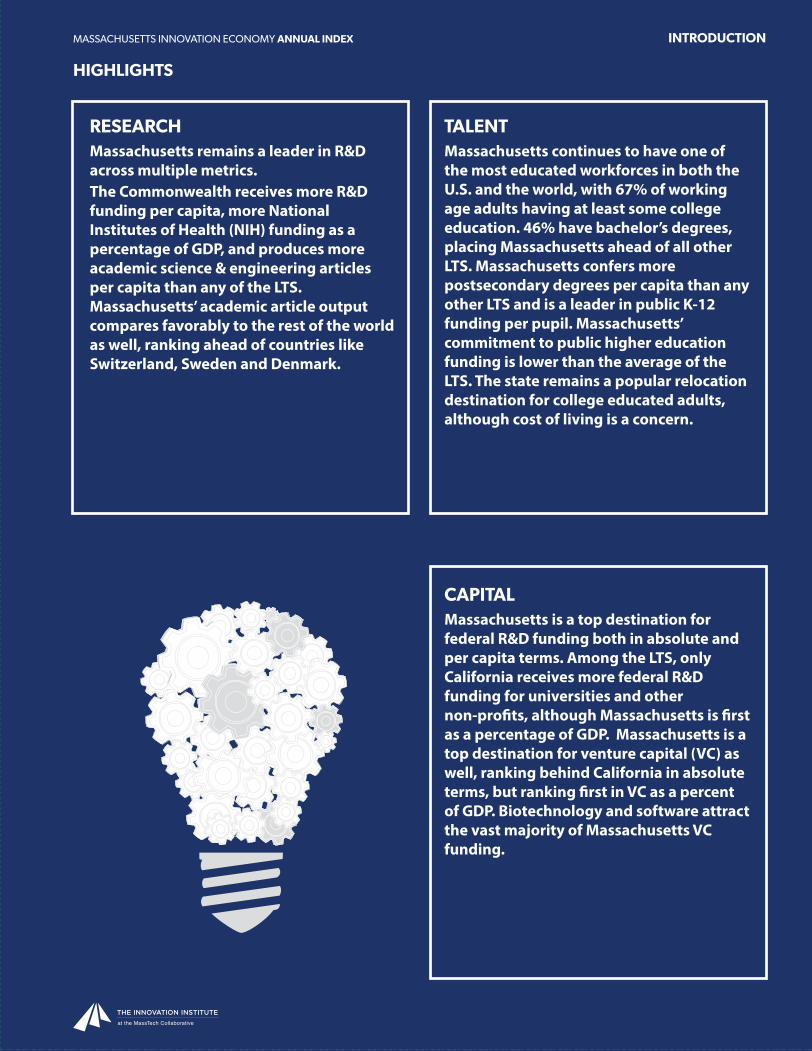
RESEARCHMassachusetts remains a leader in R&Dacross multiple metrics.The Commonwealth receives more R&Dfunding per capita, more National Institutes of Health (NIH) funding as a percentage of GDP, and produces more academic science & engineering articles per capita than any of the LTS. Massachusetts’ academic article output compares favorably to the rest of the world as well, ranking ahead of countries like Switzerland, Sweden and Denmark.
TALENTMassachusetts continues to have one ofthe most educated workforces in both theU.S. and the world, with 67% of working age adults having at least some collegeeducation. 46% have bachelor’s degrees,placing Massachusetts ahead of all otherLTS. Massachusetts confers morepostsecondary degrees per capita than anyother LTS and is a leader in public K-12funding per pupil. Massachusetts’commitment to public higher educationfunding is lower than the average of the LTS. The state remains a popular relocation destination for college educated adults, although cost of living is a concern.
CAPITALMassachusetts is a top destination forfederal R&D funding both in absolute andper capita terms. Among the LTS, onlyCalifornia receives more federal R&Dfunding for universities and othernon-profits, although Massachusetts is first as a percentage of GDP. Massachusetts is a top destination for venture capital (VC) as well, ranking behind California in absolute terms, but ranking first in VC as a percent of GDP. Biotechnology and software attract the vast majority of Massachusetts VC funding.
MassTech_MTCIndex Sig #2 - Low Folio - Front
MassTech_MTCIndex Sig #3 - Low Folio - Front
MassTech_MTCIndex Sig #4 - Low Folio - Front
MassTech_MTCIndex Sig #5 - Low Folio - Front235008_MassTech_MTCIndex - Front 2 - 12/19/14 08:41:24 - Black 235008_MassTech_MTCIndex - Front 2 - 12/19/14 08:41:24 - Cyan 235008_MassTech_MTCIndex - Front 2 - 12/19/14 08:41:24 - Magenta 235008_MassTech_MTCIndex - Front 2 - 12/19/14 08:41:24 - Yellow
Key
2K
ey 3
Key
4
Key
5K
ey 6
Key
7K
ey 8
Key
9K
ey 1
0K
ey 1
1K
ey
12
Key
13
Key
14
Key
15
Key
16
Key
17
Key
18
Key
19
Key
21
Key
2
0K
ey 2
2
KC
MY
M1
M2
M1
M2
M1
M2
M1
M2
M1
M2
M1
M2
M1
M2
M1
M2
M1
M2
M1
M2
M1
M2
2525
M1
M2
25M
1M
225
2525
50M
1M
2M
1M
250
5050
5050
M1
M2
M1
M2
5075
7575
7575
75G
RA
YG
RA
YG
RA
YG
RA
YG
RA
YK
CM
YK
CM
YK
CM
YK
CM
YK
CM
YK
CM
YY
+M
Y+
CC
+M
KC
MY
KC
MY
KC
MY
KP
CM
YK
CM
YK
CM
YK
CM
YK
CM
YK
CM
YK
CM
YG
RA
YK
CM
YM
1M
2M
1M
2M
1M
2M
1M
275
7575
7575
75G
RA
YG
RA
YK
CM
YK
CM
YK
CM
Y
Key
1
KC
MY
M1
M2
50
Key
23M
1M
2st
arst
arK
CM
Y
Kom
ori/G
AT
F
Par
t No.
K-2
8-6(
D)
1/2/
3/4
K1
2
34
1/2/
3/4
C1
2
34
1/2/
3/4
M1
2
34
1/2/
3/4
M1
1/2/
3/4
Y1
2
34
12
34
1/2/
3/4
M2
12
34

MASSACHUSETTS INNOVATION ECONOMY ANNUAL INDEX
8
10 YEAR OVERVIEW
Between the publication of the 2004 and 2014 editions of the Index of the Innovation Economy, the United States experienced a subprime mortgage crisis and one of the worst recessions in modern history: a recession that resulted in numerous, fundamental economic changes, including the bailout of multiple financial institutions. While Massachusetts was not as impacted by the recession as negatively as the nation as a whole, its recovery has been slow as we are only now experiencing new economic growth. By reviewing the 2004 Index and comparing it to the 2014 Index, we are bookending this recession by providing a brief before-and-after review. One of the most troubling aspects of the recession still lingering today is the decline in household income. In 2003, the median household income was $50,976 ($64,536 in 2013 dollars), while in 2013 the median household income was $66,768. On the surface this seems like a slow but steady increase over the course of a decade. However, considering that median household income peaked at $70,760 ($76,831 in 2013 dollars) in 2008, Massachusetts residents are still making less money than before the recession. Another indicator of the overall economic impact on Massachusetts residents from this recession is tied to real estate values which were severely impacted by the recession. In 2003, the median price of a single-family home in Massachusetts was $295,000. As of September 2014, this figure had jumped to $333,250 after plummeting to $266,000 in March of 2009, the low-point of the housing crisis in Massachusetts.Another key improvement over the past decade is a turnaround in migration, an indicator of a region’s attractiveness. Out-migration had reached a low point in 2003 with its largest total in over a decade. This situation has changed dramatically as Massachusetts currently experiences positive net migration (28,500 in 2013) at the highest rate recorded in the past decade, entirely as a result of international migration. Domestic outmigration is still an issue (2,800 in 2013) although it is much lower than it was in 2004 when Massachusetts lost a net 55,000 residents to other states. The 2004 Index reported a total employment within the Innovation Economy of 775,000. The 2014 Index reports Innovation Economy employment of 1,231,000. While these numbers aren’t strictly comparable since our definition has evolved over time and NAICS codes have been added or eliminated by the Census Bureau, some impressive growth has still occurred. Healthcare Delivery was not part of the Innovation Economy in 2004 as it is now. Massachusetts’ 357,000 Healthcare Delivery workers make up a large part of the difference between the 2003 and 2013 Innovation Economy employment totals. Even factoring in the addition of Healthcare Delivery, the Innovation Economy has created around 100,000 jobs in Massachusetts since 2003. This comes despite the hangover from the bursting of the dot-com bubble in the early 2000’s and one of the worst recessions in U.S. history. The state’s economy as a whole has only gained around 29,000 jobs over that period, meaning that without the Innovation Economy, there would be fewer jobs in Massachusetts than there were in 2003.
INTRODUCTION
235008_MassTech_MTCIndex - Back 2 - 12/19/14 08:41:27 - Black235008_MassTech_MTCIndex - Back 2 - 12/19/14 08:41:27 - Cyan235008_MassTech_MTCIndex - Back 2 - 12/19/14 08:41:27 - Magenta235008_MassTech_MTCIndex - Back 2 - 12/19/14 08:41:27 - Yellow
Key 2
Key 3
Key 4
Key 5
Key 6
Key 7
Key 8
Key 9
Key 10
Key 11
Key 12
Key 13
Key 14
Key 15
Key 16
Key 17
Key 18
Key 19
Key 21
Key 20
Key 22
KC
MY
M1
M2
M1
M2
M1
M2
M1
M2
M1
M2
M1
M2
M1
M2
M1
M2
M1
M2
M1
M2
M1
M2
2525
M1
M2
25M
1M
225
2525
50M
1M
2M
1M
250
5050
5050
M1
M2
M1
M2
5075
7575
7575
75G
RA
YG
RA
YG
RA
YG
RA
YG
RA
YK
CM
YK
CM
YK
CM
YK
CM
YK
CM
YK
CM
YY
+M
Y+
CC
+M
KC
MY
KC
MY
KC
MY
KP
CM
YK
CM
YK
CM
YK
CM
YK
CM
YK
CM
YK
CM
YG
RA
YK
CM
YM
1M
2M
1M
2M
1M
2M
1M
275
7575
7575
75G
RA
YG
RA
YK
CM
YK
CM
YK
CM
Y
Key 1
KC
MY
M1
M2
50
Key 23 M
1M
2star
starK
CM
Y
Kom
ori/GA
TF
P
art No. K
-28-6(D)
1/2/3/4 K1
2
34
1/2/3/4 C1
2
34
1/2/3/4 M1
2
34
1/2/3/4 M1
1/2/3/4 Y1
2
34
12
34
1/2/3/4 M2
12
34
MASSACHUSETTS INNOVATION ECONOMY ANNUAL INDEX
9
INTRODUCTION
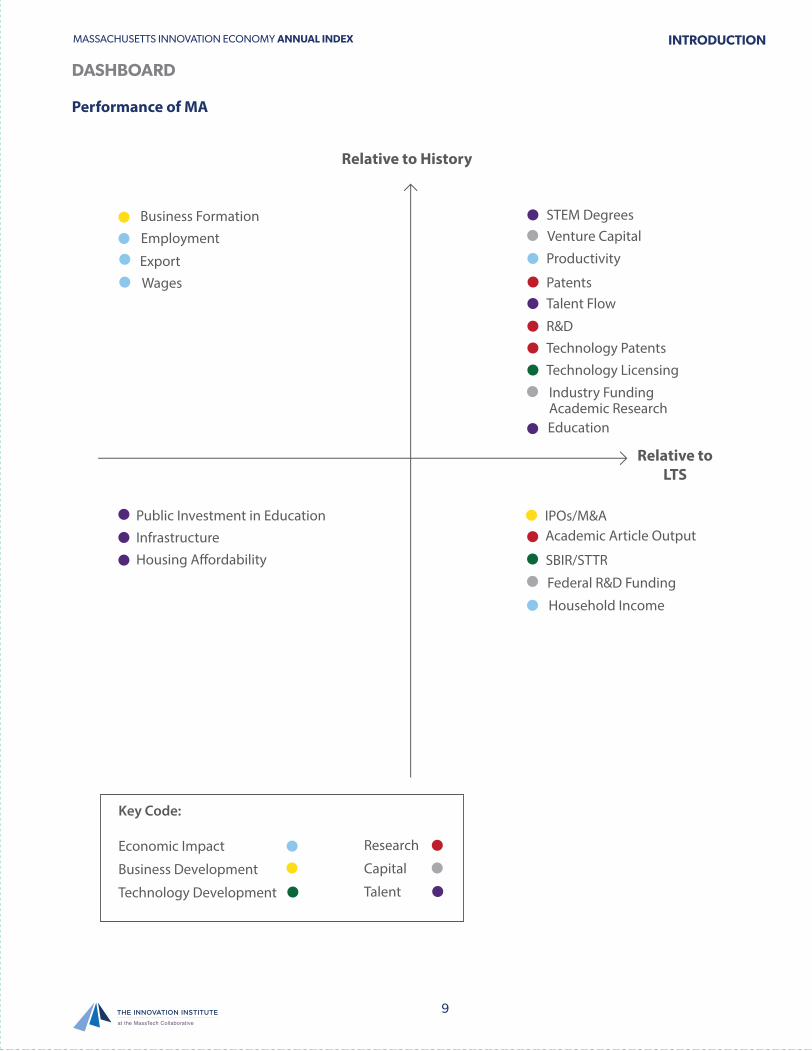
DASHBOARD
Performance of MA
IPOs/M&A
Business Formation
Patents
R&D Technology PatentsTechnology Licensing
Academic Article OutputPublic Investment in EducationInfrastructureHousing A�ordability
Productivity
STEM Degrees
Talent Flow
Education
Venture Capital
Industry FundingAcademic Research
Federal R&D Funding
Household Income
Employment
ExportWages
Relative to LTS
Relative to History
SBIR/STTR
Key Code:
Economic Impact
Business Development
Technology Development
Research
Capital
Talent
MassTech_MTCIndex Sig #2 - Low Folio - Front
MassTech_MTCIndex Sig #3 - Low Folio - Front
MassTech_MTCIndex Sig #4 - Low Folio - Front
MassTech_MTCIndex Sig #5 - Low Folio - Front
235008_MassTech_MTCIndex - Front 2 - 12/19/14 08:41:24 - Black 235008_MassTech_MTCIndex - Front 2 - 12/19/14 08:41:24 - Cyan 235008_MassTech_MTCIndex - Front 2 - 12/19/14 08:41:24 - Magenta 235008_MassTech_MTCIndex - Front 2 - 12/19/14 08:41:24 - Yellow
Key
2K
ey 3
Key
4
Key
5K
ey 6
Key
7K
ey 8
Key
9K
ey 1
0K
ey 1
1K
ey
12
Key
13
Key
14
Key
15
Key
16
Key
17
Key
18
Key
19
Key
21
Key
2
0K
ey 2
2
KC
MY
M1
M2
M1
M2
M1
M2
M1
M2
M1
M2
M1
M2
M1
M2
M1
M2
M1
M2
M1
M2
M1
M2
2525
M1
M2
25M
1M
225
2525
50M
1M
2M
1M
250
5050
5050
M1
M2
M1
M2
5075
7575
7575
75G
RA
YG
RA
YG
RA
YG
RA
YG
RA
YK
CM
YK
CM
YK
CM
YK
CM
YK
CM
YK
CM
YY
+M
Y+
CC
+M
KC
MY
KC
MY
KC
MY
KP
CM
YK
CM
YK
CM
YK
CM
YK
CM
YK
CM
YK
CM
YG
RA
YK
CM
YM
1M
2M
1M
2M
1M
2M
1M
275
7575
7575
75G
RA
YG
RA
YK
CM
YK
CM
YK
CM
Y
Key
1
KC
MY
M1
M2
50
Key
23M
1M
2st
arst
arK
CM
Y
Kom
ori/G
AT
F
Par
t No.
K-2
8-6(
D)
1/2/
3/4
K1
2
34
1/2/
3/4
C1
2
34
1/2/
3/4
M1
2
34
1/2/
3/4
M1
1/2/
3/4
Y1
2
34
12
34
1/2/
3/4
M2
12
34
MASSACHUSETTS INNOVATION ECONOMY ANNUAL INDEX
10
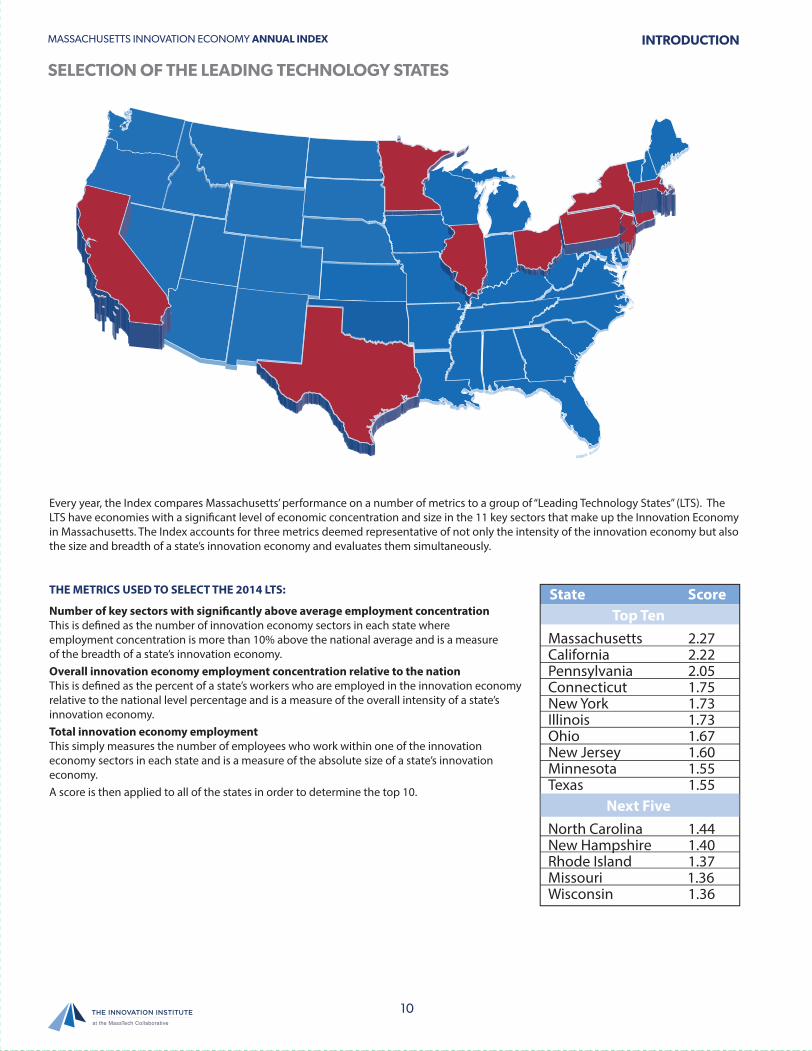
Every year, the Index compares Massachusetts’ performance on a number of metrics to a group of “Leading Technology States” (LTS). The LTS have economies with a significant level of economic concentration and size in the 11 key sectors that make up the Innovation Economy in Massachusetts. The Index accounts for three metrics deemed representative of not only the intensity of the innovation economy but also the size and breadth of a state’s innovation economy and evaluates them simultaneously.
THE METRICS USED TO SELECT THE 2014 LTS:
Number of key sectors with significantly above average employment concentrationThis is defined as the number of innovation economy sectors in each state where employment concentration is more than 10% above the national average and is a measure of the breadth of a state’s innovation economy. Overall innovation economy employment concentration relative to the nationThis is defined as the percent of a state’s workers who are employed in the innovation economy relative to the national level percentage and is a measure of the overall intensity of a state’s innovation economy.Total innovation economy employmentThis simply measures the number of employees who work within one of the innovation economy sectors in each state and is a measure of the absolute size of a state’s innovation economy. A score is then applied to all of the states in order to determine the top 10.
SELECTION OF THE LEADING TECHNOLOGY STATES
INTRODUCTION
State ScoreTop Ten
Massachusetts 2.27 California 2.22Pennsylvania 2.05Connecticut 1.75New York 1.73Illinois 1.73 Ohio 1.67New Jersey 1.60Minnesota 1.55Texas 1.55
North Carolina 1.44New Hampshire 1.40Rhode Island 1.37Missouri 1.36Wisconsin 1.36
Next Five
235008_MassTech_MTCIndex - Back 2 - 12/19/14 08:41:27 - Black235008_MassTech_MTCIndex - Back 2 - 12/19/14 08:41:27 - Cyan235008_MassTech_MTCIndex - Back 2 - 12/19/14 08:41:27 - Magenta235008_MassTech_MTCIndex - Back 2 - 12/19/14 08:41:27 - YellowK
ey 2K
ey 3K
ey 4K
ey 5K
ey 6K
ey 7K
ey 8K
ey 9K
ey 10K
ey 11K
ey 12K
ey 13K
ey 14K
ey 15K
ey 16K
ey 17K
ey 18K
ey 19K
ey 21K
ey 20K
ey 22
KC
MY
M1
M2
M1
M2
M1
M2
M1
M2
M1
M2
M1
M2
M1
M2
M1
M2
M1
M2
M1
M2
M1
M2
2525
M1
M2
25M
1M
225
2525
50M
1M
2M
1M
250
5050
5050
M1
M2
M1
M2
5075
7575
7575
75G
RA
YG
RA
YG
RA
YG
RA
YG
RA
YK
CM
YK
CM
YK
CM
YK
CM
YK
CM
YK
CM
YY
+M
Y+
CC
+M
KC
MY
KC
MY
KC
MY
KP
CM
YK
CM
YK
CM
YK
CM
YK
CM
YK
CM
YK
CM
YG
RA
YK
CM
YM
1M
2M
1M
2M
1M
2M
1M
275
7575
7575
75G
RA
YG
RA
YK
CM
YK
CM
YK
CM
Y
Key 1
KC
MY
M1
M2
50
Key 23 M
1M
2star
starK
CM
Y
Kom
ori/GA
TF
P
art No. K
-28-6(D)
1/2/3/4 K1
2
34
1/2/3/4 C1
2
34
1/2/3/4 M1
2
34
1/2/3/4 M1
1/2/3/4 Y1
2
34
12
34
1/2/3/4 M2
12
34

MASSACHUSETTS INNOVATION ECONOMY ANNUAL INDEX
11
LEADING TECHNOLOGY STATES (LTS)
INTRODUCTION
CALIFORNIA: California is a leader in 5 of the 11 sectors used to define the innovation economy and easily has the highest number of innovation economy employees, despite having a slightly below average overall concentration of employees. California contains both San Francisco and Silicon Valley, home to well-known companies such as Google, Apple and Facebook in addition to a robust start-up community. California is also home to top research universities such as Cal Tech, Stanford, UC Berkley and UCLA.
CONNECTICUT: Despite its small size, Connecticut is a leader in 6 of 11 key sectors and has the second highest overall concentration of innovation economy employees. The state’s defense, financial services, and diversified industrial manufacturing industries are particularly strong, represented by companies such as Pratt & Whitney, The Hartford Insurance and United Technologies. Connecticut is also home to numerous top-tier colleges and universities including Yale and the University of Connecticut.
ILLINOIS: Illinois is a leader in 5 of 11 key sectors, has a relatively large number of innovation economy employees, and an above average overall innovation economy employment concentration. Illinois is particularly strong in manufacturing (John Deere & Caterpillar) and financial services (Chicago Mercantile Exchange) and is home to well-known universities and colleges including Northwestern University, University of Chicago and University of Illinois.
MASSACHUSETTS: Massachusetts is a leader in 8 of the 11 sectors used to define the innovation economy and has the highest overall concentration of innovation economy employees. Massachusetts is home to a large concentration of research institutions, biotech firms, and software firms. In addition to a diverse array of start-ups, Massachusetts is home to the headquarters or major operations of State Street Bank, EMC, Microsoft, Genzyme, Cisco and Raytheon. The state is home to many universities, colleges and research institutions including Harvard, Massachusetts Institute of Technology (MIT), Tufts and the University of Massachusetts system.
MINNESOTA: Despite its relatively small population, Minnesota is a leader in 5 of 11 key sectors and has a high concentration of innovation economy employees. The state is particularly strong in biopharma & medical devices, manufacturing and financial services. Representative companies include the Mayo Clinic, Medtronic, 3M and U.S. Bancorp.
NEW JERSEY: New Jersey is a leader in 5 of 11 key sectors and has an above average employment concentration. The state is home to many pharmaceutical companies and their R&D facilities and has strong financial services and software industries. The state is also home to many universities and colleges including Princeton, Rutgers and Stevens Institute of Technology.
NEW YORK: New York has a large number of innovation economy employees, a high overall employment concentration, and is a leader in 3 of 11 sectors that make up the innovation economy. As the home of Wall Street, the state’s financial services sector is particularly strong. New York is also a leader in postsecondary education with universities such as Cornell, Columbia, Syracuse University, New York University and the State University of New York system.
OHIO: Ohio is a leader in 5 of the 11 key sectors, has a relatively large number of innovation economy employees, and has an above-average innovation economy employment concentration. Ohio’s strengths lie in manufacturing, business services and healthcare delivery, represented by companies such as GE Aviation and Cleveland Clinic. The state is also home to many universities including Ohio State and Case Western Reserve.
PENNSYLVANIA: Pennsylvania is a leader in 7 of the 11 sectors used to define the innovation economy, in addition to a large number of innovation economy employees and a high overall employment concentration. Companies representative of Pennsylvania’s diversity within the innovation economy include PNC Financial, GE Transportation Systems, Comcast and Wyeth Pharmaceuticals. Pennsylvania is home to many research universities including Penn State, Carnegie Mellon, University of Pennsylvania and University of Pittsburgh.
TEXAS: While Texas is a leader in only 2 key sectors, it has the second highest number of innovation economy employees. Texas’ strengths lie in computer & communications hardware and defense, and is home to companies including Dell, Texas Instruments and NASA’s Johnson Space Center. The state is also home to research universities including Rice, University of Houston and University of Texas.
MassTech_MTCIndex Sig #6 - Low Folio - Front
MassTech_MTCIndex Sig #7 - Low Folio - Front
MassTech_MTCIndex Sig #8 - Low Folio - Front
MassTech_MTCIndex Sig #9 - Low Folio - Front235008_MassTech_MTCIndex - Front 3 - 12/19/14 08:41:31 - Black 235008_MassTech_MTCIndex - Front 3 - 12/19/14 08:41:31 - Cyan 235008_MassTech_MTCIndex - Front 3 - 12/19/14 08:41:31 - Magenta 235008_MassTech_MTCIndex - Front 3 - 12/19/14 08:41:31 - Yellow
Key
2K
ey 3
Key
4
Key
5K
ey 6
Key
7K
ey 8
Key
9K
ey 1
0K
ey 1
1K
ey
12
Key
13
Key
14
Key
15
Key
16
Key
17
Key
18
Key
19
Key
21
Key
2
0K
ey 2
2
KC
MY
M1
M2
M1
M2
M1
M2
M1
M2
M1
M2
M1
M2
M1
M2
M1
M2
M1
M2
M1
M2
M1
M2
2525
M1
M2
25M
1M
225
2525
50M
1M
2M
1M
250
5050
5050
M1
M2
M1
M2
5075
7575
7575
75G
RA
YG
RA
YG
RA
YG
RA
YG
RA
YK
CM
YK
CM
YK
CM
YK
CM
YK
CM
YK
CM
YY
+M
Y+
CC
+M
KC
MY
KC
MY
KC
MY
KP
CM
YK
CM
YK
CM
YK
CM
YK
CM
YK
CM
YK
CM
YG
RA
YK
CM
YM
1M
2M
1M
2M
1M
2M
1M
275
7575
7575
75G
RA
YG
RA
YK
CM
YK
CM
YK
CM
Y
Key
1
KC
MY
M1
M2
50
Key
23M
1M
2st
arst
arK
CM
Y
Kom
ori/G
AT
F
Par
t No.
K-2
8-6(
D)
1/2/
3/4
K1
2
34
1/2/
3/4
C1
2
34
1/2/
3/4
M1
2
34
1/2/
3/4
M1
1/2/
3/4
Y1
2
34
12
34
1/2/
3/4
M2
12
34
MASSACHUSETTS INNOVATION ECONOMY ANNUAL INDEX
12
SPECIAL ANALYSIS
INTRODUCTION
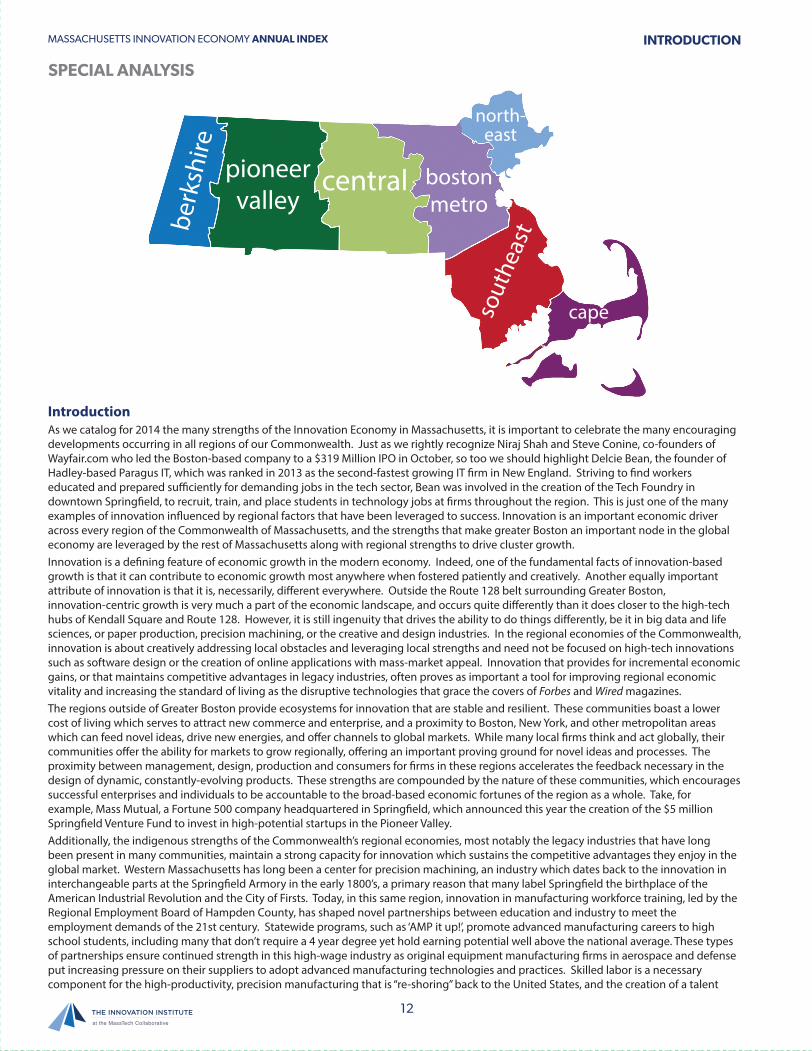
IntroductionAs we catalog for 2014 the many strengths of the Innovation Economy in Massachusetts, it is important to celebrate the many encouraging developments occurring in all regions of our Commonwealth. Just as we rightly recognize Niraj Shah and Steve Conine, co-founders of Wayfair.com who led the Boston-based company to a $319 Million IPO in October, so too we should highlight Delcie Bean, the founder of Hadley-based Paragus IT, which was ranked in 2013 as the second-fastest growing IT firm in New England. Striving to find workers educated and prepared sufficiently for demanding jobs in the tech sector, Bean was involved in the creation of the Tech Foundry in downtown Springfield, to recruit, train, and place students in technology jobs at firms throughout the region. This is just one of the many examples of innovation influenced by regional factors that have been leveraged to success. Innovation is an important economic driver across every region of the Commonwealth of Massachusetts, and the strengths that make greater Boston an important node in the global economy are leveraged by the rest of Massachusetts along with regional strengths to drive cluster growth. Innovation is a defining feature of economic growth in the modern economy. Indeed, one of the fundamental facts of innovation-based growth is that it can contribute to economic growth most anywhere when fostered patiently and creatively. Another equally important attribute of innovation is that it is, necessarily, different everywhere. Outside the Route 128 belt surrounding Greater Boston, innovation-centric growth is very much a part of the economic landscape, and occurs quite differently than it does closer to the high-tech hubs of Kendall Square and Route 128. However, it is still ingenuity that drives the ability to do things differently, be it in big data and life sciences, or paper production, precision machining, or the creative and design industries. In the regional economies of the Commonwealth, innovation is about creatively addressing local obstacles and leveraging local strengths and need not be focused on high-tech innovations such as software design or the creation of online applications with mass-market appeal. Innovation that provides for incremental economic gains, or that maintains competitive advantages in legacy industries, often proves as important a tool for improving regional economic vitality and increasing the standard of living as the disruptive technologies that grace the covers of Forbes and Wired magazines.The regions outside of Greater Boston provide ecosystems for innovation that are stable and resilient. These communities boast a lower cost of living which serves to attract new commerce and enterprise, and a proximity to Boston, New York, and other metropolitan areas which can feed novel ideas, drive new energies, and offer channels to global markets. While many local firms think and act globally, their communities offer the ability for markets to grow regionally, offering an important proving ground for novel ideas and processes. The proximity between management, design, production and consumers for firms in these regions accelerates the feedback necessary in the design of dynamic, constantly-evolving products. These strengths are compounded by the nature of these communities, which encourages successful enterprises and individuals to be accountable to the broad-based economic fortunes of the region as a whole. Take, for example, Mass Mutual, a Fortune 500 company headquartered in Springfield, which announced this year the creation of the $5 million Springfield Venture Fund to invest in high-potential startups in the Pioneer Valley.Additionally, the indigenous strengths of the Commonwealth’s regional economies, most notably the legacy industries that have long been present in many communities, maintain a strong capacity for innovation which sustains the competitive advantages they enjoy in the global market. Western Massachusetts has long been a center for precision machining, an industry which dates back to the innovation in interchangeable parts at the Springfield Armory in the early 1800’s, a primary reason that many label Springfield the birthplace of the American Industrial Revolution and the City of Firsts. Today, in this same region, innovation in manufacturing workforce training, led by the Regional Employment Board of Hampden County, has shaped novel partnerships between education and industry to meet the employment demands of the 21st century. Statewide programs, such as ‘AMP it up!’, promote advanced manufacturing careers to high school students, including many that don’t require a 4 year degree yet hold earning potential well above the national average. These types of partnerships ensure continued strength in this high-wage industry as original equipment manufacturing firms in aerospace and defense put increasing pressure on their suppliers to adopt advanced manufacturing technologies and practices. Skilled labor is a necessary component for the high-productivity, precision manufacturing that is “re-shoring” back to the United States, and the creation of a talent
235008_MassTech_MTCIndex - Back 3 - 12/19/14 08:41:33 - Black235008_MassTech_MTCIndex - Back 3 - 12/19/14 08:41:33 - Cyan235008_MassTech_MTCIndex - Back 3 - 12/19/14 08:41:33 - Magenta235008_MassTech_MTCIndex - Back 3 - 12/19/14 08:41:33 - Yellow
Key 2
Key 3
Key 4
Key 5
Key 6
Key 7
Key 8
Key 9
Key 10
Key 11
Key 12
Key 13
Key 14
Key 15
Key 16
Key 17
Key 18
Key 19
Key 21
Key 20
Key 22
KC
MY
M1
M2
M1
M2
M1
M2
M1
M2
M1
M2
M1
M2
M1
M2
M1
M2
M1
M2
M1
M2
M1
M2
2525
M1
M2
25M
1M
225
2525
50M
1M
2M
1M
250
5050
5050
M1
M2
M1
M2
5075
7575
7575
75G
RA
YG
RA
YG
RA
YG
RA
YG
RA
YK
CM
YK
CM
YK
CM
YK
CM
YK
CM
YK
CM
YY
+M
Y+
CC
+M
KC
MY
KC
MY
KC
MY
KP
CM
YK
CM
YK
CM
YK
CM
YK
CM
YK
CM
YK
CM
YG
RA
YK
CM
YM
1M
2M
1M
2M
1M
2M
1M
275
7575
7575
75G
RA
YG
RA
YK
CM
YK
CM
YK
CM
Y
Key 1
KC
MY
M1
M2
50
Key 23 M
1M
2star
starK
CM
Y
Kom
ori/GA
TF
P
art No. K
-28-6(D)
1/2/3/4 K1
2
34
1/2/3/4 C1
2
34
1/2/3/4 M1
2
34
1/2/3/4 M1
1/2/3/4 Y1
2
34
12
34
1/2/3/4 M2
12
34
MASSACHUSETTS INNOVATION ECONOMY ANNUAL INDEX
13
SPECIAL ANALYSIS
INTRODUCTION
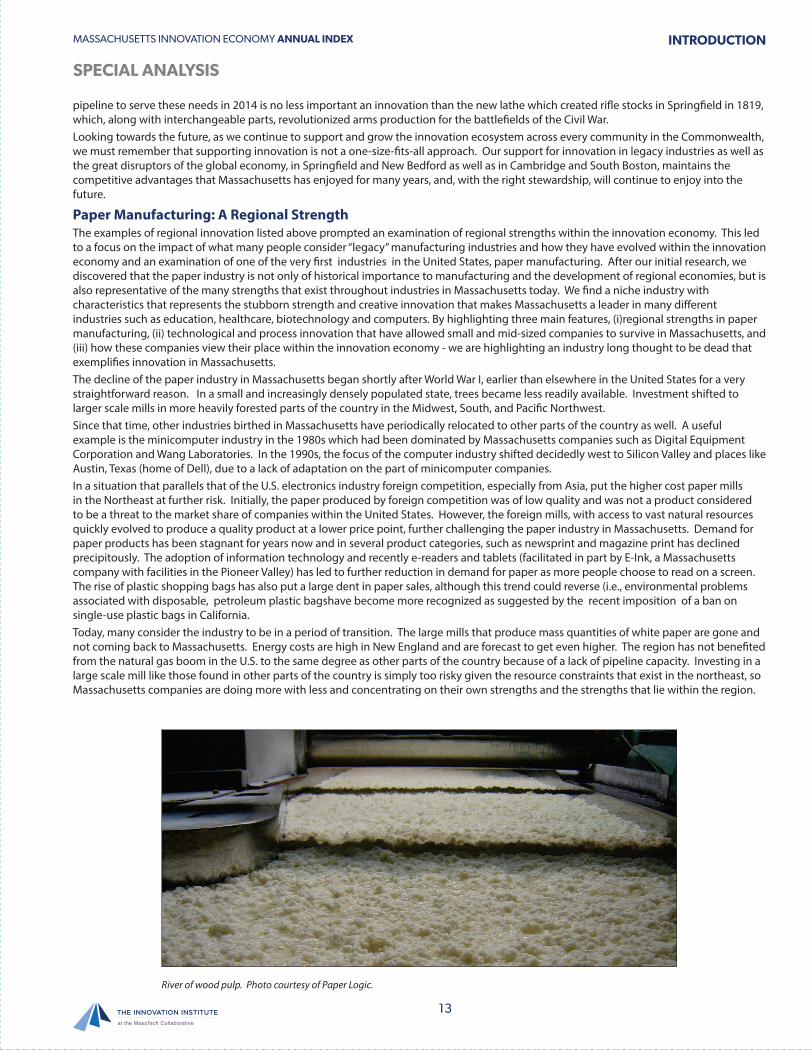
River of wood pulp. Photo courtesy of Paper Logic.
pipeline to serve these needs in 2014 is no less important an innovation than the new lathe which created rifle stocks in Springfield in 1819, which, along with interchangeable parts, revolutionized arms production for the battlefields of the Civil War. Looking towards the future, as we continue to support and grow the innovation ecosystem across every community in the Commonwealth, we must remember that supporting innovation is not a one-size-fits-all approach. Our support for innovation in legacy industries as well as the great disruptors of the global economy, in Springfield and New Bedford as well as in Cambridge and South Boston, maintains the competitive advantages that Massachusetts has enjoyed for many years, and, with the right stewardship, will continue to enjoy into the future.
Paper Manufacturing: A Regional StrengthThe examples of regional innovation listed above prompted an examination of regional strengths within the innovation economy. This led to a focus on the impact of what many people consider “legacy” manufacturing industries and how they have evolved within the innovation economy and an examination of one of the very first industries in the United States, paper manufacturing. After our initial research, we discovered that the paper industry is not only of historical importance to manufacturing and the development of regional economies, but is also representative of the many strengths that exist throughout industries in Massachusetts today. We find a niche industry with characteristics that represents the stubborn strength and creative innovation that makes Massachusetts a leader in many different industries such as education, healthcare, biotechnology and computers. By highlighting three main features, (i)regional strengths in paper manufacturing, (ii) technological and process innovation that have allowed small and mid-sized companies to survive in Massachusetts, and (iii) how these companies view their place within the innovation economy - we are highlighting an industry long thought to be dead that exemplifies innovation in Massachusetts.The decline of the paper industry in Massachusetts began shortly after World War I, earlier than elsewhere in the United States for a very straightforward reason. In a small and increasingly densely populated state, trees became less readily available. Investment shifted to larger scale mills in more heavily forested parts of the country in the Midwest, South, and Pacific Northwest. Since that time, other industries birthed in Massachusetts have periodically relocated to other parts of the country as well. A useful example is the minicomputer industry in the 1980s which had been dominated by Massachusetts companies such as Digital Equipment Corporation and Wang Laboratories. In the 1990s, the focus of the computer industry shifted decidedly west to Silicon Valley and places like Austin, Texas (home of Dell), due to a lack of adaptation on the part of minicomputer companies. In a situation that parallels that of the U.S. electronics industry foreign competition, especially from Asia, put the higher cost paper mills in the Northeast at further risk. Initially, the paper produced by foreign competition was of low quality and was not a product considered to be a threat to the market share of companies within the United States. However, the foreign mills, with access to vast natural resources quickly evolved to produce a quality product at a lower price point, further challenging the paper industry in Massachusetts. Demand for paper products has been stagnant for years now and in several product categories, such as newsprint and magazine print has declined precipitously. The adoption of information technology and recently e-readers and tablets (facilitated in part by E-Ink, a Massachusetts company with facilities in the Pioneer Valley) has led to further reduction in demand for paper as more people choose to read on a screen. The rise of plastic shopping bags has also put a large dent in paper sales, although this trend could reverse (i.e., environmental problems associated with disposable, petroleum plastic bagshave become more recognized as suggested by the recent imposition of a ban on single-use plastic bags in California.Today, many consider the industry to be in a period of transition. The large mills that produce mass quantities of white paper are gone and not coming back to Massachusetts. Energy costs are high in New England and are forecast to get even higher. The region has not benefited from the natural gas boom in the U.S. to the same degree as other parts of the country because of a lack of pipeline capacity. Investing in a large scale mill like those found in other parts of the country is simply too risky given the resource constraints that exist in the northeast, so Massachusetts companies are doing more with less and concentrating on their own strengths and the strengths that lie within the region.
MassTech_MTCIndex Sig #6 - Low Folio - Front
MassTech_MTCIndex Sig #7 - Low Folio - Front
MassTech_MTCIndex Sig #8 - Low Folio - Front
MassTech_MTCIndex Sig #9 - Low Folio - Front
235008_MassTech_MTCIndex - Front 3 - 12/19/14 08:41:31 - Black 235008_MassTech_MTCIndex - Front 3 - 12/19/14 08:41:31 - Cyan 235008_MassTech_MTCIndex - Front 3 - 12/19/14 08:41:31 - Magenta 235008_MassTech_MTCIndex - Front 3 - 12/19/14 08:41:31 - Yellow
Key
2K
ey 3
Key
4
Key
5K
ey 6
Key
7K
ey 8
Key
9K
ey 1
0K
ey 1
1K
ey
12
Key
13
Key
14
Key
15
Key
16
Key
17
Key
18
Key
19
Key
21
Key
2
0K
ey 2
2
KC
MY
M1
M2
M1
M2
M1
M2
M1
M2
M1
M2
M1
M2
M1
M2
M1
M2
M1
M2
M1
M2
M1
M2
2525
M1
M2
25M
1M
225
2525
50M
1M
2M
1M
250
5050
5050
M1
M2
M1
M2
5075
7575
7575
75G
RA
YG
RA
YG
RA
YG
RA
YG
RA
YK
CM
YK
CM
YK
CM
YK
CM
YK
CM
YK
CM
YY
+M
Y+
CC
+M
KC
MY
KC
MY
KC
MY
KP
CM
YK
CM
YK
CM
YK
CM
YK
CM
YK
CM
YK
CM
YG
RA
YK
CM
YM
1M
2M
1M
2M
1M
2M
1M
275
7575
7575
75G
RA
YG
RA
YK
CM
YK
CM
YK
CM
Y
Key
1
KC
MY
M1
M2
50
Key
23M
1M
2st
arst
arK
CM
Y
Kom
ori/G
AT
F
Par
t No.
K-2
8-6(
D)
1/2/
3/4
K1
2
34
1/2/
3/4
C1
2
34
1/2/
3/4
M1
2
34
1/2/
3/4
M1
1/2/
3/4
Y1
2
34
12
34
1/2/
3/4
M2
12
34
MASSACHUSETTS INNOVATION ECONOMY ANNUAL INDEX
14
SPECIAL ANALYSIS
INTRODUCTION
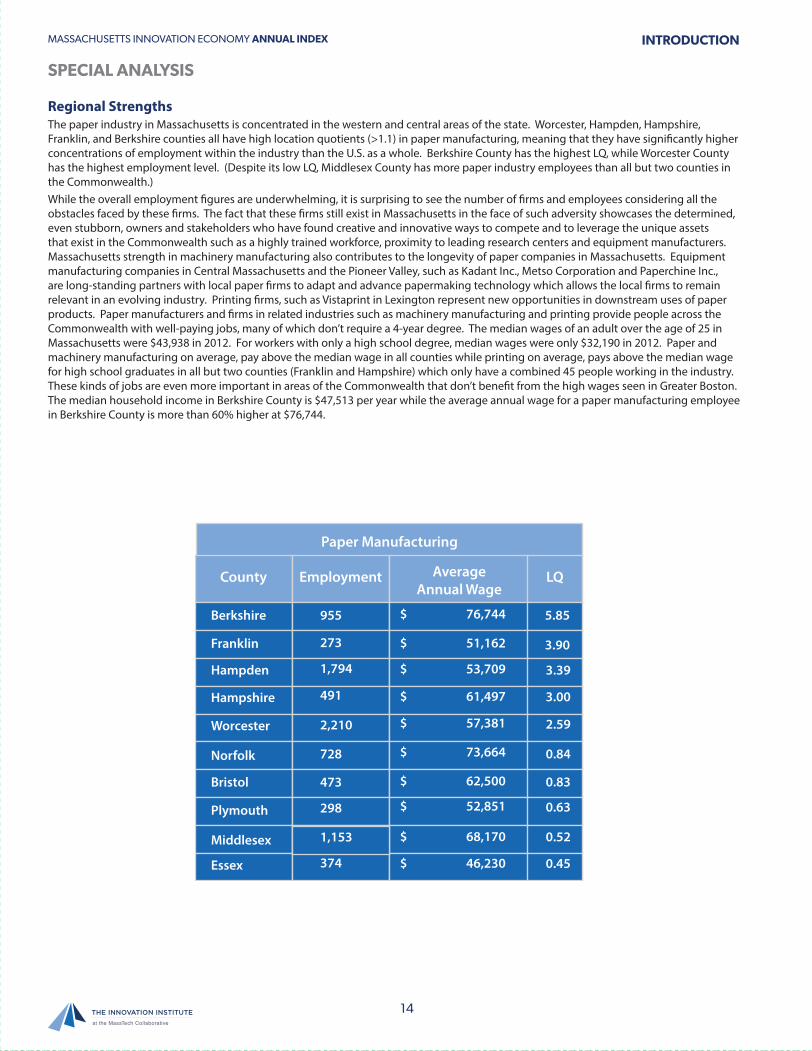
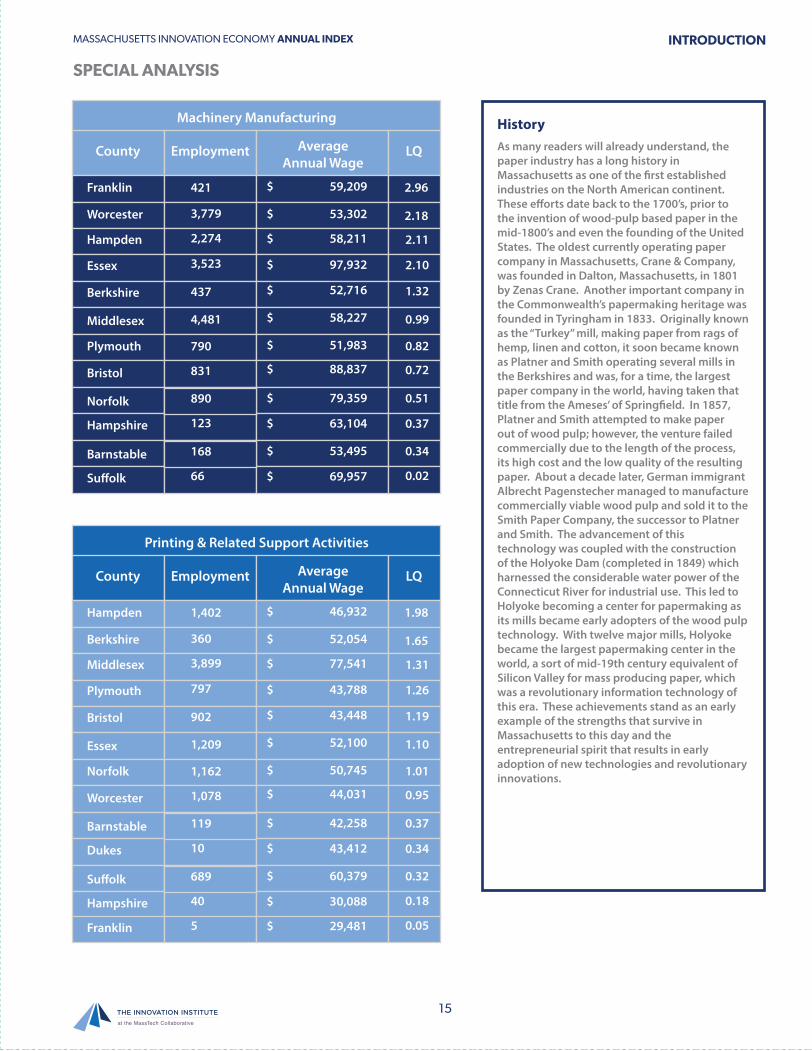
Regional Strengths The paper industry in Massachusetts is concentrated in the western and central areas of the state. Worcester, Hampden, Hampshire, Franklin, and Berkshire counties all have high location quotients (>1.1) in paper manufacturing, meaning that they have significantly higher concentrations of employment within the industry than the U.S. as a whole. Berkshire County has the highest LQ, while Worcester County has the highest employment level. (Despite its low LQ, Middlesex County has more paper industry employees than all but two counties in the Commonwealth.)While the overall employment figures are underwhelming, it is surprising to see the number of firms and employees considering all the obstacles faced by these firms. The fact that these firms still exist in Massachusetts in the face of such adversity showcases the determined, even stubborn, owners and stakeholders who have found creative and innovative ways to compete and to leverage the unique assets that exist in the Commonwealth such as a highly trained workforce, proximity to leading research centers and equipment manufacturers. Massachusetts strength in machinery manufacturing also contributes to the longevity of paper companies in Massachusetts. Equipment manufacturing companies in Central Massachusetts and the Pioneer Valley, such as Kadant Inc., Metso Corporation and Paperchine Inc., are long-standing partners with local paper firms to adapt and advance papermaking technology which allows the local firms to remain relevant in an evolving industry. Printing firms, such as Vistaprint in Lexington represent new opportunities in downstream uses of paper products. Paper manufacturers and firms in related industries such as machinery manufacturing and printing provide people across the Commonwealth with well-paying jobs, many of which don’t require a 4-year degree. The median wages of an adult over the age of 25 in Massachusetts were $43,938 in 2012. For workers with only a high school degree, median wages were only $32,190 in 2012. Paper and machinery manufacturing on average, pay above the median wage in all counties while printing on average, pays above the median wage for high school graduates in all but two counties (Franklin and Hampshire) which only have a combined 45 people working in the industry. These kinds of jobs are even more important in areas of the Commonwealth that don’t benefit from the high wages seen in Greater Boston. The median household income in Berkshire County is $47,513 per year while the average annual wage for a paper manufacturing employee in Berkshire County is more than 60% higher at $76,744.
Paper Manufacturing
County
Berkshire 955 5.85
3.90
3.39
3.00
2.59
0.84
0.83
0.63
0.52
0.45
273
1,794
491
2,210
728
473
298
1,153
374
Franklin
Hampden
Hampshire
Worcester
Norfolk
Bristol
Plymouth
Middlesex
Essex
LQEmployment AverageAnnual Wage
$ 76,744
$ 51,162
$ 53,709
$ 61,497
$ 57,381
$ 73,664
$ 62,500
$ 52,851
$ 68,170
$ 46,230
235008_MassTech_MTCIndex - Back 3 - 12/19/14 08:41:33 - Black235008_MassTech_MTCIndex - Back 3 - 12/19/14 08:41:33 - Cyan235008_MassTech_MTCIndex - Back 3 - 12/19/14 08:41:33 - Magenta235008_MassTech_MTCIndex - Back 3 - 12/19/14 08:41:33 - Yellow
Key 2
Key 3
Key 4
Key 5
Key 6
Key 7
Key 8
Key 9
Key 10
Key 11
Key 12
Key 13
Key 14
Key 15
Key 16
Key 17
Key 18
Key 19
Key 21
Key 20
Key 22
KC
MY
M1
M2
M1
M2
M1
M2
M1
M2
M1
M2
M1
M2
M1
M2
M1
M2
M1
M2
M1
M2
M1
M2
2525
M1
M2
25M
1M
225
2525
50M
1M
2M
1M
250
5050
5050
M1
M2
M1
M2
5075
7575
7575
75G
RA
YG
RA
YG
RA
YG
RA
YG
RA
YK
CM
YK
CM
YK
CM
YK
CM
YK
CM
YK
CM
YY
+M
Y+
CC
+M
KC
MY
KC
MY
KC
MY
KP
CM
YK
CM
YK
CM
YK
CM
YK
CM
YK
CM
YK
CM
YG
RA
YK
CM
YM
1M
2M
1M
2M
1M
2M
1M
275
7575
7575
75G
RA
YG
RA
YK
CM
YK
CM
YK
CM
Y
Key 1
KC
MY
M1
M2
50
Key 23 M
1M
2star
starK
CM
Y
Kom
ori/GA
TF
P
art No. K
-28-6(D)
1/2/3/4 K1
2
34
1/2/3/4 C1
2
34
1/2/3/4 M1
2
34
1/2/3/4 M1
1/2/3/4 Y1
2
34
12
34
1/2/3/4 M2
12
34
MASSACHUSETTS INNOVATION ECONOMY ANNUAL INDEX
15
SPECIAL ANALYSIS
INTRODUCTION
Machinery Manufacturing
County
Franklin 421 2.96
2.18
2.11
2.10
1.32
0.99
0.82
0.72
0.51
0.37
3,779
2,274
3,523
437
4,481
790
831
890
123
Worcester
Hampden
Essex
Berkshire
Middlesex
Plymouth
Bristol
Norfolk
Hampshire
LQEmployment AverageAnnual Wage
$ 59,209
$ 53,302
$ 58,211
$ 97,932
$ 52,716
$ 58,227
$ 51,983
$ 88,837
$ 79,359
$ 63,104
0.34
0.02
168
66
Barnstable
Su�olk
$ 53,495
$ 69,957
Printing & Related Support Activities
County
Hampden 1,402 1.98
1.65
1.31
1.26
1.19
1.10
1.01
0.95
0.37
0.34
360
3,899
797
902
1,209
1,162
1,078
119
10
Berkshire
Middlesex
Plymouth
Bristol
Essex
Norfolk
Worcester
Barnstable
Dukes
LQEmployment AverageAnnual Wage
$ 46,932
$ 52,054
$ 77,541
$ 43,788
$ 43,448
$ 52,100
$ 50,745
$ 44,031
$ 42,258
$ 43,412
0.32
0.18
689
40
Su�olk
Hampshire
$ 60,379
$ 30,088
0.055Franklin $ 29,481
HistoryAs many readers will already understand, the paper industry has a long history in Massachusetts as one of the first established industries on the North American continent. These efforts date back to the 1700’s, prior to the invention of wood-pulp based paper in the mid-1800’s and even the founding of the United States. The oldest currently operating paper company in Massachusetts, Crane & Company, was founded in Dalton, Massachusetts, in 1801 by Zenas Crane. Another important company in the Commonwealth’s papermaking heritage was founded in Tyringham in 1833. Originally known as the “Turkey” mill, making paper from rags of hemp, linen and cotton, it soon became known as Platner and Smith operating several mills in the Berkshires and was, for a time, the largest paper company in the world, having taken that title from the Ameses’ of Springfield. In 1857, Platner and Smith attempted to make paper out of wood pulp; however, the venture failed commercially due to the length of the process, its high cost and the low quality of the resulting paper. About a decade later, German immigrant Albrecht Pagenstecher managed to manufacture commercially viable wood pulp and sold it to the Smith Paper Company, the successor to Platner and Smith. The advancement of this technology was coupled with the construction of the Holyoke Dam (completed in 1849) which harnessed the considerable water power of the Connecticut River for industrial use. This led to Holyoke becoming a center for papermaking as its mills became early adopters of the wood pulp technology. With twelve major mills, Holyoke became the largest papermaking center in the world, a sort of mid-19th century equivalent of Silicon Valley for mass producing paper, which was a revolutionary information technology of this era. These achievements stand as an early example of the strengths that survive in Massachusetts to this day and the entrepreneurial spirit that results in early adoption of new technologies and revolutionary innovations.
MassTech_MTCIndex Sig #6 - Low Folio - Front
MassTech_MTCIndex Sig #7 - Low Folio - Front
MassTech_MTCIndex Sig #8 - Low Folio - Front
MassTech_MTCIndex Sig #9 - Low Folio - Front235008_MassTech_MTCIndex - Front 3 - 12/19/14 08:41:31 - Black 235008_MassTech_MTCIndex - Front 3 - 12/19/14 08:41:31 - Cyan 235008_MassTech_MTCIndex - Front 3 - 12/19/14 08:41:31 - Magenta 235008_MassTech_MTCIndex - Front 3 - 12/19/14 08:41:31 - Yellow
Key
2K
ey 3
Key
4
Key
5K
ey 6
Key
7K
ey 8
Key
9K
ey 1
0K
ey 1
1K
ey
12
Key
13
Key
14
Key
15
Key
16
Key
17
Key
18
Key
19
Key
21
Key
2
0K
ey 2
2
KC
MY
M1
M2
M1
M2
M1
M2
M1
M2
M1
M2
M1
M2
M1
M2
M1
M2
M1
M2
M1
M2
M1
M2
2525
M1
M2
25M
1M
225
2525
50M
1M
2M
1M
250
5050
5050
M1
M2
M1
M2
5075
7575
7575
75G
RA
YG
RA
YG
RA
YG
RA
YG
RA
YK
CM
YK
CM
YK
CM
YK
CM
YK
CM
YK
CM
YY
+M
Y+
CC
+M
KC
MY
KC
MY
KC
MY
KP
CM
YK
CM
YK
CM
YK
CM
YK
CM
YK
CM
YK
CM
YG
RA
YK
CM
YM
1M
2M
1M
2M
1M
2M
1M
275
7575
7575
75G
RA
YG
RA
YK
CM
YK
CM
YK
CM
Y
Key
1
KC
MY
M1
M2
50
Key
23M
1M
2st
arst
arK
CM
Y
Kom
ori/G
AT
F
Par
t No.
K-2
8-6(
D)
1/2/
3/4
K1
2
34
1/2/
3/4
C1
2
34
1/2/
3/4
M1
2
34
1/2/
3/4
M1
1/2/
3/4
Y1
2
34
12
34
1/2/
3/4
M2
12
34
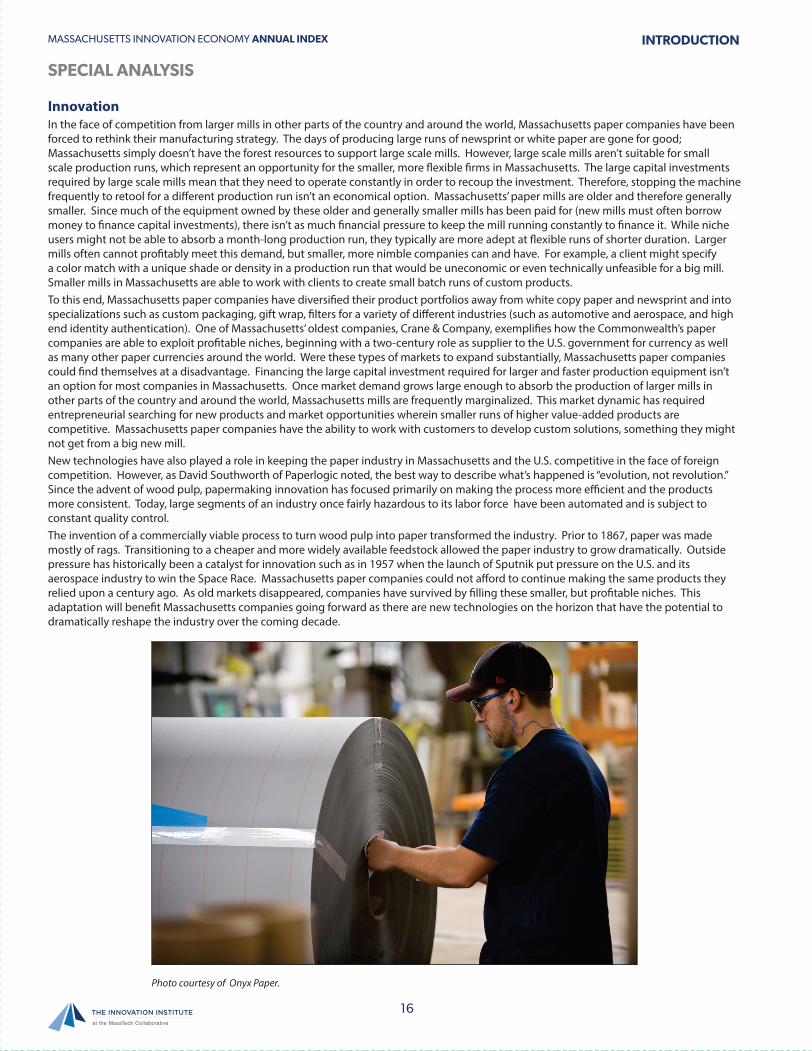
MASSACHUSETTS INNOVATION ECONOMY ANNUAL INDEX
16
SPECIAL ANALYSIS
INTRODUCTION
InnovationIn the face of competition from larger mills in other parts of the country and around the world, Massachusetts paper companies have been forced to rethink their manufacturing strategy. The days of producing large runs of newsprint or white paper are gone for good; Massachusetts simply doesn’t have the forest resources to support large scale mills. However, large scale mills aren’t suitable for small scale production runs, which represent an opportunity for the smaller, more flexible firms in Massachusetts. The large capital investments required by large scale mills mean that they need to operate constantly in order to recoup the investment. Therefore, stopping the machine frequently to retool for a different production run isn’t an economical option. Massachusetts’ paper mills are older and therefore generally smaller. Since much of the equipment owned by these older and generally smaller mills has been paid for (new mills must often borrow money to finance capital investments), there isn’t as much financial pressure to keep the mill running constantly to finance it. While niche users might not be able to absorb a month-long production run, they typically are more adept at flexible runs of shorter duration. Larger mills often cannot profitably meet this demand, but smaller, more nimble companies can and have. For example, a client might specify a color match with a unique shade or density in a production run that would be uneconomic or even technically unfeasible for a big mill. Smaller mills in Massachusetts are able to work with clients to create small batch runs of custom products.To this end, Massachusetts paper companies have diversified their product portfolios away from white copy paper and newsprint and into specializations such as custom packaging, gift wrap, filters for a variety of different industries (such as automotive and aerospace, and high end identity authentication). One of Massachusetts’ oldest companies, Crane & Company, exemplifies how the Commonwealth’s paper companies are able to exploit profitable niches, beginning with a two-century role as supplier to the U.S. government for currency as well as many other paper currencies around the world. Were these types of markets to expand substantially, Massachusetts paper companies could find themselves at a disadvantage. Financing the large capital investment required for larger and faster production equipment isn’t an option for most companies in Massachusetts. Once market demand grows large enough to absorb the production of larger mills in other parts of the country and around the world, Massachusetts mills are frequently marginalized. This market dynamic has required entrepreneurial searching for new products and market opportunities wherein smaller runs of higher value-added products are competitive. Massachusetts paper companies have the ability to work with customers to develop custom solutions, something they might not get from a big new mill. New technologies have also played a role in keeping the paper industry in Massachusetts and the U.S. competitive in the face of foreign competition. However, as David Southworth of Paperlogic noted, the best way to describe what’s happened is “evolution, not revolution.” Since the advent of wood pulp, papermaking innovation has focused primarily on making the process more efficient and the products more consistent. Today, large segments of an industry once fairly hazardous to its labor force have been automated and is subject to constant quality control. The invention of a commercially viable process to turn wood pulp into paper transformed the industry. Prior to 1867, paper was made mostly of rags. Transitioning to a cheaper and more widely available feedstock allowed the paper industry to grow dramatically. Outside pressure has historically been a catalyst for innovation such as in 1957 when the launch of Sputnik put pressure on the U.S. and its aerospace industry to win the Space Race. Massachusetts paper companies could not afford to continue making the same products they relied upon a century ago. As old markets disappeared, companies have survived by filling these smaller, but profitable niches. This adaptation will benefit Massachusetts companies going forward as there are new technologies on the horizon that have the potential to dramatically reshape the industry over the coming decade.
Photo courtesy of Onyx Paper.
235008_MassTech_MTCIndex - Back 3 - 12/19/14 08:41:33 - Black235008_MassTech_MTCIndex - Back 3 - 12/19/14 08:41:33 - Cyan235008_MassTech_MTCIndex - Back 3 - 12/19/14 08:41:33 - Magenta235008_MassTech_MTCIndex - Back 3 - 12/19/14 08:41:33 - Yellow
Key 2
Key 3
Key 4
Key 5
Key 6
Key 7
Key 8
Key 9
Key 10
Key 11
Key 12
Key 13
Key 14
Key 15
Key 16
Key 17
Key 18
Key 19
Key 21
Key 20
Key 22
KC
MY
M1
M2
M1
M2
M1
M2
M1
M2
M1
M2
M1
M2
M1
M2
M1
M2
M1
M2
M1
M2
M1
M2
2525
M1
M2
25M
1M
225
2525
50M
1M
2M
1M
250
5050
5050
M1
M2
M1
M2
5075
7575
7575
75G
RA
YG
RA
YG
RA
YG
RA
YG
RA
YK
CM
YK
CM
YK
CM
YK
CM
YK
CM
YK
CM
YY
+M
Y+
CC
+M
KC
MY
KC
MY
KC
MY
KP
CM
YK
CM
YK
CM
YK
CM
YK
CM
YK
CM
YK
CM
YG
RA
YK
CM
YM
1M
2M
1M
2M
1M
2M
1M
275
7575
7575
75G
RA
YG
RA
YK
CM
YK
CM
YK
CM
Y
Key 1
KC
MY
M1
M2
50
Key 23 M
1M
2star
starK
CM
Y
Kom
ori/GA
TF
P
art No. K
-28-6(D)
1/2/3/4 K1
2
34
1/2/3/4 C1
2
34
1/2/3/4 M1
2
34
1/2/3/4 M1
1/2/3/4 Y1
2
34
12
34
1/2/3/4 M2
12
34

MASSACHUSETTS INNOVATION ECONOMY ANNUAL INDEX
17
SPECIAL ANALYSIS
INTRODUCTION
Massachusetts companies are positioned to reclaim their status as leaders of innovation in this industry due to their flexible nature and innovative adaptations brought about through the need to survive and the Commonwealth’s position as a leader in industrial research & development. As an example of these adaptations, companies that started out as traditional paper manufacturers have applied the same manufacturing processes to other materials and expanded into new and frequently higher value added markets. Hollingsworth & Vose now makes battery separators for the automotive industry and filtration materials for the aerospace industry. Onyx Specialty Papers’ products can be found in products as diverse as countertops, fine arts paper, and automotive parts. Companies across Massachusetts are now making high end papers for a variety of uses such as identity authentication, the medical and life sciences industries, and applying their manufacturing processes to materials such as carbon and Kevlar.One technology that holds the potential to be a game changer is nanocellulose. Composed of nanoscale cellulose fibrils, usually derived from woodpulp, the applications of this material are potentially vast and have yet to be fully explored. Nanocellulose fibers are typically extracted using mechanical processes that create high shear forces which rip apart larger wood fibers. Nanocellulose fibers have a very high length to width ratio and have many useful properties such as its ability to become less viscous when stressed. Nanocellulose also has a strength-to-weight ratio eight times higher than steel which makes it a good material for strong products that benefit from being light in weight such as body armor. Nanocellulose can be used as a more sustainable substitute for plastic because it is made from a renewable feedstock instead of petroleum. Nanocellose also holds the potential to make packaging lighter and stronger, reducing the amount of resources that must be devoted to it and thereby reducing the environmental impact and cost. Cement is another area where nanocellulose can have a big impact. Adding small amounts of nanocellulose to cement has been shown to increase its strength by up to 20%, more than offsetting the cost of adding nanocellulose to the mixture, by dramatically reducing the amount of material necessary. Also, the manufacturing of cement is a major contributor to carbon dioxide emissions worldwide meaning a global role-out of this application would result in a reduction of about 500 million tons of CO2/year. Other uses for reinforced materials include automotive bodies and interiors, paper coatings, absorbent products, and clothing. Smaller niche markets could develop in paints, aerogels, insulation, and aerospace structural components. Given its many applications, nanocellulose has a large potential market both in the U.S. and worldwide. The Technological Association of the Pulp and Paper Industry estimates a U.S. market of between 3.5 and 9 million metric tons and a global market of between 18 and 56 million metric tons. The total market value is hard to gauge at the moment since nobody is producing nanocellulose products commercially, so the price isn’t known. However, one Massachusetts company could play an important role in changing that. Paperlogic, based in Turners Falls, Massachusetts, is working with the University of Maine to develop a commercial scale production line for nanocellulose. The U.S. Department of Agriculture awarded a $350,000 grant to develop the production line at the Massachusetts plant. The Paperlogic/University of Maine project will be the first of its kind, with a capacity of 2 tons/day, making nanocellulose available in large enough quantities to support commercial innovation. Technological revolutions in nanomanufacturing and printed electronics provide additional opportunities to sustain and transform the traditional paper and printing industry in Massachusetts. The Commonwealth is on the fore front of this evolution, with nanomanufacturing research centers at UMass Amherst, UMass Lowell and Northeastern University, the center for Science of Nanoscale Systems and their Device Applications at Harvard University as well as the newly announced flexible and printed electronics research center at UMass Lowell. Each are making contributions to nanomaterials and nanomanufacturing that can impact the traditional manufacturing industries in Massachusetts, including the paper and printing industry. The minicomputer industry in Massachusetts may have disappeared because of a lack of adaptation to a disruptive new technology. Massachusetts’ surviving paper companies need not share a similar fate because many have adapted their manufacturing strategy and product portfolios. Nanomaterials and flexible substrates for printed electronics are examples of technologies that could soon create new, high value added markets for Massachusetts companies, increasing the role of the traditional paper and printing industry within the Innovation Economy and supporting well-paying jobs outside of the Boston Metro area.
We would like to thank the following people for their contributions to the 2014 Special Analysis:
Bill Gilmore, engineer, retired, GL&V
David Southworth, President, Paperlogic
Patricia C. Begrowicz, President, Onyx Specialty Papers
Dr. James Watkins, Director, Center for Hierarchical Manufacturing at UMass Amherst
Sources for the 2014 Index: Bureau of Labor Statistics Quarterly Census of Employment and Wages. Market projections of cellulose nanomaterial-enabled products —Part 2: Volume estimates, TAPPI Journal, 2014. Enzymatic preparation of nanocrystalline and microcrystalline cellulose, TAPPI Journal 2014. The Crane Museum of Papermaking.
MassTech_MTCIndex Sig #6 - Low Folio - Front
MassTech_MTCIndex Sig #7 - Low Folio - Front
MassTech_MTCIndex Sig #8 - Low Folio - Front
MassTech_MTCIndex Sig #9 - Low Folio - Front
235008_MassTech_MTCIndex - Front 3 - 12/19/14 08:41:31 - Black 235008_MassTech_MTCIndex - Front 3 - 12/19/14 08:41:31 - Cyan 235008_MassTech_MTCIndex - Front 3 - 12/19/14 08:41:31 - Magenta 235008_MassTech_MTCIndex - Front 3 - 12/19/14 08:41:31 - Yellow
Key
2K
ey 3
Key
4
Key
5K
ey 6
Key
7K
ey 8
Key
9K
ey 1
0K
ey 1
1K
ey
12
Key
13
Key
14
Key
15
Key
16
Key
17
Key
18
Key
19
Key
21
Key
2
0K
ey 2
2
KC
MY
M1
M2
M1
M2
M1
M2
M1
M2
M1
M2
M1
M2
M1
M2
M1
M2
M1
M2
M1
M2
M1
M2
2525
M1
M2
25M
1M
225
2525
50M
1M
2M
1M
250
5050
5050
M1
M2
M1
M2
5075
7575
7575
75G
RA
YG
RA
YG
RA
YG
RA
YG
RA
YK
CM
YK
CM
YK
CM
YK
CM
YK
CM
YK
CM
YY
+M
Y+
CC
+M
KC
MY
KC
MY
KC
MY
KP
CM
YK
CM
YK
CM
YK
CM
YK
CM
YK
CM
YK
CM
YG
RA
YK
CM
YM
1M
2M
1M
2M
1M
2M
1M
275
7575
7575
75G
RA
YG
RA
YK
CM
YK
CM
YK
CM
Y
Key
1
KC
MY
M1
M2
50
Key
23M
1M
2st
arst
arK
CM
Y
Kom
ori/G
AT
F
Par
t No.
K-2
8-6(
D)
1/2/
3/4
K1
2
34
1/2/
3/4
C1
2
34
1/2/
3/4
M1
2
34
1/2/
3/4
M1
1/2/
3/4
Y1
2
34
12
34
1/2/
3/4
M2
12
34

235008_MassTech_MTCIndex - Back 3 - 12/19/14 08:41:33 - Black235008_MassTech_MTCIndex - Back 3 - 12/19/14 08:41:33 - Cyan235008_MassTech_MTCIndex - Back 3 - 12/19/14 08:41:33 - Magenta235008_MassTech_MTCIndex - Back 3 - 12/19/14 08:41:33 - YellowK
ey 2K
ey 3K
ey 4K
ey 5K
ey 6K
ey 7K
ey 8K
ey 9K
ey 10K
ey 11K
ey 12K
ey 13K
ey 14K
ey 15K
ey 16K
ey 17K
ey 18K
ey 19K
ey 21K
ey 20K
ey 22
KC
MY
M1
M2
M1
M2
M1
M2
M1
M2
M1
M2
M1
M2
M1
M2
M1
M2
M1
M2
M1
M2
M1
M2
2525
M1
M2
25M
1M
225
2525
50M
1M
2M
1M
250
5050
5050
M1
M2
M1
M2
5075
7575
7575
75G
RA
YG
RA
YG
RA
YG
RA
YG
RA
YK
CM
YK
CM
YK
CM
YK
CM
YK
CM
YK
CM
YY
+M
Y+
CC
+M
KC
MY
KC
MY
KC
MY
KP
CM
YK
CM
YK
CM
YK
CM
YK
CM
YK
CM
YK
CM
YG
RA
YK
CM
YM
1M
2M
1M
2M
1M
2M
1M
275
7575
7575
75G
RA
YG
RA
YK
CM
YK
CM
YK
CM
Y
Key 1
KC
MY
M1
M2
50
Key 23 M
1M
2star
starK
CM
Y
Kom
ori/GA
TF
P
art No. K
-28-6(D)
1/2/3/4 K1
2
34
1/2/3/4 C1
2
34
1/2/3/4 M1
2
34
1/2/3/4 M1
1/2/3/4 Y1
2
34
12
34
1/2/3/4 M2
12
34
ECONOMIC IMPACT
A key goal of the Index is to convey how innovation impacts the state’s economy. One way innovation contributes to economic prosperity in Massachusetts is through employment and wages in key industry clusters. Jobs created in the innovation economy typically pay high wages, which directly and indirectly sustain a high standard of living throughout the Commonwealth. Economic growth in key industry clusters hinges on the ability of individual firms to utilize innovative technologies and processes which improve productivity and support the creation and commercialization of innovative products and services. In addition, manufacturing exports are becoming an increasingly important driver of business, competitiveness and overall economic growth. Success in the national and global marketplaces brings in revenue that enables businesses to survive, prosper and create and sustain high-paying jobs.
INDICATORS 1-5
MassTech_MTCIndex Sig #10 - Low Folio - Front
MassTech_MTCIndex Sig #11 - Low Folio - Front
MassTech_MTCIndex Sig #12 - Low Folio - Front
MassTech_MTCIndex Sig #13 - Low Folio - Front235008_MassTech_MTCIndex - Front 4 - 12/19/14 08:41:34 - Black 235008_MassTech_MTCIndex - Front 4 - 12/19/14 08:41:34 - Cyan 235008_MassTech_MTCIndex - Front 4 - 12/19/14 08:41:34 - Magenta 235008_MassTech_MTCIndex - Front 4 - 12/19/14 08:41:34 - Yellow
Key
2K
ey 3
Key
4
Key
5K
ey 6
Key
7K
ey 8
Key
9K
ey 1
0K
ey 1
1K
ey
12
Key
13
Key
14
Key
15
Key
16
Key
17
Key
18
Key
19
Key
21
Key
2
0K
ey 2
2
KC
MY
M1
M2
M1
M2
M1
M2
M1
M2
M1
M2
M1
M2
M1
M2
M1
M2
M1
M2
M1
M2
M1
M2
2525
M1
M2
25M
1M
225
2525
50M
1M
2M
1M
250
5050
5050
M1
M2
M1
M2
5075
7575
7575
75G
RA
YG
RA
YG
RA
YG
RA
YG
RA
YK
CM
YK
CM
YK
CM
YK
CM
YK
CM
YK
CM
YY
+M
Y+
CC
+M
KC
MY
KC
MY
KC
MY
KP
CM
YK
CM
YK
CM
YK
CM
YK
CM
YK
CM
YK
CM
YG
RA
YK
CM
YM
1M
2M
1M
2M
1M
2M
1M
275
7575
7575
75G
RA
YG
RA
YK
CM
YK
CM
YK
CM
Y
Key
1
KC
MY
M1
M2
50
Key
23M
1M
2st
arst
arK
CM
Y
Kom
ori/G
AT
F
Par
t No.
K-2
8-6(
D)
1/2/
3/4
K1
2
34
1/2/
3/4
C1
2
34
1/2/
3/4
M1
2
34
1/2/
3/4
M1
1/2/
3/4
Y1
2
34
12
34
1/2/
3/4
M2
12
34
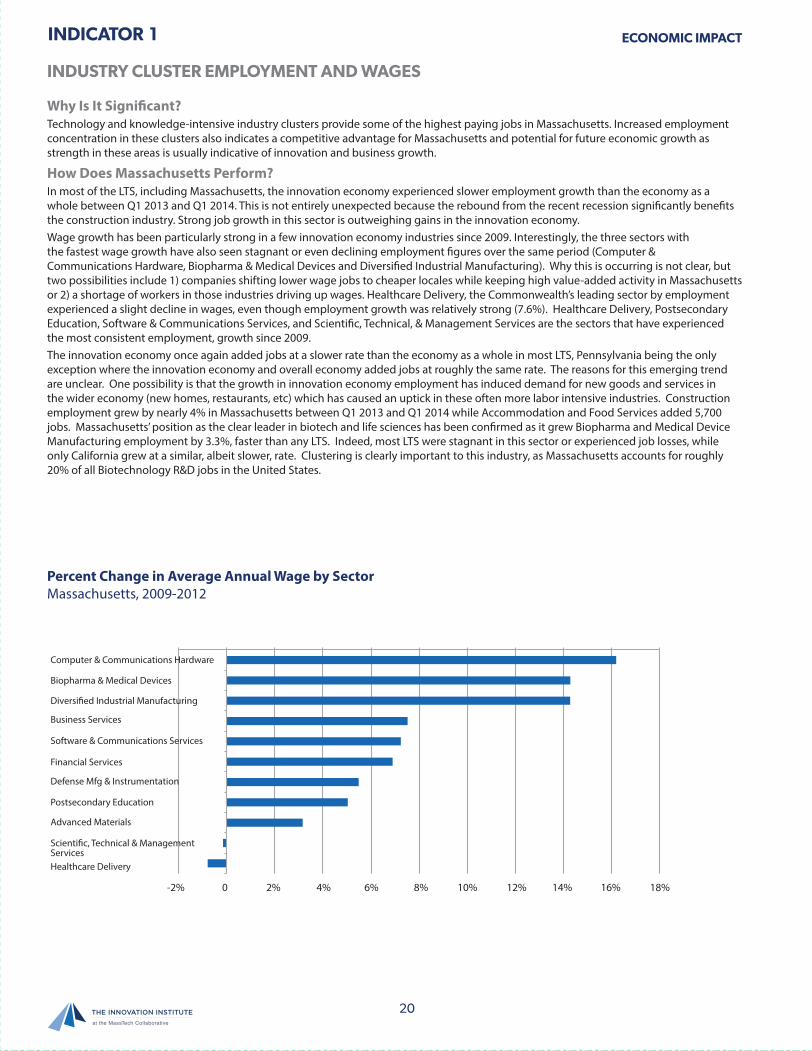
20
INDICATOR
Why Is It Significant?Technology and knowledge-intensive industry clusters provide some of the highest paying jobs in Massachusetts. Increased employment concentration in these clusters also indicates a competitive advantage for Massachusetts and potential for future economic growth as strength in these areas is usually indicative of innovation and business growth.
How Does Massachusetts Perform?In most of the LTS, including Massachusetts, the innovation economy experienced slower employment growth than the economy as a whole between Q1 2013 and Q1 2014. This is not entirely unexpected because the rebound from the recent recession significantly benefits the construction industry. Strong job growth in this sector is outweighing gains in the innovation economy. Wage growth has been particularly strong in a few innovation economy industries since 2009. Interestingly, the three sectors with the fastest wage growth have also seen stagnant or even declining employment figures over the same period (Computer & Communications Hardware, Biopharma & Medical Devices and Diversified Industrial Manufacturing). Why this is occurring is not clear, but two possibilities include 1) companies shifting lower wage jobs to cheaper locales while keeping high value-added activity in Massachusetts or 2) a shortage of workers in those industries driving up wages. Healthcare Delivery, the Commonwealth’s leading sector by employment experienced a slight decline in wages, even though employment growth was relatively strong (7.6%). Healthcare Delivery, Postsecondary Education, Software & Communications Services, and Scientific, Technical, & Management Services are the sectors that have experienced the most consistent employment, growth since 2009. The innovation economy once again added jobs at a slower rate than the economy as a whole in most LTS, Pennsylvania being the only exception where the innovation economy and overall economy added jobs at roughly the same rate. The reasons for this emerging trend are unclear. One possibility is that the growth in innovation economy employment has induced demand for new goods and services in the wider economy (new homes, restaurants, etc) which has caused an uptick in these often more labor intensive industries. Construction employment grew by nearly 4% in Massachusetts between Q1 2013 and Q1 2014 while Accommodation and Food Services added 5,700 jobs. Massachusetts’ position as the clear leader in biotech and life sciences has been confirmed as it grew Biopharma and Medical Device Manufacturing employment by 3.3%, faster than any LTS. Indeed, most LTS were stagnant in this sector or experienced job losses, while only California grew at a similar, albeit slower, rate. Clustering is clearly important to this industry, as Massachusetts accounts for roughly 20% of all Biotechnology R&D jobs in the United States.
INDUSTRY CLUSTER EMPLOYMENT AND WAGES
ECONOMIC IMPACT1
Percent Change in Average Annual Wage by SectorMassachusetts, 2009-2012
0 2%-2% 4% 6% 8% 10% 12% 14% 16% 18%
Computer & Communications Hardware
Biopharma & Medical Devices
Diversi�ed Industrial Manufacturing
Business Services
Software & Communications Services
Financial Services
Defense Mfg & Instrumentation
Postsecondary Education
Advanced Materials
Scienti�c, Technical & ManagementServicesHealthcare Delivery
235008_MassTech_MTCIndex - Back 4 - 12/19/14 08:41:36 - Black235008_MassTech_MTCIndex - Back 4 - 12/19/14 08:41:36 - Cyan235008_MassTech_MTCIndex - Back 4 - 12/19/14 08:41:36 - Magenta235008_MassTech_MTCIndex - Back 4 - 12/19/14 08:41:36 - Yellow
Key 2
Key 3
Key 4
Key 5
Key 6
Key 7
Key 8
Key 9
Key 10
Key 11
Key 12
Key 13
Key 14
Key 15
Key 16
Key 17
Key 18
Key 19
Key 21
Key 20
Key 22
KC
MY
M1
M2
M1
M2
M1
M2
M1
M2
M1
M2
M1
M2
M1
M2
M1
M2
M1
M2
M1
M2
M1
M2
2525
M1
M2
25M
1M
225
2525
50M
1M
2M
1M
250
5050
5050
M1
M2
M1
M2
5075
7575
7575
75G
RA
YG
RA
YG
RA
YG
RA
YG
RA
YK
CM
YK
CM
YK
CM
YK
CM
YK
CM
YK
CM
YY
+M
Y+
CC
+M
KC
MY
KC
MY
KC
MY
KP
CM
YK
CM
YK
CM
YK
CM
YK
CM
YK
CM
YK
CM
YG
RA
YK
CM
YM
1M
2M
1M
2M
1M
2M
1M
275
7575
7575
75G
RA
YG
RA
YK
CM
YK
CM
YK
CM
Y
Key 1
KC
MY
M1
M2
50
Key 23 M
1M
2star
starK
CM
Y
Kom
ori/GA
TF
P
art No. K
-28-6(D)
1/2/3/4 K1
2
34
1/2/3/4 C1
2
34
1/2/3/4 M1
2
34
1/2/3/4 M1
1/2/3/4 Y1
2
34
12
34
1/2/3/4 M2
12
34
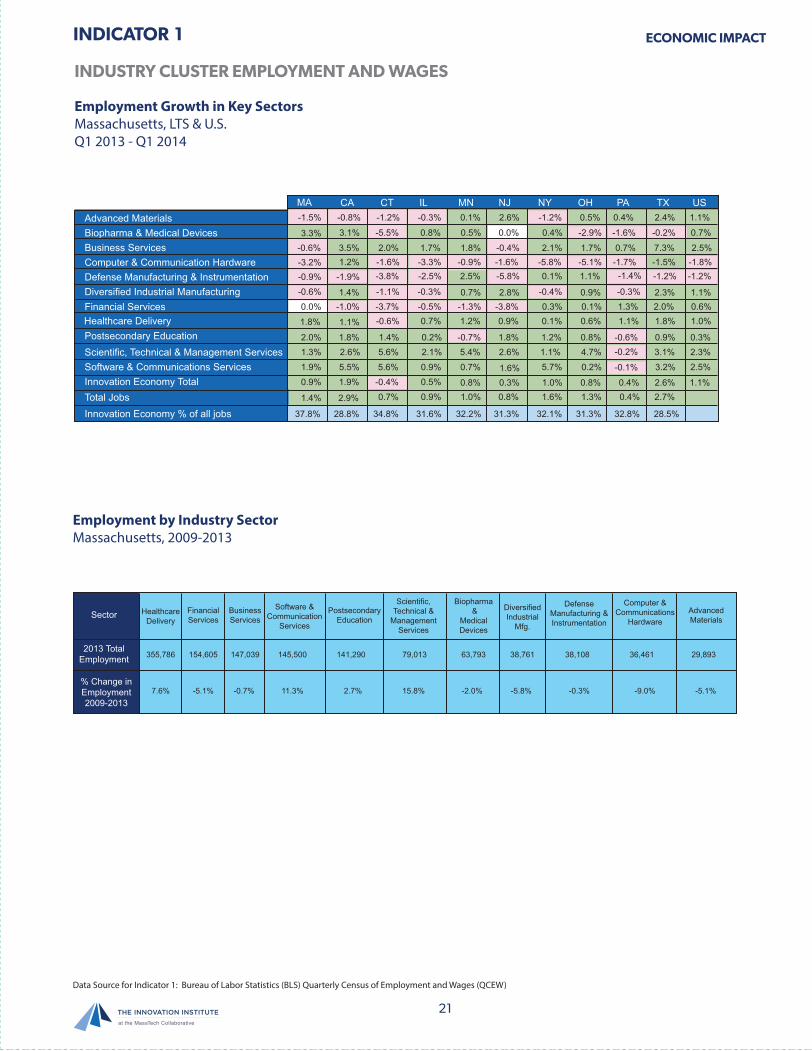
21
INDICATOR
INDUSTRY CLUSTER EMPLOYMENT AND WAGES
ECONOMIC IMPACT1
Employment Growth in Key SectorsMassachusetts, LTS & U.S.Q1 2013 - Q1 2014
Employment by Industry SectorMassachusetts, 2009-2013
Advanced Materials
Biopharma & Medical Devices
Business Services
Computer & Communication Hardware
Defense Manufacturing & Instrumentation
Diversified Industrial Manufacturing
Postsecondary Education
Financial Services
Healthcare Delivery
Scientific, Technical & Management Services
Software & Communications Services
Innovation Economy Total
Total Jobs
Innovation Economy % of all jobs
MA CA CT IL MN NJ NY OH PA TX US
1.4%
37.8% 28.8% 34.8% 31.6% 32.2% 32.1% 32.8% 28.5%31.3% 31.3%
0.9%
1.9% 1.6% 5.7%
1.3% 1.1% 4.7%
2.0%
3.3%
1.8% 1.8% 1.2% 0.8% 0.9% 0.3%1.4% 0.2%
2.6% 2.6% 2.3%
2.5%
5.6% 2.1% 3.1%5.4%
2.9%
2.0% 1.7% 2.1% 1.7% 0.7% 7.3% 2.5%1.8%
-1.5%
-3.2%
--0.9%
1.8%
-0.8%
3.1%
3.5%-0.6% -0.4%
1.2%
-1.9%
1.4% 0.7% 2.8% 2.3% 1.1%0.9%
-1.0% -3.7% -0.5% -1.3% -3.8% 0.3% 0.1% 1.3% 2.0% 0.6%
1.1% -0.6% 0.7% 1.2% 0.9% 0.1% 0.6% 1.1% 1.8% 1.0%
5.5% 5.6% 0.9%
0.5%
0.9% 1.0% 1.6% 1.3% 0.4% 2.7%0.8%
0.2% 3.2%0.7%
0.8% 0.3% 1.0% 0.8% 0.4% 2.6% 1.1%1.9%
-1.6% -3.3% -0.9%
-3.8% -2.5% -5.8%2.5% 0.1% 1.1% -1.4% -1.2% -1.2%
-0.6% -1.1% -0.3% -0.4% -0.3%
0.0%
-5.5% -2.9% -1.6%0.8% 0.5% 0.0% 0.7%0.4%
-1.2% -1.2%-0.3% 0.1% 0.5% 0.4%2.6% 2.4% 1.1%
-0.2%
-1.6% -5.8% -5.1% -1.7% -1.5% -1.8%
-0.7% -0.6%
-0.2%
-0.1%
-0.4%
0.7%
Sector
2013 Total
Employment
% Change in
Employment
2009-2013
Healthcare
Delivery
Financial
Services
Business
Services
147,039355,786
7.6% -5.1% -0.7% 11.3% 2.7% 15.8% -2.0% -5.8% -0.3% -9.0% -5.1%
154,605
Postsecondary
Education
Software &
Communication
Services
Scientific,
Technical &
Management
Services
Computer &
Communications
Hardware
Defense
Manufacturing &
Instrumentation
Advanced
Materials
Biopharma
&
Medical
Devices
Diversified
Industrial
Mfg.
145,500 141,290 79,013 63,793 38,761 38,108 36,461 29,893
Data Source for Indicator 1: Bureau of Labor Statistics (BLS) Quarterly Census of Employment and Wages (QCEW)
MassTech_MTCIndex Sig #10 - Low Folio - Front
MassTech_MTCIndex Sig #11 - Low Folio - Front
MassTech_MTCIndex Sig #12 - Low Folio - Front
MassTech_MTCIndex Sig #13 - Low Folio - Front
235008_MassTech_MTCIndex - Front 4 - 12/19/14 08:41:34 - Black 235008_MassTech_MTCIndex - Front 4 - 12/19/14 08:41:34 - Cyan 235008_MassTech_MTCIndex - Front 4 - 12/19/14 08:41:34 - Magenta 235008_MassTech_MTCIndex - Front 4 - 12/19/14 08:41:34 - Yellow
Key
2K
ey 3
Key
4
Key
5K
ey 6
Key
7K
ey 8
Key
9K
ey 1
0K
ey 1
1K
ey
12
Key
13
Key
14
Key
15
Key
16
Key
17
Key
18
Key
19
Key
21
Key
2
0K
ey 2
2
KC
MY
M1
M2
M1
M2
M1
M2
M1
M2
M1
M2
M1
M2
M1
M2
M1
M2
M1
M2
M1
M2
M1
M2
2525
M1
M2
25M
1M
225
2525
50M
1M
2M
1M
250
5050
5050
M1
M2
M1
M2
5075
7575
7575
75G
RA
YG
RA
YG
RA
YG
RA
YG
RA
YK
CM
YK
CM
YK
CM
YK
CM
YK
CM
YK
CM
YY
+M
Y+
CC
+M
KC
MY
KC
MY
KC
MY
KP
CM
YK
CM
YK
CM
YK
CM
YK
CM
YK
CM
YK
CM
YG
RA
YK
CM
YM
1M
2M
1M
2M
1M
2M
1M
275
7575
7575
75G
RA
YG
RA
YK
CM
YK
CM
YK
CM
Y
Key
1
KC
MY
M1
M2
50
Key
23M
1M
2st
arst
arK
CM
Y
Kom
ori/G
AT
F
Par
t No.
K-2
8-6(
D)
1/2/
3/4
K1
2
34
1/2/
3/4
C1
2
34
1/2/
3/4
M1
2
34
1/2/
3/4
M1
1/2/
3/4
Y1
2
34
12
34
1/2/
3/4
M2
12
34
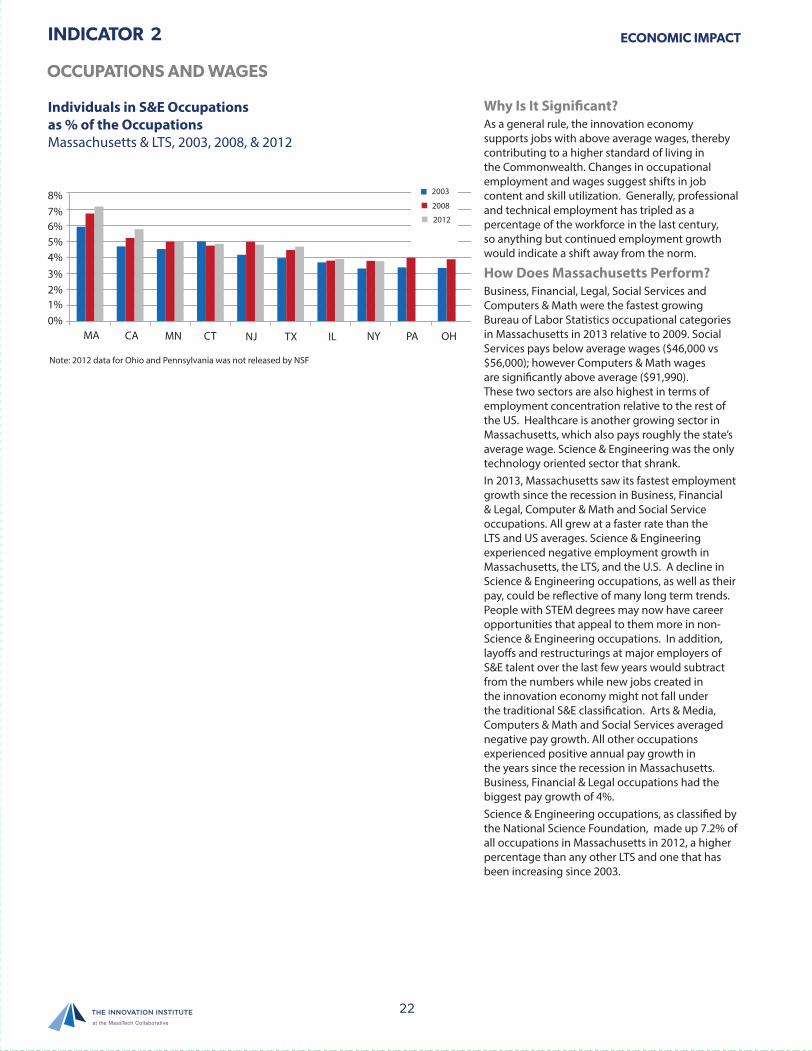
22
INDICATOR
Why Is It Significant?As a general rule, the innovation economy supports jobs with above average wages, thereby contributing to a higher standard of living in the Commonwealth. Changes in occupational employment and wages suggest shifts in job content and skill utilization. Generally, professional and technical employment has tripled as a percentage of the workforce in the last century, so anything but continued employment growth would indicate a shift away from the norm.
How Does Massachusetts Perform?Business, Financial, Legal, Social Services and Computers & Math were the fastest growing Bureau of Labor Statistics occupational categories in Massachusetts in 2013 relative to 2009. Social Services pays below average wages ($46,000 vs $56,000); however Computers & Math wages are significantly above average ($91,990). These two sectors are also highest in terms of employment concentration relative to the rest of the US. Healthcare is another growing sector in Massachusetts, which also pays roughly the state’s average wage. Science & Engineering was the only technology oriented sector that shrank. In 2013, Massachusetts saw its fastest employment growth since the recession in Business, Financial & Legal, Computer & Math and Social Service occupations. All grew at a faster rate than the LTS and US averages. Science & Engineering experienced negative employment growth in Massachusetts, the LTS, and the U.S. A decline in Science & Engineering occupations, as well as their pay, could be reflective of many long term trends. People with STEM degrees may now have career opportunities that appeal to them more in non-Science & Engineering occupations. In addition, layoffs and restructurings at major employers of S&E talent over the last few years would subtract from the numbers while new jobs created in the innovation economy might not fall under the traditional S&E classification. Arts & Media, Computers & Math and Social Services averaged negative pay growth. All other occupations experienced positive annual pay growth in the years since the recession in Massachusetts. Business, Financial & Legal occupations had the biggest pay growth of 4%. Science & Engineering occupations, as classified by the National Science Foundation, made up 7.2% of all occupations in Massachusetts in 2012, a higher percentage than any other LTS and one that has been increasing since 2003.
ECONOMIC IMPACT
OCCUPATIONS AND WAGES
2
Individuals in S&E Occupationsas % of the OccupationsMassachusetts & LTS, 2003, 2008, & 2012
MA
8%7%6%5%4%3%2%1%0%
CA MN CT NJ TX NY PA OHIL
2003
2008
2012
Note: 2012 data for Ohio and Pennsylvania was not released by NSF
235008_MassTech_MTCIndex - Back 4 - 12/19/14 08:41:36 - Black235008_MassTech_MTCIndex - Back 4 - 12/19/14 08:41:36 - Cyan235008_MassTech_MTCIndex - Back 4 - 12/19/14 08:41:36 - Magenta235008_MassTech_MTCIndex - Back 4 - 12/19/14 08:41:36 - Yellow
Key 2
Key 3
Key 4
Key 5
Key 6
Key 7
Key 8
Key 9
Key 10
Key 11
Key 12
Key 13
Key 14
Key 15
Key 16
Key 17
Key 18
Key 19
Key 21
Key 20
Key 22
KC
MY
M1
M2
M1
M2
M1
M2
M1
M2
M1
M2
M1
M2
M1
M2
M1
M2
M1
M2
M1
M2
M1
M2
2525
M1
M2
25M
1M
225
2525
50M
1M
2M
1M
250
5050
5050
M1
M2
M1
M2
5075
7575
7575
75G
RA
YG
RA
YG
RA
YG
RA
YG
RA
YK
CM
YK
CM
YK
CM
YK
CM
YK
CM
YK
CM
YY
+M
Y+
CC
+M
KC
MY
KC
MY
KC
MY
KP
CM
YK
CM
YK
CM
YK
CM
YK
CM
YK
CM
YK
CM
YG
RA
YK
CM
YM
1M
2M
1M
2M
1M
2M
1M
275
7575
7575
75G
RA
YG
RA
YK
CM
YK
CM
YK
CM
Y
Key 1
KC
MY
M1
M2
50
Key 23 M
1M
2star
starK
CM
Y
Kom
ori/GA
TF
P
art No. K
-28-6(D)
1/2/3/4 K1
2
34
1/2/3/4 C1
2
34
1/2/3/4 M1
2
34
1/2/3/4 M1
1/2/3/4 Y1
2
34
12
34
1/2/3/4 M2
12
34

23
INDICATOR ECONOMIC IMPACT
OCCUPATIONS AND WAGES
2
Occupations by Employment Concentration and Annual PayMassachusetts, 2013
0.50 0.70 0.90 1.10 1.30 1.50 1.70 1.90
140,000.00
120,000.00
100,000.00
80,000.00
60,000.00
40,000.00
20,000.00
-
Arts & Media
Business, Financial & Legal
Construction & MaintenanceScience & Engineering
Computers & Math
Social Services
HealthcareEducation
Production Sales & O�ce
Other Services
Employment concentration relative to U.S. (location quotient)
Aver
age
Pay
(201
3 do
llars
)
Growing Occupations
Stable Occupations
Shrinking Occupations
Average Wage $56,000
Data Source for Indicator 2: BLS Occupational Employment Statistics, Consumer Price Index (CPI)
MassTech_MTCIndex Sig #10 - Low Folio - Front
MassTech_MTCIndex Sig #11 - Low Folio - Front
MassTech_MTCIndex Sig #12 - Low Folio - Front
MassTech_MTCIndex Sig #13 - Low Folio - Front235008_MassTech_MTCIndex - Front 4 - 12/19/14 08:41:34 - Black 235008_MassTech_MTCIndex - Front 4 - 12/19/14 08:41:34 - Cyan 235008_MassTech_MTCIndex - Front 4 - 12/19/14 08:41:34 - Magenta 235008_MassTech_MTCIndex - Front 4 - 12/19/14 08:41:34 - Yellow
Key
2K
ey 3
Key
4
Key
5K
ey 6
Key
7K
ey 8
Key
9K
ey 1
0K
ey 1
1K
ey
12
Key
13
Key
14
Key
15
Key
16
Key
17
Key
18
Key
19
Key
21
Key
2
0K
ey 2
2
KC
MY
M1
M2
M1
M2
M1
M2
M1
M2
M1
M2
M1
M2
M1
M2
M1
M2
M1
M2
M1
M2
M1
M2
2525
M1
M2
25M
1M
225
2525
50M
1M
2M
1M
250
5050
5050
M1
M2
M1
M2
5075
7575
7575
75G
RA
YG
RA
YG
RA
YG
RA
YG
RA
YK
CM
YK
CM
YK
CM
YK
CM
YK
CM
YK
CM
YY
+M
Y+
CC
+M
KC
MY
KC
MY
KC
MY
KP
CM
YK
CM
YK
CM
YK
CM
YK
CM
YK
CM
YK
CM
YG
RA
YK
CM
YM
1M
2M
1M
2M
1M
2M
1M
275
7575
7575
75G
RA
YG
RA
YK
CM
YK
CM
YK
CM
Y
Key
1
KC
MY
M1
M2
50
Key
23M
1M
2st
arst
arK
CM
Y
Kom
ori/G
AT
F
Par
t No.
K-2
8-6(
D)
1/2/
3/4
K1
2
34
1/2/
3/4
C1
2
34
1/2/
3/4
M1
2
34
1/2/
3/4
M1
1/2/
3/4
Y1
2
34
12
34
1/2/
3/4
M2
12
34
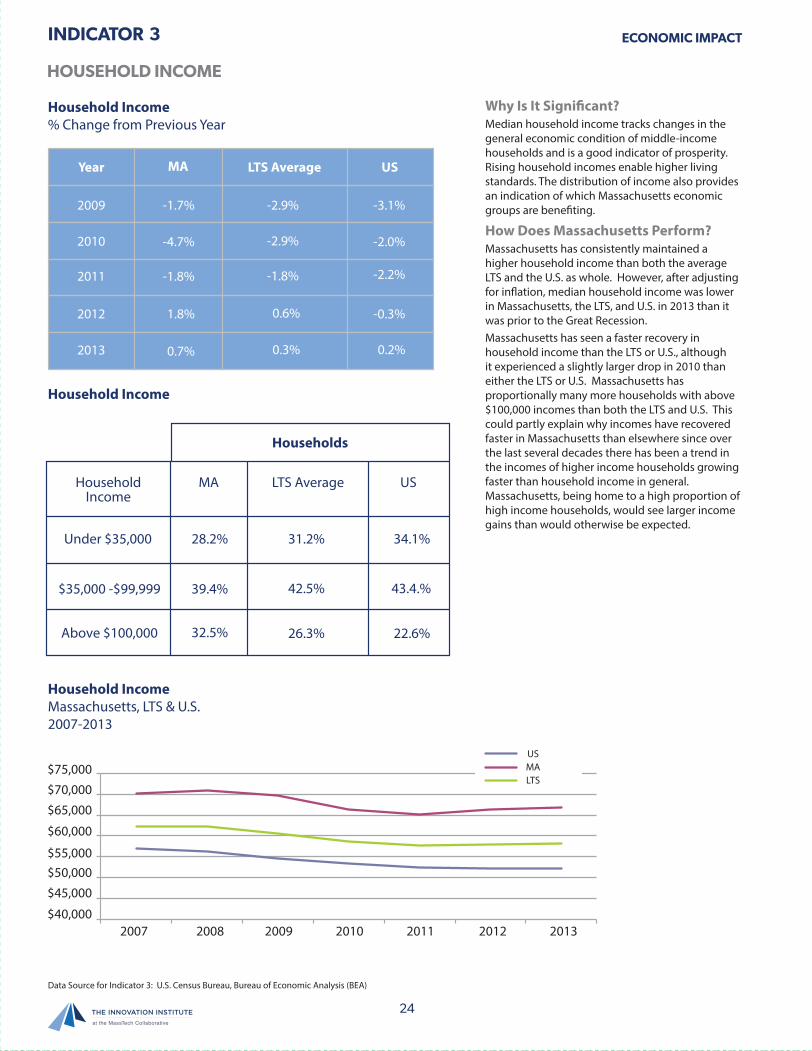
24
INDICATOR
Why Is It Significant?Median household income tracks changes in the general economic condition of middle-income households and is a good indicator of prosperity. Rising household incomes enable higher living standards. The distribution of income also provides an indication of which Massachusetts economic groups are benefiting.
How Does Massachusetts Perform?Massachusetts has consistently maintained a higher household income than both the average LTS and the U.S. as whole. However, after adjusting for inflation, median household income was lower in Massachusetts, the LTS, and U.S. in 2013 than it was prior to the Great Recession. Massachusetts has seen a faster recovery in household income than the LTS or U.S., although it experienced a slightly larger drop in 2010 than either the LTS or U.S. Massachusetts has proportionally many more households with above $100,000 incomes than both the LTS and U.S. This could partly explain why incomes have recovered faster in Massachusetts than elsewhere since over the last several decades there has been a trend in the incomes of higher income households growing faster than household income in general. Massachusetts, being home to a high proportion of high income households, would see larger income gains than would otherwise be expected.
ECONOMIC IMPACT
HOUSEHOLD INCOME
3
Household Income% Change from Previous Year
Household Income
Household IncomeMassachusetts, LTS & U.S.2007-2013
Year
2009 -1.7%
-4.7%
-1.8%
1.8%
0.7%
-2.9%
-2.9%
-1.8%
0.6%
0.3%
-3.1%
-2.0%
-2.2%
-0.3%
0.2%
2010
2011
2012
2013
MA LTS Average US
Households
Household Income
MA LTS Average US
Under $35,000 28.2% 31.2%
42.5% 43.4.%
26.3%
34.1%
22.6%
39.4%
32.5%
$35,000 -$99,999
Above $100,000
$75,000$70,000$65,000
$60,000
$55,000$50,000$45,000
$40,0002007 2008 2009 2010 2011 2012 2013
USMALTS
Data Source for Indicator 3: U.S. Census Bureau, Bureau of Economic Analysis (BEA)
235008_MassTech_MTCIndex - Back 4 - 12/19/14 08:41:36 - Black235008_MassTech_MTCIndex - Back 4 - 12/19/14 08:41:36 - Cyan235008_MassTech_MTCIndex - Back 4 - 12/19/14 08:41:36 - Magenta235008_MassTech_MTCIndex - Back 4 - 12/19/14 08:41:36 - Yellow
Key 2
Key 3
Key 4
Key 5
Key 6
Key 7
Key 8
Key 9
Key 10
Key 11
Key 12
Key 13
Key 14
Key 15
Key 16
Key 17
Key 18
Key 19
Key 21
Key 20
Key 22
KC
MY
M1
M2
M1
M2
M1
M2
M1
M2
M1
M2
M1
M2
M1
M2
M1
M2
M1
M2
M1
M2
M1
M2
2525
M1
M2
25M
1M
225
2525
50M
1M
2M
1M
250
5050
5050
M1
M2
M1
M2
5075
7575
7575
75G
RA
YG
RA
YG
RA
YG
RA
YG
RA
YK
CM
YK
CM
YK
CM
YK
CM
YK
CM
YK
CM
YY
+M
Y+
CC
+M
KC
MY
KC
MY
KC
MY
KP
CM
YK
CM
YK
CM
YK
CM
YK
CM
YK
CM
YK
CM
YG
RA
YK
CM
YM
1M
2M
1M
2M
1M
2M
1M
275
7575
7575
75G
RA
YG
RA
YK
CM
YK
CM
YK
CM
Y
Key 1
KC
MY
M1
M2
50
Key 23 M
1M
2star
starK
CM
Y
Kom
ori/GA
TF
P
art No. K
-28-6(D)
1/2/3/4 K1
2
34
1/2/3/4 C1
2
34
1/2/3/4 M1
2
34
1/2/3/4 M1
1/2/3/4 Y1
2
34
12
34
1/2/3/4 M2
12
34
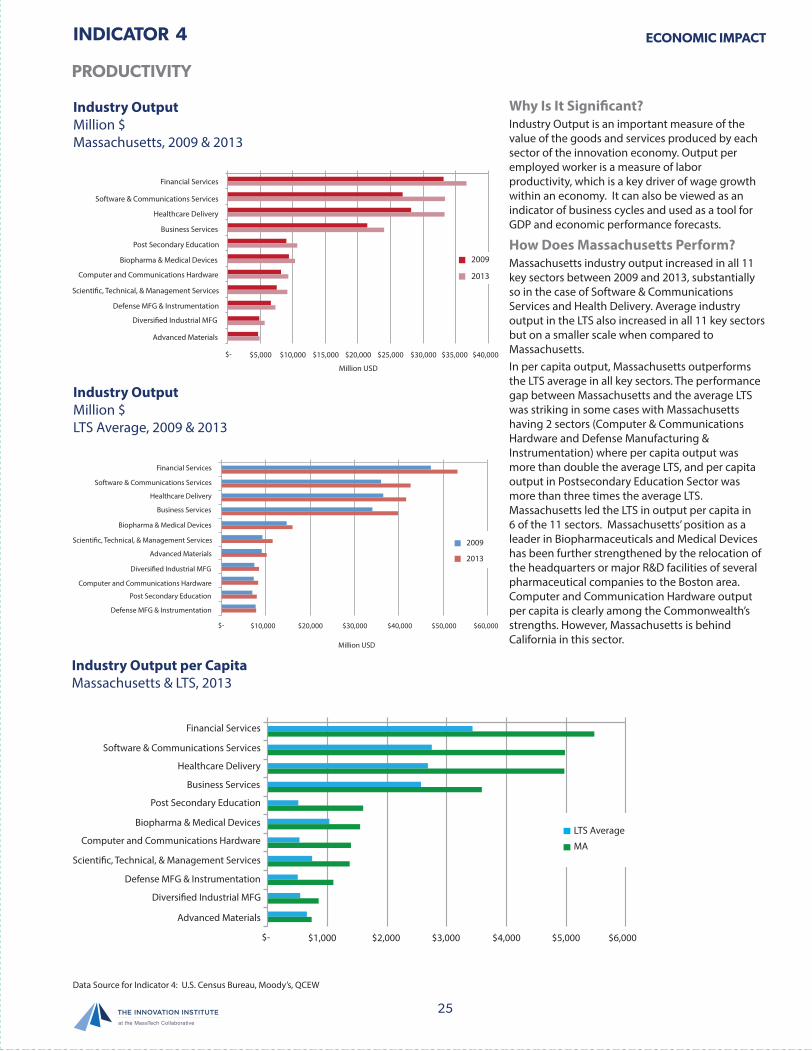
25
INDICATOR
Why Is It Significant?Industry Output is an important measure of the value of the goods and services produced by each sector of the innovation economy. Output per employed worker is a measure of labor productivity, which is a key driver of wage growth within an economy. It can also be viewed as an indicator of business cycles and used as a tool for GDP and economic performance forecasts.
How Does Massachusetts Perform?Massachusetts industry output increased in all 11 key sectors between 2009 and 2013, substantially so in the case of Software & Communications Services and Health Delivery. Average industry output in the LTS also increased in all 11 key sectors but on a smaller scale when compared to Massachusetts.In per capita output, Massachusetts outperforms the LTS average in all key sectors. The performance gap between Massachusetts and the average LTS was striking in some cases with Massachusetts having 2 sectors (Computer & Communications Hardware and Defense Manufacturing & Instrumentation) where per capita output was more than double the average LTS, and per capita output in Postsecondary Education Sector was more than three times the average LTS. Massachusetts led the LTS in output per capita in 6 of the 11 sectors. Massachusetts’ position as a leader in Biopharmaceuticals and Medical Devices has been further strengthened by the relocation of the headquarters or major R&D facilities of several pharmaceutical companies to the Boston area. Computer and Communication Hardware output per capita is clearly among the Commonwealth’s strengths. However, Massachusetts is behind California in this sector.
ECONOMIC IMPACT
PRODUCTIVITY
4
Industry OutputMillion $Massachusetts, 2009 & 2013
Industry OutputMillion $LTS Average, 2009 & 2013
Industry Output per CapitaMassachusetts & LTS, 2013
Industry OutputMillion $Massachusetts, 2009 & 2013
$- $5,000 $10,000 $15,000 $20,000 $25,000 $30,000 $35,000 $40,000
Financial Services
Software & Communications Services
Healthcare Delivery
Business Services
Post Secondary Education
Biopharma & Medical Devices
Computer and Communications Hardware
Scienti�c, Technical, & Management Services
Defense MFG & Instrumentation
Diversi�ed Industrial MFG
Advanced Materials
2009
2013
Million USD
$- $10,000 $20,000 $30,000 $40,000 $50,000 $60,000
Financial Services
Software & Communications Services
Healthcare Delivery
Business Services
Post Secondary Education
Biopharma & Medical Devices
Computer and Communications Hardware
Scienti�c, Technical, & Management Services
Defense MFG & Instrumentation
Diversi�ed Industrial MFG
Advanced Materials2009
2013
Million USD
LTS Average
MA
$- $1,000 $2,000 $3,000 $4,000 $5,000 $6,000
Financial Services
Software & Communications Services
Healthcare Delivery
Business Services
Post Secondary Education
Biopharma & Medical Devices
Computer and Communications Hardware
Scienti�c, Technical, & Management Services
Defense MFG & Instrumentation
Diversi�ed Industrial MFG
Advanced Materials
Data Source for Indicator 4: U.S. Census Bureau, Moody’s, QCEW
MassTech_MTCIndex Sig #10 - Low Folio - Front
MassTech_MTCIndex Sig #11 - Low Folio - Front
MassTech_MTCIndex Sig #12 - Low Folio - Front
MassTech_MTCIndex Sig #13 - Low Folio - Front
235008_MassTech_MTCIndex - Front 4 - 12/19/14 08:41:34 - Black 235008_MassTech_MTCIndex - Front 4 - 12/19/14 08:41:34 - Cyan 235008_MassTech_MTCIndex - Front 4 - 12/19/14 08:41:34 - Magenta 235008_MassTech_MTCIndex - Front 4 - 12/19/14 08:41:34 - Yellow
Key
2K
ey 3
Key
4
Key
5K
ey 6
Key
7K
ey 8
Key
9K
ey 1
0K
ey 1
1K
ey
12
Key
13
Key
14
Key
15
Key
16
Key
17
Key
18
Key
19
Key
21
Key
2
0K
ey 2
2
KC
MY
M1
M2
M1
M2
M1
M2
M1
M2
M1
M2
M1
M2
M1
M2
M1
M2
M1
M2
M1
M2
M1
M2
2525
M1
M2
25M
1M
225
2525
50M
1M
2M
1M
250
5050
5050
M1
M2
M1
M2
5075
7575
7575
75G
RA
YG
RA
YG
RA
YG
RA
YG
RA
YK
CM
YK
CM
YK
CM
YK
CM
YK
CM
YK
CM
YY
+M
Y+
CC
+M
KC
MY
KC
MY
KC
MY
KP
CM
YK
CM
YK
CM
YK
CM
YK
CM
YK
CM
YK
CM
YG
RA
YK
CM
YM
1M
2M
1M
2M
1M
2M
1M
275
7575
7575
75G
RA
YG
RA
YK
CM
YK
CM
YK
CM
Y
Key
1
KC
MY
M1
M2
50
Key
23M
1M
2st
arst
arK
CM
Y
Kom
ori/G
AT
F
Par
t No.
K-2
8-6(
D)
1/2/
3/4
K1
2
34
1/2/
3/4
C1
2
34
1/2/
3/4
M1
2
34
1/2/
3/4
M1
1/2/
3/4
Y1
2
34
12
34
1/2/
3/4
M2
12
34
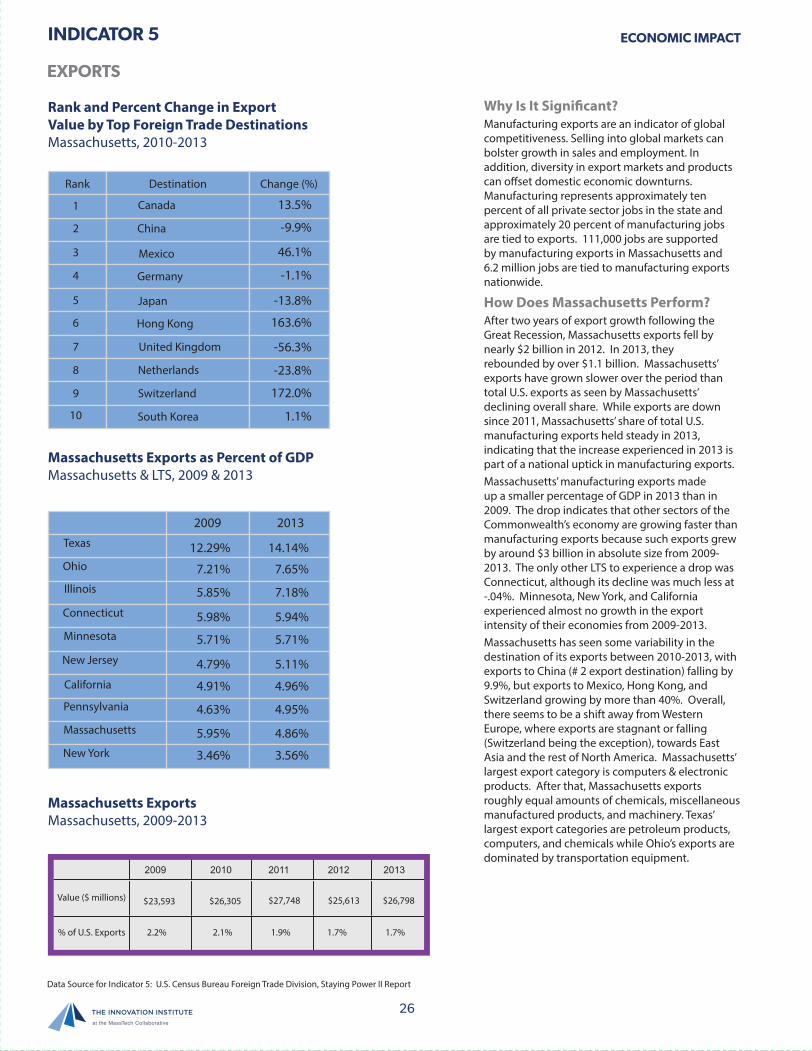
26
INDICATOR
Why Is It Significant?Manufacturing exports are an indicator of global competitiveness. Selling into global markets can bolster growth in sales and employment. In addition, diversity in export markets and products can offset domestic economic downturns. Manufacturing represents approximately ten percent of all private sector jobs in the state and approximately 20 percent of manufacturing jobs are tied to exports. 111,000 jobs are supported by manufacturing exports in Massachusetts and 6.2 million jobs are tied to manufacturing exports nationwide.
How Does Massachusetts Perform?After two years of export growth following the Great Recession, Massachusetts exports fell by nearly $2 billion in 2012. In 2013, they rebounded by over $1.1 billion. Massachusetts’ exports have grown slower over the period than total U.S. exports as seen by Massachusetts’ declining overall share. While exports are down since 2011, Massachusetts’ share of total U.S. manufacturing exports held steady in 2013, indicating that the increase experienced in 2013 is part of a national uptick in manufacturing exports.Massachusetts’ manufacturing exports made up a smaller percentage of GDP in 2013 than in 2009. The drop indicates that other sectors of the Commonwealth’s economy are growing faster than manufacturing exports because such exports grew by around $3 billion in absolute size from 2009-2013. The only other LTS to experience a drop was Connecticut, although its decline was much less at -.04%. Minnesota, New York, and California experienced almost no growth in the export intensity of their economies from 2009-2013.Massachusetts has seen some variability in the destination of its exports between 2010-2013, with exports to China (# 2 export destination) falling by 9.9%, but exports to Mexico, Hong Kong, and Switzerland growing by more than 40%. Overall, there seems to be a shift away from Western Europe, where exports are stagnant or falling (Switzerland being the exception), towards East Asia and the rest of North America. Massachusetts’ largest export category is computers & electronic products. After that, Massachusetts exports roughly equal amounts of chemicals, miscellaneous manufactured products, and machinery. Texas’ largest export categories are petroleum products, computers, and chemicals while Ohio’s exports are dominated by transportation equipment.
ECONOMIC IMPACT
EXPORTS
5
Rank and Percent Change in ExportValue by Top Foreign Trade DestinationsMassachusetts, 2010-2013
Massachusetts Exports as Percent of GDPMassachusetts & LTS, 2009 & 2013
Massachusetts ExportsMassachusetts, 2009-2013
Switzerland
Germany
Mexico
Japan
Hong Kong
South Korea
China
Netherlands
Canada 13.5%
-9.9%
46.1%
-1.1%
-13.8%
163.6%
-56.3%
-23.8%
172.0%
1.1%
United Kingdom
Rank Destination Change (%)
1
2
3
4
5
6
7
8
9
10
Massachusetts
Connecticut
Illinois
Minnesota
New Jersey
New York
Ohio
Pennsylvania
Texas
2009 2013
12.29% 14.14%
7.21% 7.65%
5.85% 7.18%
5.98% 5.94%
5.71% 5.71%
4.79% 5.11%
4.91% 4.96%
4.63% 4.95%
5.95% 4.86%
3.46% 3.56%
California
2009 2010 2011 2012 2013
Value ($ millions)
2.1% 1.9% 1.7% 1.7%2.2%% of U.S. Exports
$23,593 $26,305 $27,748 $25,613 $26,798
Data Source for Indicator 5: U.S. Census Bureau Foreign Trade Division, Staying Power II Report
235008_MassTech_MTCIndex - Back 4 - 12/19/14 08:41:36 - Black235008_MassTech_MTCIndex - Back 4 - 12/19/14 08:41:36 - Cyan235008_MassTech_MTCIndex - Back 4 - 12/19/14 08:41:36 - Magenta235008_MassTech_MTCIndex - Back 4 - 12/19/14 08:41:36 - YellowK
ey 2K
ey 3K
ey 4K
ey 5K
ey 6K
ey 7K
ey 8K
ey 9K
ey 10K
ey 11K
ey 12K
ey 13K
ey 14K
ey 15K
ey 16K
ey 17K
ey 18K
ey 19K
ey 21K
ey 20K
ey 22
KC
MY
M1
M2
M1
M2
M1
M2
M1
M2
M1
M2
M1
M2
M1
M2
M1
M2
M1
M2
M1
M2
M1
M2
2525
M1
M2
25M
1M
225
2525
50M
1M
2M
1M
250
5050
5050
M1
M2
M1
M2
5075
7575
7575
75G
RA
YG
RA
YG
RA
YG
RA
YG
RA
YK
CM
YK
CM
YK
CM
YK
CM
YK
CM
YK
CM
YY
+M
Y+
CC
+M
KC
MY
KC
MY
KC
MY
KP
CM
YK
CM
YK
CM
YK
CM
YK
CM
YK
CM
YK
CM
YG
RA
YK
CM
YM
1M
2M
1M
2M
1M
2M
1M
275
7575
7575
75G
RA
YG
RA
YK
CM
YK
CM
YK
CM
Y
Key 1
KC
MY
M1
M2
50
Key 23 M
1M
2star
starK
CM
Y
Kom
ori/GA
TF
P
art No. K
-28-6(D)
1/2/3/4 K1
2
34
1/2/3/4 C1
2
34
1/2/3/4 M1
2
34
1/2/3/4 M1
1/2/3/4 Y1
2
34
12
34
1/2/3/4 M2
12
34
RESEARCH
The Index defines innovation as the capacity tocontinuously translate ideas into novel products, processes and services that create, improve or expandbusiness opportunities. The massive and diversifiedresearch enterprise concentrated in Massachusetts’ universities, teaching hospitals and government and industry laboratories is a major source of new ideas that fuel the innovation process. Research activity occurs on a spectrum that ranges from curiosity-driven fundamental science, whose application oftenbecomes evident once the research has started, toapplication-inspired research, which starts withbetter defined problems or commercial goals in mind.Academic publications and patenting activity reflectboth the intensity of new knowledge creation and thecapacity of the Massachusetts economy to make theseideas available for dissemination andcommercialization.
INDICATORS 6-9
MassTech_MTCIndex Sig #14 - Low Folio - Front
MassTech_MTCIndex Sig #15 - Low Folio - Front
MassTech_MTCIndex Sig #16 - Low Folio - Front
MassTech_MTCIndex Sig #17 - Low Folio - Front235008_MassTech_MTCIndex - Front 5 - 12/19/14 08:41:38 - Black 235008_MassTech_MTCIndex - Front 5 - 12/19/14 08:41:38 - Cyan 235008_MassTech_MTCIndex - Front 5 - 12/19/14 08:41:38 - Magenta 235008_MassTech_MTCIndex - Front 5 - 12/19/14 08:41:38 - Yellow
Key
2K
ey 3
Key
4
Key
5K
ey 6
Key
7K
ey 8
Key
9K
ey 1
0K
ey 1
1K
ey
12
Key
13
Key
14
Key
15
Key
16
Key
17
Key
18
Key
19
Key
21
Key
2
0K
ey 2
2
KC
MY
M1
M2
M1
M2
M1
M2
M1
M2
M1
M2
M1
M2
M1
M2
M1
M2
M1
M2
M1
M2
M1
M2
2525
M1
M2
25M
1M
225
2525
50M
1M
2M
1M
250
5050
5050
M1
M2
M1
M2
5075
7575
7575
75G
RA
YG
RA
YG
RA
YG
RA
YG
RA
YK
CM
YK
CM
YK
CM
YK
CM
YK
CM
YK
CM
YY
+M
Y+
CC
+M
KC
MY
KC
MY
KC
MY
KP
CM
YK
CM
YK
CM
YK
CM
YK
CM
YK
CM
YK
CM
YG
RA
YK
CM
YM
1M
2M
1M
2M
1M
2M
1M
275
7575
7575
75G
RA
YG
RA
YK
CM
YK
CM
YK
CM
Y
Key
1
KC
MY
M1
M2
50
Key
23M
1M
2st
arst
arK
CM
Y
Kom
ori/G
AT
F
Par
t No.
K-2
8-6(
D)
1/2/
3/4
K1
2
34
1/2/
3/4
C1
2
34
1/2/
3/4
M1
2
34
1/2/
3/4
M1
1/2/
3/4
Y1
2
34
12
34
1/2/
3/4
M2
12
34
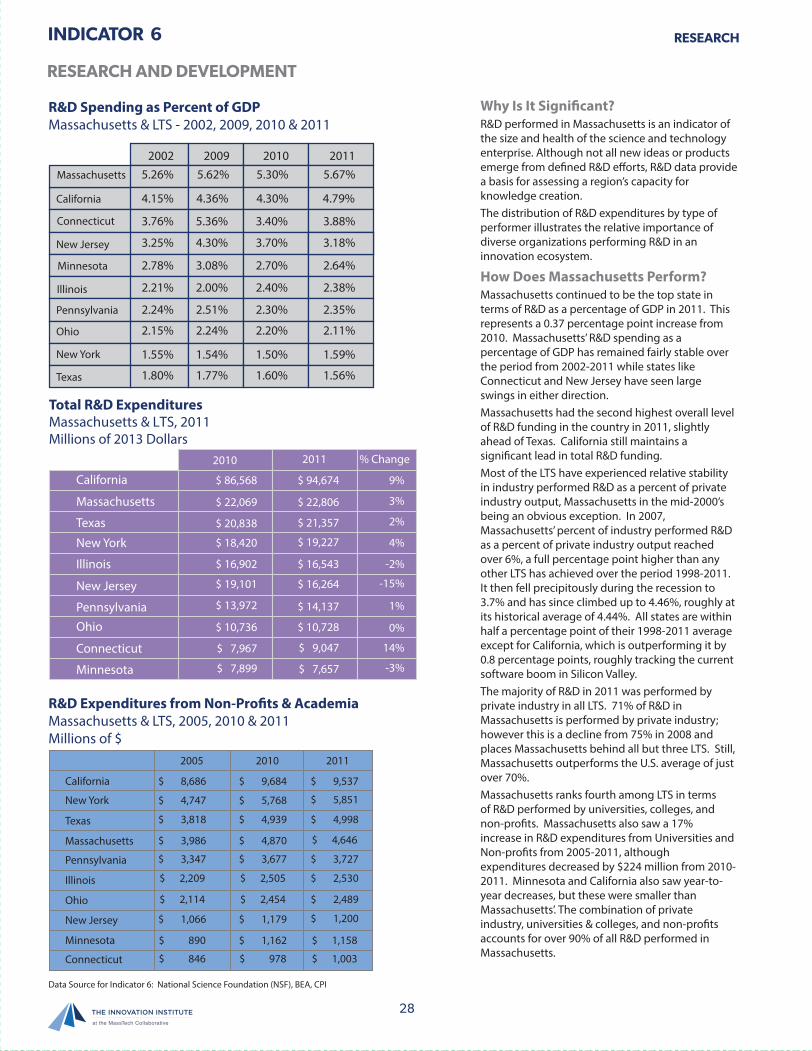
28
INDICATOR
Why Is It Significant?R&D performed in Massachusetts is an indicator of the size and health of the science and technology enterprise. Although not all new ideas or products emerge from defined R&D efforts, R&D data provide a basis for assessing a region’s capacity for knowledge creation.The distribution of R&D expenditures by type of performer illustrates the relative importance of diverse organizations performing R&D in an innovation ecosystem.
How Does Massachusetts Perform?Massachusetts continued to be the top state in terms of R&D as a percentage of GDP in 2011. This represents a 0.37 percentage point increase from 2010. Massachusetts’ R&D spending as a percentage of GDP has remained fairly stable over the period from 2002-2011 while states like Connecticut and New Jersey have seen large swings in either direction. Massachusetts had the second highest overall level of R&D funding in the country in 2011, slightly ahead of Texas. California still maintains a significant lead in total R&D funding.Most of the LTS have experienced relative stability in industry performed R&D as a percent of private industry output, Massachusetts in the mid-2000’s being an obvious exception. In 2007, Massachusetts’ percent of industry performed R&D as a percent of private industry output reached over 6%, a full percentage point higher than any other LTS has achieved over the period 1998-2011.It then fell precipitously during the recession to 3.7% and has since climbed up to 4.46%, roughly at its historical average of 4.44%. All states are within half a percentage point of their 1998-2011 average except for California, which is outperforming it by 0.8 percentage points, roughly tracking the current software boom in Silicon Valley. The majority of R&D in 2011 was performed by private industry in all LTS. 71% of R&D in Massachusetts is performed by private industry; however this is a decline from 75% in 2008 and places Massachusetts behind all but three LTS. Still, Massachusetts outperforms the U.S. average of just over 70%. Massachusetts ranks fourth among LTS in terms of R&D performed by universities, colleges, and non-profits. Massachusetts also saw a 17% increase in R&D expenditures from Universities and Non-profits from 2005-2011, although expenditures decreased by $224 million from 2010-2011. Minnesota and California also saw year-to-year decreases, but these were smaller than Massachusetts’. The combination of private industry, universities & colleges, and non-profits accounts for over 90% of all R&D performed in Massachusetts.
R&D Spending as Percent of GDPMassachusetts & LTS - 2002, 2009, 2010 & 2011
Total R&D Expenditures Massachusetts & LTS, 2011 Millions of 2013 Dollars
R&D Expenditures from Non-Profits & AcademiaMassachusetts & LTS, 2005, 2010 & 2011Millions of $
6
RESEARCH AND DEVELOPMENT
RESEARCH
California
Massachusetts
Connecticut
Illinois
Minnesota
New Jersey
New York
Ohio
Pennsylvania
Texas
2002 2009 2010 20115.26%
4.15%
3.76% 5.36% 3.40% 3.88%
3.25% 4.30% 3.70% 3.18%
2.78% 3.08% 2.70% 2.64%
2.21% 2.00% 2.40% 2.38%
2.24% 2.51% 2.30% 2.35%
2.15% 2.24% 2.20% 2.11%
1.55% 1.54% 1.50% 1.59%
1.80% 1.77% 1.60% 1.56%
4.36% 4.30% 4.79%
5.62% 5.30% 5.67%
California
2010
$ 86,568
$ 22,069
$ 20,838
$ 18,420
$ 16,902
$ 19,101
$ 13,972
$ 10,736
$ 7,967
$ 7,899
$ 94,674
$ 22,806
$ 21,357
$ 19,227
$ 16,543
$ 16,264
$ 14,137
$ 10,728
$ 9,047
$ 7,657
9%
3%
2%
4%
-2%
-15%
1%
0%
14%
-3%
2011 % Change
Massachusetts
Texas
New York
Illinois
New Jersey
PennsylvaniaOhio
Connecticut
Minnesota
California
New York
Texas
Massachusetts
Pennsylvania
Illinois
Ohio
New Jersey
Minnesota
Connecticut
2005
$ 9,684
$ 5,768
$ 4,870
$ 3,677
$ 2,505
$ 2,454
$ 1,179
$ 1,162
$ 978
$ 4,939
$ 8,686
$ 4,747
$ 3,986
$ 3,347
$ 2,209
$ 2,114
$ 1,066
$ 890
$ 846
$ 3,818
$ 9,537
$ 5,851
$ 4,998
$ 4,646
$ 3,727
$ 2,530
$ 2,489
$ 1,200
$ 1,158
$ 1,003
2010 2011
Data Source for Indicator 6: National Science Foundation (NSF), BEA, CPI
235008_MassTech_MTCIndex - Back 5 - 12/19/14 08:41:40 - Black235008_MassTech_MTCIndex - Back 5 - 12/19/14 08:41:40 - Cyan235008_MassTech_MTCIndex - Back 5 - 12/19/14 08:41:40 - Magenta235008_MassTech_MTCIndex - Back 5 - 12/19/14 08:41:40 - Yellow
Key 2
Key 3
Key 4
Key 5
Key 6
Key 7
Key 8
Key 9
Key 10
Key 11
Key 12
Key 13
Key 14
Key 15
Key 16
Key 17
Key 18
Key 19
Key 21
Key 20
Key 22
KC
MY
M1
M2
M1
M2
M1
M2
M1
M2
M1
M2
M1
M2
M1
M2
M1
M2
M1
M2
M1
M2
M1
M2
2525
M1
M2
25M
1M
225
2525
50M
1M
2M
1M
250
5050
5050
M1
M2
M1
M2
5075
7575
7575
75G
RA
YG
RA
YG
RA
YG
RA
YG
RA
YK
CM
YK
CM
YK
CM
YK
CM
YK
CM
YK
CM
YY
+M
Y+
CC
+M
KC
MY
KC
MY
KC
MY
KP
CM
YK
CM
YK
CM
YK
CM
YK
CM
YK
CM
YK
CM
YG
RA
YK
CM
YM
1M
2M
1M
2M
1M
2M
1M
275
7575
7575
75G
RA
YG
RA
YK
CM
YK
CM
YK
CM
Y
Key 1
KC
MY
M1
M2
50
Key 23 M
1M
2star
starK
CM
Y
Kom
ori/GA
TF
P
art No. K
-28-6(D)
1/2/3/4 K1
2
34
1/2/3/4 C1
2
34
1/2/3/4 M1
2
34
1/2/3/4 M1
1/2/3/4 Y1
2
34
12
34
1/2/3/4 M2
12
34

29
INDICATOR RESEARCH
Industry-Performed R&D Percent of Private Industry OutputMassachusetts & LTS, 1998-2011
Distribution of R&D by PerformerMassachusetts, LTS & U.S., 2011
R&D ExpendituresMassachusetts, 2010 & 2011
6
RESEARCH AND DEVELOPMENT
7.00
6.00
5.00
4.00
3.00
2.00
1.00
0.00
California
Connecticut
Illinois
Massachusetts
Minnesota
New Jersey
New York
Ohio
Pennsylvania
Texas
1998 1999 2000 2001 2002 2003 2004 2005 2006 2007 2008 2009 2010 2011
100%
80%
60%
40%
20%
0%CA MA TX NJ NY IL PA OH CT MT US
Federal Business Other Nonpro�tsFederally FundedR&D Centers
Universities and Colleges
Performing Sector
Federal Federal
Federal
Non-Federal
Non-Federal
Own Funds
Federally Funded R&D
Centers
Business
Universities & Colleges
Non-Profit Institutions
Total $
$
$
$
$
$
$
$
$
$
$
$
$
Federal
Federal
Other Government
Universities & Colleges
Non-Profit
Federal
Business
Source of Funding Expenditures 2010 Expenditures 2011
892,000,000 $ 541,000,000
$ 1,340,000,000
$ 3,000,000
$ 13,201,000,000
$ 954,000,000
$ 2,171,000,000
$ 2,281,000,000
$ 18,000,000
$ 199,000,000
$ 257,000,000
$ 308,000,000
$ 1,596,000,000
840,000,000
4,000,000
11,900,000,000
1,151,000,000
1,927,000,000
2,147,000,000
26,000,000
198,000,000
256,000,000
311,000,000
1,924,000,000
21,576,000,000 $ 22,869,000,000
MassTech_MTCIndex Sig #14 - Low Folio - Front
MassTech_MTCIndex Sig #15 - Low Folio - Front
MassTech_MTCIndex Sig #16 - Low Folio - Front
MassTech_MTCIndex Sig #17 - Low Folio - Front
235008_MassTech_MTCIndex - Front 5 - 12/19/14 08:41:38 - Black 235008_MassTech_MTCIndex - Front 5 - 12/19/14 08:41:38 - Cyan 235008_MassTech_MTCIndex - Front 5 - 12/19/14 08:41:38 - Magenta 235008_MassTech_MTCIndex - Front 5 - 12/19/14 08:41:38 - Yellow
Key
2K
ey 3
Key
4
Key
5K
ey 6
Key
7K
ey 8
Key
9K
ey 1
0K
ey 1
1K
ey
12
Key
13
Key
14
Key
15
Key
16
Key
17
Key
18
Key
19
Key
21
Key
2
0K
ey 2
2
KC
MY
M1
M2
M1
M2
M1
M2
M1
M2
M1
M2
M1
M2
M1
M2
M1
M2
M1
M2
M1
M2
M1
M2
2525
M1
M2
25M
1M
225
2525
50M
1M
2M
1M
250
5050
5050
M1
M2
M1
M2
5075
7575
7575
75G
RA
YG
RA
YG
RA
YG
RA
YG
RA
YK
CM
YK
CM
YK
CM
YK
CM
YK
CM
YK
CM
YY
+M
Y+
CC
+M
KC
MY
KC
MY
KC
MY
KP
CM
YK
CM
YK
CM
YK
CM
YK
CM
YK
CM
YK
CM
YG
RA
YK
CM
YM
1M
2M
1M
2M
1M
2M
1M
275
7575
7575
75G
RA
YG
RA
YK
CM
YK
CM
YK
CM
Y
Key
1
KC
MY
M1
M2
50
Key
23M
1M
2st
arst
arK
CM
Y
Kom
ori/G
AT
F
Par
t No.
K-2
8-6(
D)
1/2/
3/4
K1
2
34
1/2/
3/4
C1
2
34
1/2/
3/4
M1
2
34
1/2/
3/4
M1
1/2/
3/4
Y1
2
34
12
34
1/2/
3/4
M2
12
34
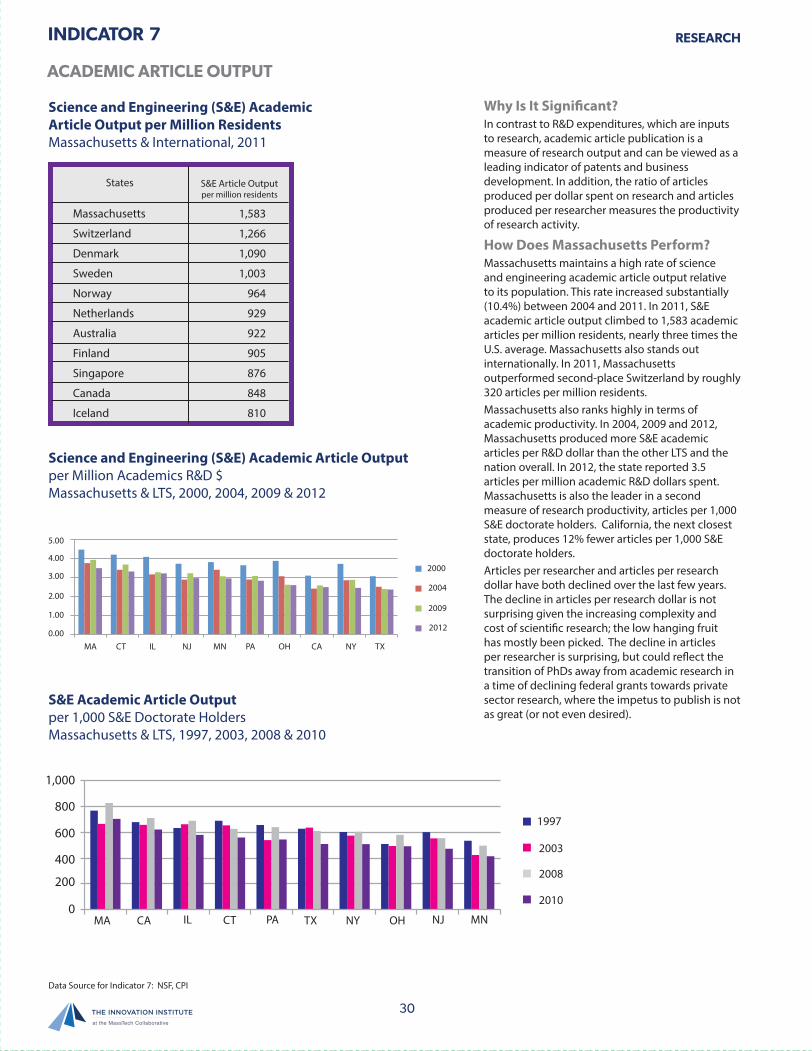
30
INDICATOR
ACADEMIC ARTICLE OUTPUT
7
Why Is It Significant?In contrast to R&D expenditures, which are inputs to research, academic article publication is a measure of research output and can be viewed as a leading indicator of patents and business development. In addition, the ratio of articles produced per dollar spent on research and articles produced per researcher measures the productivity of research activity.
How Does Massachusetts Perform?Massachusetts maintains a high rate of science and engineering academic article output relative to its population. This rate increased substantially (10.4%) between 2004 and 2011. In 2011, S&E academic article output climbed to 1,583 academic articles per million residents, nearly three times the U.S. average. Massachusetts also stands out internationally. In 2011, Massachusetts outperformed second-place Switzerland by roughly 320 articles per million residents.Massachusetts also ranks highly in terms of academic productivity. In 2004, 2009 and 2012, Massachusetts produced more S&E academic articles per R&D dollar than the other LTS and the nation overall. In 2012, the state reported 3.5 articles per million academic R&D dollars spent. Massachusetts is also the leader in a second measure of research productivity, articles per 1,000 S&E doctorate holders. California, the next closest state, produces 12% fewer articles per 1,000 S&E doctorate holders. Articles per researcher and articles per research dollar have both declined over the last few years. The decline in articles per research dollar is not surprising given the increasing complexity and cost of scientific research; the low hanging fruit has mostly been picked. The decline in articles per researcher is surprising, but could reflect the transition of PhDs away from academic research in a time of declining federal grants towards private sector research, where the impetus to publish is not as great (or not even desired).
Science and Engineering (S&E) AcademicArticle Output per Million ResidentsMassachusetts & International, 2011
Science and Engineering (S&E) Academic Article Output per Million Academics R&D $Massachusetts & LTS, 2000, 2004, 2009 & 2012
S&E Academic Article Output per 1,000 S&E Doctorate Holders Massachusetts & LTS, 1997, 2003, 2008 & 2010
RESEARCH
Massachusetts
Switzerland
Denmark
Sweden
Norway
Netherlands
Australia
Finland
Singapore
Canada
Iceland
1,583
1,266
1,090
1,003
964
929
922
905
876
848
810
States S&E Article Outputper million residents
2000
2004
2009
2012
MA
5.00
4.00
3.00
2.00
1.00
0.00CT IL NJ MN PA OH CA NY TX
2003
2008
2010
1,000
800
600
400
200
0
1997
MA CTIL NJ MNPA OHCA NYTX
Data Source for Indicator 7: NSF, CPI
235008_MassTech_MTCIndex - Back 5 - 12/19/14 08:41:40 - Black235008_MassTech_MTCIndex - Back 5 - 12/19/14 08:41:40 - Cyan235008_MassTech_MTCIndex - Back 5 - 12/19/14 08:41:40 - Magenta235008_MassTech_MTCIndex - Back 5 - 12/19/14 08:41:40 - Yellow
Key 2
Key 3
Key 4
Key 5
Key 6
Key 7
Key 8
Key 9
Key 10
Key 11
Key 12
Key 13
Key 14
Key 15
Key 16
Key 17
Key 18
Key 19
Key 21
Key 20
Key 22
KC
MY
M1
M2
M1
M2
M1
M2
M1
M2
M1
M2
M1
M2
M1
M2
M1
M2
M1
M2
M1
M2
M1
M2
2525
M1
M2
25M
1M
225
2525
50M
1M
2M
1M
250
5050
5050
M1
M2
M1
M2
5075
7575
7575
75G
RA
YG
RA
YG
RA
YG
RA
YG
RA
YK
CM
YK
CM
YK
CM
YK
CM
YK
CM
YK
CM
YY
+M
Y+
CC
+M
KC
MY
KC
MY
KC
MY
KP
CM
YK
CM
YK
CM
YK
CM
YK
CM
YK
CM
YK
CM
YG
RA
YK
CM
YM
1M
2M
1M
2M
1M
2M
1M
275
7575
7575
75G
RA
YG
RA
YK
CM
YK
CM
YK
CM
Y
Key 1
KC
MY
M1
M2
50
Key 23 M
1M
2star
starK
CM
Y
Kom
ori/GA
TF
P
art No. K
-28-6(D)
1/2/3/4 K1
2
34
1/2/3/4 C1
2
34
1/2/3/4 M1
2
34
1/2/3/4 M1
1/2/3/4 Y1
2
34
12
34
1/2/3/4 M2
12
34
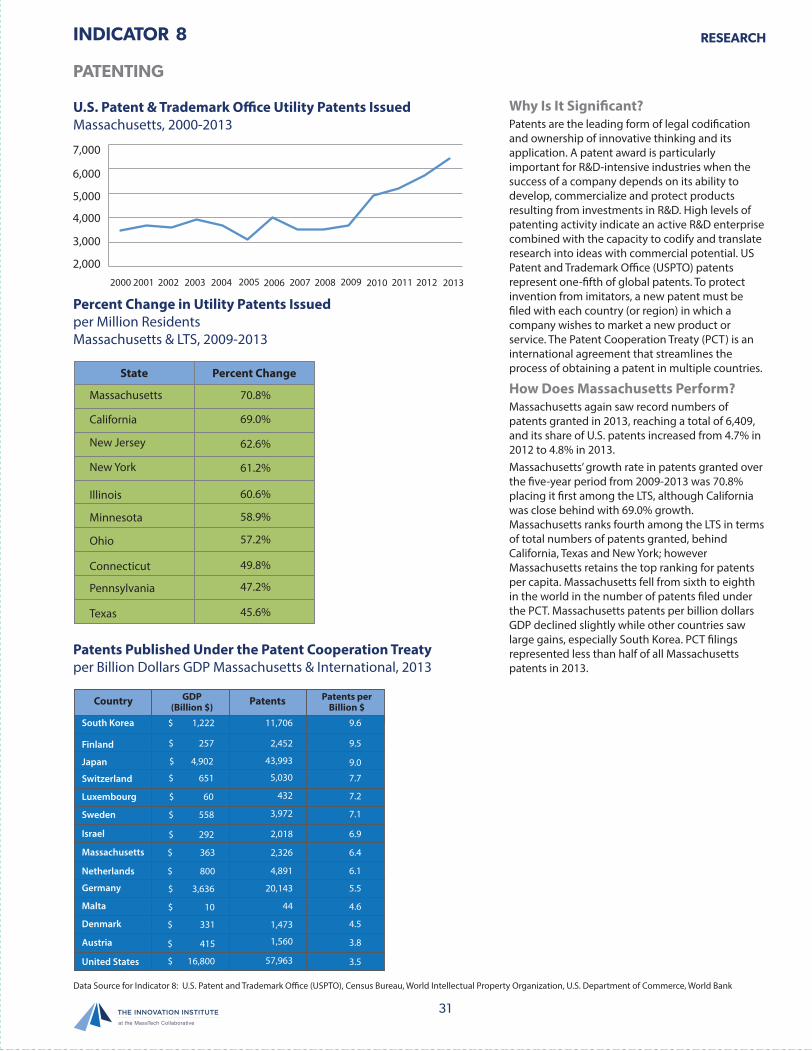
31
INDICATOR
PATENTING
8
U.S. Patent & Trademark Office Utility Patents IssuedMassachusetts, 2000-2013
Percent Change in Utility Patents Issuedper Million ResidentsMassachusetts & LTS, 2009-2013
Patents Published Under the Patent Cooperation Treatyper Billion Dollars GDP Massachusetts & International, 2013
RESEARCH
Why Is It Significant?Patents are the leading form of legal codification and ownership of innovative thinking and its application. A patent award is particularly important for R&D-intensive industries when the success of a company depends on its ability to develop, commercialize and protect products resulting from investments in R&D. High levels of patenting activity indicate an active R&D enterprise combined with the capacity to codify and translate research into ideas with commercial potential. US Patent and Trademark Office (USPTO) patents represent one-fifth of global patents. To protect invention from imitators, a new patent must be filed with each country (or region) in which a company wishes to market a new product or service. The Patent Cooperation Treaty (PCT) is an international agreement that streamlines the process of obtaining a patent in multiple countries.
How Does Massachusetts Perform?Massachusetts again saw record numbers of patents granted in 2013, reaching a total of 6,409, and its share of U.S. patents increased from 4.7% in 2012 to 4.8% in 2013. Massachusetts’ growth rate in patents granted over the five-year period from 2009-2013 was 70.8% placing it first among the LTS, although California was close behind with 69.0% growth. Massachusetts ranks fourth among the LTS in terms of total numbers of patents granted, behind California, Texas and New York; however Massachusetts retains the top ranking for patents per capita. Massachusetts fell from sixth to eighth in the world in the number of patents filed under the PCT. Massachusetts patents per billion dollars GDP declined slightly while other countries saw large gains, especially South Korea. PCT filings represented less than half of all Massachusetts patents in 2013.
7,000
6,000
5,000
4,000
3,000
2,0002001 20022000 2003 2004 2005 2006 2007 2008 2009 2010 2011 2012 2013
State
Massachusetts 70.8%
69.0%
62.6%
61.2%
60.6%
58.9%
57.2%
49.8%
47.2%
45.6%
California
New Jersey
New York
Illinois
Minnesota
Ohio
Connecticut
Pennsylvania
Texas
Percent Change
Country
South Korea $ 1,222 11,706 9.6
9.5
9.0
7.7
7.2
7.1
6.9
6.4
6.1
5.5
4.6
4.5
3.8
3.5
2,452
43,993
5,030
432
3,972
2,018
2,326
4,891
20,143
44
1,473
1,560
57,963
$ 257
$ 651
$ 4,902
$ 60
$ 558
$ 292
$ 363
$ 800
$ 3,636
$ 10
$ 331
$ 415
$ 16,800
Finland
Japan
Switzerland
Luxembourg
Sweden
Israel
Massachusetts
Netherlands
Germany
Malta
Austria
Denmark
United States
PatentsGDP(Billion $)
Patents perBillion $
Data Source for Indicator 8: U.S. Patent and Trademark Office (USPTO), Census Bureau, World Intellectual Property Organization, U.S. Department of Commerce, World Bank
MassTech_MTCIndex Sig #14 - Low Folio - Front
MassTech_MTCIndex Sig #15 - Low Folio - Front
MassTech_MTCIndex Sig #16 - Low Folio - Front
MassTech_MTCIndex Sig #17 - Low Folio - Front235008_MassTech_MTCIndex - Front 5 - 12/19/14 08:41:38 - Black 235008_MassTech_MTCIndex - Front 5 - 12/19/14 08:41:38 - Cyan 235008_MassTech_MTCIndex - Front 5 - 12/19/14 08:41:38 - Magenta 235008_MassTech_MTCIndex - Front 5 - 12/19/14 08:41:38 - Yellow
Key
2K
ey 3
Key
4
Key
5K
ey 6
Key
7K
ey 8
Key
9K
ey 1
0K
ey 1
1K
ey
12
Key
13
Key
14
Key
15
Key
16
Key
17
Key
18
Key
19
Key
21
Key
2
0K
ey 2
2
KC
MY
M1
M2
M1
M2
M1
M2
M1
M2
M1
M2
M1
M2
M1
M2
M1
M2
M1
M2
M1
M2
M1
M2
2525
M1
M2
25M
1M
225
2525
50M
1M
2M
1M
250
5050
5050
M1
M2
M1
M2
5075
7575
7575
75G
RA
YG
RA
YG
RA
YG
RA
YG
RA
YK
CM
YK
CM
YK
CM
YK
CM
YK
CM
YK
CM
YY
+M
Y+
CC
+M
KC
MY
KC
MY
KC
MY
KP
CM
YK
CM
YK
CM
YK
CM
YK
CM
YK
CM
YK
CM
YG
RA
YK
CM
YM
1M
2M
1M
2M
1M
2M
1M
275
7575
7575
75G
RA
YG
RA
YK
CM
YK
CM
YK
CM
Y
Key
1
KC
MY
M1
M2
50
Key
23M
1M
2st
arst
arK
CM
Y
Kom
ori/G
AT
F
Par
t No.
K-2
8-6(
D)
1/2/
3/4
K1
2
34
1/2/
3/4
C1
2
34
1/2/
3/4
M1
2
34
1/2/
3/4
M1
1/2/
3/4
Y1
2
34
12
34
1/2/
3/4
M2
12
34
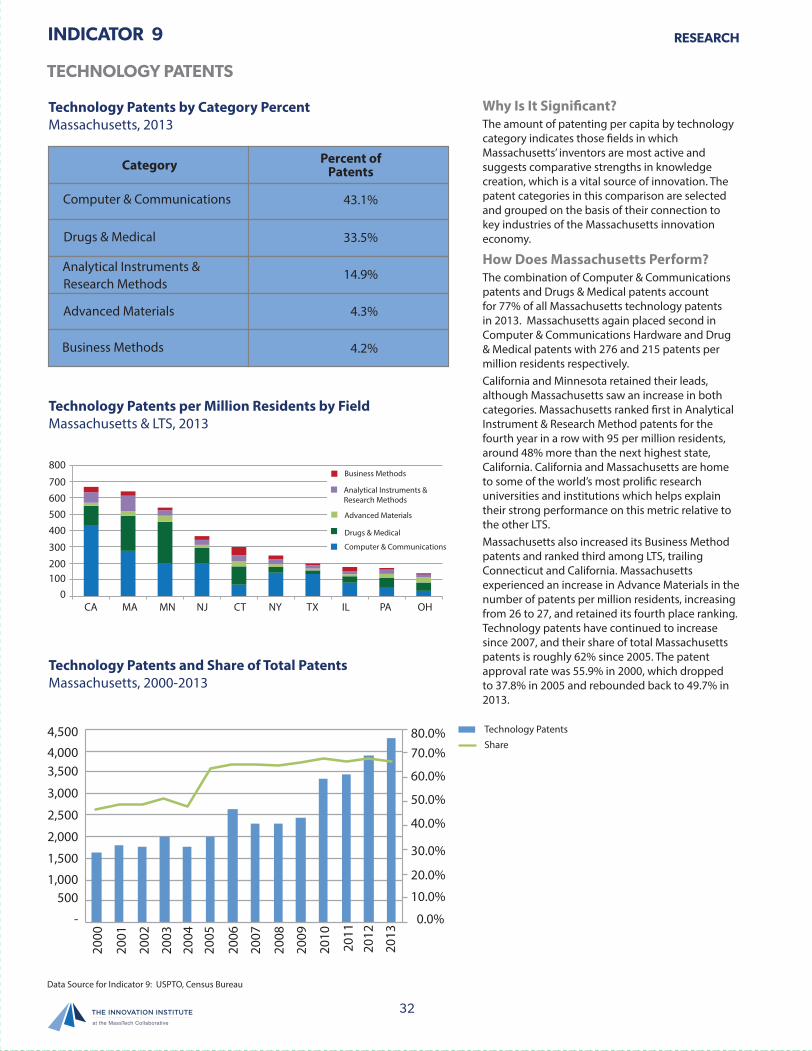
32
INDICATOR
Why Is It Significant?The amount of patenting per capita by technology category indicates those fields in which Massachusetts’ inventors are most active and suggests comparative strengths in knowledge creation, which is a vital source of innovation. The patent categories in this comparison are selected and grouped on the basis of their connection to key industries of the Massachusetts innovation economy.
How Does Massachusetts Perform?The combination of Computer & Communications patents and Drugs & Medical patents account for 77% of all Massachusetts technology patents in 2013. Massachusetts again placed second in Computer & Communications Hardware and Drug & Medical patents with 276 and 215 patents per million residents respectively. California and Minnesota retained their leads, although Massachusetts saw an increase in both categories. Massachusetts ranked first in AnalyticalInstrument & Research Method patents for the fourth year in a row with 95 per million residents, around 48% more than the next highest state, California. California and Massachusetts are home to some of the world’s most prolific research universities and institutions which helps explain their strong performance on this metric relative to the other LTS.Massachusetts also increased its Business Method patents and ranked third among LTS, trailing Connecticut and California. Massachusetts experienced an increase in Advance Materials in the number of patents per million residents, increasing from 26 to 27, and retained its fourth place ranking.Technology patents have continued to increase since 2007, and their share of total Massachusetts patents is roughly 62% since 2005. The patent approval rate was 55.9% in 2000, which dropped to 37.8% in 2005 and rebounded back to 49.7% in 2013.
RESEARCH
TECHNOLOGY PATENTS
9
Technology Patents by Category PercentMassachusetts, 2013
Technology Patents per Million Residents by FieldMassachusetts & LTS, 2013
Technology Patents and Share of Total PatentsMassachusetts, 2000-2013
Research Methods
Category Percent of Patents
43.1%
33.5%
14.9%
4.3%
4.2%
Computer & Communications
Advanced Materials
Business Methods
Drugs & Medical
Analytical Instruments &
800
700600500400
300200100
0
Business Methods
Advanced Materials
Drugs & Medical
Computer & Communications
Analytical Instruments &Research Methods
CA MA MN NJ CT NY TX IL PA OH
4,500
4,0003,500
3,000
2,500
2,000
1,500
1,000500
-
80.0%70.0%
60.0%
50.0%
40.0%
30.0%
20.0%
10.0%
0.0%
Technology Patents
Share
Data Source for Indicator 9: USPTO, Census Bureau
235008_MassTech_MTCIndex - Back 5 - 12/19/14 08:41:40 - Black235008_MassTech_MTCIndex - Back 5 - 12/19/14 08:41:40 - Cyan235008_MassTech_MTCIndex - Back 5 - 12/19/14 08:41:40 - Magenta235008_MassTech_MTCIndex - Back 5 - 12/19/14 08:41:40 - Yellow
Key 2
Key 3
Key 4
Key 5
Key 6
Key 7
Key 8
Key 9
Key 10
Key 11
Key 12
Key 13
Key 14
Key 15
Key 16
Key 17
Key 18
Key 19
Key 21
Key 20
Key 22
KC
MY
M1
M2
M1
M2
M1
M2
M1
M2
M1
M2
M1
M2
M1
M2
M1
M2
M1
M2
M1
M2
M1
M2
2525
M1
M2
25M
1M
225
2525
50M
1M
2M
1M
250
5050
5050
M1
M2
M1
M2
5075
7575
7575
75G
RA
YG
RA
YG
RA
YG
RA
YG
RA
YK
CM
YK
CM
YK
CM
YK
CM
YK
CM
YK
CM
YY
+M
Y+
CC
+M
KC
MY
KC
MY
KC
MY
KP
CM
YK
CM
YK
CM
YK
CM
YK
CM
YK
CM
YK
CM
YG
RA
YK
CM
YM
1M
2M
1M
2M
1M
2M
1M
275
7575
7575
75G
RA
YG
RA
YK
CM
YK
CM
YK
CM
Y
Key 1
KC
MY
M1
M2
50
Key 23 M
1M
2star
starK
CM
Y
Kom
ori/GA
TF
P
art No. K
-28-6(D)
1/2/3/4 K1
2
34
1/2/3/4 C1
2
34
1/2/3/4 M1
2
34
1/2/3/4 M1
1/2/3/4 Y1
2
34
12
34
1/2/3/4 M2
12
34
TECHNOLOGY DEVELOPMENT
In close interaction with research activities, but with a specific application as a goal, product development begins with research outcomes and translates them into models, prototypes, tests and artifacts that help evaluate and refine the plausibility, feasibility, performance and market potential of a research outcome. One way in which universities, hospitals and other research institutions make new ideas available for commercialization by businesses and entrepreneurs is through technology licensing. Small Business Innovation Research (SBIR) and Technology Transfer (STTR) grants enable small companies to test, evaluate and refine new technologies and products. In the medical device and biopharma industries, both significant contributors to the Massachusetts innovation economy, regulatory approval of new products is an important milestone in the product development process.
INDICATORS 10-11
MassTech_MTCIndex Sig #14 - Low Folio - Front
MassTech_MTCIndex Sig #15 - Low Folio - Front
MassTech_MTCIndex Sig #16 - Low Folio - Front
MassTech_MTCIndex Sig #17 - Low Folio - Front
235008_MassTech_MTCIndex - Front 5 - 12/19/14 08:41:38 - Black 235008_MassTech_MTCIndex - Front 5 - 12/19/14 08:41:38 - Cyan 235008_MassTech_MTCIndex - Front 5 - 12/19/14 08:41:38 - Magenta 235008_MassTech_MTCIndex - Front 5 - 12/19/14 08:41:38 - Yellow
Key
2K
ey 3
Key
4
Key
5K
ey 6
Key
7K
ey 8
Key
9K
ey 1
0K
ey 1
1K
ey
12
Key
13
Key
14
Key
15
Key
16
Key
17
Key
18
Key
19
Key
21
Key
2
0K
ey 2
2
KC
MY
M1
M2
M1
M2
M1
M2
M1
M2
M1
M2
M1
M2
M1
M2
M1
M2
M1
M2
M1
M2
M1
M2
2525
M1
M2
25M
1M
225
2525
50M
1M
2M
1M
250
5050
5050
M1
M2
M1
M2
5075
7575
7575
75G
RA
YG
RA
YG
RA
YG
RA
YG
RA
YK
CM
YK
CM
YK
CM
YK
CM
YK
CM
YK
CM
YY
+M
Y+
CC
+M
KC
MY
KC
MY
KC
MY
KP
CM
YK
CM
YK
CM
YK
CM
YK
CM
YK
CM
YK
CM
YG
RA
YK
CM
YM
1M
2M
1M
2M
1M
2M
1M
275
7575
7575
75G
RA
YG
RA
YK
CM
YK
CM
YK
CM
Y
Key
1
KC
MY
M1
M2
50
Key
23M
1M
2st
arst
arK
CM
Y
Kom
ori/G
AT
F
Par
t No.
K-2
8-6(
D)
1/2/
3/4
K1
2
34
1/2/
3/4
C1
2
34
1/2/
3/4
M1
2
34
1/2/
3/4
M1
1/2/
3/4
Y1
2
34
12
34
1/2/
3/4
M2
12
34
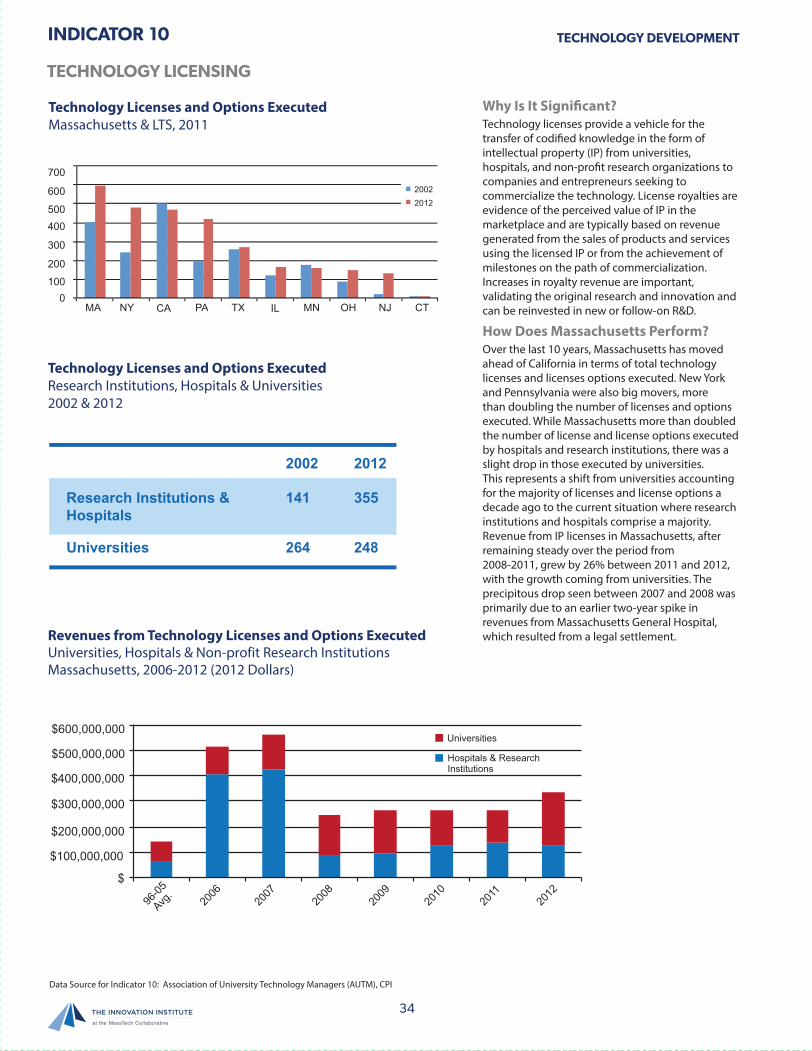
34
INDICATOR
TECHNOLOGY LICENSING
10
Why Is It Significant?Technology licenses provide a vehicle for the transfer of codified knowledge in the form of intellectual property (IP) from universities, hospitals, and non-profit research organizations to companies and entrepreneurs seeking to commercialize the technology. License royalties are evidence of the perceived value of IP in the marketplace and are typically based on revenue generated from the sales of products and services using the licensed IP or from the achievement of milestones on the path of commercialization. Increases in royalty revenue are important, validating the original research and innovation and can be reinvested in new or follow-on R&D.
How Does Massachusetts Perform?Over the last 10 years, Massachusetts has moved ahead of California in terms of total technology licenses and licenses options executed. New York and Pennsylvania were also big movers, more than doubling the number of licenses and options executed. While Massachusetts more than doubled the number of license and license options executed by hospitals and research institutions, there was a slight drop in those executed by universities. This represents a shift from universities accounting for the majority of licenses and license options a decade ago to the current situation where research institutions and hospitals comprise a majority.Revenue from IP licenses in Massachusetts, after remaining steady over the period from 2008-2011, grew by 26% between 2011 and 2012, with the growth coming from universities. The precipitous drop seen between 2007 and 2008 was primarily due to an earlier two-year spike in revenues from Massachusetts General Hospital, which resulted from a legal settlement.
TECHNOLOGY DEVELOPMENT
Technology Licenses and Options ExecutedMassachusetts & LTS, 2011
Technology Licenses and Options ExecutedResearch Institutions, Hospitals & Universities2002 & 2012
Revenues from Technology Licenses and Options Executed Universities, Hospitals & Non-profit Research Institutions Massachusetts, 2006-2012 (2012 Dollars)
MA CTTX ILCANY NJMNPA OH
20022012
700
600
500400
300
200
1000
Research Institutions &Hospitals
141
2002
264
355
2012
248Universities
Universities
Hospitals & ResearchInstitutions
96-0
5
Avg.
2006
2007
2008
2009
2010
2011
2012
$600,000,000
$
$500,000,000
$400,000,000
$300,000,000
$200,000,000
$100,000,000
Data Source for Indicator 10: Association of University Technology Managers (AUTM), CPI
235008_MassTech_MTCIndex - Back 5 - 12/19/14 08:41:40 - Black235008_MassTech_MTCIndex - Back 5 - 12/19/14 08:41:40 - Cyan235008_MassTech_MTCIndex - Back 5 - 12/19/14 08:41:40 - Magenta235008_MassTech_MTCIndex - Back 5 - 12/19/14 08:41:40 - YellowK
ey 2K
ey 3K
ey 4K
ey 5K
ey 6K
ey 7K
ey 8K
ey 9K
ey 10K
ey 11K
ey 12K
ey 13K
ey 14K
ey 15K
ey 16K
ey 17K
ey 18K
ey 19K
ey 21K
ey 20K
ey 22
KC
MY
M1
M2
M1
M2
M1
M2
M1
M2
M1
M2
M1
M2
M1
M2
M1
M2
M1
M2
M1
M2
M1
M2
2525
M1
M2
25M
1M
225
2525
50M
1M
2M
1M
250
5050
5050
M1
M2
M1
M2
5075
7575
7575
75G
RA
YG
RA
YG
RA
YG
RA
YG
RA
YK
CM
YK
CM
YK
CM
YK
CM
YK
CM
YK
CM
YY
+M
Y+
CC
+M
KC
MY
KC
MY
KC
MY
KP
CM
YK
CM
YK
CM
YK
CM
YK
CM
YK
CM
YK
CM
YG
RA
YK
CM
YM
1M
2M
1M
2M
1M
2M
1M
275
7575
7575
75G
RA
YG
RA
YK
CM
YK
CM
YK
CM
Y
Key 1
KC
MY
M1
M2
50
Key 23 M
1M
2star
starK
CM
Y
Kom
ori/GA
TF
P
art No. K
-28-6(D)
1/2/3/4 K1
2
34
1/2/3/4 C1
2
34
1/2/3/4 M1
2
34
1/2/3/4 M1
1/2/3/4 Y1
2
34
12
34
1/2/3/4 M2
12
34

35
INDICATOR
SBIR/STTR AWARDS
TECHNOLOGY DEVELOPMENT
SBIR & STTR Awards Funding per $1 Million GDPMassachusetts & LTS, 2013
SBIR & STTR Awards by AgencyMassachusetts, 2013
SBIR and STTR AwardsTotal Number and Value (by Phase) of Awards GrantedMassachusetts, 2003-2013
11
Why Is It Significant?The Small Business Innovation Research (SBIR) and Technology Transfer (STTR) Program is a highly competitive federal grant program that enables small companies to conduct proof-of-concept (Phase I) research on technical merit and idea feasibility and prototype development (Phase II) building on Phase I findings. Unlike many other federal research grants and contracts, SBIR and STTR grants are reserved for applicant teams led by for-profit companies with fewer than 500 employees. Participants in the SBIR and STTR program are often able to use the credibility and experimental data developed through their research to design commercial products and to attract strategic partners and investment capital.
How Does Massachusetts Perform?The decline in the number of SBIR and STTR awards that began in 2010 continued in 2013, with the total value of Massachusetts’ awards declining by 8% between 2012 and 2013, lower than the 13% rate of decline between 2010 and 2011. The decline in awards nationwide between 2012 and 2013 was even larger at 16%.Massachusetts remains the leader among LTS in terms of award funding per $1 million GDP. Although California receives nearly double the amount of funding that Massachusetts receives ($440 mil. vs. $229 mil.), the state’s smaller size means its SBIR and STTR funding per $1 million GDP is nearly triple that of California, the next highest state. Among the SBIR and STTR awards, Department of Defense accounts for the most funding (47.9%) and the most awards (316).
Awards Funding
Massachusetts
California
Ohio
Connecticut
Minnesota
Pennsylvania
New Jersey
New York
Texas
Illinois
$ 514
$ 200
$ 107
$ 105
$ 97
$ 96
$ 79
$ 73
$ 66
$ 65
Department of Defense
Health & Human Services
Department of Energy
National ScienceFoundation
Funding # of Awards
$ 109,639,449 316
107
46
24
$ 79,982,455
$ 18,792,649
$ 3,489,741
Phase 2$400,000,000
$350,000,000
$300,000,000
$250,000,000
$200,000,000
$150,000,000
$100,000,000
$50,000,000
$2003 2004 2005 2006 2007 2008 2009 2010 2011 2012 2013
1200
1000
800
600
400
200
0
Phase 1
# Of Awards
Data Source for Indicator 11: U.S. Small Business Administration, CPI
MassTech_MTCIndex Sig #18 - Low Folio - Front
MassTech_MTCIndex Sig #19 - Low Folio - Front
MassTech_MTCIndex Sig #20 - Low Folio - Front
MassTech_MTCIndex Sig #21 - Low Folio - Front235008_MassTech_MTCIndex - Front 6 - 12/19/14 08:41:44 - Black 235008_MassTech_MTCIndex - Front 6 - 12/19/14 08:41:44 - Cyan 235008_MassTech_MTCIndex - Front 6 - 12/19/14 08:41:44 - Magenta 235008_MassTech_MTCIndex - Front 6 - 12/19/14 08:41:44 - Yellow
Key
2K
ey 3
Key
4
Key
5K
ey 6
Key
7K
ey 8
Key
9K
ey 1
0K
ey 1
1K
ey
12
Key
13
Key
14
Key
15
Key
16
Key
17
Key
18
Key
19
Key
21
Key
2
0K
ey 2
2
KC
MY
M1
M2
M1
M2
M1
M2
M1
M2
M1
M2
M1
M2
M1
M2
M1
M2
M1
M2
M1
M2
M1
M2
2525
M1
M2
25M
1M
225
2525
50M
1M
2M
1M
250
5050
5050
M1
M2
M1
M2
5075
7575
7575
75G
RA
YG
RA
YG
RA
YG
RA
YG
RA
YK
CM
YK
CM
YK
CM
YK
CM
YK
CM
YK
CM
YY
+M
Y+
CC
+M
KC
MY
KC
MY
KC
MY
KP
CM
YK
CM
YK
CM
YK
CM
YK
CM
YK
CM
YK
CM
YG
RA
YK
CM
YM
1M
2M
1M
2M
1M
2M
1M
275
7575
7575
75G
RA
YG
RA
YK
CM
YK
CM
YK
CM
Y
Key
1
KC
MY
M1
M2
50
Key
23M
1M
2st
arst
arK
CM
Y
Kom
ori/G
AT
F
Par
t No.
K-2
8-6(
D)
1/2/
3/4
K1
2
34
1/2/
3/4
C1
2
34
1/2/
3/4
M1
2
34
1/2/
3/4
M1
1/2/
3/4
Y1
2
34
12
34
1/2/
3/4
M2
12
34

235008_MassTech_MTCIndex - Back 6 - 12/19/14 08:41:48 - Black235008_MassTech_MTCIndex - Back 6 - 12/19/14 08:41:48 - Cyan235008_MassTech_MTCIndex - Back 6 - 12/19/14 08:41:48 - Magenta235008_MassTech_MTCIndex - Back 6 - 12/19/14 08:41:48 - Yellow
Key 2
Key 3
Key 4
Key 5
Key 6
Key 7
Key 8
Key 9
Key 10
Key 11
Key 12
Key 13
Key 14
Key 15
Key 16
Key 17
Key 18
Key 19
Key 21
Key 20
Key 22
KC
MY
M1
M2
M1
M2
M1
M2
M1
M2
M1
M2
M1
M2
M1
M2
M1
M2
M1
M2
M1
M2
M1
M2
2525
M1
M2
25M
1M
225
2525
50M
1M
2M
1M
250
5050
5050
M1
M2
M1
M2
5075
7575
7575
75G
RA
YG
RA
YG
RA
YG
RA
YG
RA
YK
CM
YK
CM
YK
CM
YK
CM
YK
CM
YK
CM
YY
+M
Y+
CC
+M
KC
MY
KC
MY
KC
MY
KP
CM
YK
CM
YK
CM
YK
CM
YK
CM
YK
CM
YK
CM
YG
RA
YK
CM
YM
1M
2M
1M
2M
1M
2M
1M
275
7575
7575
75G
RA
YG
RA
YK
CM
YK
CM
YK
CM
Y
Key 1
KC
MY
M1
M2
50
Key 23 M
1M
2star
starK
CM
Y
Kom
ori/GA
TF
P
art No. K
-28-6(D)
1/2/3/4 K1
2
34
1/2/3/4 C1
2
34
1/2/3/4 M1
2
34
1/2/3/4 M1
1/2/3/4 Y1
2
34
12
34
1/2/3/4 M2
12
34
BUSINESS DEVELOPMENT
Business development involves commercialization, new business formation and business expansion. For existing businesses, growing to scale and sustainability often involves an initial public offering (IPO), a merger, or an acquisition (M&A). Technical, business and financial expertise all play a role in the process of analyzing andrealizing business opportunities, which result after research and development are translated into processes, products or services.
INDICATORS 12-13
MassTech_MTCIndex Sig #18 - Low Folio - Front
MassTech_MTCIndex Sig #19 - Low Folio - Front
MassTech_MTCIndex Sig #20 - Low Folio - Front
MassTech_MTCIndex Sig #21 - Low Folio - Front
235008_MassTech_MTCIndex - Front 6 - 12/19/14 08:41:44 - Black 235008_MassTech_MTCIndex - Front 6 - 12/19/14 08:41:44 - Cyan 235008_MassTech_MTCIndex - Front 6 - 12/19/14 08:41:44 - Magenta 235008_MassTech_MTCIndex - Front 6 - 12/19/14 08:41:44 - Yellow
Key
2K
ey 3
Key
4
Key
5K
ey 6
Key
7K
ey 8
Key
9K
ey 1
0K
ey 1
1K
ey
12
Key
13
Key
14
Key
15
Key
16
Key
17
Key
18
Key
19
Key
21
Key
2
0K
ey 2
2
KC
MY
M1
M2
M1
M2
M1
M2
M1
M2
M1
M2
M1
M2
M1
M2
M1
M2
M1
M2
M1
M2
M1
M2
2525
M1
M2
25M
1M
225
2525
50M
1M
2M
1M
250
5050
5050
M1
M2
M1
M2
5075
7575
7575
75G
RA
YG
RA
YG
RA
YG
RA
YG
RA
YK
CM
YK
CM
YK
CM
YK
CM
YK
CM
YK
CM
YY
+M
Y+
CC
+M
KC
MY
KC
MY
KC
MY
KP
CM
YK
CM
YK
CM
YK
CM
YK
CM
YK
CM
YK
CM
YG
RA
YK
CM
YM
1M
2M
1M
2M
1M
2M
1M
275
7575
7575
75G
RA
YG
RA
YK
CM
YK
CM
YK
CM
Y
Key
1
KC
MY
M1
M2
50
Key
23M
1M
2st
arst
arK
CM
Y
Kom
ori/G
AT
F
Par
t No.
K-2
8-6(
D)
1/2/
3/4
K1
2
34
1/2/
3/4
C1
2
34
1/2/
3/4
M1
2
34
1/2/
3/4
M1
1/2/
3/4
Y1
2
34
12
34
1/2/
3/4
M2
12
34
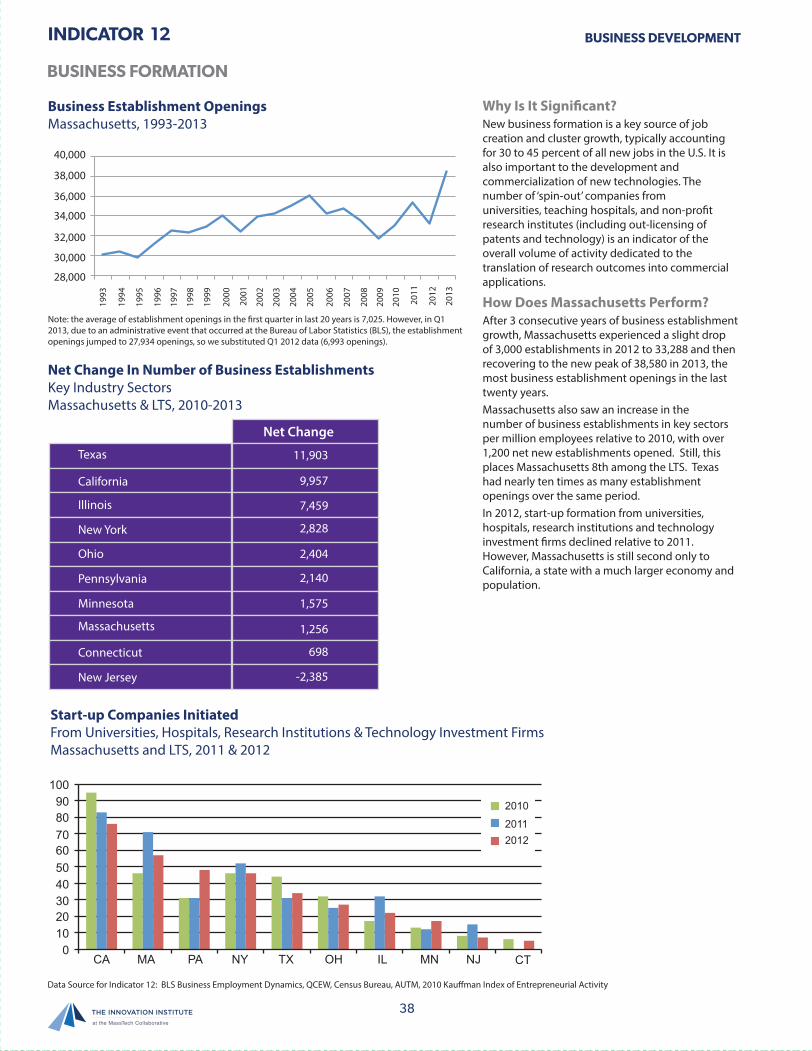
38
INDICATOR BUSINESS DEVELOPMENT12
Data Source for Indicator 12: BLS Business Employment Dynamics, QCEW, Census Bureau, AUTM, 2010 Kauffman Index of Entrepreneurial Activity
BUSINESS FORMATION
Why Is It Significant?New business formation is a key source of job creation and cluster growth, typically accounting for 30 to 45 percent of all new jobs in the U.S. It is also important to the development and commercialization of new technologies. The number of ‘spin-out’ companies from universities, teaching hospitals, and non-profit research institutes (including out-licensing of patents and technology) is an indicator of the overall volume of activity dedicated to the translation of research outcomes into commercial applications.
How Does Massachusetts Perform?After 3 consecutive years of business establishment growth, Massachusetts experienced a slight drop of 3,000 establishments in 2012 to 33,288 and then recovering to the new peak of 38,580 in 2013, the most business establishment openings in the last twenty years. Massachusetts also saw an increase in the number of business establishments in key sectors per million employees relative to 2010, with over 1,200 net new establishments opened. Still, this places Massachusetts 8th among the LTS. Texas had nearly ten times as many establishment openings over the same period. In 2012, start-up formation from universities, hospitals, research institutions and technology investment firms declined relative to 2011. However, Massachusetts is still second only to California, a state with a much larger economy and population.
Business Establishment OpeningsMassachusetts, 1993-2013
Net Change In Number of Business EstablishmentsKey Industry SectorsMassachusetts & LTS, 2010-2013
Start-up Companies InitiatedFrom Universities, Hospitals, Research Institutions & Technology Investment FirmsMassachusetts and LTS, 2011 & 2012
63,000
40,000
38,000
36,000
34,000
32,000
30,000
28,000
1993
1994
1995
1996
1997
1998
1999
2000
2001
2002
2003
2004
2005
2006
2007
2008
2009
2010
2011
2012
2013
Note: the average of establishment openings in the first quarter in last 20 years is 7,025. However, in Q1 2013, due to an administrative event that occurred at the Bureau of Labor Statistics (BLS), the establishment openings jumped to 27,934 openings, so we substituted Q1 2012 data (6,993 openings).
2010
2011
2012
CA CTILMA MN NJNY OHPA TX
100
90
80
70
60
50
40
30
20
10
0
Net Change
Texas
California
Illinois
New York
Ohio
Pennsylvania
Minnesota
Massachusetts
Connecticut
New Jersey
11,903
9,957
7,459
2,828
2,404
2,140
1,575
1,256
698
-2,385
235008_MassTech_MTCIndex - Back 6 - 12/19/14 08:41:48 - Black235008_MassTech_MTCIndex - Back 6 - 12/19/14 08:41:48 - Cyan235008_MassTech_MTCIndex - Back 6 - 12/19/14 08:41:48 - Magenta235008_MassTech_MTCIndex - Back 6 - 12/19/14 08:41:48 - Yellow
Key 2
Key 3
Key 4
Key 5
Key 6
Key 7
Key 8
Key 9
Key 10
Key 11
Key 12
Key 13
Key 14
Key 15
Key 16
Key 17
Key 18
Key 19
Key 21
Key 20
Key 22
KC
MY
M1
M2
M1
M2
M1
M2
M1
M2
M1
M2
M1
M2
M1
M2
M1
M2
M1
M2
M1
M2
M1
M2
2525
M1
M2
25M
1M
225
2525
50M
1M
2M
1M
250
5050
5050
M1
M2
M1
M2
5075
7575
7575
75G
RA
YG
RA
YG
RA
YG
RA
YG
RA
YK
CM
YK
CM
YK
CM
YK
CM
YK
CM
YK
CM
YY
+M
Y+
CC
+M
KC
MY
KC
MY
KC
MY
KP
CM
YK
CM
YK
CM
YK
CM
YK
CM
YK
CM
YK
CM
YG
RA
YK
CM
YM
1M
2M
1M
2M
1M
2M
1M
275
7575
7575
75G
RA
YG
RA
YK
CM
YK
CM
YK
CM
Y
Key 1
KC
MY
M1
M2
50
Key 23 M
1M
2star
starK
CM
Y
Kom
ori/GA
TF
P
art No. K
-28-6(D)
1/2/3/4 K1
2
34
1/2/3/4 C1
2
34
1/2/3/4 M1
2
34
1/2/3/4 M1
1/2/3/4 Y1
2
34
12
34
1/2/3/4 M2
12
34
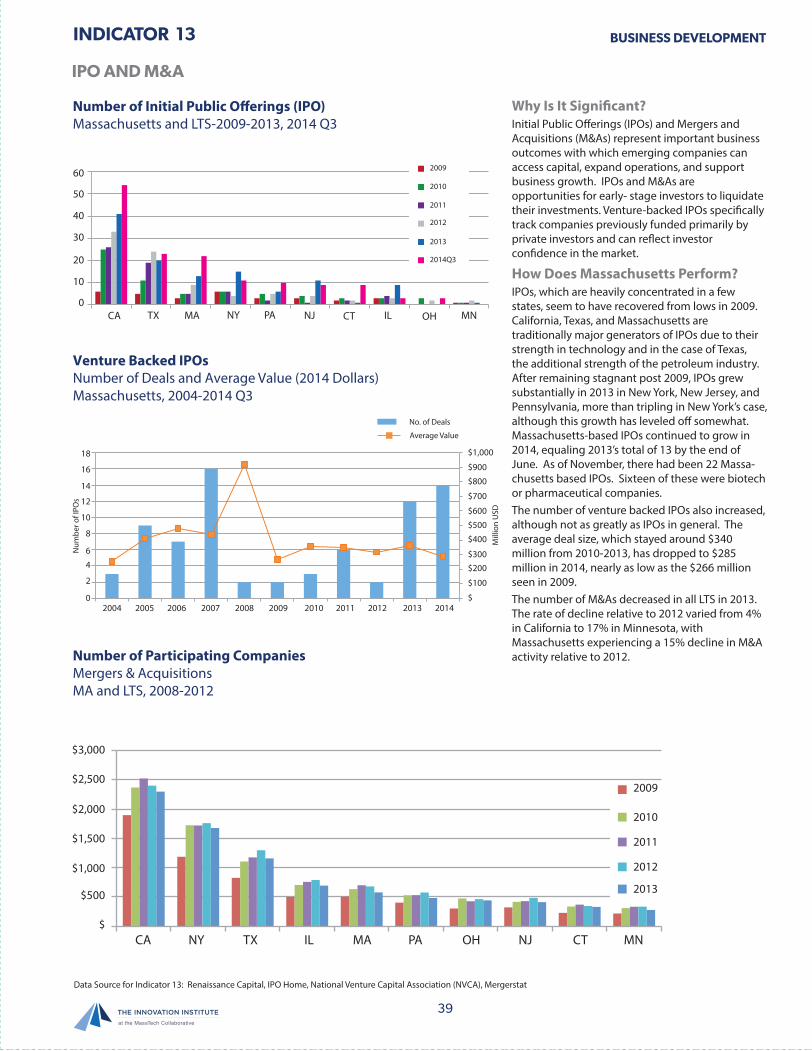
39
INDICATOR BUSINESS DEVELOPMENT13
Data Source for Indicator 13: Renaissance Capital, IPO Home, National Venture Capital Association (NVCA), Mergerstat
IPO AND M&A
Why Is It Significant?Initial Public Offerings (IPOs) and Mergers and Acquisitions (M&As) represent important business outcomes with which emerging companies can access capital, expand operations, and support business growth. IPOs and M&As are opportunities for early- stage investors to liquidate their investments. Venture-backed IPOs specifically track companies previously funded primarily by private investors and can reflect investor confidence in the market.
How Does Massachusetts Perform?IPOs, which are heavily concentrated in a few states, seem to have recovered from lows in 2009.California, Texas, and Massachusetts are traditionally major generators of IPOs due to their strength in technology and in the case of Texas, the additional strength of the petroleum industry. After remaining stagnant post 2009, IPOs grew substantially in 2013 in New York, New Jersey, and Pennsylvania, more than tripling in New York’s case, although this growth has leveled off somewhat. Massachusetts-based IPOs continued to grow in 2014, equaling 2013’s total of 13 by the end of June. As of November, there had been 22 Massa-chusetts based IPOs. Sixteen of these were biotech or pharmaceutical companies. The number of venture backed IPOs also increased, although not as greatly as IPOs in general. The average deal size, which stayed around $340 million from 2010-2013, has dropped to $285 million in 2014, nearly as low as the $266 million seen in 2009.The number of M&As decreased in all LTS in 2013.The rate of decline relative to 2012 varied from 4% in California to 17% in Minnesota, with Massachusetts experiencing a 15% decline in M&A activity relative to 2012.
Number of Initial Public Offerings (IPO)Massachusetts and LTS-2009-2013, 2014 Q3
Venture Backed IPOsNumber of Deals and Average Value (2014 Dollars) Massachusetts, 2004-2014 Q3
Number of Participating CompaniesMergers & AcquisitionsMA and LTS, 2008-2012
MA
60
50
40
30
20
10
0CA MNCTNJTX NY PA OHIL
2009
2010
2011
2012
2013
2014Q3
$1,000
$900
$800
$700
$600
$500
$400
$300$200
$100
$
18
16
14
12
10
8
6
4
2
0
No. of Deals
Average Value
2004 2005 2006 2007 2008 2009 2010 2011 2012 2013 2014
Num
ber o
f IPO
s
Mill
ion
USD
$3,000
$2,500
$2,000
$1,500
$1,000
$500
$
2009
2010
2011
2012
2013
CA NY TX IL MA PA OH NJ CT MN
MassTech_MTCIndex Sig #18 - Low Folio - Front
MassTech_MTCIndex Sig #19 - Low Folio - Front
MassTech_MTCIndex Sig #20 - Low Folio - Front
MassTech_MTCIndex Sig #21 - Low Folio - Front235008_MassTech_MTCIndex - Front 6 - 12/19/14 08:41:44 - Black 235008_MassTech_MTCIndex - Front 6 - 12/19/14 08:41:44 - Cyan 235008_MassTech_MTCIndex - Front 6 - 12/19/14 08:41:44 - Magenta 235008_MassTech_MTCIndex - Front 6 - 12/19/14 08:41:44 - Yellow
Key
2K
ey 3
Key
4
Key
5K
ey 6
Key
7K
ey 8
Key
9K
ey 1
0K
ey 1
1K
ey
12
Key
13
Key
14
Key
15
Key
16
Key
17
Key
18
Key
19
Key
21
Key
2
0K
ey 2
2
KC
MY
M1
M2
M1
M2
M1
M2
M1
M2
M1
M2
M1
M2
M1
M2
M1
M2
M1
M2
M1
M2
M1
M2
2525
M1
M2
25M
1M
225
2525
50M
1M
2M
1M
250
5050
5050
M1
M2
M1
M2
5075
7575
7575
75G
RA
YG
RA
YG
RA
YG
RA
YG
RA
YK
CM
YK
CM
YK
CM
YK
CM
YK
CM
YK
CM
YY
+M
Y+
CC
+M
KC
MY
KC
MY
KC
MY
KP
CM
YK
CM
YK
CM
YK
CM
YK
CM
YK
CM
YK
CM
YG
RA
YK
CM
YM
1M
2M
1M
2M
1M
2M
1M
275
7575
7575
75G
RA
YG
RA
YK
CM
YK
CM
YK
CM
Y
Key
1
KC
MY
M1
M2
50
Key
23M
1M
2st
arst
arK
CM
Y
Kom
ori/G
AT
F
Par
t No.
K-2
8-6(
D)
1/2/
3/4
K1
2
34
1/2/
3/4
C1
2
34
1/2/
3/4
M1
2
34
1/2/
3/4
M1
1/2/
3/4
Y1
2
34
12
34
1/2/
3/4
M2
12
34

235008_MassTech_MTCIndex - Back 6 - 12/19/14 08:41:48 - Black235008_MassTech_MTCIndex - Back 6 - 12/19/14 08:41:48 - Cyan235008_MassTech_MTCIndex - Back 6 - 12/19/14 08:41:48 - Magenta235008_MassTech_MTCIndex - Back 6 - 12/19/14 08:41:48 - Yellow
Key 2
Key 3
Key 4
Key 5
Key 6
Key 7
Key 8
Key 9
Key 10
Key 11
Key 12
Key 13
Key 14
Key 15
Key 16
Key 17
Key 18
Key 19
Key 21
Key 20
Key 22
KC
MY
M1
M2
M1
M2
M1
M2
M1
M2
M1
M2
M1
M2
M1
M2
M1
M2
M1
M2
M1
M2
M1
M2
2525
M1
M2
25M
1M
225
2525
50M
1M
2M
1M
250
5050
5050
M1
M2
M1
M2
5075
7575
7575
75G
RA
YG
RA
YG
RA
YG
RA
YG
RA
YK
CM
YK
CM
YK
CM
YK
CM
YK
CM
YK
CM
YY
+M
Y+
CC
+M
KC
MY
KC
MY
KC
MY
KP
CM
YK
CM
YK
CM
YK
CM
YK
CM
YK
CM
YK
CM
YG
RA
YK
CM
YM
1M
2M
1M
2M
1M
2M
1M
275
7575
7575
75G
RA
YG
RA
YK
CM
YK
CM
YK
CM
Y
Key 1
KC
MY
M1
M2
50
Key 23 M
1M
2star
starK
CM
Y
Kom
ori/GA
TF
P
art No. K
-28-6(D)
1/2/3/4 K1
2
34
1/2/3/4 C1
2
34
1/2/3/4 M1
2
34
1/2/3/4 M1
1/2/3/4 Y1
2
34
12
34
1/2/3/4 M2
12
34
CAPITAL
Massachusetts attracts billions of dollars of funding every year for research, development, new business formation and business expansion. The ability to attract public and private funds sustains the unparalleled capacity of individuals and organizations in the state to engage in the most forward looking research and development efforts. Universities in Massachusetts benefit from industry’s desire to remain at the cutting edge of research and product development through university-industry interactions. For new business formation and expansion, Massachusetts’ concentration of venture capitalists and angel investors is critical. Investors in these areas, capable of assessing both the risk and opportunities associated with new technologies and entrepreneurial ventures, are partners in the innovation process and vital to its success.
INDICATORS 14-16
MassTech_MTCIndex Sig #18 - Low Folio - Front
MassTech_MTCIndex Sig #19 - Low Folio - Front
MassTech_MTCIndex Sig #20 - Low Folio - Front
MassTech_MTCIndex Sig #21 - Low Folio - Front
235008_MassTech_MTCIndex - Front 6 - 12/19/14 08:41:44 - Black 235008_MassTech_MTCIndex - Front 6 - 12/19/14 08:41:44 - Cyan 235008_MassTech_MTCIndex - Front 6 - 12/19/14 08:41:44 - Magenta 235008_MassTech_MTCIndex - Front 6 - 12/19/14 08:41:44 - Yellow
Key
2K
ey 3
Key
4
Key
5K
ey 6
Key
7K
ey 8
Key
9K
ey 1
0K
ey 1
1K
ey
12
Key
13
Key
14
Key
15
Key
16
Key
17
Key
18
Key
19
Key
21
Key
2
0K
ey 2
2
KC
MY
M1
M2
M1
M2
M1
M2
M1
M2
M1
M2
M1
M2
M1
M2
M1
M2
M1
M2
M1
M2
M1
M2
2525
M1
M2
25M
1M
225
2525
50M
1M
2M
1M
250
5050
5050
M1
M2
M1
M2
5075
7575
7575
75G
RA
YG
RA
YG
RA
YG
RA
YG
RA
YK
CM
YK
CM
YK
CM
YK
CM
YK
CM
YK
CM
YY
+M
Y+
CC
+M
KC
MY
KC
MY
KC
MY
KP
CM
YK
CM
YK
CM
YK
CM
YK
CM
YK
CM
YK
CM
YG
RA
YK
CM
YM
1M
2M
1M
2M
1M
2M
1M
275
7575
7575
75G
RA
YG
RA
YK
CM
YK
CM
YK
CM
Y
Key
1
KC
MY
M1
M2
50
Key
23M
1M
2st
arst
arK
CM
Y
Kom
ori/G
AT
F
Par
t No.
K-2
8-6(
D)
1/2/
3/4
K1
2
34
1/2/
3/4
C1
2
34
1/2/
3/4
M1
2
34
1/2/
3/4
M1
1/2/
3/4
Y1
2
34
12
34
1/2/
3/4
M2
12
34
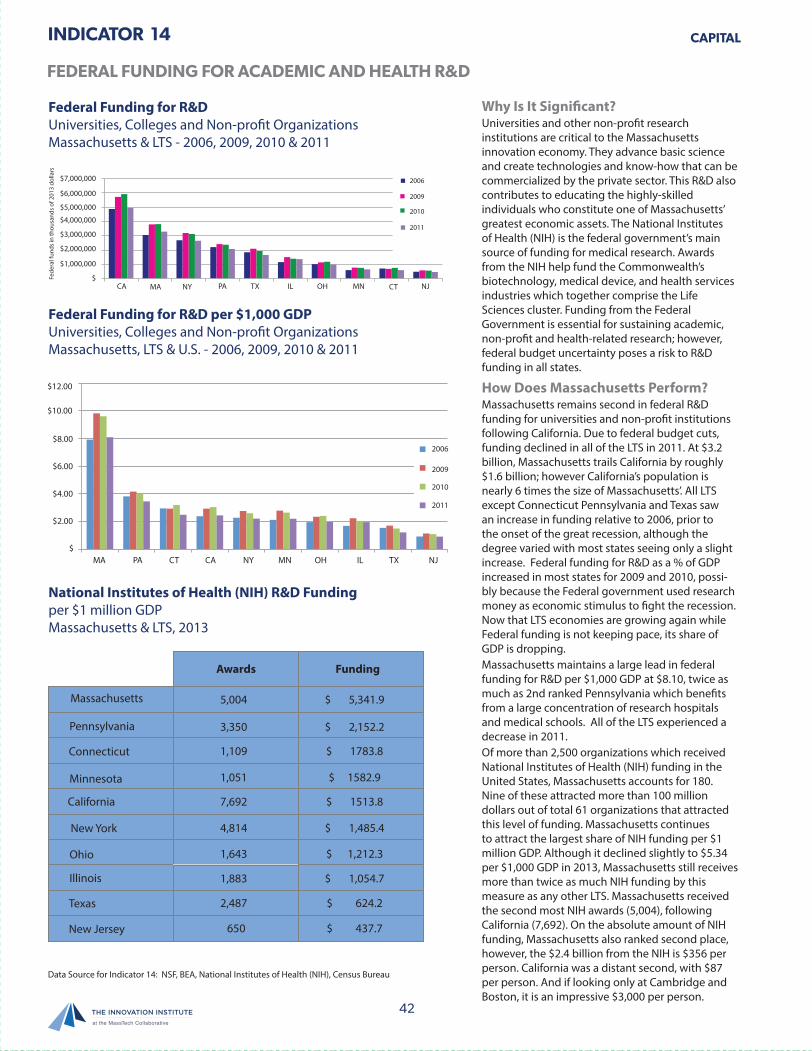
42
INDICATOR
Why Is It Significant?Universities and other non-profit research institutions are critical to the Massachusetts innovation economy. They advance basic science and create technologies and know-how that can be commercialized by the private sector. This R&D also contributes to educating the highly-skilled individuals who constitute one of Massachusetts’ greatest economic assets. The National Institutes of Health (NIH) is the federal government’s main source of funding for medical research. Awards from the NIH help fund the Commonwealth’s biotechnology, medical device, and health services industries which together comprise the Life Sciences cluster. Funding from the Federal Government is essential for sustaining academic, non-profit and health-related research; however, federal budget uncertainty poses a risk to R&D funding in all states.
How Does Massachusetts Perform?Massachusetts remains second in federal R&D funding for universities and non-profit institutions following California. Due to federal budget cuts, funding declined in all of the LTS in 2011. At $3.2 billion, Massachusetts trails California by roughly $1.6 billion; however California’s population is nearly 6 times the size of Massachusetts’. All LTS except Connecticut Pennsylvania and Texas saw an increase in funding relative to 2006, prior to the onset of the great recession, although the degree varied with most states seeing only a slight increase. Federal funding for R&D as a % of GDP increased in most states for 2009 and 2010, possi-bly because the Federal government used research money as economic stimulus to fight the recession. Now that LTS economies are growing again while Federal funding is not keeping pace, its share of GDP is dropping. Massachusetts maintains a large lead in federal funding for R&D per $1,000 GDP at $8.10, twice as much as 2nd ranked Pennsylvania which benefits from a large concentration of research hospitals and medical schools. All of the LTS experienced a decrease in 2011. Of more than 2,500 organizations which received National Institutes of Health (NIH) funding in the United States, Massachusetts accounts for 180. Nine of these attracted more than 100 million dollars out of total 61 organizations that attracted this level of funding. Massachusetts continues to attract the largest share of NIH funding per $1 million GDP. Although it declined slightly to $5.34 per $1,000 GDP in 2013, Massachusetts still receives more than twice as much NIH funding by this measure as any other LTS. Massachusetts received the second most NIH awards (5,004), following California (7,692). On the absolute amount of NIH funding, Massachusetts also ranked second place, however, the $2.4 billion from the NIH is $356 per person. California was a distant second, with $87 per person. And if looking only at Cambridge and Boston, it is an impressive $3,000 per person.
CAPITAL
FEDERAL FUNDING FOR ACADEMIC AND HEALTH R&D
14
Federal Funding for R&D Universities, Colleges and Non-profit OrganizationsMassachusetts & LTS - 2006, 2009, 2010 & 2011
Federal Funding for R&D per $1,000 GDPUniversities, Colleges and Non-profit OrganizationsMassachusetts, LTS & U.S. - 2006, 2009, 2010 & 2011
National Institutes of Health (NIH) R&D Funding per $1 million GDPMassachusetts & LTS, 2013
$7,000,000
$6,000,000
$5,000,000
$4,000,000
$3,000,000
$2,000,000
$1,000,000
$MA PA CTCA NY MNOHILTX NJ
2006
2009
2010
2011
Fede
ral f
unds
in th
ousa
nds
of 2
013
dolla
rs
2006
2009
2010
2011
$12.00
$10.00
$8.00
$6.00
$4.00
$2.00
$MA PA CT CA NY MN OH IL TX NJ
Awards Funding
Illinois
New York
Texas
California
Connecticut
Massachusetts
New Jersey
Minnesota
Ohio
Pennsylvania
5,004
3,350
1,109
1,051
7,692
1,643
1,883
2,487
650
4,814
$ 5,341.9
$ 2,152.2
$ 1783.8
$ 1582.9
$ 1513.8
$ 1,212.3
$ 1,054.7
$ 624.2
$ 437.7
$ 1,485.4
Data Source for Indicator 14: NSF, BEA, National Institutes of Health (NIH), Census Bureau
235008_MassTech_MTCIndex - Back 6 - 12/19/14 08:41:48 - Black235008_MassTech_MTCIndex - Back 6 - 12/19/14 08:41:48 - Cyan235008_MassTech_MTCIndex - Back 6 - 12/19/14 08:41:48 - Magenta235008_MassTech_MTCIndex - Back 6 - 12/19/14 08:41:48 - YellowK
ey 2K
ey 3K
ey 4K
ey 5K
ey 6K
ey 7K
ey 8K
ey 9K
ey 10K
ey 11K
ey 12K
ey 13K
ey 14K
ey 15K
ey 16K
ey 17K
ey 18K
ey 19K
ey 21K
ey 20K
ey 22
KC
MY
M1
M2
M1
M2
M1
M2
M1
M2
M1
M2
M1
M2
M1
M2
M1
M2
M1
M2
M1
M2
M1
M2
2525
M1
M2
25M
1M
225
2525
50M
1M
2M
1M
250
5050
5050
M1
M2
M1
M2
5075
7575
7575
75G
RA
YG
RA
YG
RA
YG
RA
YG
RA
YK
CM
YK
CM
YK
CM
YK
CM
YK
CM
YK
CM
YY
+M
Y+
CC
+M
KC
MY
KC
MY
KC
MY
KP
CM
YK
CM
YK
CM
YK
CM
YK
CM
YK
CM
YK
CM
YG
RA
YK
CM
YM
1M
2M
1M
2M
1M
2M
1M
275
7575
7575
75G
RA
YG
RA
YK
CM
YK
CM
YK
CM
Y
Key 1
KC
MY
M1
M2
50
Key 23 M
1M
2star
starK
CM
Y
Kom
ori/GA
TF
P
art No. K
-28-6(D)
1/2/3/4 K1
2
34
1/2/3/4 C1
2
34
1/2/3/4 M1
2
34
1/2/3/4 M1
1/2/3/4 Y1
2
34
12
34
1/2/3/4 M2
12
34
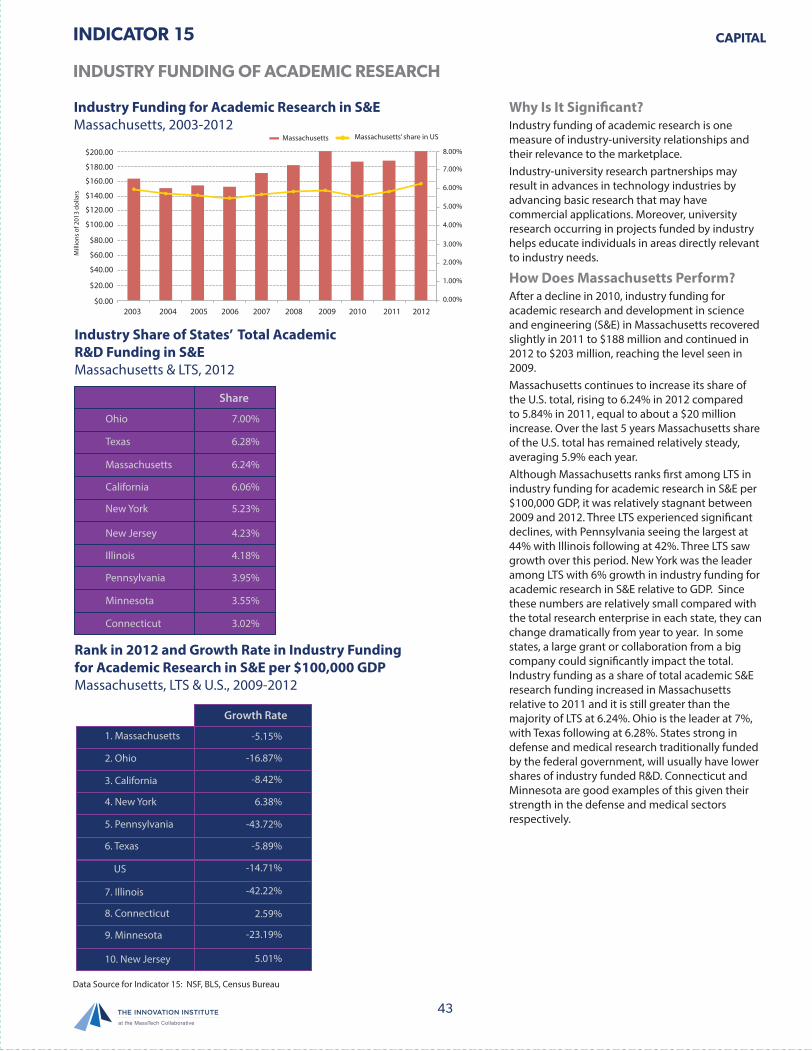
43
INDICATOR
Why Is It Significant?Industry funding of academic research is one measure of industry-university relationships and their relevance to the marketplace. Industry-university research partnerships may result in advances in technology industries by advancing basic research that may have commercial applications. Moreover, university research occurring in projects funded by industry helps educate individuals in areas directly relevant to industry needs.
How Does Massachusetts Perform?After a decline in 2010, industry funding for academic research and development in science and engineering (S&E) in Massachusetts recovered slightly in 2011 to $188 million and continued in 2012 to $203 million, reaching the level seen in 2009. Massachusetts continues to increase its share of the U.S. total, rising to 6.24% in 2012 compared to 5.84% in 2011, equal to about a $20 million increase. Over the last 5 years Massachusetts share of the U.S. total has remained relatively steady, averaging 5.9% each year.Although Massachusetts ranks first among LTS in industry funding for academic research in S&E per $100,000 GDP, it was relatively stagnant between 2009 and 2012. Three LTS experienced significant declines, with Pennsylvania seeing the largest at 44% with Illinois following at 42%. Three LTS saw growth over this period. New York was the leader among LTS with 6% growth in industry funding for academic research in S&E relative to GDP. Since these numbers are relatively small compared with the total research enterprise in each state, they can change dramatically from year to year. In some states, a large grant or collaboration from a big company could significantly impact the total.Industry funding as a share of total academic S&E research funding increased in Massachusetts relative to 2011 and it is still greater than the majority of LTS at 6.24%. Ohio is the leader at 7%, with Texas following at 6.28%. States strong in defense and medical research traditionally funded by the federal government, will usually have lower shares of industry funded R&D. Connecticut and Minnesota are good examples of this given their strength in the defense and medical sectors respectively.
CAPITAL
INDUSTRY FUNDING OF ACADEMIC RESEARCH
15
Industry Share of States’ Total Academic R&D Funding in S&EMassachusetts & LTS, 2012
Rank in 2012 and Growth Rate in Industry Fundingfor Academic Research in S&E per $100,000 GDPMassachusetts, LTS & U.S., 2009-2012
Industry Funding for Academic Research in S&EMassachusetts, 2003-2012
Share
Ohio
Texas
Massachusetts
California
New York
New Jersey
Illinois
Pennsylvania
Minnesota
Connecticut
7.00%
6.28%
6.24%
6.06%
5.23%
4.23%
4.18%
3.95%
3.55%
3.02%
Growth Rate
1. Massachusetts
2. Ohio
3. California
4. New York
5. Pennsylvania
6. Texas
US
7. Illinois
8. Connecticut
9. Minnesota
10. New Jersey
-5.15%
-16.87%
-8.42%
6.38%
-43.72%
-5.89%
-14.71%
-42.22%
2.59%
-23.19%
5.01%
$200.00
$180.00
$160.00
$140.00
$120.00
$100.00
$80.00
$60.00
$40.00
$20.00
$0.00
Massachusetts Massachusetts’ share in US
8.00%
7.00%
6.00%
5.00%
4.00%
3.00%
2.00%
1.00%
0.00%
2003 2004 2005 2006 2007 2008 2009 2010 2011 2012
Mill
ions
of 2
013
dolla
rs
Data Source for Indicator 15: NSF, BLS, Census Bureau
MassTech_MTCIndex Sig #22 - Low Folio - Front
MassTech_MTCIndex Sig #23 - Low Folio - Front
MassTech_MTCIndex Sig #24 - Low Folio - Front
MassTech_MTCIndex Sig #25 - Low Folio - Front235008_MassTech_MTCIndex - Front 7 - 12/19/14 08:41:52 - Black 235008_MassTech_MTCIndex - Front 7 - 12/19/14 08:41:52 - Cyan 235008_MassTech_MTCIndex - Front 7 - 12/19/14 08:41:52 - Magenta 235008_MassTech_MTCIndex - Front 7 - 12/19/14 08:41:52 - Yellow
Key
2K
ey 3
Key
4
Key
5K
ey 6
Key
7K
ey 8
Key
9K
ey 1
0K
ey 1
1K
ey
12
Key
13
Key
14
Key
15
Key
16
Key
17
Key
18
Key
19
Key
21
Key
2
0K
ey 2
2
KC
MY
M1
M2
M1
M2
M1
M2
M1
M2
M1
M2
M1
M2
M1
M2
M1
M2
M1
M2
M1
M2
M1
M2
2525
M1
M2
25M
1M
225
2525
50M
1M
2M
1M
250
5050
5050
M1
M2
M1
M2
5075
7575
7575
75G
RA
YG
RA
YG
RA
YG
RA
YG
RA
YK
CM
YK
CM
YK
CM
YK
CM
YK
CM
YK
CM
YY
+M
Y+
CC
+M
KC
MY
KC
MY
KC
MY
KP
CM
YK
CM
YK
CM
YK
CM
YK
CM
YK
CM
YK
CM
YG
RA
YK
CM
YM
1M
2M
1M
2M
1M
2M
1M
275
7575
7575
75G
RA
YG
RA
YK
CM
YK
CM
YK
CM
Y
Key
1
KC
MY
M1
M2
50
Key
23M
1M
2st
arst
arK
CM
Y
Kom
ori/G
AT
F
Par
t No.
K-2
8-6(
D)
1/2/
3/4
K1
2
34
1/2/
3/4
C1
2
34
1/2/
3/4
M1
2
34
1/2/
3/4
M1
1/2/
3/4
Y1
2
34
12
34
1/2/
3/4
M2
12
34
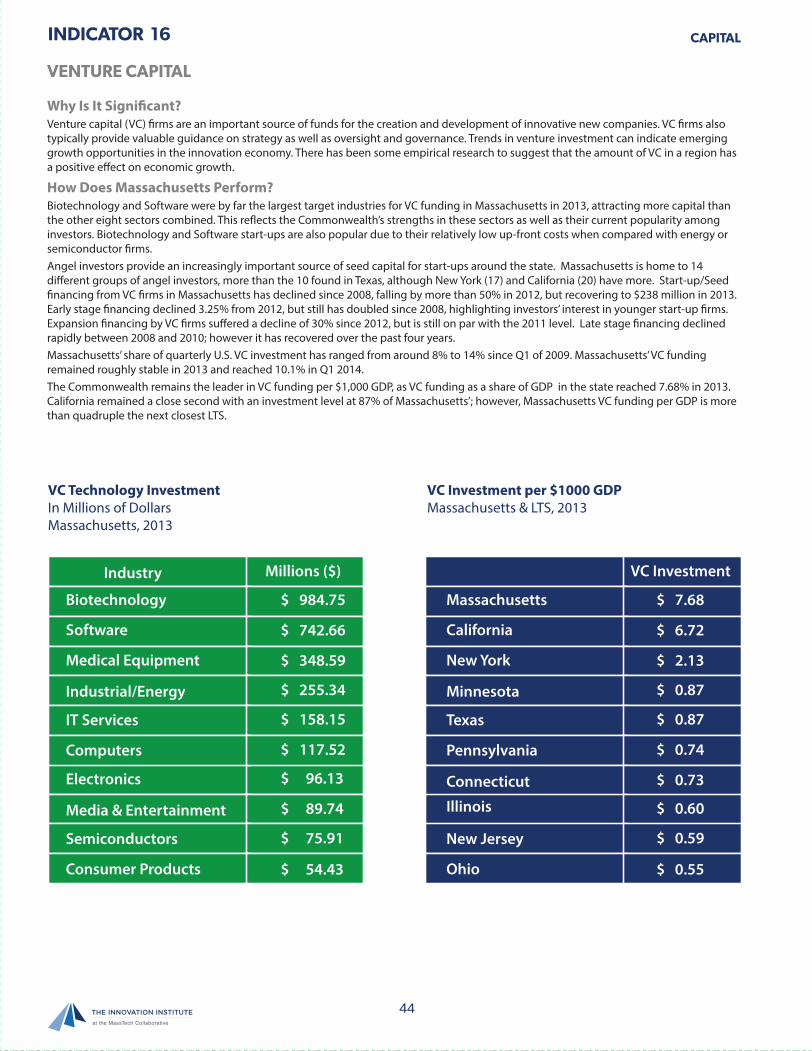
44
INDICATOR
Why Is It Significant?Venture capital (VC) firms are an important source of funds for the creation and development of innovative new companies. VC firms also typically provide valuable guidance on strategy as well as oversight and governance. Trends in venture investment can indicate emerging growth opportunities in the innovation economy. There has been some empirical research to suggest that the amount of VC in a region has a positive effect on economic growth.
How Does Massachusetts Perform?Biotechnology and Software were by far the largest target industries for VC funding in Massachusetts in 2013, attracting more capital than the other eight sectors combined. This reflects the Commonwealth’s strengths in these sectors as well as their current popularity among investors. Biotechnology and Software start-ups are also popular due to their relatively low up-front costs when compared with energy or semiconductor firms.Angel investors provide an increasingly important source of seed capital for start-ups around the state. Massachusetts is home to 14 different groups of angel investors, more than the 10 found in Texas, although New York (17) and California (20) have more. Start-up/Seed financing from VC firms in Massachusetts has declined since 2008, falling by more than 50% in 2012, but recovering to $238 million in 2013. Early stage financing declined 3.25% from 2012, but still has doubled since 2008, highlighting investors’ interest in younger start-up firms. Expansion financing by VC firms suffered a decline of 30% since 2012, but is still on par with the 2011 level. Late stage financing declined rapidly between 2008 and 2010; however it has recovered over the past four years. Massachusetts’ share of quarterly U.S. VC investment has ranged from around 8% to 14% since Q1 of 2009. Massachusetts’ VC funding remained roughly stable in 2013 and reached 10.1% in Q1 2014.The Commonwealth remains the leader in VC funding per $1,000 GDP, as VC funding as a share of GDP in the state reached 7.68% in 2013. California remained a close second with an investment level at 87% of Massachusetts’; however, Massachusetts VC funding per GDP is more than quadruple the next closest LTS.
CAPITAL
VENTURE CAPITAL
16
VC Technology InvestmentIn Millions of DollarsMassachusetts, 2013
VC Investment per $1000 GDPMassachusetts & LTS, 2013
Massachusetts $ 7.68
$ 6.72
$ 2.13
$ 0.87
$ 0.87
$ 0.74
$ 0.73
$ 0.60
$ 0.59
$ 0.55
California
New York
Minnesota
Texas
Pennsylvania
Connecticut
Illinois
New Jersey
Ohio
VC InvestmentIndustry
Biotechnology $ 984.75
$ 742.66
$ 348.59
$ 255.34
$ 158.15
$ 96.13
$ 89.74
$ 75.91
$ 54.43
Software
Medical Equipment
Industrial/Energy
IT Services
Electronics
$ 117.52Computers
Media & Entertainment
Semiconductors
Consumer Products
Millions ($)
235008_MassTech_MTCIndex - Back 7 - 12/19/14 08:41:56 - Black235008_MassTech_MTCIndex - Back 7 - 12/19/14 08:41:56 - Cyan235008_MassTech_MTCIndex - Back 7 - 12/19/14 08:41:56 - Magenta235008_MassTech_MTCIndex - Back 7 - 12/19/14 08:41:56 - Yellow
Key 2
Key 3
Key 4
Key 5
Key 6
Key 7
Key 8
Key 9
Key 10
Key 11
Key 12
Key 13
Key 14
Key 15
Key 16
Key 17
Key 18
Key 19
Key 21
Key 20
Key 22
KC
MY
M1
M2
M1
M2
M1
M2
M1
M2
M1
M2
M1
M2
M1
M2
M1
M2
M1
M2
M1
M2
M1
M2
2525
M1
M2
25M
1M
225
2525
50M
1M
2M
1M
250
5050
5050
M1
M2
M1
M2
5075
7575
7575
75G
RA
YG
RA
YG
RA
YG
RA
YG
RA
YK
CM
YK
CM
YK
CM
YK
CM
YK
CM
YK
CM
YY
+M
Y+
CC
+M
KC
MY
KC
MY
KC
MY
KP
CM
YK
CM
YK
CM
YK
CM
YK
CM
YK
CM
YK
CM
YG
RA
YK
CM
YM
1M
2M
1M
2M
1M
2M
1M
275
7575
7575
75G
RA
YG
RA
YK
CM
YK
CM
YK
CM
Y
Key 1
KC
MY
M1
M2
50
Key 23 M
1M
2star
starK
CM
Y
Kom
ori/GA
TF
P
art No. K
-28-6(D)
1/2/3/4 K1
2
34
1/2/3/4 C1
2
34
1/2/3/4 M1
2
34
1/2/3/4 M1
1/2/3/4 Y1
2
34
12
34
1/2/3/4 M2
12
34
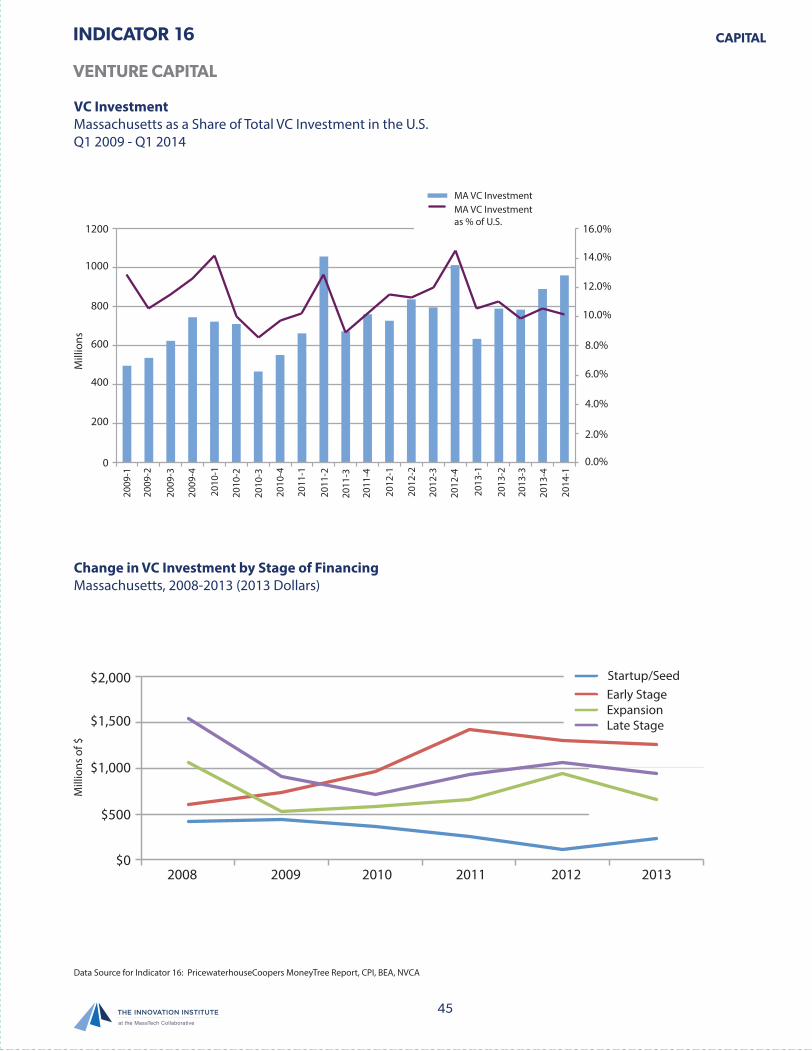
45
INDICATOR CAPITAL
VENTURE CAPITAL
VC Investment per $1000 GDPMassachusetts & LTS, 2013
Change in VC Investment by Stage of FinancingMassachusetts, 2008-2013 (2013 Dollars)
VC Investment Massachusetts as a Share of Total VC Investment in the U.S.Q1 2009 - Q1 2014
Change in VC Investment by Stage of FinancingMassachusetts, 2008-20132013 $
$2,000
2008 2009 2010 2011 2012 2013
$1,500
$1,000
$500
$0
Startup/SeedEarly StageExpansionLate Stage
Mill
ions
of $
1200 16.0%
14.0%
12.0%
10.0%
8.0%
6.0%
4.0%
2.0%
0.0%
1000
800
600
400
200
0
2014
-1
MA VC InvestmentMA VC Investmentas % of U.S.
Mill
ions
16
Data Source for Indicator 16: PricewaterhouseCoopers MoneyTree Report, CPI, BEA, NVCA
MassTech_MTCIndex Sig #22 - Low Folio - Front
MassTech_MTCIndex Sig #23 - Low Folio - Front
MassTech_MTCIndex Sig #24 - Low Folio - Front
MassTech_MTCIndex Sig #25 - Low Folio - Front
235008_MassTech_MTCIndex - Front 7 - 12/19/14 08:41:52 - Black 235008_MassTech_MTCIndex - Front 7 - 12/19/14 08:41:52 - Cyan 235008_MassTech_MTCIndex - Front 7 - 12/19/14 08:41:52 - Magenta 235008_MassTech_MTCIndex - Front 7 - 12/19/14 08:41:52 - Yellow
Key
2K
ey 3
Key
4
Key
5K
ey 6
Key
7K
ey 8
Key
9K
ey 1
0K
ey 1
1K
ey
12
Key
13
Key
14
Key
15
Key
16
Key
17
Key
18
Key
19
Key
21
Key
2
0K
ey 2
2
KC
MY
M1
M2
M1
M2
M1
M2
M1
M2
M1
M2
M1
M2
M1
M2
M1
M2
M1
M2
M1
M2
M1
M2
2525
M1
M2
25M
1M
225
2525
50M
1M
2M
1M
250
5050
5050
M1
M2
M1
M2
5075
7575
7575
75G
RA
YG
RA
YG
RA
YG
RA
YG
RA
YK
CM
YK
CM
YK
CM
YK
CM
YK
CM
YK
CM
YY
+M
Y+
CC
+M
KC
MY
KC
MY
KC
MY
KP
CM
YK
CM
YK
CM
YK
CM
YK
CM
YK
CM
YK
CM
YG
RA
YK
CM
YM
1M
2M
1M
2M
1M
2M
1M
275
7575
7575
75G
RA
YG
RA
YK
CM
YK
CM
YK
CM
Y
Key
1
KC
MY
M1
M2
50
Key
23M
1M
2st
arst
arK
CM
Y
Kom
ori/G
AT
F
Par
t No.
K-2
8-6(
D)
1/2/
3/4
K1
2
34
1/2/
3/4
C1
2
34
1/2/
3/4
M1
2
34
1/2/
3/4
M1
1/2/
3/4
Y1
2
34
12
34
1/2/
3/4
M2
12
34

TALENT
Innovation may be about technology and business outcomes, but it is a social process. As such, innovation is driven by the individuals who are actively involved in science, technology, design and business development. The concentration of men and women with post-secondary and graduate education, complemented by the strength of the education system, provides the Commonwealth with competitive advantages in the global economy. Investment in public education helps sustain quality and enhance opportunities for individuals of diverse backgrounds to pursue a high school or college degree. Students and individuals with an interest or background in science, technology, engineering and math are particularly important to the innovation economy. Massachusetts benefits from an ongoing movement of people across its boundaries, including some of the brightest people from the nation and world who chose to live, study and work in the Commonwealth. Housing affordability also influences Massachusetts’ ability to attract and retain talented individuals.
INDICATORS 17-23
235008_MassTech_MTCIndex - Back 7 - 12/19/14 08:41:56 - Black235008_MassTech_MTCIndex - Back 7 - 12/19/14 08:41:56 - Cyan235008_MassTech_MTCIndex - Back 7 - 12/19/14 08:41:56 - Magenta235008_MassTech_MTCIndex - Back 7 - 12/19/14 08:41:56 - Yellow
Key 2
Key 3
Key 4
Key 5
Key 6
Key 7
Key 8
Key 9
Key 10
Key 11
Key 12
Key 13
Key 14
Key 15
Key 16
Key 17
Key 18
Key 19
Key 21
Key 20
Key 22
KC
MY
M1
M2
M1
M2
M1
M2
M1
M2
M1
M2
M1
M2
M1
M2
M1
M2
M1
M2
M1
M2
M1
M2
2525
M1
M2
25M
1M
225
2525
50M
1M
2M
1M
250
5050
5050
M1
M2
M1
M2
5075
7575
7575
75G
RA
YG
RA
YG
RA
YG
RA
YG
RA
YK
CM
YK
CM
YK
CM
YK
CM
YK
CM
YK
CM
YY
+M
Y+
CC
+M
KC
MY
KC
MY
KC
MY
KP
CM
YK
CM
YK
CM
YK
CM
YK
CM
YK
CM
YK
CM
YG
RA
YK
CM
YM
1M
2M
1M
2M
1M
2M
1M
275
7575
7575
75G
RA
YG
RA
YK
CM
YK
CM
YK
CM
Y
Key 1
KC
MY
M1
M2
50
Key 23 M
1M
2star
starK
CM
Y
Kom
ori/GA
TF
P
art No. K
-28-6(D)
1/2/3/4 K1
2
34
1/2/3/4 C1
2
34
1/2/3/4 M1
2
34
1/2/3/4 M1
1/2/3/4 Y1
2
34
12
34
1/2/3/4 M2
12
34
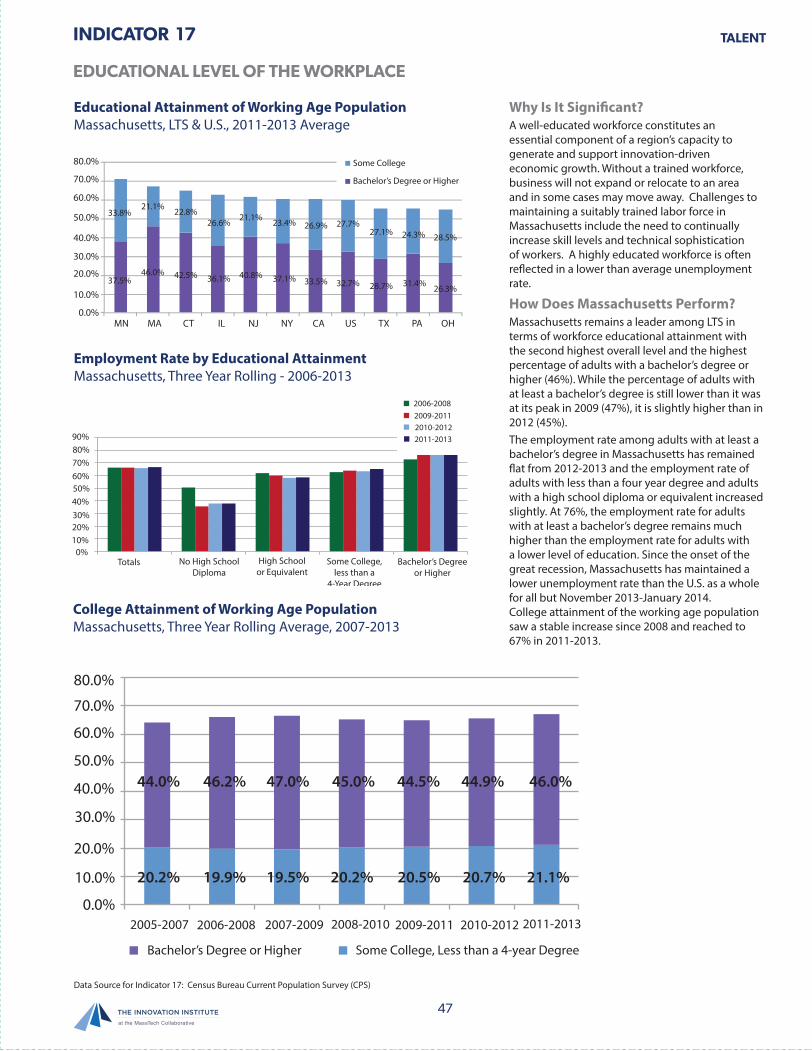
47
INDICATOR TALENT
EDUCATIONAL LEVEL OF THE WORKPLACE
17
Educational Attainment of Working Age PopulationMassachusetts, LTS & U.S., 2011-2013 Average
Employment Rate by Educational AttainmentMassachusetts, Three Year Rolling - 2006-2013
College Attainment of Working Age PopulationMassachusetts, Three Year Rolling Average, 2007-2013
Why Is It Significant?A well-educated workforce constitutes an essential component of a region’s capacity to generate and support innovation-driven economic growth. Without a trained workforce, business will not expand or relocate to an area and in some cases may move away. Challenges to maintaining a suitably trained labor force in Massachusetts include the need to continually increase skill levels and technical sophistication of workers. A highly educated workforce is often reflected in a lower than average unemployment rate.
How Does Massachusetts Perform?Massachusetts remains a leader among LTS in terms of workforce educational attainment with the second highest overall level and the highest percentage of adults with a bachelor’s degree or higher (46%). While the percentage of adults with at least a bachelor’s degree is still lower than it was at its peak in 2009 (47%), it is slightly higher than in 2012 (45%). The employment rate among adults with at least a bachelor’s degree in Massachusetts has remained flat from 2012-2013 and the employment rate of adults with less than a four year degree and adults with a high school diploma or equivalent increased slightly. At 76%, the employment rate for adults with at least a bachelor’s degree remains much higher than the employment rate for adults with a lower level of education. Since the onset of the great recession, Massachusetts has maintained a lower unemployment rate than the U.S. as a whole for all but November 2013-January 2014.College attainment of the working age population saw a stable increase since 2008 and reached to 67% in 2011-2013.
80.0%
70.0%
60.0%
50.0%
40.0%
30.0%
20.0%
10.0%
0.0%MN MA CT IL NJ NY CA US TX PA OH
33.8%
37.5%46.0% 42.5% 36.1% 37.1% 33.5% 32.7% 28.7% 31.4% 26.3%
40.8%
21.1%21.1%22.8%
26.6% 23.4% 26.9% 27.7%27.1% 24.3% 28.5%
Some College
Bachelor’s Degree or Higher
80%90%
70%60%50%
20%
40%30%
10%0%
2006-20082009-20112010-20122011-2013
Bachelor’s Degreeor Higher
High School or Equivalent
No High SchoolDiploma
Totals Some College,less than a
4-Year Degree
80.0%
70.0%
60.0%
50.0%
20.0%
40.0%
30.0%
10.0%
0.0%
44.0%
20.2% 19.9% 19.5% 20.2% 20.5% 20.7% 21.1%
46.2% 47.0% 45.0% 44.5% 44.9% 46.0%
2005-2007 2006-2008 2007-2009 2008-2010 2009-2011 2010-2012 2011-2013
Bachelor’s Degree or Higher Some College, Less than a 4-year Degree
Data Source for Indicator 17: Census Bureau Current Population Survey (CPS)
MassTech_MTCIndex Sig #22 - Low Folio - Front
MassTech_MTCIndex Sig #23 - Low Folio - Front
MassTech_MTCIndex Sig #24 - Low Folio - Front
MassTech_MTCIndex Sig #25 - Low Folio - Front235008_MassTech_MTCIndex - Front 7 - 12/19/14 08:41:52 - Black 235008_MassTech_MTCIndex - Front 7 - 12/19/14 08:41:52 - Cyan 235008_MassTech_MTCIndex - Front 7 - 12/19/14 08:41:52 - Magenta 235008_MassTech_MTCIndex - Front 7 - 12/19/14 08:41:52 - Yellow
Key
2K
ey 3
Key
4
Key
5K
ey 6
Key
7K
ey 8
Key
9K
ey 1
0K
ey 1
1K
ey
12
Key
13
Key
14
Key
15
Key
16
Key
17
Key
18
Key
19
Key
21
Key
2
0K
ey 2
2
KC
MY
M1
M2
M1
M2
M1
M2
M1
M2
M1
M2
M1
M2
M1
M2
M1
M2
M1
M2
M1
M2
M1
M2
2525
M1
M2
25M
1M
225
2525
50M
1M
2M
1M
250
5050
5050
M1
M2
M1
M2
5075
7575
7575
75G
RA
YG
RA
YG
RA
YG
RA
YG
RA
YK
CM
YK
CM
YK
CM
YK
CM
YK
CM
YK
CM
YY
+M
Y+
CC
+M
KC
MY
KC
MY
KC
MY
KP
CM
YK
CM
YK
CM
YK
CM
YK
CM
YK
CM
YK
CM
YG
RA
YK
CM
YM
1M
2M
1M
2M
1M
2M
1M
275
7575
7575
75G
RA
YG
RA
YK
CM
YK
CM
YK
CM
Y
Key
1
KC
MY
M1
M2
50
Key
23M
1M
2st
arst
arK
CM
Y
Kom
ori/G
AT
F
Par
t No.
K-2
8-6(
D)
1/2/
3/4
K1
2
34
1/2/
3/4
C1
2
34
1/2/
3/4
M1
2
34
1/2/
3/4
M1
1/2/
3/4
Y1
2
34
12
34
1/2/
3/4
M2
12
34
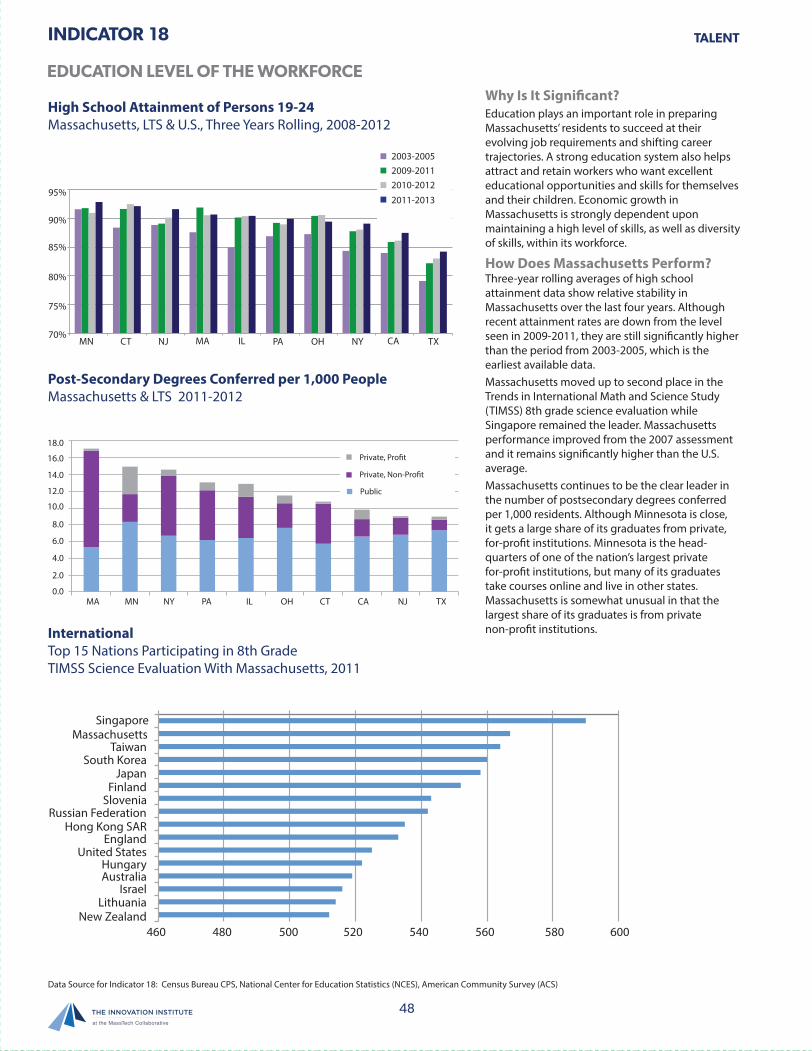
48
INDICATOR
Why Is It Significant?Education plays an important role in preparing Massachusetts’ residents to succeed at their evolving job requirements and shifting career trajectories. A strong education system also helps attract and retain workers who want excellent educational opportunities and skills for themselves and their children. Economic growth in Massachusetts is strongly dependent upon maintaining a high level of skills, as well as diversity of skills, within its workforce.
How Does Massachusetts Perform?Three-year rolling averages of high school attainment data show relative stability in Massachusetts over the last four years. Although recent attainment rates are down from the level seen in 2009-2011, they are still significantly higher than the period from 2003-2005, which is the earliest available data. Massachusetts moved up to second place in the Trends in International Math and Science Study (TIMSS) 8th grade science evaluation while Singapore remained the leader. Massachusetts performance improved from the 2007 assessment and it remains significantly higher than the U.S. average. Massachusetts continues to be the clear leader in the number of postsecondary degrees conferred per 1,000 residents. Although Minnesota is close, it gets a large share of its graduates from private, for-profit institutions. Minnesota is the head-quarters of one of the nation’s largest private for-profit institutions, but many of its graduates take courses online and live in other states. Massachusetts is somewhat unusual in that the largest share of its graduates is from private non-profit institutions.
TALENT
EDUCATION LEVEL OF THE WORKFORCE
18
High School Attainment of Persons 19-24Massachusetts, LTS & U.S., Three Years Rolling, 2008-2012
Post-Secondary Degrees Conferred per 1,000 PeopleMassachusetts & LTS 2011-2012
InternationalTop 15 Nations Participating in 8th GradeTIMSS Science Evaluation With Massachusetts, 2011
95%
90%
85%
80%
75%
70%CACT ILMANJ NYOHPA TXMN
2003-20052009-20112010-2012
2011-2013
18.0
16.0
14.0
12.0
10.0
8.0
6.0
4.0
2.0
0.0MA MN NY PA IL OH CT CA NJ TX
Private, Non-Pro�t
Private, Pro�t
Public
460 480 500 520 540 560 580 600
SingaporeMassachusetts
TaiwanSouth Korea
JapanFinland
SloveniaRussian Federation
Hong Kong SAREngland
United StatesHungaryAustralia
IsraelLithuania
New Zealand
Data Source for Indicator 18: Census Bureau CPS, National Center for Education Statistics (NCES), American Community Survey (ACS)
235008_MassTech_MTCIndex - Back 7 - 12/19/14 08:41:56 - Black235008_MassTech_MTCIndex - Back 7 - 12/19/14 08:41:56 - Cyan235008_MassTech_MTCIndex - Back 7 - 12/19/14 08:41:56 - Magenta235008_MassTech_MTCIndex - Back 7 - 12/19/14 08:41:56 - Yellow
Key 2
Key 3
Key 4
Key 5
Key 6
Key 7
Key 8
Key 9
Key 10
Key 11
Key 12
Key 13
Key 14
Key 15
Key 16
Key 17
Key 18
Key 19
Key 21
Key 20
Key 22
KC
MY
M1
M2
M1
M2
M1
M2
M1
M2
M1
M2
M1
M2
M1
M2
M1
M2
M1
M2
M1
M2
M1
M2
2525
M1
M2
25M
1M
225
2525
50M
1M
2M
1M
250
5050
5050
M1
M2
M1
M2
5075
7575
7575
75G
RA
YG
RA
YG
RA
YG
RA
YG
RA
YK
CM
YK
CM
YK
CM
YK
CM
YK
CM
YK
CM
YY
+M
Y+
CC
+M
KC
MY
KC
MY
KC
MY
KP
CM
YK
CM
YK
CM
YK
CM
YK
CM
YK
CM
YK
CM
YG
RA
YK
CM
YM
1M
2M
1M
2M
1M
2M
1M
275
7575
7575
75G
RA
YG
RA
YK
CM
YK
CM
YK
CM
Y
Key 1
KC
MY
M1
M2
50
Key 23 M
1M
2star
starK
CM
Y
Kom
ori/GA
TF
P
art No. K
-28-6(D)
1/2/3/4 K1
2
34
1/2/3/4 C1
2
34
1/2/3/4 M1
2
34
1/2/3/4 M1
1/2/3/4 Y1
2
34
12
34
1/2/3/4 M2
12
34
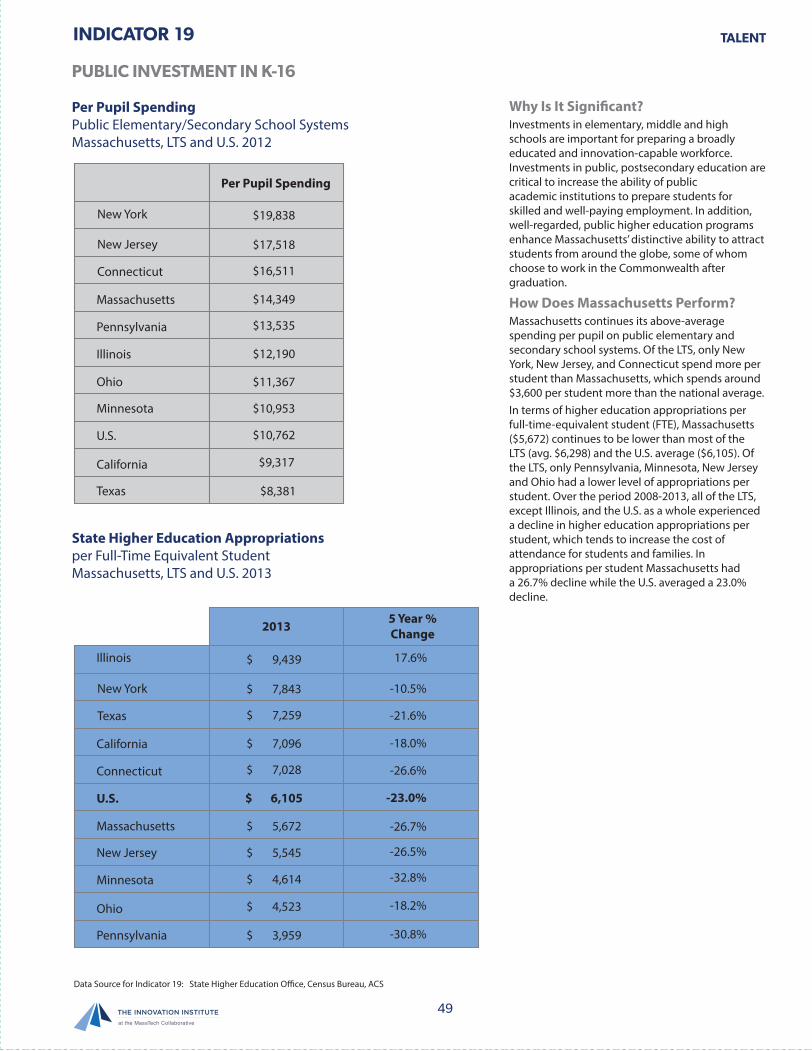
49
INDICATOR TALENT
PUBLIC INVESTMENT IN K-16
19
State Higher Education Appropriationsper Full-Time Equivalent StudentMassachusetts, LTS and U.S. 2013
Per Pupil SpendingPublic Elementary/Secondary School SystemsMassachusetts, LTS and U.S. 2012
2013 5 Year %Change
Illinois 17.6%
-10.5%
-21.6%
-18.0%
-26.6%
-26.7%
-26.5%
-32.8%
-18.2%
-30.8%
-23.0%
New York
Texas
California
Connecticut
U.S.
Massachusetts
New Jersey
Minnesota
Ohio
Pennsylvania
$ 9,439
$ 7,843
$ 7,259
$ 7,096
$ 7,028
$ 5,672
$ 5,545
$ 4,614
$ 4,523
$ 3,959
$ 6,105
Per Pupil Spending
New Jersey
New York
Connecticut
Massachusetts
Pennsylvania
Illinois
Ohio
Minnesota
U.S.
California
Texas
$19,838
$17,518
$16,511
$14,349
$13,535
$11,367
$10,953
$10,762
$9,317
$8,381
$12,190
Why Is It Significant?Investments in elementary, middle and high schools are important for preparing a broadly educated and innovation-capable workforce. Investments in public, postsecondary education are critical to increase the ability of public academic institutions to prepare students for skilled and well-paying employment. In addition, well-regarded, public higher education programs enhance Massachusetts’ distinctive ability to attract students from around the globe, some of whom choose to work in the Commonwealth after graduation.
How Does Massachusetts Perform?Massachusetts continues its above-average spending per pupil on public elementary and secondary school systems. Of the LTS, only New York, New Jersey, and Connecticut spend more per student than Massachusetts, which spends around $3,600 per student more than the national average.In terms of higher education appropriations per full-time-equivalent student (FTE), Massachusetts ($5,672) continues to be lower than most of the LTS (avg. $6,298) and the U.S. average ($6,105). Of the LTS, only Pennsylvania, Minnesota, New Jersey and Ohio had a lower level of appropriations per student. Over the period 2008-2013, all of the LTS, except Illinois, and the U.S. as a whole experienced a decline in higher education appropriations per student, which tends to increase the cost of attendance for students and families. In appropriations per student Massachusetts had a 26.7% decline while the U.S. averaged a 23.0% decline.
Data Source for Indicator 19: State Higher Education Office, Census Bureau, ACS
MassTech_MTCIndex Sig #22 - Low Folio - Front
MassTech_MTCIndex Sig #23 - Low Folio - Front
MassTech_MTCIndex Sig #24 - Low Folio - Front
MassTech_MTCIndex Sig #25 - Low Folio - Front
235008_MassTech_MTCIndex - Front 7 - 12/19/14 08:41:52 - Black 235008_MassTech_MTCIndex - Front 7 - 12/19/14 08:41:52 - Cyan 235008_MassTech_MTCIndex - Front 7 - 12/19/14 08:41:52 - Magenta 235008_MassTech_MTCIndex - Front 7 - 12/19/14 08:41:52 - Yellow
Key
2K
ey 3
Key
4
Key
5K
ey 6
Key
7K
ey 8
Key
9K
ey 1
0K
ey 1
1K
ey
12
Key
13
Key
14
Key
15
Key
16
Key
17
Key
18
Key
19
Key
21
Key
2
0K
ey 2
2
KC
MY
M1
M2
M1
M2
M1
M2
M1
M2
M1
M2
M1
M2
M1
M2
M1
M2
M1
M2
M1
M2
M1
M2
2525
M1
M2
25M
1M
225
2525
50M
1M
2M
1M
250
5050
5050
M1
M2
M1
M2
5075
7575
7575
75G
RA
YG
RA
YG
RA
YG
RA
YG
RA
YK
CM
YK
CM
YK
CM
YK
CM
YK
CM
YK
CM
YY
+M
Y+
CC
+M
KC
MY
KC
MY
KC
MY
KP
CM
YK
CM
YK
CM
YK
CM
YK
CM
YK
CM
YK
CM
YG
RA
YK
CM
YM
1M
2M
1M
2M
1M
2M
1M
275
7575
7575
75G
RA
YG
RA
YK
CM
YK
CM
YK
CM
Y
Key
1
KC
MY
M1
M2
50
Key
23M
1M
2st
arst
arK
CM
Y
Kom
ori/G
AT
F
Par
t No.
K-2
8-6(
D)
1/2/
3/4
K1
2
34
1/2/
3/4
C1
2
34
1/2/
3/4
M1
2
34
1/2/
3/4
M1
1/2/
3/4
Y1
2
34
12
34
1/2/
3/4
M2
12
34
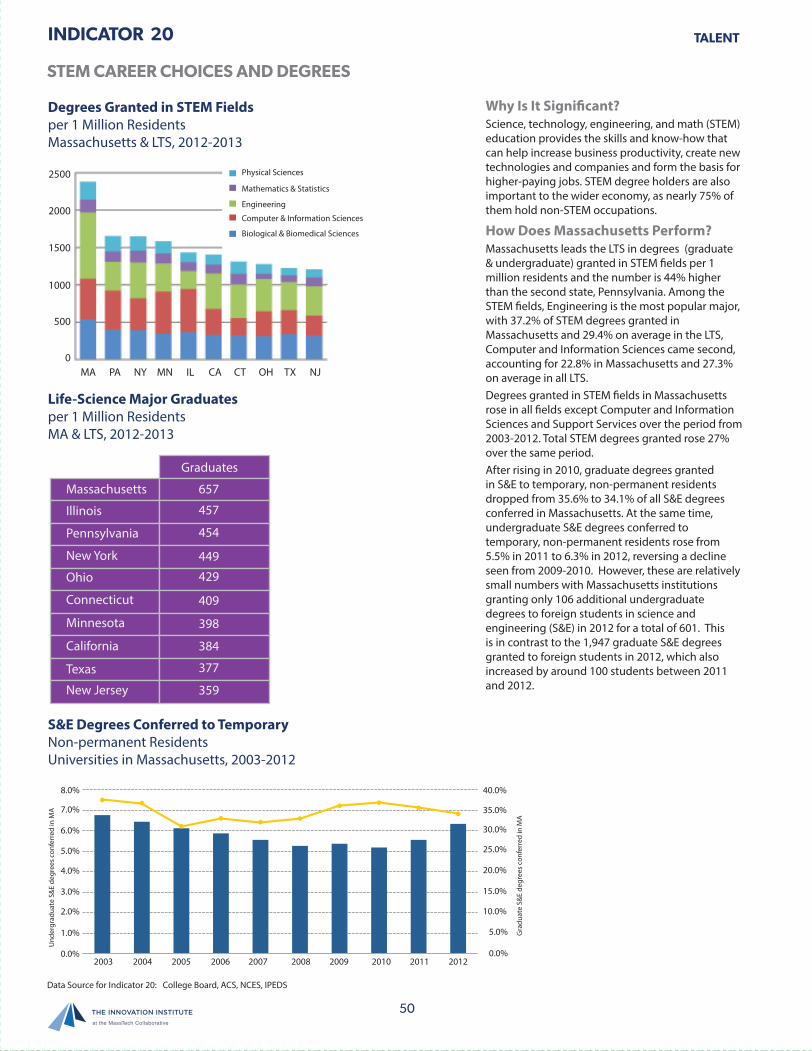
50
INDICATOR
2500
2000
1500
1000
500
0MA PA NY MN IL CA CT OH TX NJ
Physical Sciences
Mathematics & Statistics
Engineering
Computer & Information Sciences
Biological & Biomedical Sciences
Why Is It Significant?Science, technology, engineering, and math (STEM) education provides the skills and know-how that can help increase business productivity, create new technologies and companies and form the basis for higher-paying jobs. STEM degree holders are also important to the wider economy, as nearly 75% of them hold non-STEM occupations.
How Does Massachusetts Perform?Massachusetts leads the LTS in degrees (graduate & undergraduate) granted in STEM fields per 1 million residents and the number is 44% higher than the second state, Pennsylvania. Among the STEM fields, Engineering is the most popular major, with 37.2% of STEM degrees granted in Massachusetts and 29.4% on average in the LTS, Computer and Information Sciences came second, accounting for 22.8% in Massachusetts and 27.3% on average in all LTS. Degrees granted in STEM fields in Massachusetts rose in all fields except Computer and Information Sciences and Support Services over the period from 2003-2012. Total STEM degrees granted rose 27% over the same period.After rising in 2010, graduate degrees granted in S&E to temporary, non-permanent residents dropped from 35.6% to 34.1% of all S&E degrees conferred in Massachusetts. At the same time, undergraduate S&E degrees conferred to temporary, non-permanent residents rose from 5.5% in 2011 to 6.3% in 2012, reversing a decline seen from 2009-2010. However, these are relatively small numbers with Massachusetts institutions granting only 106 additional undergraduate degrees to foreign students in science and engineering (S&E) in 2012 for a total of 601. This is in contrast to the 1,947 graduate S&E degrees granted to foreign students in 2012, which also increased by around 100 students between 2011 and 2012.
TALENT
STEM CAREER CHOICES AND DEGREES
20
Degrees Granted in STEM Fieldsper 1 Million ResidentsMassachusetts & LTS, 2012-2013
Life-Science Major Graduatesper 1 Million ResidentsMA & LTS, 2012-2013
S&E Degrees Conferred to TemporaryNon-permanent ResidentsUniversities in Massachusetts, 2003-2012
8.0% 40.0%
35.0%
30.0%
25.0%
20.0%
15.0%
10.0%
5.0%
0.0%
7.0%
6.0%
5.0%
4.0%
3.0%
2.0%
1.0%
0.0%2003 2004 2005 2006 2007 2008 2009 2010 2011 2012
Und
ergr
adua
te S
&E
degr
ees
conf
erre
d in
MA
Gra
duat
e S&
E de
gree
s co
nfer
red
in M
A
Graduates
Massachusetts 657
457
454
449
429
409
398
384
377
359
Illinois
Pennsylvania
New York
Ohio
Connecticut
Minnesota
California
Texas
New Jersey
Data Source for Indicator 20: College Board, ACS, NCES, IPEDS
235008_MassTech_MTCIndex - Back 7 - 12/19/14 08:41:56 - Black235008_MassTech_MTCIndex - Back 7 - 12/19/14 08:41:56 - Cyan235008_MassTech_MTCIndex - Back 7 - 12/19/14 08:41:56 - Magenta235008_MassTech_MTCIndex - Back 7 - 12/19/14 08:41:56 - YellowK
ey 2K
ey 3K
ey 4K
ey 5K
ey 6K
ey 7K
ey 8K
ey 9K
ey 10K
ey 11K
ey 12K
ey 13K
ey 14K
ey 15K
ey 16K
ey 17K
ey 18K
ey 19K
ey 21K
ey 20K
ey 22
KC
MY
M1
M2
M1
M2
M1
M2
M1
M2
M1
M2
M1
M2
M1
M2
M1
M2
M1
M2
M1
M2
M1
M2
2525
M1
M2
25M
1M
225
2525
50M
1M
2M
1M
250
5050
5050
M1
M2
M1
M2
5075
7575
7575
75G
RA
YG
RA
YG
RA
YG
RA
YG
RA
YK
CM
YK
CM
YK
CM
YK
CM
YK
CM
YK
CM
YY
+M
Y+
CC
+M
KC
MY
KC
MY
KC
MY
KP
CM
YK
CM
YK
CM
YK
CM
YK
CM
YK
CM
YK
CM
YG
RA
YK
CM
YM
1M
2M
1M
2M
1M
2M
1M
275
7575
7575
75G
RA
YG
RA
YK
CM
YK
CM
YK
CM
Y
Key 1
KC
MY
M1
M2
50
Key 23 M
1M
2star
starK
CM
Y
Kom
ori/GA
TF
P
art No. K
-28-6(D)
1/2/3/4 K1
2
34
1/2/3/4 C1
2
34
1/2/3/4 M1
2
34
1/2/3/4 M1
1/2/3/4 Y1
2
34
12
34
1/2/3/4 M2
12
34
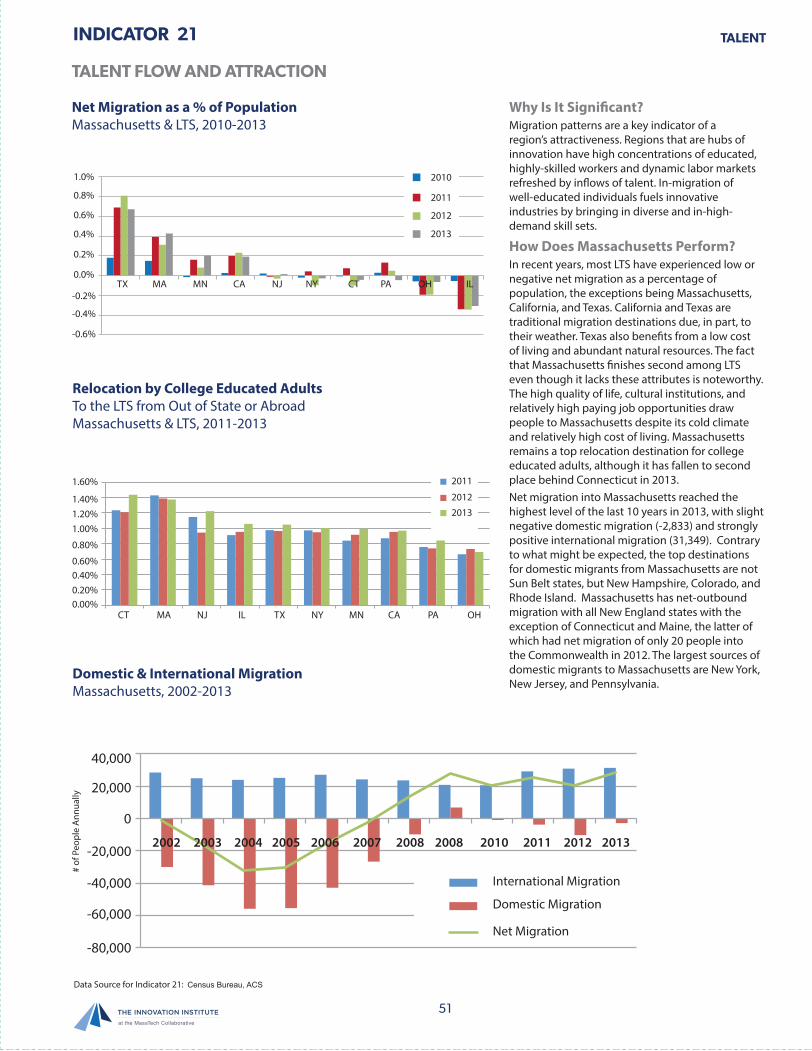
51
INDICATOR TALENT
TALENT FLOW AND ATTRACTION
21
Net Migration as a % of PopulationMassachusetts & LTS, 2010-2013
Domestic & International MigrationMassachusetts, 2002-2013
Relocation by College Educated AdultsTo the LTS from Out of State or AbroadMassachusetts & LTS, 2011-2013
International Migration
Domestic Migration
Net Migration
40,000
20,000
-20,000
-40,000
-60,000
-80,000
0
2002 2003 2004 2005 2006 2007 2008 2008 2010 2011 2012 2013
# of
Peo
ple
Ann
ually
2013
2012
2011
20101.0%
0.8%
0.6%
0.4%
0.2%
0.0%
-0.2%
-0.4%
-0.6%
TX MA MN CA NJ NY CT PA OH IL
Why Is It Significant?Migration patterns are a key indicator of a region’s attractiveness. Regions that are hubs of innovation have high concentrations of educated, highly-skilled workers and dynamic labor markets refreshed by inflows of talent. In-migration of well-educated individuals fuels innovative industries by bringing in diverse and in-high-demand skill sets.
How Does Massachusetts Perform?In recent years, most LTS have experienced low or negative net migration as a percentage of population, the exceptions being Massachusetts, California, and Texas. California and Texas are traditional migration destinations due, in part, to their weather. Texas also benefits from a low cost of living and abundant natural resources. The fact that Massachusetts finishes second among LTS even though it lacks these attributes is noteworthy. The high quality of life, cultural institutions, and relatively high paying job opportunities draw people to Massachusetts despite its cold climate and relatively high cost of living. Massachusetts remains a top relocation destination for college educated adults, although it has fallen to second place behind Connecticut in 2013.Net migration into Massachusetts reached the highest level of the last 10 years in 2013, with slight negative domestic migration (-2,833) and strongly positive international migration (31,349). Contrary to what might be expected, the top destinations for domestic migrants from Massachusetts are not Sun Belt states, but New Hampshire, Colorado, and Rhode Island. Massachusetts has net-outbound migration with all New England states with the exception of Connecticut and Maine, the latter of which had net migration of only 20 people into the Commonwealth in 2012. The largest sources of domestic migrants to Massachusetts are New York, New Jersey, and Pennsylvania.
Data Source for Indicator 21: Census Bureau, ACS
1.60%
1.40%1.20%1.00%
0.80%
0.60%0.40%0.20%0.00%
CT MA NJ IL TX NY MN CA PA OH
2011
2012
2013
MassTech_MTCIndex Sig #26 - Low Folio - Front
MassTech_MTCIndex Sig #27 - Low Folio - Front
MassTech_MTCIndex Sig #28 - Low Folio - Front
MassTech_MTCIndex Sig #29 - Low Folio - Front235008_MassTech_MTCIndex - Front 8 - 12/19/14 08:41:59 - Black 235008_MassTech_MTCIndex - Front 8 - 12/19/14 08:41:59 - Cyan 235008_MassTech_MTCIndex - Front 8 - 12/19/14 08:41:59 - Magenta 235008_MassTech_MTCIndex - Front 8 - 12/19/14 08:41:59 - Yellow
Key
2K
ey 3
Key
4
Key
5K
ey 6
Key
7K
ey 8
Key
9K
ey 1
0K
ey 1
1K
ey
12
Key
13
Key
14
Key
15
Key
16
Key
17
Key
18
Key
19
Key
21
Key
2
0K
ey 2
2
KC
MY
M1
M2
M1
M2
M1
M2
M1
M2
M1
M2
M1
M2
M1
M2
M1
M2
M1
M2
M1
M2
M1
M2
2525
M1
M2
25M
1M
225
2525
50M
1M
2M
1M
250
5050
5050
M1
M2
M1
M2
5075
7575
7575
75G
RA
YG
RA
YG
RA
YG
RA
YG
RA
YK
CM
YK
CM
YK
CM
YK
CM
YK
CM
YK
CM
YY
+M
Y+
CC
+M
KC
MY
KC
MY
KC
MY
KP
CM
YK
CM
YK
CM
YK
CM
YK
CM
YK
CM
YK
CM
YG
RA
YK
CM
YM
1M
2M
1M
2M
1M
2M
1M
275
7575
7575
75G
RA
YG
RA
YK
CM
YK
CM
YK
CM
Y
Key
1
KC
MY
M1
M2
50
Key
23M
1M
2st
arst
arK
CM
Y
Kom
ori/G
AT
F
Par
t No.
K-2
8-6(
D)
1/2/
3/4
K1
2
34
1/2/
3/4
C1
2
34
1/2/
3/4
M1
2
34
1/2/
3/4
M1
1/2/
3/4
Y1
2
34
12
34
1/2/
3/4
M2
12
34
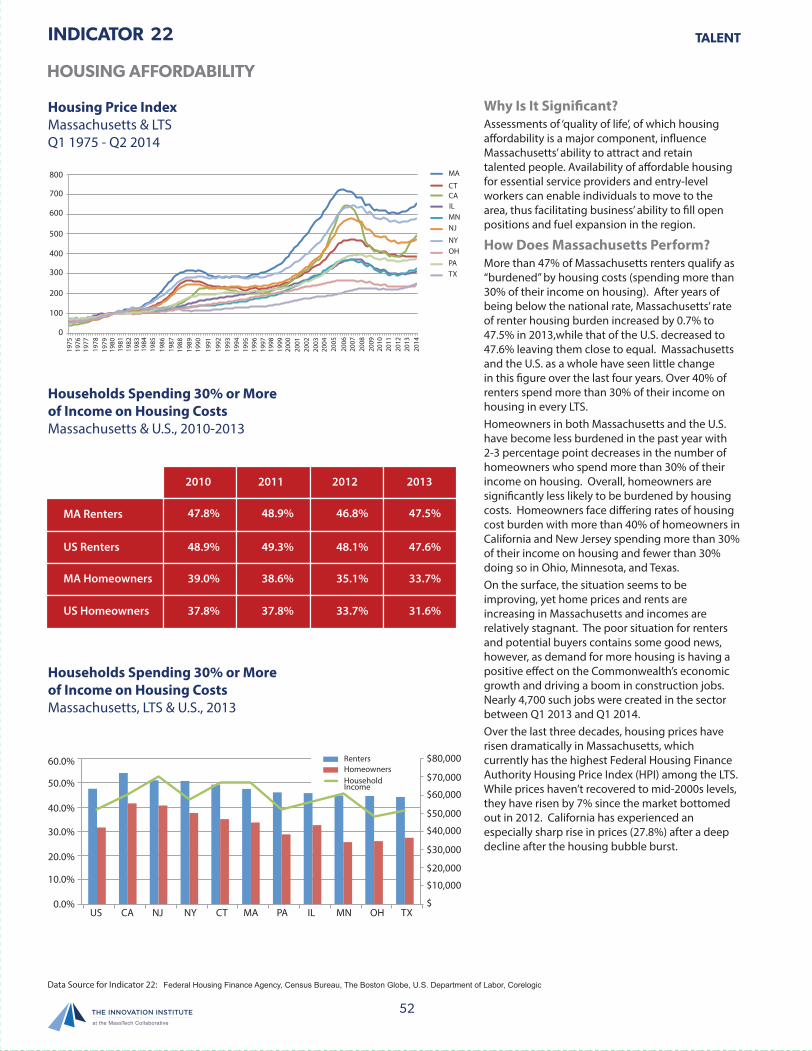
52
INDICATOR
Why Is It Significant?Assessments of ‘quality of life’, of which housing affordability is a major component, influence Massachusetts’ ability to attract and retain talented people. Availability of affordable housing for essential service providers and entry-level workers can enable individuals to move to the area, thus facilitating business’ ability to fill open positions and fuel expansion in the region.
How Does Massachusetts Perform?More than 47% of Massachusetts renters qualify as “burdened” by housing costs (spending more than 30% of their income on housing). After years of being below the national rate, Massachusetts’ rate of renter housing burden increased by 0.7% to 47.5% in 2013,while that of the U.S. decreased to 47.6% leaving them close to equal. Massachusetts and the U.S. as a whole have seen little change in this figure over the last four years. Over 40% of renters spend more than 30% of their income on housing in every LTS. Homeowners in both Massachusetts and the U.S. have become less burdened in the past year with 2-3 percentage point decreases in the number of homeowners who spend more than 30% of their income on housing. Overall, homeowners are significantly less likely to be burdened by housing costs. Homeowners face differing rates of housing cost burden with more than 40% of homeowners in California and New Jersey spending more than 30% of their income on housing and fewer than 30% doing so in Ohio, Minnesota, and Texas. On the surface, the situation seems to be improving, yet home prices and rents are increasing in Massachusetts and incomes are relatively stagnant. The poor situation for renters and potential buyers contains some good news, however, as demand for more housing is having a positive effect on the Commonwealth’s economic growth and driving a boom in construction jobs. Nearly 4,700 such jobs were created in the sector between Q1 2013 and Q1 2014. Over the last three decades, housing prices have risen dramatically in Massachusetts, which currently has the highest Federal Housing Finance Authority Housing Price Index (HPI) among the LTS. While prices haven’t recovered to mid-2000s levels, they have risen by 7% since the market bottomed out in 2012. California has experienced an especially sharp rise in prices (27.8%) after a deep decline after the housing bubble burst.
TALENT
HOUSING AFFORDABILITY
22
Housing Price IndexMassachusetts & LTSQ1 1975 - Q2 2014
Households Spending 30% or More of Income on Housing CostsMassachusetts & U.S., 2010-2013
Households Spending 30% or More of Income on Housing CostsMassachusetts, LTS & U.S., 2013
MA
CTCAILMNNJ
NYOHPATX
800
700
600
500
400
300
200
100
0
MA Renters
US Renters
MA Homeowners
US Homeowners
2010
47.8%
48.9%
39.0%
37.8%
48.9%
49.3%
38.6%
37.8%
46.8%
48.1%
35.1%
33.7%
47.5%
47.6%
33.7%
31.6%
2011 2012 2013
2010
60.0%
US CA NJ NY CT MA PA IL MN OH TX
50.0%
40.0%
30.0%
20.0%
10.0%
0.0%
$80,000
$70,000
$60,000
$50,000
$40,000
$30,000
$20,000
$10,000
$
RentersHomeownersHouseholdIncome
Data Source for Indicator 22: Federal Housing Finance Agency, Census Bureau, The Boston Globe, U.S. Department of Labor, Corelogic
235008_MassTech_MTCIndex - Back 8 - 12/19/14 08:42:04 - Black235008_MassTech_MTCIndex - Back 8 - 12/19/14 08:42:04 - Cyan235008_MassTech_MTCIndex - Back 8 - 12/19/14 08:42:04 - Magenta235008_MassTech_MTCIndex - Back 8 - 12/19/14 08:42:04 - Yellow
Key 2
Key 3
Key 4
Key 5
Key 6
Key 7
Key 8
Key 9
Key 10
Key 11
Key 12
Key 13
Key 14
Key 15
Key 16
Key 17
Key 18
Key 19
Key 21
Key 20
Key 22
KC
MY
M1
M2
M1
M2
M1
M2
M1
M2
M1
M2
M1
M2
M1
M2
M1
M2
M1
M2
M1
M2
M1
M2
2525
M1
M2
25M
1M
225
2525
50M
1M
2M
1M
250
5050
5050
M1
M2
M1
M2
5075
7575
7575
75G
RA
YG
RA
YG
RA
YG
RA
YG
RA
YK
CM
YK
CM
YK
CM
YK
CM
YK
CM
YK
CM
YY
+M
Y+
CC
+M
KC
MY
KC
MY
KC
MY
KP
CM
YK
CM
YK
CM
YK
CM
YK
CM
YK
CM
YK
CM
YG
RA
YK
CM
YM
1M
2M
1M
2M
1M
2M
1M
275
7575
7575
75G
RA
YG
RA
YK
CM
YK
CM
YK
CM
Y
Key 1
KC
MY
M1
M2
50
Key 23 M
1M
2star
starK
CM
Y
Kom
ori/GA
TF
P
art No. K
-28-6(D)
1/2/3/4 K1
2
34
1/2/3/4 C1
2
34
1/2/3/4 M1
2
34
1/2/3/4 M1
1/2/3/4 Y1
2
34
12
34
1/2/3/4 M2
12
34

53
INDICATOR
Why Is It Significant?A state’s infrastructure is more than just the sum of its roads and bridges. Infrastructure is comprised of the transportation, communication, and energy systems within a state. It plays a crucial role in allowing goods and services to be moved into, within, and out of Massachusetts, whether physically or electronically. Energy is the unseen component that allows business to operate. Everything from data centers and offices to factories and hospitals consume it.Fast broadband connections increase business productivity and allow consumers to access a wider range of goods and services online. The amount of time people spend commuting to and from work imposes a hidden cost on the economy, consuming time that could otherwise be spent productively elsewhere. The more productive workers become, the more the cost of this lost time increases.
How Does Massachusetts Perform?Massachusetts maintains faster broadband speeds than the rest of the LTS, although Connecticut is close behind. The five Northeastern states among the LTS are also the top five in terms of average broadband speed, possibly due to their greater density, which makes broadband infrastructure more economically feasible.Massachusetts industrial natural gas prices have roughly tracked U.S. and LTS prices since 2001. However, the recent decline in industrial prices in Massachusetts has been slower than either the U.S. or LTS in part due to a lack of pipeline capacity into New England. Industrial natural gas prices are important to manufacturing industries, both as a source of energy and as a feedstock for certain industrial processes. Finally, Boston is well known for its heavy traffic and indeed, Massachusetts metro areas with more than 250,000 commuters have longer commutes than those in California. However, New York, New Jersey, and Illinois commuters spend even more time in traffic. Metro areas in Connecticut, Minnesota, and Ohio have shorter commutes than the U.S. average.
TALENT
INFRASTRUCTURE
23
Average Broadband SpeedsMassachusetts & LTS, 2012
Industrial Natural Gas Prices$ per thousand cubic feetMassachusetts, U.S. & LTS, 2002-2012
Average Metropolitan Commute TimeLarge Metros (above 250K commuters)Hours/YearMassachusetts & LTS, 2012
U.S. Rank
6
7
11
12
15
16
17
29
30
34
State
Massachusetts
Connecticut
New York
Pennsylvania
New Jersey
California
Minnesota
Illinois
Ohio
Texas
MB/s
9.12
9.1
8.25
8.07
7.79
7.68
7.48
6.69
6.53
6.35
300
280260240220200180160140120100
NY NJ IL MA CA PA TX CT MN OH
275257 257
234 230 225 219207 204
193212 (US)
$16
U.S.
MA
LTS
$14
$12
$10$8
$6$4
$2
$2001 2002 2004 2005 2006 2008 2009 2010 20132012
Data Source for Indicator 23: Census Bureau, ACS, State Technology Magazine, Energy Information Administration
MassTech_MTCIndex Sig #26 - Low Folio - Front
MassTech_MTCIndex Sig #27 - Low Folio - Front
MassTech_MTCIndex Sig #28 - Low Folio - Front
MassTech_MTCIndex Sig #29 - Low Folio - Front
235008_MassTech_MTCIndex - Front 8 - 12/19/14 08:41:59 - Black 235008_MassTech_MTCIndex - Front 8 - 12/19/14 08:41:59 - Cyan 235008_MassTech_MTCIndex - Front 8 - 12/19/14 08:41:59 - Magenta 235008_MassTech_MTCIndex - Front 8 - 12/19/14 08:41:59 - Yellow
Key
2K
ey 3
Key
4
Key
5K
ey 6
Key
7K
ey 8
Key
9K
ey 1
0K
ey 1
1K
ey
12
Key
13
Key
14
Key
15
Key
16
Key
17
Key
18
Key
19
Key
21
Key
2
0K
ey 2
2
KC
MY
M1
M2
M1
M2
M1
M2
M1
M2
M1
M2
M1
M2
M1
M2
M1
M2
M1
M2
M1
M2
M1
M2
2525
M1
M2
25M
1M
225
2525
50M
1M
2M
1M
250
5050
5050
M1
M2
M1
M2
5075
7575
7575
75G
RA
YG
RA
YG
RA
YG
RA
YG
RA
YK
CM
YK
CM
YK
CM
YK
CM
YK
CM
YK
CM
YY
+M
Y+
CC
+M
KC
MY
KC
MY
KC
MY
KP
CM
YK
CM
YK
CM
YK
CM
YK
CM
YK
CM
YK
CM
YG
RA
YK
CM
YM
1M
2M
1M
2M
1M
2M
1M
275
7575
7575
75G
RA
YG
RA
YK
CM
YK
CM
YK
CM
Y
Key
1
KC
MY
M1
M2
50
Key
23M
1M
2st
arst
arK
CM
Y
Kom
ori/G
AT
F
Par
t No.
K-2
8-6(
D)
1/2/
3/4
K1
2
34
1/2/
3/4
C1
2
34
1/2/
3/4
M1
2
34
1/2/
3/4
M1
1/2/
3/4
Y1
2
34
12
34
1/2/
3/4
M2
12
34

235008_MassTech_MTCIndex - Back 8 - 12/19/14 08:42:04 - Black235008_MassTech_MTCIndex - Back 8 - 12/19/14 08:42:04 - Cyan235008_MassTech_MTCIndex - Back 8 - 12/19/14 08:42:04 - Magenta235008_MassTech_MTCIndex - Back 8 - 12/19/14 08:42:04 - Yellow
Key 2
Key 3
Key 4
Key 5
Key 6
Key 7
Key 8
Key 9
Key 10
Key 11
Key 12
Key 13
Key 14
Key 15
Key 16
Key 17
Key 18
Key 19
Key 21
Key 20
Key 22
KC
MY
M1
M2
M1
M2
M1
M2
M1
M2
M1
M2
M1
M2
M1
M2
M1
M2
M1
M2
M1
M2
M1
M2
2525
M1
M2
25M
1M
225
2525
50M
1M
2M
1M
250
5050
5050
M1
M2
M1
M2
5075
7575
7575
75G
RA
YG
RA
YG
RA
YG
RA
YG
RA
YK
CM
YK
CM
YK
CM
YK
CM
YK
CM
YK
CM
YY
+M
Y+
CC
+M
KC
MY
KC
MY
KC
MY
KP
CM
YK
CM
YK
CM
YK
CM
YK
CM
YK
CM
YK
CM
YG
RA
YK
CM
YM
1M
2M
1M
2M
1M
2M
1M
275
7575
7575
75G
RA
YG
RA
YK
CM
YK
CM
YK
CM
Y
Key 1
KC
MY
M1
M2
50
Key 23 M
1M
2star
starK
CM
Y
Kom
ori/GA
TF
P
art No. K
-28-6(D)
1/2/3/4 K1
2
34
1/2/3/4 C1
2
34
1/2/3/4 M1
2
34
1/2/3/4 M1
1/2/3/4 Y1
2
34
12
34
1/2/3/4 M2
12
34

MASSACHUSETTS INNOVATION ECONOMY ANNUAL INDEX
55
APPENDIX
APPENDIX
DATA SOURCES FOR INDICATORS AND SELECTION OF LEADING TECHNOLOGY STATES (LTS)
State ScoreTop Ten
Massachusetts 2.27 California 2.22Pennsylvania 2.05Connecticut 1.75New York 1.73Illinois 1.73 Ohio 1.67New Jersey 1.60Minnesota 1.55Texas 1.55
North Carolina 1.44New Hampshire 1.40Rhode Island 1.37Missouri 1.36Wisconsin 1.36
Next Five
Source: BLS QCEW
Data AvailabilityIndicators are calculated with data from proprietary and other existing secondary sources. In most cases, data from these sources were organized and processed for use in the Index. Since these data are derived from a wide range of sources, content of the data sources and time frames are not identical and cannot be compared without adjustments. This appendix provides information on the data sources for each indicator.
Price AdjustmentThe 2014 Index uses inflation-adjusted figures for most indicators. Dollar figures represented in this report, where indicated, are‘chained’ (adjusted for inflation) to the latest year of data unless otherwise indicated. Price adjustments are according to the Consumer Price Index for all Urban Consumers, U.S. City Average, All Items, Not Seasonally Adjusted. Bureau of Labor Statistics, US Department of Labor (www.bls.gov/data).
I. Selection Of Leading Technology States (LTS) For Benchmarking Massachusetts Performance
The Index benchmarks Massachusetts performance against other leading states and nations to provide the basis for comparison.. The LTS list includes: California, Connecticut, Illinois, Minnesota, New Jersey, New York, Ohio, Pennsylvania, and Texas. In 2014 the LTS were chosen using three criteria: (i.) by the number of select key industry sectors with a high concentration (10% above average) of employment, (ii.) the percent of employment in these sectors, and (iii.) the size of each states’ innovation economy (measured by number of employees). The sectors used to represent the Innovation Economy include: Bio-pharma & Medical Devices, Computer & Communication Hardware, Defense Manufacturing & Instrumentation, Financial Services, Postsecondary Education, Scientific, Technical, & Management Services, and Software & Communications Services. The sector employment concentration for each state measures sector employment as a percent of total employment to the same measure for the US as a whole. This ratio, called the ‘location quotient’ (LQ), is above average if greater than one. The three criteria are assessed simultaneously and with equal weighting. The score assigned to each state for each criterion is between 0 and 1, with 1 going to the leading state and 0 going to the bottom state. The scores for the rest of the states are determined by their relative position within the spread of data. The criteria scores are added together to get an overall score. The states with the 10 highest overall scores are then chosen for the LTS.
MassTech_MTCIndex Sig #26 - Low Folio - Front
MassTech_MTCIndex Sig #27 - Low Folio - Front
MassTech_MTCIndex Sig #28 - Low Folio - Front
MassTech_MTCIndex Sig #29 - Low Folio - Front235008_MassTech_MTCIndex - Front 8 - 12/19/14 08:41:59 - Black 235008_MassTech_MTCIndex - Front 8 - 12/19/14 08:41:59 - Cyan 235008_MassTech_MTCIndex - Front 8 - 12/19/14 08:41:59 - Magenta 235008_MassTech_MTCIndex - Front 8 - 12/19/14 08:41:59 - Yellow
Key
2K
ey 3
Key
4
Key
5K
ey 6
Key
7K
ey 8
Key
9K
ey 1
0K
ey 1
1K
ey
12
Key
13
Key
14
Key
15
Key
16
Key
17
Key
18
Key
19
Key
21
Key
2
0K
ey 2
2
KC
MY
M1
M2
M1
M2
M1
M2
M1
M2
M1
M2
M1
M2
M1
M2
M1
M2
M1
M2
M1
M2
M1
M2
2525
M1
M2
25M
1M
225
2525
50M
1M
2M
1M
250
5050
5050
M1
M2
M1
M2
5075
7575
7575
75G
RA
YG
RA
YG
RA
YG
RA
YG
RA
YK
CM
YK
CM
YK
CM
YK
CM
YK
CM
YK
CM
YY
+M
Y+
CC
+M
KC
MY
KC
MY
KC
MY
KP
CM
YK
CM
YK
CM
YK
CM
YK
CM
YK
CM
YK
CM
YG
RA
YK
CM
YM
1M
2M
1M
2M
1M
2M
1M
275
7575
7575
75G
RA
YG
RA
YK
CM
YK
CM
YK
CM
Y
Key
1
KC
MY
M1
M2
50
Key
23M
1M
2st
arst
arK
CM
Y
Kom
ori/G
AT
F
Par
t No.
K-2
8-6(
D)
1/2/
3/4
K1
2
34
1/2/
3/4
C1
2
34
1/2/
3/4
M1
2
34
1/2/
3/4
M1
1/2/
3/4
Y1
2
34
12
34
1/2/
3/4
M2
12
34

MASSACHUSETTS INNOVATION ECONOMY ANNUAL INDEX
56
APPENDIX
II. Notes On Selection Of Comparison Nations
For all the indicators that include international comparisons, countries displayed on the graph are the top performers for that measure. Some countries were excluded from comparison due to a lack of data reported for required years.
III. Notes On International Data Sources
For countries where the school year or the fiscal year spans two calendar years, the year is cited according to the later year. For example, 2004/05 is presented as 2005. All international population estimates are obtained from the World Bank. Total population is based on the de facto definition of population, which counts all residents regardless of legal status or citizenship—except for refugees not permanently settled in the country of asylum, who are generally considered part of the population of their country of origin. The numbers shown are mid-year estimates. The World Bank estimates population from various sources including census reports, the United Nations Population Division’s World Population Prospects, national statistical offices, household surveys conducted by national agencies and Macro International.
IV. Notes On The Creation Of The Data Dashboard
Determination of how Massachusetts was doing, relative to the LTS, is based upon a comparison with the LTS using previous time periods where possible (i.e., is Massachusetts growing faster on a certain measure than most LTS?).
235008_MassTech_MTCIndex - Back 8 - 12/19/14 08:42:04 - Black235008_MassTech_MTCIndex - Back 8 - 12/19/14 08:42:04 - Cyan235008_MassTech_MTCIndex - Back 8 - 12/19/14 08:42:04 - Magenta235008_MassTech_MTCIndex - Back 8 - 12/19/14 08:42:04 - Yellow
Key 2
Key 3
Key 4
Key 5
Key 6
Key 7
Key 8
Key 9
Key 10
Key 11
Key 12
Key 13
Key 14
Key 15
Key 16
Key 17
Key 18
Key 19
Key 21
Key 20
Key 22
KC
MY
M1
M2
M1
M2
M1
M2
M1
M2
M1
M2
M1
M2
M1
M2
M1
M2
M1
M2
M1
M2
M1
M2
2525
M1
M2
25M
1M
225
2525
50M
1M
2M
1M
250
5050
5050
M1
M2
M1
M2
5075
7575
7575
75G
RA
YG
RA
YG
RA
YG
RA
YG
RA
YK
CM
YK
CM
YK
CM
YK
CM
YK
CM
YK
CM
YY
+M
Y+
CC
+M
KC
MY
KC
MY
KC
MY
KP
CM
YK
CM
YK
CM
YK
CM
YK
CM
YK
CM
YK
CM
YG
RA
YK
CM
YM
1M
2M
1M
2M
1M
2M
1M
275
7575
7575
75G
RA
YG
RA
YK
CM
YK
CM
YK
CM
Y
Key 1
KC
MY
M1
M2
50
Key 23 M
1M
2star
starK
CM
Y
Kom
ori/GA
TF
P
art No. K
-28-6(D)
1/2/3/4 K1
2
34
1/2/3/4 C1
2
34
1/2/3/4 M1
2
34
1/2/3/4 M1
1/2/3/4 Y1
2
34
12
34
1/2/3/4 M2
12
34
MASSACHUSETTS INNOVATION ECONOMY ANNUAL INDEX
57
APPENDIX
V. Notes On Data Sources For Individual Indicators
Indicator 1: Industry Sector Employment And Wages
Data on sector wages are from the Bureau of Labor Statistics’ Quarterly Census of Employment and Wages (www.bls.gov/cew). This survey derives employment and wage data from workers covered by state unemployment insurance laws and federal workers covered by the Unemployment Compensation for Federal Employees program. Wage data denote total compensation paid during the four calendar quarters regardless of when the services were performed. Wage data include pay for vacation and other paid leave, bonuses, stock options, tips, the cash value of meals and lodging, and contributions to deferred compensation plans. Definitions for each key industry sector are in Appendix B.
Indicator 2: Occupations And WagesThe U.S. Bureau of Labor Statistics, Occupational Employment Estimates (OES) (www.bls.gov/oes/oes_dl.htm) program estimates the number of people employed in certain occupations and wages paid to them. The OES data include all full-time and part-time wage and salary workers in non-farm industries. Self-employed persons are not included in the estimates. The OES uses the Standard Occupational Classification (SOC) system to classify workers. MassTech aggregated the 22 major occupational categories of the OES into 10 occupational categories for analysis.
The occupational categories in the Index are:
• Arts & Media: Arts, design, entertainment, sports and media occupations. • Construction & Maintenance: Construction and extraction occupations; Installation, maintenance and repair occupations. • Education: Education, training and library occupations. • Healthcare: Healthcare practitioner and technical occupations; Healthcare support occupations. • Computer and Mathematical: Computer and mathematical occupations. • Science, Architecture and Engineering Occupations: Architectural and engineering occupations; life, physical and social science occupations. • Business, Financial and Legal Occupations: Management occupations; Business and financial operations occupations; and Legal occupations. • Production: Production occupations. • Sales & Office: Sales and related occupations; Office and administrative support occupations. • Community and Social Service: Community and social service occupations. • Other Services: Protective service occupations; Food preparation and serving related occupations; Building and grounds cleaning and maintenance occupations; Personal care and service occupations; Transportation and material moving occupations; Farming, fishing and forestry occupations.
S&E Occupations as a Percent of the Workforce: Data taken from Table 8-33: Individuals in S&E Occupations as a Percent of the Workforce, NSF Science & Engineering Indicators.
Indicator 3: Median Household Income
Median Household IncomeMedian household income data are from the U.S. Census Bureau, American Community Survey using figures adjusted to2013 dollars.
Income DistributionData for Distribution of Income are from the American Community Survey from the U.S. Census Bureau. Income is the sum of the amounts reported separately for the following eight types of income: wage or salary income; net self-employment income; interest, dividends, or net rental or royalty income from estates and trusts; Social Security or railroad retirement income; Supplemental Security Income; public assistance or welfare payments; retirement, survivor, or disability pensions; and all other income.
Wages And Salaries Paid.Wage and salary data from the Bureau of Economic Analysis, SQ7N Wage and salary disbursements by major NAICS industry, wage and salary disbursements by place of work (millions of dollars) (www.bea.gov).
MassTech_MTCIndex Sig #26 - Low Folio - Front
MassTech_MTCIndex Sig #27 - Low Folio - Front
MassTech_MTCIndex Sig #28 - Low Folio - Front
MassTech_MTCIndex Sig #29 - Low Folio - Front
235008_MassTech_MTCIndex - Front 8 - 12/19/14 08:41:59 - Black 235008_MassTech_MTCIndex - Front 8 - 12/19/14 08:41:59 - Cyan 235008_MassTech_MTCIndex - Front 8 - 12/19/14 08:41:59 - Magenta 235008_MassTech_MTCIndex - Front 8 - 12/19/14 08:41:59 - Yellow
Key
2K
ey 3
Key
4
Key
5K
ey 6
Key
7K
ey 8
Key
9K
ey 1
0K
ey 1
1K
ey
12
Key
13
Key
14
Key
15
Key
16
Key
17
Key
18
Key
19
Key
21
Key
2
0K
ey 2
2
KC
MY
M1
M2
M1
M2
M1
M2
M1
M2
M1
M2
M1
M2
M1
M2
M1
M2
M1
M2
M1
M2
M1
M2
2525
M1
M2
25M
1M
225
2525
50M
1M
2M
1M
250
5050
5050
M1
M2
M1
M2
5075
7575
7575
75G
RA
YG
RA
YG
RA
YG
RA
YG
RA
YK
CM
YK
CM
YK
CM
YK
CM
YK
CM
YK
CM
YY
+M
Y+
CC
+M
KC
MY
KC
MY
KC
MY
KP
CM
YK
CM
YK
CM
YK
CM
YK
CM
YK
CM
YK
CM
YG
RA
YK
CM
YM
1M
2M
1M
2M
1M
2M
1M
275
7575
7575
75G
RA
YG
RA
YK
CM
YK
CM
YK
CM
Y
Key
1
KC
MY
M1
M2
50
Key
23M
1M
2st
arst
arK
CM
Y
Kom
ori/G
AT
F
Par
t No.
K-2
8-6(
D)
1/2/
3/4
K1
2
34
1/2/
3/4
C1
2
34
1/2/
3/4
M1
2
34
1/2/
3/4
M1
1/2/
3/4
Y1
2
34
12
34
1/2/
3/4
M2
12
34
MASSACHUSETTS INNOVATION ECONOMY ANNUAL INDEX
58
APPENDIX
Indicator 4: Industry Output
Industry OutputIndustry output data are obtained from the Moody’s economy.com Data Buffet. Moody’s estimates are based on industry output data for 2 and 3 digit NAICS produced by the Bureau of Economic Analysis. Indicator 5: ExportsManufacturing exports data are from the U.S. Census Bureau, Foreign Trade Division.
Indicator 6: Research And Development Performed
Research And Development (R&D) PerformedData are from the National Science Foundation (NSF), “Table: U.S. research and development expenditures, by state, performingsector and source of funding”. Data used are the totals for all R&D, Federal, FFRDCs, Business, U&C and Other Nonprofit.
Industry Performed Research And Development (R&D) As A Percent Of Industry OutputData on industry performed R&D are from the NSF Science & Engineering Indicators, “Table 8-45: Business-performed R&D as a percentage of private-industry output, by state: 2000, 2004 and 2008.”
Research And Development (R&D) As A Percent Of Gross Domestic Product (GDP)Data for Massachusetts’ R&D as a percent of GDP are from the NSF, “Table: U.S. research and development expenditures, by state, performing sector, and source of funding” and the Bureau of Economic Analysis (bea.gov).
Data for the LTS are from the NSF National Patterns of R&D Resources, “Table - Research and development expenditures, by state, performing sector, and source of funds”. Data used are the totals for all R&D, Federal, FFRDCs, Business, U&C and Other Nonprofit. www.nsf.gov/statistics.
Indicator 7: Academic Article Output
LTS data are from the NSF “Table 8-49 - Academic science and engineering article output per $1 million of academic S&E R&D, by state: 1998–2009” and “Table 8-48- Academic S&E Articles per 1,000 S&E Doctorate Holders in Academia by state: 1997, 2003 and 2008. International data is from the NSF. “Table 5-27 - S&E articles in all fields, by region/country/economy: 1999 and 2009”. The NSF obtained its information on science and engineering articles from the Thomson Scientific ISI database. LTS population data are from the U.S. Census Bureau (www.census.gov/popest/data/index.html).
Indicator 8: Patenting
United States Patent And Trademark Office (USPTO) Patents GrantedThe count of patents granted by state are from the US Patent and Trademark Office (USPTO). Patents granted are a count of Utility Patents only. The number of patents per year are based on the date patents were granted (www.uspto.gov). Population estimates are from the U.S. Census Bureau, Population Estimates Branch (www.census.gov/popest/data/index.html).
Patents Published Under The Patent Cooperation TreatyInternational patents published under the Patent Cooperation Treaty (PCT) are from the World Intellectual Property Organization (WIPO) (http://patentscope.wipo.int/search/en/structuredSearch.jsf ). Intellectual property data published in this report are taken from the WIPO Statistics Database, which is primarily based on information provided to WIPO by national/regional IP offices and data compiled by WIPO during the application process of international filings through the PCT, the Madrid System and the Hague System. The number of patents per year are based on the date of publication. GDP data is from the World Bank (data.worldbank.org).
235008_MassTech_MTCIndex - Back 8 - 12/19/14 08:42:04 - Black235008_MassTech_MTCIndex - Back 8 - 12/19/14 08:42:04 - Cyan235008_MassTech_MTCIndex - Back 8 - 12/19/14 08:42:04 - Magenta235008_MassTech_MTCIndex - Back 8 - 12/19/14 08:42:04 - YellowK
ey 2K
ey 3K
ey 4K
ey 5K
ey 6K
ey 7K
ey 8K
ey 9K
ey 10K
ey 11K
ey 12K
ey 13K
ey 14K
ey 15K
ey 16K
ey 17K
ey 18K
ey 19K
ey 21K
ey 20K
ey 22
KC
MY
M1
M2
M1
M2
M1
M2
M1
M2
M1
M2
M1
M2
M1
M2
M1
M2
M1
M2
M1
M2
M1
M2
2525
M1
M2
25M
1M
225
2525
50M
1M
2M
1M
250
5050
5050
M1
M2
M1
M2
5075
7575
7575
75G
RA
YG
RA
YG
RA
YG
RA
YG
RA
YK
CM
YK
CM
YK
CM
YK
CM
YK
CM
YK
CM
YY
+M
Y+
CC
+M
KC
MY
KC
MY
KC
MY
KP
CM
YK
CM
YK
CM
YK
CM
YK
CM
YK
CM
YK
CM
YG
RA
YK
CM
YM
1M
2M
1M
2M
1M
2M
1M
275
7575
7575
75G
RA
YG
RA
YK
CM
YK
CM
YK
CM
Y
Key 1
KC
MY
M1
M2
50
Key 23 M
1M
2star
starK
CM
Y
Kom
ori/GA
TF
P
art No. K
-28-6(D)
1/2/3/4 K1
2
34
1/2/3/4 C1
2
34
1/2/3/4 M1
2
34
1/2/3/4 M1
1/2/3/4 Y1
2
34
12
34
1/2/3/4 M2
12
34
MASSACHUSETTS INNOVATION ECONOMY ANNUAL INDEX
59
APPENDIX
Indicator 9: Patenting By Field
The count of patents granted by state and patent class are from the U.S. Patent and Trademark Office (www.uspto.gov), Patenting By Geographic Region, Breakout by Technology Class. State population data come from the U.S. Census Bureau, Population Estimates Branch. (www.census.gov/popest/data/index.html).The number of patents per year are based on the date the patents were granted. Patents in “computer and communications” and “drugs and medical” are based on categories developed by in Hall, B. H., A. B. Jaffe, and M. Tratjenberg (2001). “The NBER Patent Citation Data File: Lessons, Insights and Methodological Tools.” NBER Working Paper 8498. Patents in “advanced materials” and “analytical instruments and research methods” are based on categories developed by MTC’s John Adams Innovation Institute. The “business methods” category has its own USPTO patent class.
Indicator 10: Technology Licensing
Data on licensing agreements are from the Association of University Technology Managers website (AUTM) (www.autm.net). Institutions participating in the survey are AUTM members.
Indicator 11: Small Business Innovation Research (SBIR) And Technology Transfer (STTR) Awards
This indicator includes SBIR award and Small Business Technology Transfer (STTR) award data. SBIR/STTR award data are from U.S. Small Business Administration (www.sbir.gov/sbirsearch/technology), state population data come from the U.S. Census Bureau, Population Estimates Branch (www.census.gov/popest/data/index.html) and GDP Data is from U.S. Bureau of Economic Analysis (www.bea.gov).
Indicator 12: Business Formation
Business Establishment OpeningsData are from the Business Employment Dynamics database of the Bureau of Labor Statistics’(BLS) Business Employment Dynamics(www. bls.gov/bdm).
Net Change In Business Establishments In The Key Industry SectorsThe net change in business establishments was calculated using BLS (www.census.gov/econ/cbp/ index.html) Quarterly Census ofEmployment and Wages. Definitions for each key industry sector are in Appendix B.
Start-up CompaniesData on spinout “start-up” companies are from the Association of University Technology Managers (AUTM). Institutions participating in the survey are all AUTM members (www.autm.net).
MassTech_MTCIndex Sig #30 - Low Folio - Front
MassTech_MTCIndex Sig #31 - Low Folio - Front
MassTech_MTCIndex Sig #32 - Low Folio - Front
MassTech_MTCIndex Sig #33 - Low Folio - Front235008_MassTech_MTCIndex - Front 9 - 12/19/14 08:42:07 - Black 235008_MassTech_MTCIndex - Front 9 - 12/19/14 08:42:07 - Cyan 235008_MassTech_MTCIndex - Front 9 - 12/19/14 08:42:07 - Magenta 235008_MassTech_MTCIndex - Front 9 - 12/19/14 08:42:07 - Yellow
Key
2K
ey 3
Key
4
Key
5K
ey 6
Key
7K
ey 8
Key
9K
ey 1
0K
ey 1
1K
ey
12
Key
13
Key
14
Key
15
Key
16
Key
17
Key
18
Key
19
Key
21
Key
2
0K
ey 2
2
KC
MY
M1
M2
M1
M2
M1
M2
M1
M2
M1
M2
M1
M2
M1
M2
M1
M2
M1
M2
M1
M2
M1
M2
2525
M1
M2
25M
1M
225
2525
50M
1M
2M
1M
250
5050
5050
M1
M2
M1
M2
5075
7575
7575
75G
RA
YG
RA
YG
RA
YG
RA
YG
RA
YK
CM
YK
CM
YK
CM
YK
CM
YK
CM
YK
CM
YY
+M
Y+
CC
+M
KC
MY
KC
MY
KC
MY
KP
CM
YK
CM
YK
CM
YK
CM
YK
CM
YK
CM
YK
CM
YG
RA
YK
CM
YM
1M
2M
1M
2M
1M
2M
1M
275
7575
7575
75G
RA
YG
RA
YK
CM
YK
CM
YK
CM
Y
Key
1
KC
MY
M1
M2
50
Key
23M
1M
2st
arst
arK
CM
Y
Kom
ori/G
AT
F
Par
t No.
K-2
8-6(
D)
1/2/
3/4
K1
2
34
1/2/
3/4
C1
2
34
1/2/
3/4
M1
2
34
1/2/
3/4
M1
1/2/
3/4
Y1
2
34
12
34
1/2/
3/4
M2
12
34
MASSACHUSETTS INNOVATION ECONOMY ANNUAL INDEX
60
APPENDIX
Indicator 13: Initial Public Offerings And Mergers And Acquisitions
Initial Public Offerings (IPOs)The number and distribution by industry sector of filed initial public offerings (IPOs) by state and for the U.S. are from Renaissance Capital’s, IPOs Near You (www.renaissancecapital.com/IPOHome/Press/MediaRoom.aspx#) Data on venture-backed IPOs for 2012 are from the National Venture Capital Association (NVCA) (www.nvca.org).
Mergers & Acquisitions (M&As)Data on total number of M&As are from Factset Mergerstat, deals include acquired company by location.
Indicator 14: Federal Funding For Academic, Nonprofit And Health R&D
Federal Expenditures For Academic And Nonprofit Research And Development (R&D)Data are from the NSF, “Federal obligations for research and development for selected agencies, by state and other locations and performer” (www.nsf.gov/statistics). Data used are the entries for federal funding for universities and nonprofits, excluding university and nonprofit federally funded research and development centers (FFRDCs).
National Institutes Of Health (NIH) Funding Per Capita, Per GDP And Average Annual Growth RateData on federal health R&D are from the NIH (http://report.nih.gov/award/). The NIH annually computes data on funding provided by NIH grants, cooperative agreements and contracts to universities, hospitals and other institutions. The figures do not reflect institutional reorganizations, changes of institutions, or changes to award levels made after the data are compiled. Population data is from U.S. Census Bureau (http://www.census.gov/popest/data/index.html). GDP data is from Bureau of Economic Analysis (bea.gov), U.S. Department of Commerce.
Indicator 15: Industry Funding Of Academic Research
Data are from the NSF Survey of Research and Development Expenditures at Universities and Colleges and Survey of Research and Development Expenditures at Universities and Colleges, Business Financed Higher Education R&D Expenditures for S&E (http://www.nsf.gov/statistics/srvyrdexpenditures/). Since FY 1998, respondents have included all eligible institutions. Population data is from U.S. Census Bureau (http://www.census.gov/popest/data/index.html).
Indicator 16: Venture Capital (VC)
Data for total VC investments, VC investments by industry activity, and distribution by stage of financing are provided by PricewaterhouseCoopers (PwC) in the MoneyTree Report (https://www.pwcmoneytree.com/MTPublic/ns/nav. jsp?page=historical). Industry category designations are determined by PwC. Definitions for the industry classifications and stages of development used in theMoneyTree Survey can be found at the PwC website (http://www.pwcmoneytree.com/moneytree/nav. jsp?page=definitions). GDP data are from Bureau of Economic Analysis (bea.gov), U.S. Department of Commerce.PWC Stage Definitions: https://www.pwcmoneytree.com/MTPublic/ns/nav.jsp?page=definitions#stage
Indicator 17: Education Level Of The Workforce
For this indicator, the workforce is defined as the population ages 25-65. Data on educational attainment of this population are from the US Census Bureau (http://www.census.gov/cps/data/cpstablecreator.html), Current Population Survey, Annual Social and Economic Supplement, 2012. Figures are three-year rolling averages. Data on employment rate by educational attainment are based on thefull-time employment rate of the workforce.
Indicator 18: Education
High School Attainment By The Population Ages 19-24Data on high school attainment are from the US Census Bureau, Current Population Survey (http://www.census.gov/cps/data/cpstablecreator.html), Annual Social and Economic Supplement, 2008 through 2012. Figures are three year rolling averages.
College Degrees ConferredData for the U.S. states comes from the National Center for Education Statistics using the sum of all degrees conferred at the bachelor’s level or higher.
TIMSS 8th Grade Science data are from Trends in International Mathematics and Science Study 2011 International Results in Science, TIMSS and PIRLS International Study Center, Lynch School of Education, Boston College, 2012.
235008_MassTech_MTCIndex - Back 9 - 12/19/14 08:42:11 - Black235008_MassTech_MTCIndex - Back 9 - 12/19/14 08:42:11 - Cyan235008_MassTech_MTCIndex - Back 9 - 12/19/14 08:42:11 - Magenta235008_MassTech_MTCIndex - Back 9 - 12/19/14 08:42:11 - Yellow
Key 2
Key 3
Key 4
Key 5
Key 6
Key 7
Key 8
Key 9
Key 10
Key 11
Key 12
Key 13
Key 14
Key 15
Key 16
Key 17
Key 18
Key 19
Key 21
Key 20
Key 22
KC
MY
M1
M2
M1
M2
M1
M2
M1
M2
M1
M2
M1
M2
M1
M2
M1
M2
M1
M2
M1
M2
M1
M2
2525
M1
M2
25M
1M
225
2525
50M
1M
2M
1M
250
5050
5050
M1
M2
M1
M2
5075
7575
7575
75G
RA
YG
RA
YG
RA
YG
RA
YG
RA
YK
CM
YK
CM
YK
CM
YK
CM
YK
CM
YK
CM
YY
+M
Y+
CC
+M
KC
MY
KC
MY
KC
MY
KP
CM
YK
CM
YK
CM
YK
CM
YK
CM
YK
CM
YK
CM
YG
RA
YK
CM
YM
1M
2M
1M
2M
1M
2M
1M
275
7575
7575
75G
RA
YG
RA
YK
CM
YK
CM
YK
CM
Y
Key 1
KC
MY
M1
M2
50
Key 23 M
1M
2star
starK
CM
Y
Kom
ori/GA
TF
P
art No. K
-28-6(D)
1/2/3/4 K1
2
34
1/2/3/4 C1
2
34
1/2/3/4 M1
2
34
1/2/3/4 M1
1/2/3/4 Y1
2
34
12
34
1/2/3/4 M2
12
34
MASSACHUSETTS INNOVATION ECONOMY ANNUAL INDEX
61
APPENDIX
Indicator 19: Public Investment In K-16 Education
This indicator looks only at public investments in education, but it should be noted that Massachusetts is unusual in the size of the private education sector. Forty-three percent (198,000 of 463,000) of higher education students attend public institutions in Massachusetts compared to 72% nationally with the remainder attending non-public institutions. These figures are from the National Center for Education Statistics (NCES), Integrated Postsecondary Education Data System (IPEDS) Enrollment Survey using the NCES population of institutions available at webcaspar.nsf.gov. While private higher education is an export industry in Massachusetts, 48% of Massachusetts high school graduates indicate that they will attend public higher education institutions compared to 32% indicating they will attend private institutions, with the remainder not attending college. This difference is even more dramatic for Hispanics (50% and 18% respectively), a growing component of the Massachusetts population. These figures are from the Massachusetts Department of Education, Plans of High School Graduates, Class of 2008 (http://www.doe.mass.edu/infoservices/ reports/hsg/data.html?yr=08).
Per Pupil Spending In K-12Public elementary & secondary school finance data are from the U.S. Census Bureau, Table 19, “Per Pupil (PPCS) Amounts and One-Year Percentage Changes for Current Spending of Public Elementary-Secondary School Systems by State: 2006-2012”. Figures are presented in 2012 dollars. Data excludes payments to other school systems and non K-12 programs.
State Higher Education Appropriations Per FTEData on public higher education appropriations per full-time equivalent (FTE) student is provided by the State Higher Education Executive Office (http://www.sheeo.org/finance/shef-home.htm). The data consider only educational appropriations—state and local funds available for public higher education operating expenses, excluding spending for research, agriculture, and medical education and support to independent institutions and students. The State Higher Education Finance Report employs three adjustments for purposes of analysis: Cost of Living Adjustment (COLA) to account for differences among the states, Enrollment Mix Index (EMI) to adjust for the different mix of enrollments and cost among types of institutions across the states and the Higher Education Cost Adjustment (HECA) to adjust for inflation over time. More detailed information about each of these adjustments can be found on the SHEEO website.e.
Indicator 20: Science, Technology, Engineering, And Math (STEM) Career Choices And Degrees
STEM DegreesData about degrees conferred by field of study are from NCES, IPEDS Completions Survey using the NSF population of institutions. Data were accessed through the NSF WebCASPAR (http://caspar.nsf.gov). Fields are defined by 2-digit Classification of InstructionalProgram (CIP), listed below.
• Science: 26-Biological & Biomedical Sciences and 40-Physical Sciences • Technology: 11-Computer & Information Science & Support Services • Engineering: 14-Engineering • Math: 27-Mathematics & Statistics
Science & Engineering Talent By CategoriesData for Science & Engineering (S&E) Talent provided by the United States Census Bureau, Decennial Census and American Community Survey Public Use Microdata Samples (PUMS). A list of S&E occupations were divided into six categories: Computer, Physical Engineers, Design, Biological, Mathematics and Aerospace Engineers & Scientists. Design includes Designers and Artists & Related Workers. Both were added to the S&E occupations to try to capture the employment in Graphic Designers and Multi-Media Artists & Animators. According to BLS Occupation Employment Statistics (May 2009), both occupations represent almost 60 percent of employment in both Designers and Artists & Related Workers.
Science & Engineering DoctoratesData for S&E doctorates comes from the Science and Engineering Doctorates report, table 9, published by the NSF.
Life Science Major GraduatesData for life science major graduates was obtained from the National Center for Education Statistics College Navigator.
MassTech_MTCIndex Sig #30 - Low Folio - Front
MassTech_MTCIndex Sig #31 - Low Folio - Front
MassTech_MTCIndex Sig #32 - Low Folio - Front
MassTech_MTCIndex Sig #33 - Low Folio - Front
235008_MassTech_MTCIndex - Front 9 - 12/19/14 08:42:07 - Black 235008_MassTech_MTCIndex - Front 9 - 12/19/14 08:42:07 - Cyan 235008_MassTech_MTCIndex - Front 9 - 12/19/14 08:42:07 - Magenta 235008_MassTech_MTCIndex - Front 9 - 12/19/14 08:42:07 - Yellow
Key
2K
ey 3
Key
4
Key
5K
ey 6
Key
7K
ey 8
Key
9K
ey 1
0K
ey 1
1K
ey
12
Key
13
Key
14
Key
15
Key
16
Key
17
Key
18
Key
19
Key
21
Key
2
0K
ey 2
2
KC
MY
M1
M2
M1
M2
M1
M2
M1
M2
M1
M2
M1
M2
M1
M2
M1
M2
M1
M2
M1
M2
M1
M2
2525
M1
M2
25M
1M
225
2525
50M
1M
2M
1M
250
5050
5050
M1
M2
M1
M2
5075
7575
7575
75G
RA
YG
RA
YG
RA
YG
RA
YG
RA
YK
CM
YK
CM
YK
CM
YK
CM
YK
CM
YK
CM
YY
+M
Y+
CC
+M
KC
MY
KC
MY
KC
MY
KP
CM
YK
CM
YK
CM
YK
CM
YK
CM
YK
CM
YK
CM
YG
RA
YK
CM
YM
1M
2M
1M
2M
1M
2M
1M
275
7575
7575
75G
RA
YG
RA
YK
CM
YK
CM
YK
CM
Y
Key
1
KC
MY
M1
M2
50
Key
23M
1M
2st
arst
arK
CM
Y
Kom
ori/G
AT
F
Par
t No.
K-2
8-6(
D)
1/2/
3/4
K1
2
34
1/2/
3/4
C1
2
34
1/2/
3/4
M1
2
34
1/2/
3/4
M1
1/2/
3/4
Y1
2
34
12
34
1/2/
3/4
M2
12
34
MASSACHUSETTS INNOVATION ECONOMY ANNUAL INDEX
62
APPENDIX
Indicator 21: Talent Flow And Attraction
Relocations To LTS By College Educated AdultsData on population mobility come from the US Census Bureau, American Community Survey; Table B07009-Geographic Mobility in the Past Year by Educational Attainment, 1-year estimate. This is the number of people moving in and includes no information about the number moving out. It can be used as a measure of the ability to attract talent.
Net MigrationNet Migration figures are derived from the US Census Bureau’s population estimates program using annual data.
Indicator 22: Housing Affordability
Housing Price IndexHousing price data are from the Federal Housing Finance Agency’s Housing Price Index (HPI) (http://www.fhfa.gov/). Figures are four-quarter percent changes in the seasonally adjusted index. The HPI is a broad measure of the movement of single-family house prices. The HPI is a weighted, repeat-sales index that is based on repeat mortgage transactions on single-family properties whose mortgages have been purchased or securitized by Fannie Mae or Freddie Mac since January 1975.
Housing AffordabilityHousing affordability figures are from the U.S. Census Bureau, American Community Survey, R2513: “Percent of Mortgaged Owners Spending 30 Percent or More of Household Income on Selected Monthly Owner Costs” and R2515: “Percent of Renter-Occupied Units Spending 30 Percent or More of Household Income on Rent and Utilities”.
Median Household IncomeMedian household income data are from U.S. Census Bureau, American Community Survey, B19013: “Median Household Income in the Past 12 Months”, 3-year estimate.
Indicator 23: Infrastructure
Broadband SpeedData is taken from StateTech Magazine via Akamai Technologies: http://www.statetechmagazine.com/article/2013/02/average-internet-connection-speed-every-state-america.
Industrial Natural Gas Prices Data is taken from the United States Energy Information Administration.
Median Commute Time Data is taken from the U.S. Census Bureau American Community Survey County Level Statistics. Metro area median commutes were determined using the median commute time of each component county and its proportion of total metro area commuters.
235008_MassTech_MTCIndex - Back 9 - 12/19/14 08:42:11 - Black235008_MassTech_MTCIndex - Back 9 - 12/19/14 08:42:11 - Cyan235008_MassTech_MTCIndex - Back 9 - 12/19/14 08:42:11 - Magenta235008_MassTech_MTCIndex - Back 9 - 12/19/14 08:42:11 - Yellow
Key 2
Key 3
Key 4
Key 5
Key 6
Key 7
Key 8
Key 9
Key 10
Key 11
Key 12
Key 13
Key 14
Key 15
Key 16
Key 17
Key 18
Key 19
Key 21
Key 20
Key 22
KC
MY
M1
M2
M1
M2
M1
M2
M1
M2
M1
M2
M1
M2
M1
M2
M1
M2
M1
M2
M1
M2
M1
M2
2525
M1
M2
25M
1M
225
2525
50M
1M
2M
1M
250
5050
5050
M1
M2
M1
M2
5075
7575
7575
75G
RA
YG
RA
YG
RA
YG
RA
YG
RA
YK
CM
YK
CM
YK
CM
YK
CM
YK
CM
YK
CM
YY
+M
Y+
CC
+M
KC
MY
KC
MY
KC
MY
KP
CM
YK
CM
YK
CM
YK
CM
YK
CM
YK
CM
YK
CM
YG
RA
YK
CM
YM
1M
2M
1M
2M
1M
2M
1M
275
7575
7575
75G
RA
YG
RA
YK
CM
YK
CM
YK
CM
Y
Key 1
KC
MY
M1
M2
50
Key 23 M
1M
2star
starK
CM
Y
Kom
ori/GA
TF
P
art No. K
-28-6(D)
1/2/3/4 K1
2
34
1/2/3/4 C1
2
34
1/2/3/4 M1
2
34
1/2/3/4 M1
1/2/3/4 Y1
2
34
12
34
1/2/3/4 M2
12
34
MASSACHUSETTS INNOVATION ECONOMY ANNUAL INDEX
63
APPENDIX
The Index makes use of 4, 5 and 6 digit North American Industry Classification System (NAICS) codes to define key industry sectors of the Massachusetts Innovation Economy. The Index’s key industry sector definitions capture traded-sectors that are known to be individually significant in the Massachusetts economy. Consistent with the innovation ecosystem framework, these sector definitions are broader than ‘high-tech’. Strictly speaking, clusters are overlapping networks of firms and institutions which would include portions of many sectors, such as Postsecondary Education and Business Services. For data analysis purposes the Index has developed NAICS-based sector definitions that are mutually exclusive.
Modification To Sector DefinitionsThe eleven key industry sectors as defined by the Index reflect the changes in employment concentration in the Massachusetts Innovation Economy over time. For the purposes of accuracy, several sector definitions were modified for the 2007 edition. The former “Healthcare Technology” sector was reorganized into two new sectors: “Bio-pharmaceuticals, Medical Devices and Hard-ware” and “Healthcare Delivery.” The former “Textiles& Apparel” sector was removed and replaced with the “Advanced Materials” sector. While “Advanced Materials” does not conform to established criteria,it is included in an attemptto quantify and assess innovative and high-growing business activities from the former “Textiles & Apparel” sector.
With the exception of Advanced Materials, sectors are assembled from those interrelated NAICS code industries that have shownto be individually significant according to the above measures. In the instance of the Business Services sector, it is included because it represents activity that supplies critical support to other key sectors. In the 2009 Index, the definition of Business Services was expanded to include 5511-Management of Companies and Enterprises. According to analysis by the Bureau of Labor Statistics, this category has at least twice the all-industry average intensity of technology-oriented workers. All time-series comparisons use the current sector definition for all years, and, as such, may differ from figures printed in prior editions of the Index. The slight name change in 2009 of the Bio-pharma and Medical Devices sector does not reflect any changes in the components that define the sector.
Advanced Materials3133 Textile and Fabric Finishing and Fabric Coating Mills3222 Converted Paper Product Manufacturing3251 Basic Chemical Manufacturing3252 Resin, Synthetic Rubber and Artificial and Synthetic Fibers and Filaments Manufacturing3255 Paint, Coating and Adhesive Manufacturing3259 Other Chemical Product and Preparation Manufacturing3261 Plastics Product Manufacturing3262 Rubber Product Manufacturing3312 Steel Product Manufacturing from Purchased steel3313 Alumina and Aluminum Production and Processing3314 Nonferrous Metal (except Aluminum) Production and Processing
Bio/Pharmaceuticals, Medical Devices & Hardware3254 Pharmaceutical and Medicine Manufacturing3391 Medical Equipment and Supplies Manufacturing6215 Medical and Diagnostic Laboratories42345 Medical Equipment and Merchant Wholesalers42346 Ophthalmic Goods Merchant Wholesale54171 Physical, Engineering and Biological Research
With 2007 NAICS, apportioned based on 541711 R&D in Biotechnology
334510 Electro Medical Apparatus Manufacturing334517 Irradiation Apparatus Manufacturing
Business Services5411 Legal Services5413 Architectural, Engineering and Related Services5418 Advertising and Related Services5511 Management of Companies5614 Business Support Services
Computer & Communications Hardware3341 Computer and Peripheral Equipment Manufacturing3342 Communications Equipment Manufacturing3343 Audio and Video Equipment Manufacturing3344 Semiconductor and Other Electronic Component Manufacturing3346 Manufacturing and Reproducing Magnetic and Optical Media3359 Other Electrical Equipment and Component Manufacturing
Defense Manufacturing & Instrumentation3329 Other Fabricated Metal Product Manufacturing3336 Engine, Turbine and Power Transmission Equipment Manufacturing334511 Search, Detection, Navigation, Guidance, Aeronautical and Nautical System and Instrument Manufacturing334512 Automatic Environmental Control Manufacturing for Residential, Commercial and Appliance Use334513 Instruments and Related Products Manufacturing for Measuring, Displaying and Controlling Industrial Process Variables334514 Totalizing Fluid Meter and Counting Device Manufacturing334515 Instrument Manufacturing for Measuring and Testing Electricity and Electrical Signals334516 Analytical Laboratory Instrument Manufacturing334518 Watch, Clock and Part Manufacturing334519 Other Measuring and Controlling Device Manufacturing3364 Aerospace Product and Parts Manufacturing
MassTech_MTCIndex Sig #30 - Low Folio - Front
MassTech_MTCIndex Sig #31 - Low Folio - Front
MassTech_MTCIndex Sig #32 - Low Folio - Front
MassTech_MTCIndex Sig #33 - Low Folio - Front235008_MassTech_MTCIndex - Front 9 - 12/19/14 08:42:07 - Black 235008_MassTech_MTCIndex - Front 9 - 12/19/14 08:42:07 - Cyan 235008_MassTech_MTCIndex - Front 9 - 12/19/14 08:42:07 - Magenta 235008_MassTech_MTCIndex - Front 9 - 12/19/14 08:42:07 - Yellow
Key
2K
ey 3
Key
4
Key
5K
ey 6
Key
7K
ey 8
Key
9K
ey 1
0K
ey 1
1K
ey
12
Key
13
Key
14
Key
15
Key
16
Key
17
Key
18
Key
19
Key
21
Key
2
0K
ey 2
2
KC
MY
M1
M2
M1
M2
M1
M2
M1
M2
M1
M2
M1
M2
M1
M2
M1
M2
M1
M2
M1
M2
M1
M2
2525
M1
M2
25M
1M
225
2525
50M
1M
2M
1M
250
5050
5050
M1
M2
M1
M2
5075
7575
7575
75G
RA
YG
RA
YG
RA
YG
RA
YG
RA
YK
CM
YK
CM
YK
CM
YK
CM
YK
CM
YK
CM
YY
+M
Y+
CC
+M
KC
MY
KC
MY
KC
MY
KP
CM
YK
CM
YK
CM
YK
CM
YK
CM
YK
CM
YK
CM
YG
RA
YK
CM
YM
1M
2M
1M
2M
1M
2M
1M
275
7575
7575
75G
RA
YG
RA
YK
CM
YK
CM
YK
CM
Y
Key
1
KC
MY
M1
M2
50
Key
23M
1M
2st
arst
arK
CM
Y
Kom
ori/G
AT
F
Par
t No.
K-2
8-6(
D)
1/2/
3/4
K1
2
34
1/2/
3/4
C1
2
34
1/2/
3/4
M1
2
34
1/2/
3/4
M1
1/2/
3/4
Y1
2
34
12
34
1/2/
3/4
M2
12
34
MASSACHUSETTS INNOVATION ECONOMY ANNUAL INDEX
64
APPENDIX
Diversified Industrial Manufacturing3279 Other Nonmetallic Mineral Product Manufacturing3321 Forging and Stamping3322 Cutlery and Handtool Manufacturing3326 Spring and Wire Product Manufacturing3328 Coating, Engraving, Heat Treating and Allied Activities3332 Industrial Machinery Manufacturing3333 Commercial and Service Industry Machinery Manufacturing
Manufacturing3335 Metalworking Machinery Manufacturing3339 Other General Purpose Machinery Manufacturing3351 Electric Lighting Equipment Manufacturing3353 Electrical Equipment Manufacturing3399 Other Miscellaneous Manufacturing
Financial Services5211 Monetary Authorities - Central Bank5221 Depository Credit Intermediation5231 Securities and Commodity Contracts Intermediation and Brokerage5239 Other Financial Investment Activities5241 Insurance Carriers5242 Agencies, Brokerages and Other Insurance Related Activities5251 Insurance and Employee Benefit Funds5259 Other Investment Pools and Funds
Healthcare Delivery6211 Offices of Physicians6212 Offices of Dentists6213 Offices of Other Health Practitioners6214 Outpatient Care Centers6216 Home Health Care Services6219 Other Ambulatory Health Care Services622 Hospitals
Postsecondary Education6112 Junior Colleges6113 Colleges, Universities and Professional Schools6114 Business Schools and Computer and Management Training6115 Technical and Trade Schools6116 Other Schools and Instruction6117 Educational Support Services
Scientific, Technical & Management Services5416 Management, Scientific and Technical Consulting Services5417 Scientific Research and Development Services * *Minus the portion apportioned to the Bio sector5419 Other Professional, Scientific and Technical Services
Software & Communications Services5111 Newspaper, Periodical, Book and Directory Publishers5112 Software Publishers5171 Wired Telecommunications Carriers5172 Wireless Telecommunications Carriers (except Satellite)5174 Satellite Telecommunications5179 Other Telecommunications5182 Data Processing, Hosting and Related Services5415 Computer Systems Design and Related Services8112 Electronic and Precision Equipment Repair and Maintenance
With 2007 NAICS add 51913 Internet publishing and broadcasting and web search portal
235008_MassTech_MTCIndex - Back 9 - 12/19/14 08:42:11 - Black235008_MassTech_MTCIndex - Back 9 - 12/19/14 08:42:11 - Cyan235008_MassTech_MTCIndex - Back 9 - 12/19/14 08:42:11 - Magenta235008_MassTech_MTCIndex - Back 9 - 12/19/14 08:42:11 - Yellow
Key 2
Key 3
Key 4
Key 5
Key 6
Key 7
Key 8
Key 9
Key 10
Key 11
Key 12
Key 13
Key 14
Key 15
Key 16
Key 17
Key 18
Key 19
Key 21
Key 20
Key 22
KC
MY
M1
M2
M1
M2
M1
M2
M1
M2
M1
M2
M1
M2
M1
M2
M1
M2
M1
M2
M1
M2
M1
M2
2525
M1
M2
25M
1M
225
2525
50M
1M
2M
1M
250
5050
5050
M1
M2
M1
M2
5075
7575
7575
75G
RA
YG
RA
YG
RA
YG
RA
YG
RA
YK
CM
YK
CM
YK
CM
YK
CM
YK
CM
YK
CM
YY
+M
Y+
CC
+M
KC
MY
KC
MY
KC
MY
KP
CM
YK
CM
YK
CM
YK
CM
YK
CM
YK
CM
YK
CM
YG
RA
YK
CM
YM
1M
2M
1M
2M
1M
2M
1M
275
7575
7575
75G
RA
YG
RA
YK
CM
YK
CM
YK
CM
Y
Key 1
KC
MY
M1
M2
50
Key 23 M
1M
2star
starK
CM
Y
Kom
ori/GA
TF
P
art No. K
-28-6(D)
1/2/3/4 K1
2
34
1/2/3/4 C1
2
34
1/2/3/4 M1
2
34
1/2/3/4 M1
1/2/3/4 Y1
2
34
12
34
1/2/3/4 M2
12
34

MASSACHUSETTS INNOVATION ECONOMY ANNUAL INDEX
65
APPENDIX
MASSACHUSETTS TECHNOLOGY COLLABORATIVE BOARD OF DIRECTORS
Executive CommitteeThe Honorable Gregory P. Bialecki, Board Chairperson, Massachusetts Technology Collaborative; Secretary, Executive Office of Housing and Economic Development, Commonwealth of MassachusettsDonald R. Dubendorf, Esq., Board Vice-Chairperson, Massachusetts Technology Collaborative; Attorney, Dubendorf LawEmily Nagle Green, President and Chief Executive Officer, Smart LunchesAlain Hanover, Lecturer, Bentley University; Co-founder, CommonAngels; and Active Mentor, MIT Venture Mentoring ServiceDana Mohler-Faria, PhD, President, Bridgewater State UniversityMitchell G. Tyson, Principal, Tyson AssociatesGerald L. Wilson, PhD, Professor Emeritus, Massachusetts Institute of Technology
Board MembersMartin Aikens, M.E.A. ConsultantMohamad Ali, Chief Executive Officer, Aspect Workforce at Aspect SoftwareRobert L. Caret, PhD, President, University of MassachusettsJulie Chen, PhD, Vice Provost for Research, Francis College of Engineering, University of Massachusetts LowellLeland Cheung, City Councilor, City of CambridgePhillip L. Clay, PhD, Professor of Urban Studies and Planning, Massachusetts Institute of Technology Joseph Dorant, President, Massachusetts Organization of State Engineers and Scientists (MOSES) Stephen W. Director, PhD, Provost, Northeastern UniversityRichard M. Freeland, PhD, Commissioner, Massachusetts Department of Higher EducationThe Honorable Glen Shor, Secretary, Executive Office for Administration and Finance, Commonwealth of MassachusettsRobert E. Johnson, President, Becker CollegePamela D.A. Reeve, Chair, The Commonwealth Institute; Former Chief Executive Officer, Lightbridge, Inc.Lawrence J. Reilly, Former President and Chief Executive Officer, Central Vermont Public Service CorporationAndre Ruckenstein, Founding President, Massachusetts Green High Performance Computing Center; Professor of Physics and Former VicePresident for Research, Boston UniversityBenjamin I. Schwartz, Novelist; Principal, Emphasis Consulting GroupFrederick Sperounis, PhD, Executive Vice Chancellor, University of Massachusetts LowellKarl Weiss, PhD, Professor Emeritus, Northeastern University
INNOVATION INSTITUTE GOVERNING BOARD
ChairpersonDonald R. Dubendorf, Esq, Attorney-at-Law,Dubendorf Law; Board Vice-Chairperson, Massachusetts Technology Collaborative; Chairperson, John Adams Innovation Institute Governing Board
Ex Officio MembersThe Honorable Gregory P. Bialecki, Secretary, Executive Office of Housing and Economic Development, Commonwealth ofMassachusetts; Board Chairperson, Massachusetts Technology CollaborativePamela W. Goldberg, Chief Executive Officer, Massachusetts Technology CollaborativeMarty Jones, President and Chief Executive Officer, MassDevelopment
Governing Board MembersJulie Chen, PhD, Vice Provost for Research, University of Massachusetts - LowellC. Jeffrey Cook, Partner, Cohen Kinne Valicenti & Cook LLPThomas G. Davis, Executive Director, The Greater New Bedford Industrial FoundationPriscilla H. Douglas, PhD, Principal, P.H. Douglas & AssociatesPatricia M. Flynn, PhD, Trustee Professor of Economics & Management, Bentley UniversityAmy K. Glasmeier, PhD, Head, Department of Urban Studies & Planning, Massachusetts Institute of TechnologyMary K. Grant, PhD, President, Massachusetts College of Liberal ArtsMichael A. Greeley, General Partner, Flybridge Capital PartnersEmily Nagle Green, President and Chief Executive Officer, Smart LunchesC. Jeffrey Grogan, Former Partner, Monitor Group, LPRichard K. Lester, PhD, Department Head of Nuclear Science & Engineering & Co-Chair of Industrial Performance Center, MassachusettsInstitute of TechnologyTeresa M. Lynch, Principal at Mass Economics Daniel O’Connell, President, Massachusetts Competitive PartnershipJoan Y. Reede, MD, MPH, MS, Dean for Diversity & Community Partnership, Harvard Medical School Lawrence J. Reilly, Former President and Chief Executive Officer, Central Vermont Public Service Corporation Timothy Rowe, Founder & Chief Executive Officer, Cambridge Innovation CenterPieter J. Schiller, Partner Emeritus, Advanced Technology VenturesStephen C. Smith, Executive Director, Southeastern Regional Planning & Economic Development DistrictMitchell G. Tyson, Principal, Tyson AssociatesKarl Weiss, PhD, Professor Emeritus, Northeastern UniversityJack M. Wilson, PhD, President Emeritus & University Distinguished Professor of Higher Education, Emerging Technologies, and Innovation, University of MassachusettsPhyllis R. Yale, Partner, Bain & CompanyPatrick Larkin, Director, Innovation Institute at Massachusetts Technology Collaborative; Deputy Director, Massachusetts Technology Collaborative
MassTech_MTCIndex Sig #30 - Low Folio - Front
MassTech_MTCIndex Sig #31 - Low Folio - Front
MassTech_MTCIndex Sig #32 - Low Folio - Front
MassTech_MTCIndex Sig #33 - Low Folio - Front
235008_MassTech_MTCIndex - Front 9 - 12/19/14 08:42:07 - Black 235008_MassTech_MTCIndex - Front 9 - 12/19/14 08:42:07 - Cyan 235008_MassTech_MTCIndex - Front 9 - 12/19/14 08:42:07 - Magenta 235008_MassTech_MTCIndex - Front 9 - 12/19/14 08:42:07 - Yellow
Key
2K
ey 3
Key
4
Key
5K
ey 6
Key
7K
ey 8
Key
9K
ey 1
0K
ey 1
1K
ey
12
Key
13
Key
14
Key
15
Key
16
Key
17
Key
18
Key
19
Key
21
Key
2
0K
ey 2
2
KC
MY
M1
M2
M1
M2
M1
M2
M1
M2
M1
M2
M1
M2
M1
M2
M1
M2
M1
M2
M1
M2
M1
M2
2525
M1
M2
25M
1M
225
2525
50M
1M
2M
1M
250
5050
5050
M1
M2
M1
M2
5075
7575
7575
75G
RA
YG
RA
YG
RA
YG
RA
YG
RA
YK
CM
YK
CM
YK
CM
YK
CM
YK
CM
YK
CM
YY
+M
Y+
CC
+M
KC
MY
KC
MY
KC
MY
KP
CM
YK
CM
YK
CM
YK
CM
YK
CM
YK
CM
YK
CM
YG
RA
YK
CM
YM
1M
2M
1M
2M
1M
2M
1M
275
7575
7575
75G
RA
YG
RA
YK
CM
YK
CM
YK
CM
Y
Key
1
KC
MY
M1
M2
50
Key
23M
1M
2st
arst
arK
CM
Y
Kom
ori/G
AT
F
Par
t No.
K-2
8-6(
D)
1/2/
3/4
K1
2
34
1/2/
3/4
C1
2
34
1/2/
3/4
M1
2
34
1/2/
3/4
M1
1/2/
3/4
Y1
2
34
12
34
1/2/
3/4
M2
12
34
MASSACHUSETTS INNOVATION ECONOMY ANNUAL INDEX
66
APPENDIX
INNOVATION INDEX ADVISORY COMMITTEE
ChairpersonPatricia M. Flynn, PhD, Trustee Professor of Economics & Management, Bentley University
William B. Asher, Jr., Partner, Choate, Hall & Stewart, LLPJohn Barrett, Managing Director, Cook AssociatesDavid D. Fleming, ConsultantPamela W. Goldberg, Chief Executive Officer, Massachusetts Technology CollaborativeMichael Goodman, PhD, Associate Professor & Chair of the Department of Public Policy, University of Massachusetts at DartmouthC. Jeffrey Grogan, Partner, The Monitor Group, LPJean Hammond, Angel InvestorAlain J. Hanover, Lecturer, Bentley University; Co-founder, CommonAngels; and Active Mentor, MIT Venture Mentoring ServiceJohn Harthorne, Founder & Chief Executive Officer, MassChallenge, Inc.Yolanda K. Kodrzycki, PhD, Vice President & Director, New England Public Policy Center, Federal Reserve Bank of Boston Patrick Larkin, Director, Innovation Institute at Massachusetts Technology Collaborative; Deputy Director, Massachusetts Technology CollaborativeEric Nakajima, Assistant Secretary for Innovation Policy, Executive Office of Housing & Economic DevelopmentThomas O’Donnell, Visiting Faculty at UMass Lowell’s Manning School of Business
INDEX STAFF
Content CreationProject Director: James F. Byrnes,Jr., Operations Manager, Innovation Institute, Massachusetts Technology CollaborativeWilliam R. A. Fuqua, Program Research Analyst, Innovation Institute, Massachusetts Technology Collaborative Tianyue Liu, Research & Analysis Intern, Innovation Institute, Massachusetts Technology CollaborativeSam Fell, Collaborative Economic Development Initiatives Intern, Innovation Institute, Massachusetts Technology Collaborative
Report DesignKathryn A. Murphy, Digital Media Specialist, Massachusetts Technology Collaborative
235008_MassTech_MTCIndex - Back 9 - 12/19/14 08:42:11 - Black235008_MassTech_MTCIndex - Back 9 - 12/19/14 08:42:11 - Cyan235008_MassTech_MTCIndex - Back 9 - 12/19/14 08:42:11 - Magenta235008_MassTech_MTCIndex - Back 9 - 12/19/14 08:42:11 - YellowK
ey 2K
ey 3K
ey 4K
ey 5K
ey 6K
ey 7K
ey 8K
ey 9K
ey 10K
ey 11K
ey 12K
ey 13K
ey 14K
ey 15K
ey 16K
ey 17K
ey 18K
ey 19K
ey 21K
ey 20K
ey 22
KC
MY
M1
M2
M1
M2
M1
M2
M1
M2
M1
M2
M1
M2
M1
M2
M1
M2
M1
M2
M1
M2
M1
M2
2525
M1
M2
25M
1M
225
2525
50M
1M
2M
1M
250
5050
5050
M1
M2
M1
M2
5075
7575
7575
75G
RA
YG
RA
YG
RA
YG
RA
YG
RA
YK
CM
YK
CM
YK
CM
YK
CM
YK
CM
YK
CM
YY
+M
Y+
CC
+M
KC
MY
KC
MY
KC
MY
KP
CM
YK
CM
YK
CM
YK
CM
YK
CM
YK
CM
YK
CM
YG
RA
YK
CM
YM
1M
2M
1M
2M
1M
2M
1M
275
7575
7575
75G
RA
YG
RA
YK
CM
YK
CM
YK
CM
Y
Key 1
KC
MY
M1
M2
50
Key 23 M
1M
2star
starK
CM
Y
Kom
ori/GA
TF
P
art No. K
-28-6(D)
1/2/3/4 K1
2
34
1/2/3/4 C1
2
34
1/2/3/4 M1
2
34
1/2/3/4 M1
1/2/3/4 Y1
2
34
12
34
1/2/3/4 M2
12
34

75 North Drive - Westborough, MA 01581 - P | 508.870.0312 - F | 508.898.2275
2 C e n t e r P l a z a , S u i t e 2 0 0 - B o s t o n , M A 0 2 1 0 8 - P | 6 1 7. 37 1 . 3 9 9 9
m a s s t e c h . o r g - i n d e x . m a s s t e c h . o r g - @ m a s s _ t e c h
MassTech_MTCIndex Sig #1 - Low Folio - Front
MassTech_MTCIndex Sig #34 - Low Folio - Front
235008_MassTech_MTCIndex - Work-and-turn 1 - 12/19/14 08:41:21 - Black235008_MassTech_MTCIndex - Work-and-turn 1 - 12/19/14 08:41:21 - Cyan235008_MassTech_MTCIndex - Work-and-turn 1 - 12/19/14 08:41:21 - Magenta235008_MassTech_MTCIndex - Work-and-turn 1 - 12/19/14 08:41:21 - Yellow
Key 2
Key 3
Key 4
Key 5
Key 6
Key 7
Key 8
Key 9
Key 10
Key 11
Key 12
Key 13
Key 14
Key 15
Key 16
Key 17
Key 18
Key 19
Key 21
Key 20
Key 22
KC
MY
M1
M2
M1
M2
M1
M2
M1
M2
M1
M2
M1
M2
M1
M2
M1
M2
M1
M2
M1
M2
M1
M2
2525
M1
M2
25M
1M
225
2525
50M
1M
2M
1M
250
5050
5050
M1
M2
M1
M2
5075
7575
7575
75G
RA
YG
RA
YG
RA
YG
RA
YG
RA
YK
CM
YK
CM
YK
CM
YK
CM
YK
CM
YK
CM
YY
+M
Y+
CC
+M
KC
MY
KC
MY
KC
MY
KP
CM
YK
CM
YK
CM
YK
CM
YK
CM
YK
CM
YK
CM
YG
RA
YK
CM
YM
1M
2M
1M
2M
1M
2M
1M
275
7575
7575
75G
RA
YG
RA
YK
CM
YK
CM
YK
CM
Y
Key 1
KC
MY
M1
M2
50
Key 23 M
1M
2star
starK
CM
Y
Kom
ori/GA
TF
P
art No. K
-28-6(D)
1/2/3/4 K1
2
34
1/2/3/4 C1
2
34
1/2/3/4 M1
2
34
1/2/3/4 M1
1/2/3/4 Y1
2
34
12
34
1/2/3/4 M2
12
34

The 2014 Annual Index of The Massachusetts Innovation Economy was produced by The Innovation Institute at the Massachusetts Technology Collaborative. Published in the U.S.A. for Massachusetts Technology Park. © Copyright 2014
2 0 1 4 A n n u a l I n d e xThe Massachusetts Innovation Economy masstech.org - index.masstech.org
MassTech_MTCIndex Sig #1 - Low Folio - Front
MassTech_MTCIndex Sig #34 - Low Folio - Front
235008_MassTech_MTCIndex - Work-and-turn 1 - 12/19/14 08:41:21 - Black 235008_MassTech_MTCIndex - Work-and-turn 1 - 12/19/14 08:41:21 - Cyan 235008_MassTech_MTCIndex - Work-and-turn 1 - 12/19/14 08:41:21 - Magenta 235008_MassTech_MTCIndex - Work-and-turn 1 - 12/19/14 08:41:21 - Yellow
Key
2K
ey 3
Key
4
Key
5K
ey 6
Key
7K
ey 8
Key
9K
ey 1
0K
ey 1
1K
ey
12
Key
13
Key
14
Key
15
Key
16
Key
17
Key
18
Key
19
Key
21
Key
2
0K
ey 2
2
KC
MY
M1
M2
M1
M2
M1
M2
M1
M2
M1
M2
M1
M2
M1
M2
M1
M2
M1
M2
M1
M2
M1
M2
2525
M1
M2
25M
1M
225
2525
50M
1M
2M
1M
250
5050
5050
M1
M2
M1
M2
5075
7575
7575
75G
RA
YG
RA
YG
RA
YG
RA
YG
RA
YK
CM
YK
CM
YK
CM
YK
CM
YK
CM
YK
CM
YY
+M
Y+
CC
+M
KC
MY
KC
MY
KC
MY
KP
CM
YK
CM
YK
CM
YK
CM
YK
CM
YK
CM
YK
CM
YG
RA
YK
CM
YM
1M
2M
1M
2M
1M
2M
1M
275
7575
7575
75G
RA
YG
RA
YK
CM
YK
CM
YK
CM
Y
Key
1
KC
MY
M1
M2
50
Key
23M
1M
2st
arst
arK
CM
Y
Kom
ori/G
AT
F
Par
t No.
K-2
8-6(
D)
1/2/
3/4
K1
2
34
1/2/
3/4
C1
2
34
1/2/
3/4
M1
2
34
1/2/
3/4
M1
1/2/
3/4
Y1
2
34
12
34
1/2/
3/4
M2
12
34