Embed Size (px)
DESCRIPTION
Slides for a talk at Predictive Analytics World 2012 in Boston about mapping social media networks with NodeXL.
Citation preview

Marc A. SmithChief Social ScientistConnected Action Consulting [email protected]://www.connectedaction.nethttp://nodexl.codeplex.com/
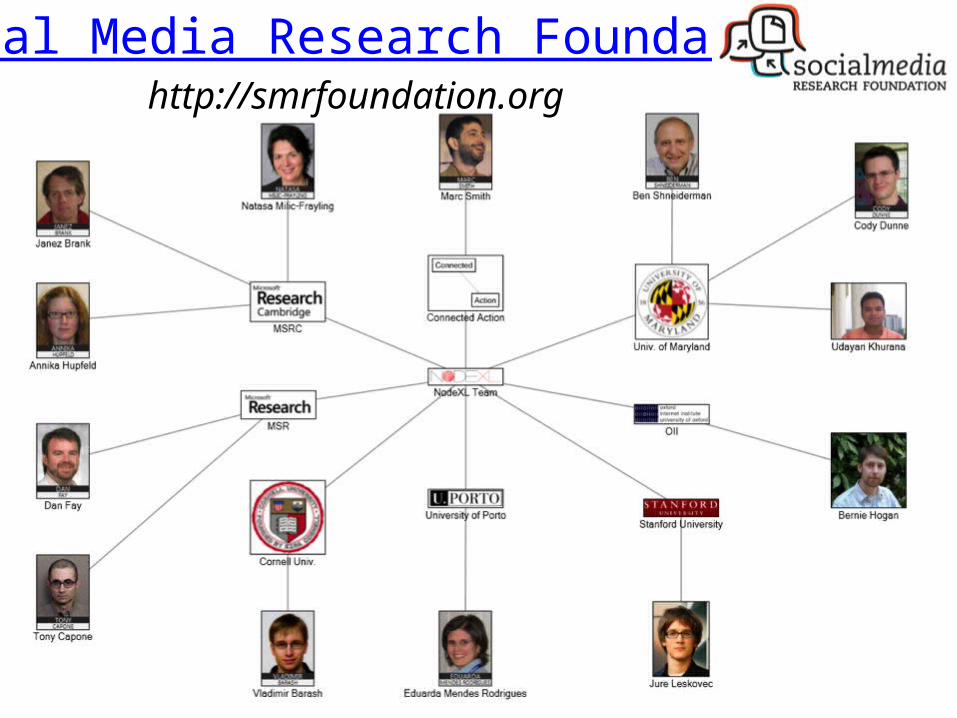
A project from the Social Media Research Foundation: http://www.smrfoundation.org
Charting Collections of Connections
In Social Media: Creating Maps & Measures with
NodeXL
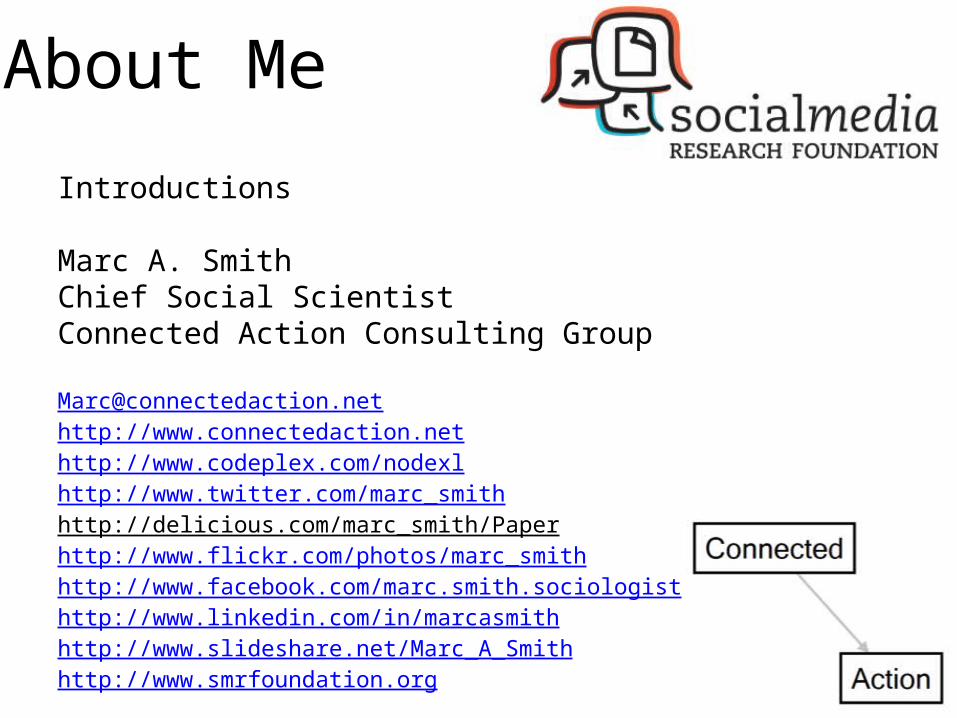
About Me
Introductions
Marc A. SmithChief Social ScientistConnected Action Consulting Group
[email protected]://www.connectedaction.nethttp://www.codeplex.com/nodexlhttp://www.twitter.com/marc_smithhttp://delicious.com/marc_smith/Paper http://www.flickr.com/photos/marc_smithhttp://www.facebook.com/marc.smith.sociologisthttp://www.linkedin.com/in/marcasmithhttp://www.slideshare.net/Marc_A_Smithhttp://www.smrfoundation.org

Social Media (email, Facebook, Twitter, YouTube, and more) is all about connections
from people
to people.
5
Patterns are left behind
6
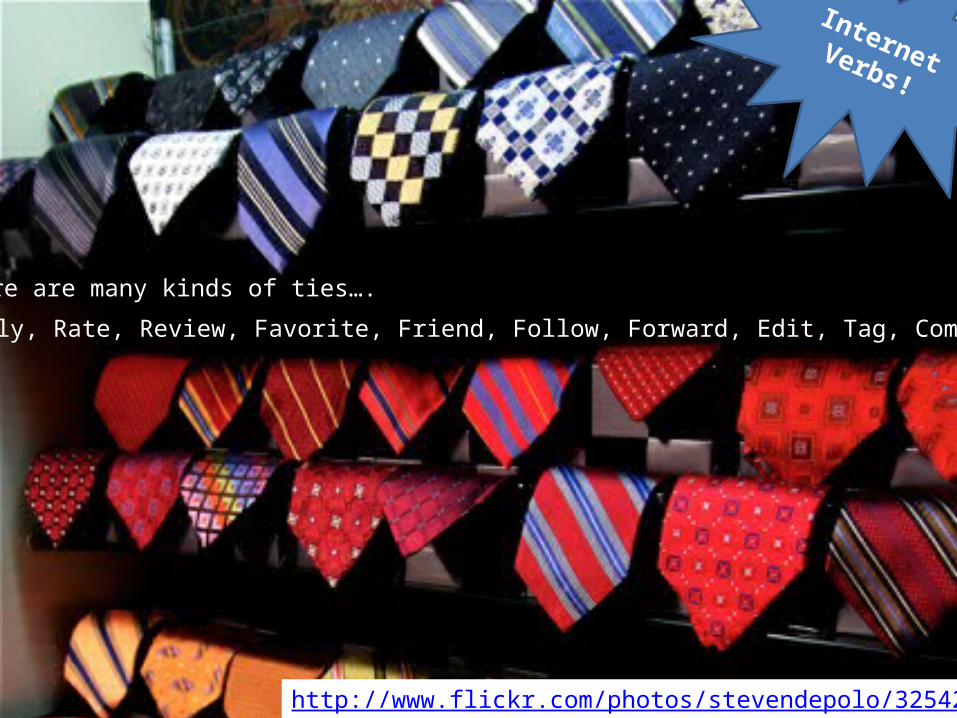
There are many kinds of ties….
http://www.flickr.com/photos/stevendepolo/3254238329
Like, Link, Reply, Rate, Review, Favorite, Friend, Follow, Forward, Edit, Tag, Comment, Check-in…
Internet Verbs!
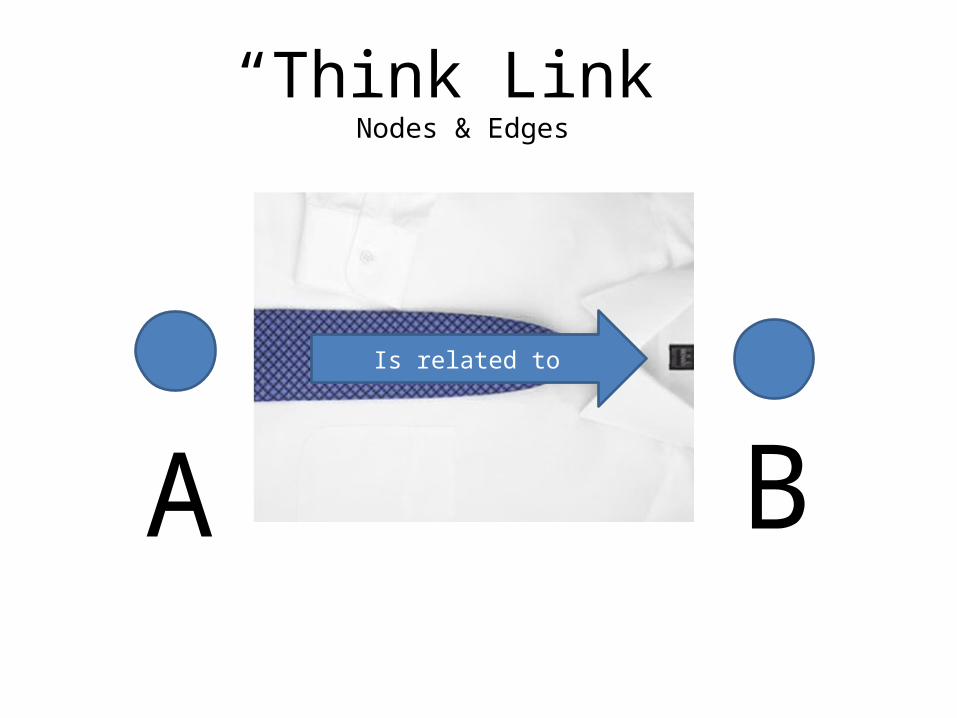
“Think Link”Nodes & Edges
Is related to
A B
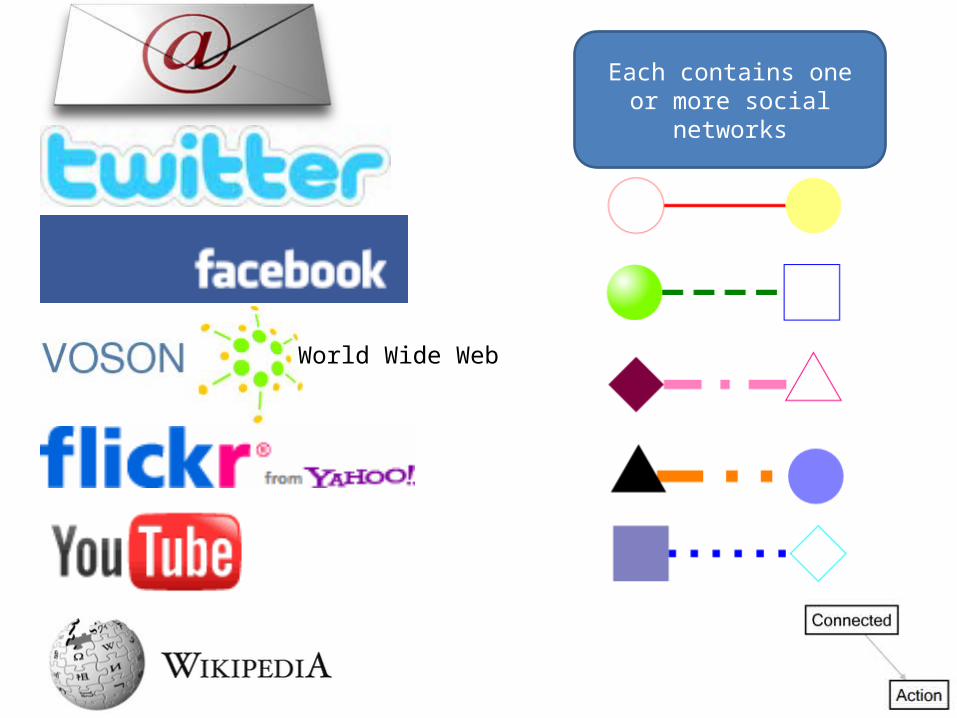
World Wide Web
Each contains one or more social networks
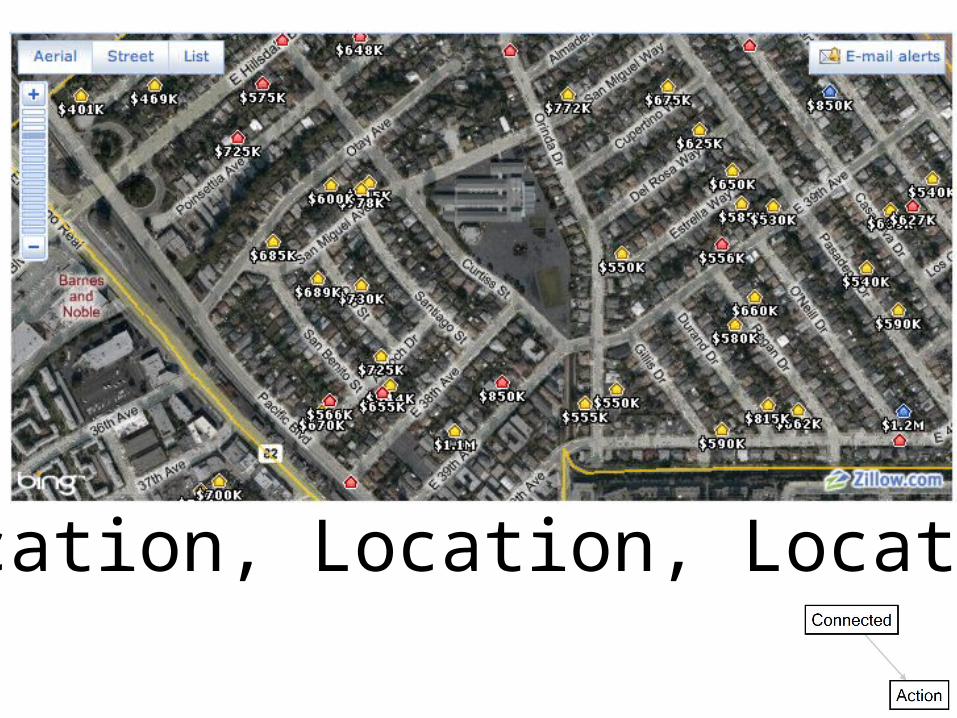
Location, Location, Location
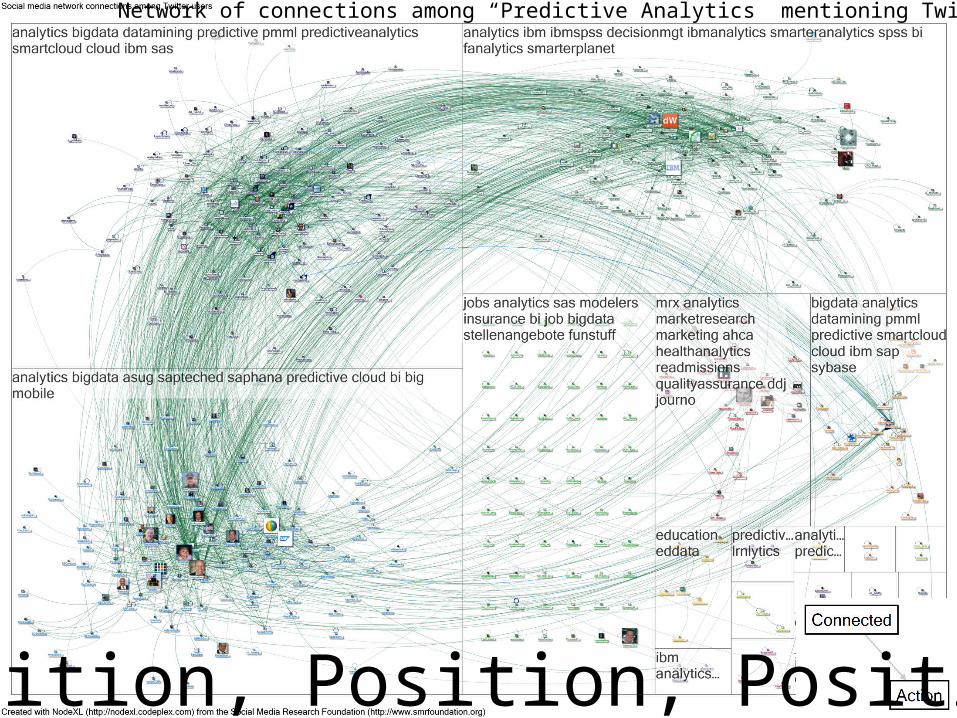
Network of connections among “Predictive Analytics” mentioning Twitter users
Position, Position, Position
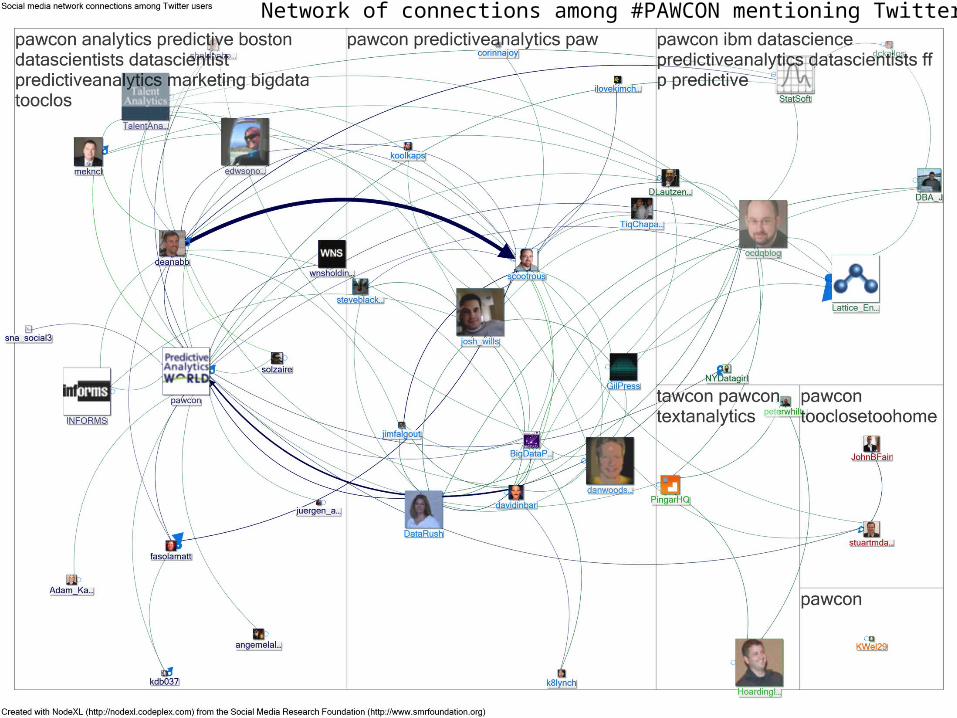
Network of connections among #PAWCON mentioning Twitter users
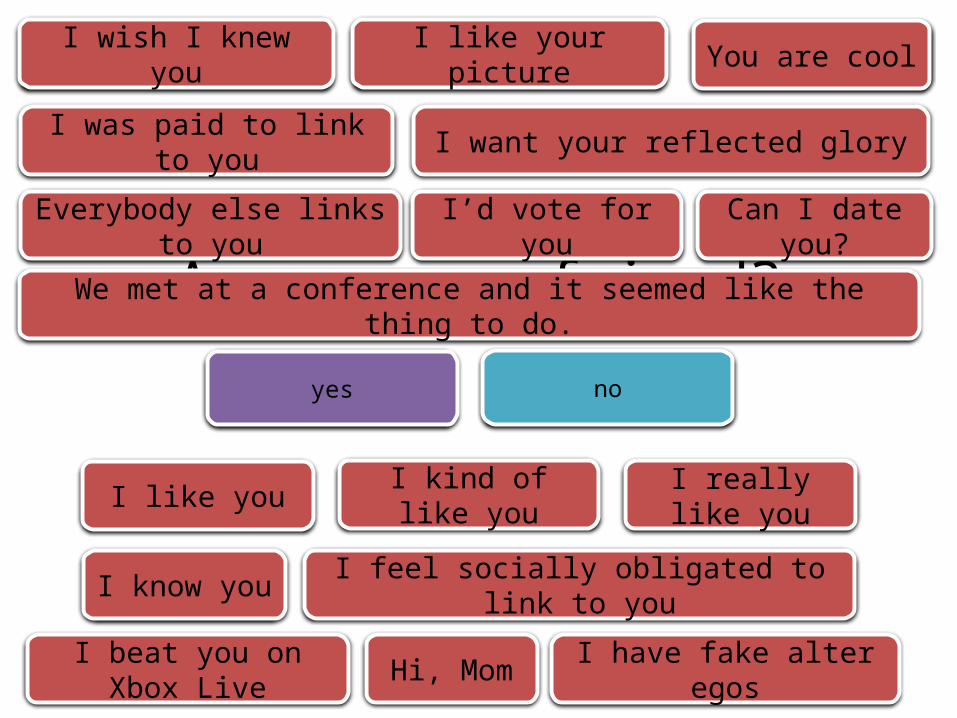
Are you my friend?
yes no
I like you I really like youI kind of like you
I feel socially obligated to link to youI know you
I wish I knew you I like your picture You are cool
I was paid to link to you I want your reflected glory
Everybody else links to you I’d vote for you
We met at a conference and it seemed like the thing to do.
Can I date you?
I beat you on Xbox Live Hi, Mom I have fake alter egos
http://www.flickr.com/photos/fullaperture/81266869/
Strength of Weak ties
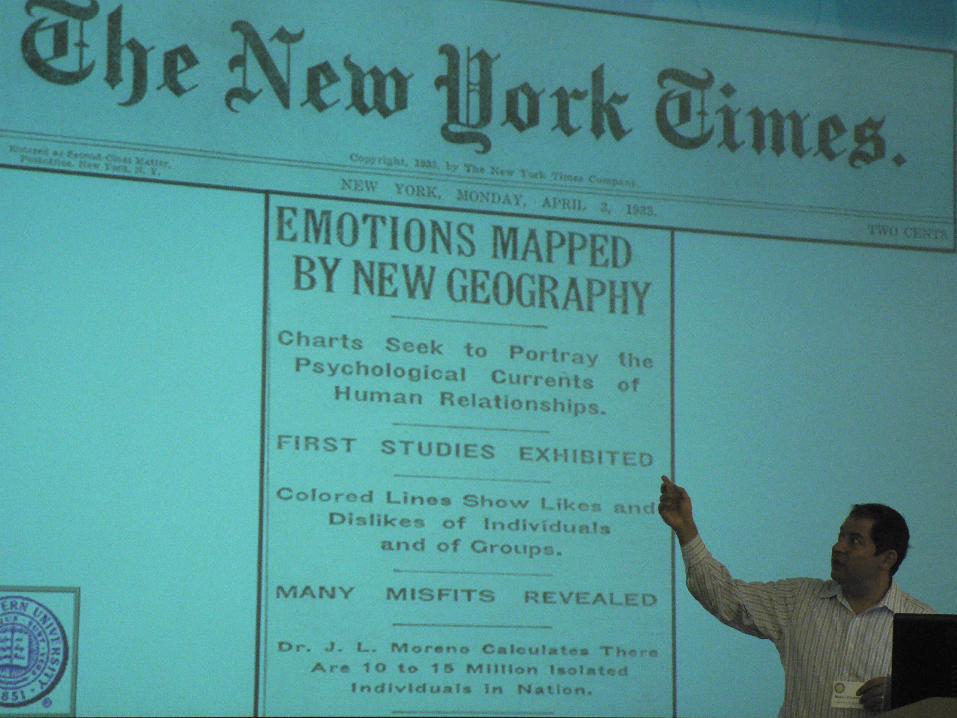
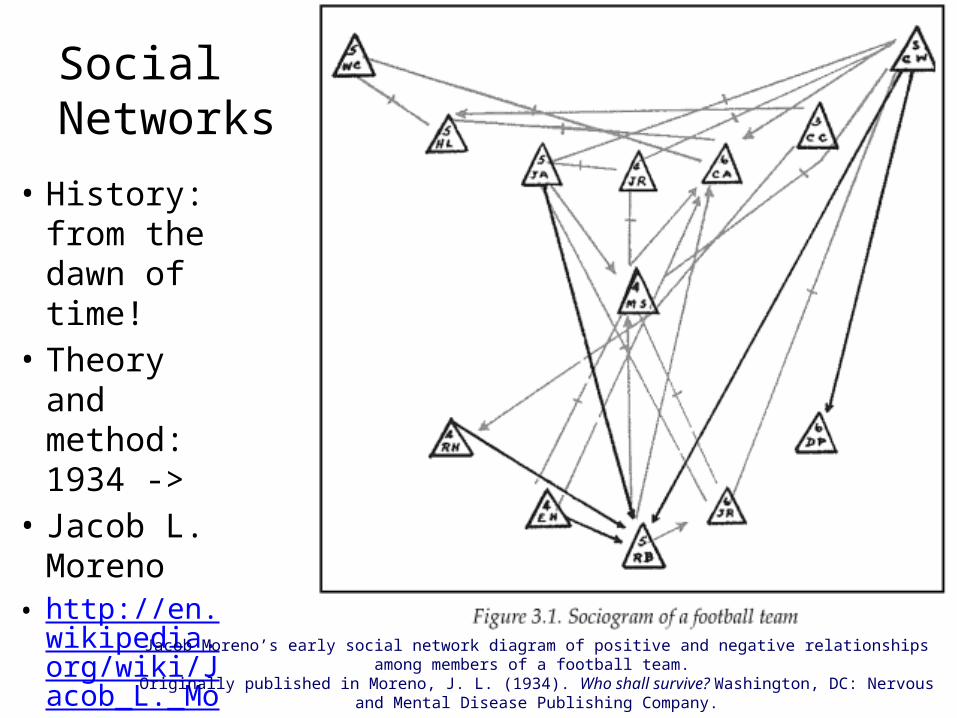
Social Networks
• History: from the dawn of time!
• Theory and method: 1934 ->
• Jacob L. Moreno
• http://en.wikipedia.org/wiki/Jacob_L._Moreno
Jacob Moreno’s early social network diagram of positive and negative relationships among members of a football team.
Originally published in Moreno, J. L. (1934). Who shall survive? Washington, DC: Nervous and Mental Disease Publishing Company.
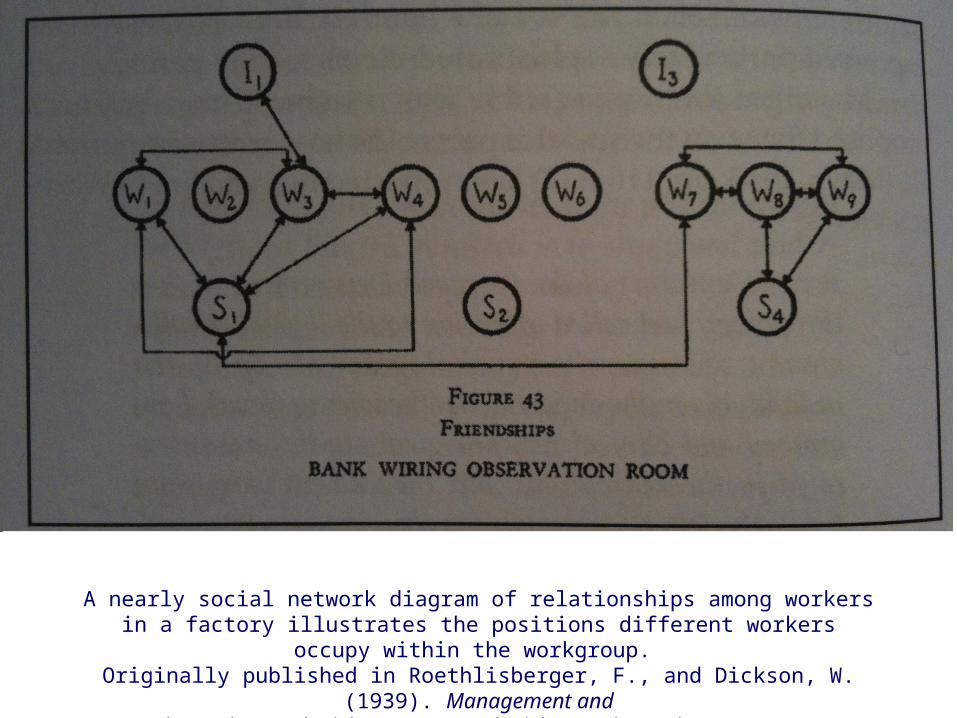
A nearly social network diagram of relationships among workers in a factory illustrates the positions different workers occupy within the workgroup.
Originally published in Roethlisberger, F., and Dickson, W. (1939). Management andthe worker. Cambridge, UK: Cambridge University Press.
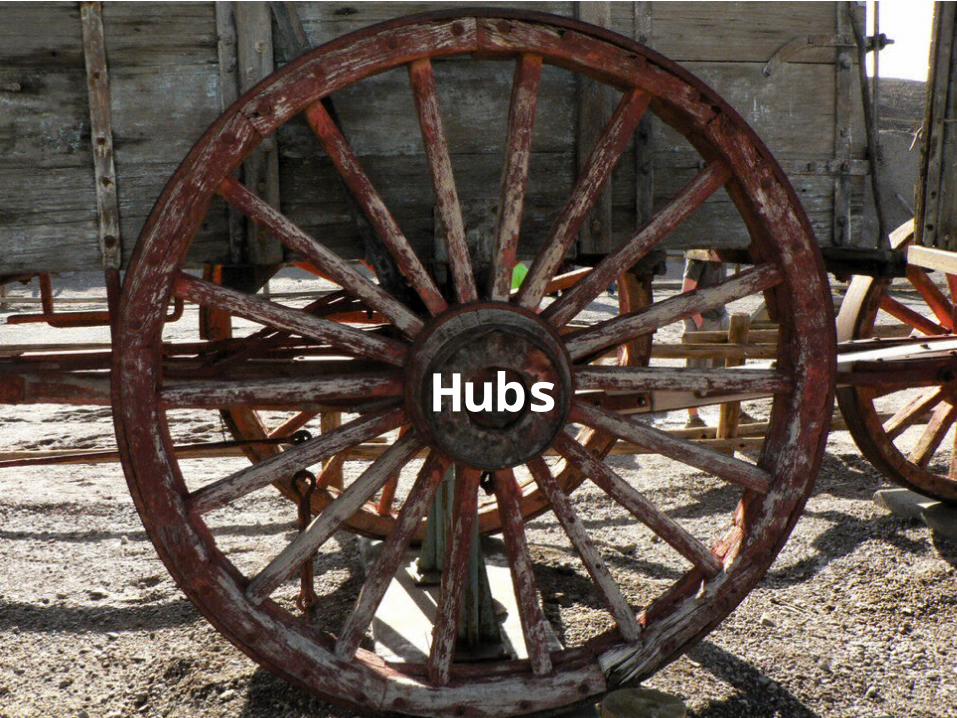
Hubs

Bridges
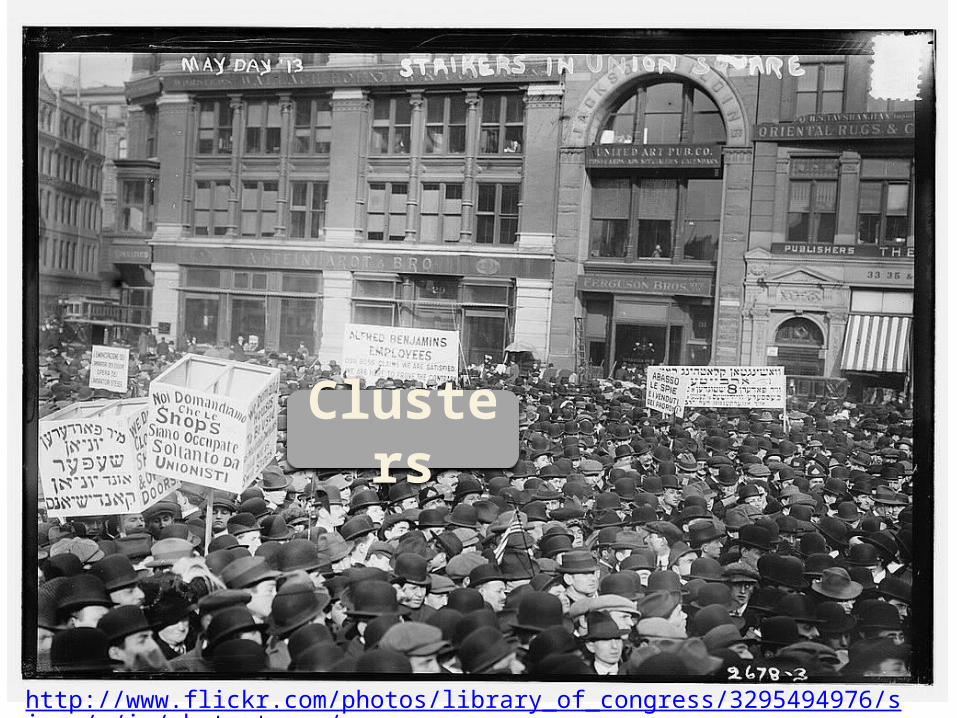
http://www.flickr.com/photos/library_of_congress/3295494976/sizes/o/in/photostream/
Clusters
Islands
http://www.flickr.com/photos/storm-crypt/3047698741
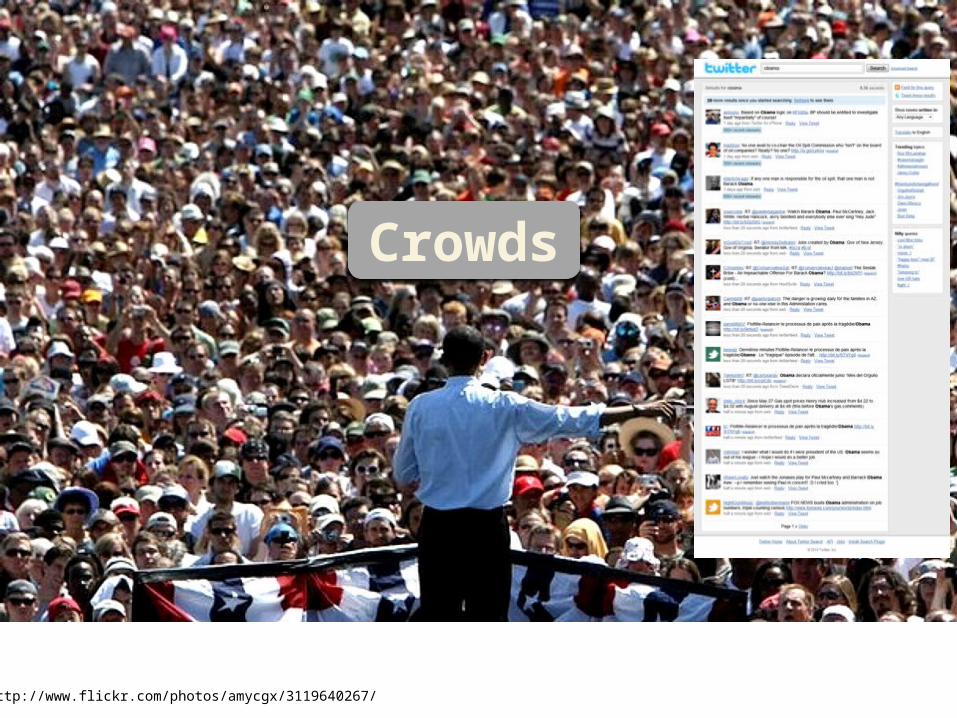
http://www.flickr.com/photos/amycgx/3119640267/
Crowds
Introduction to NodeXL
Like MSPaint™ for graphs.— the Community
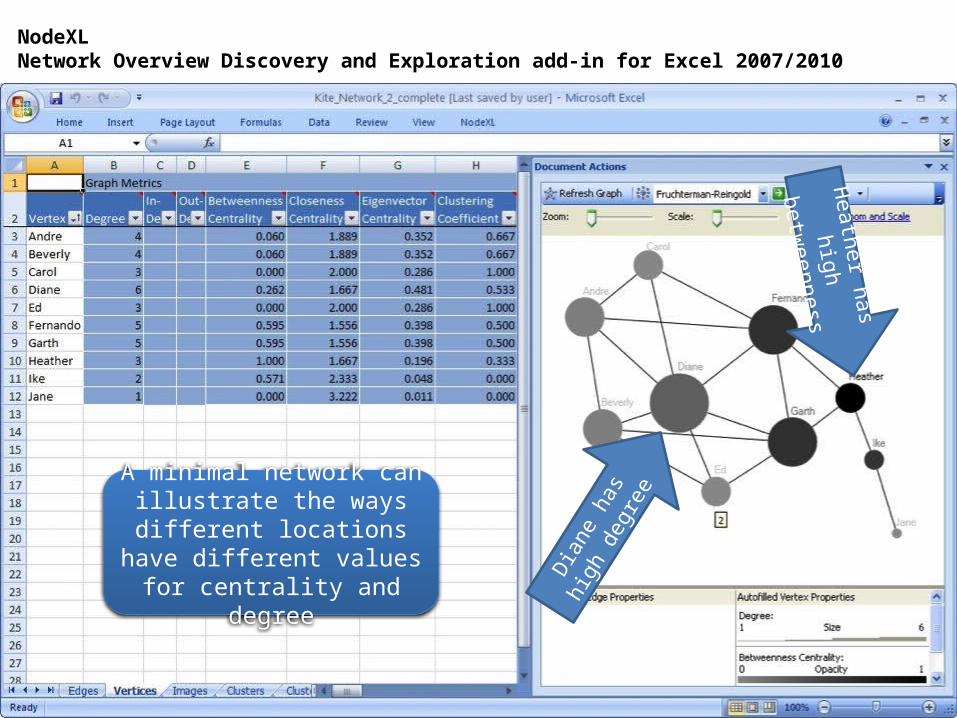
Dian
e has
high
de
gree
Heather has high
betweenness
NodeXLNetwork Overview Discovery and Exploration add-in for Excel 2007/2010
A minimal network can illustrate the ways different
locations have different values for centrality and degree
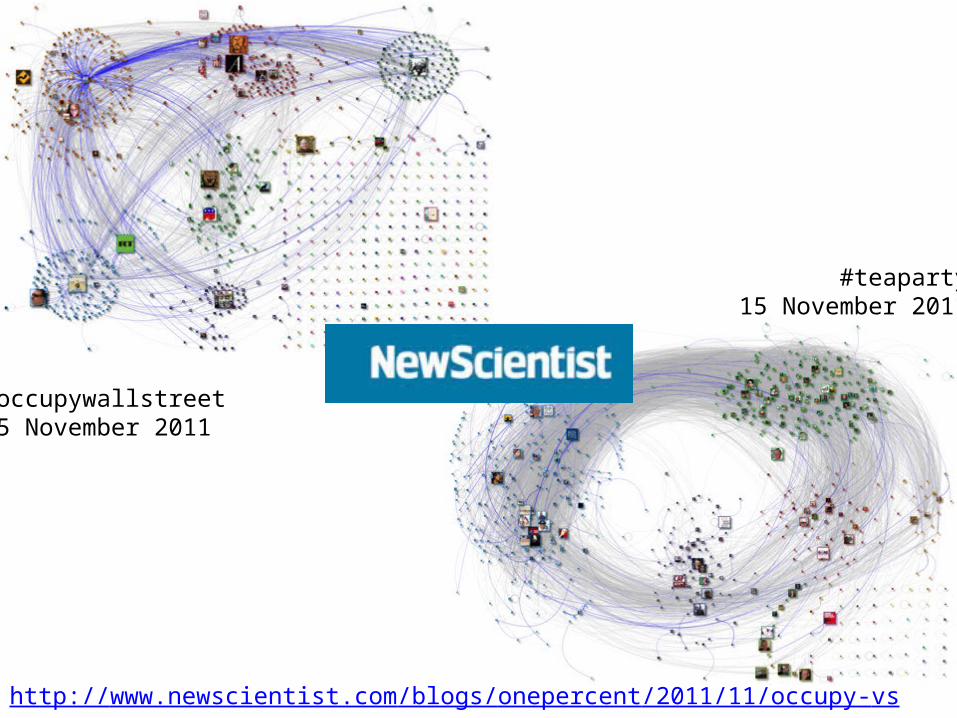
#occupywallstreet15 November 2011
#teaparty15 November 2011
http://www.newscientist.com/blogs/onepercent/2011/11/occupy-vs-tea-party-what-their.html
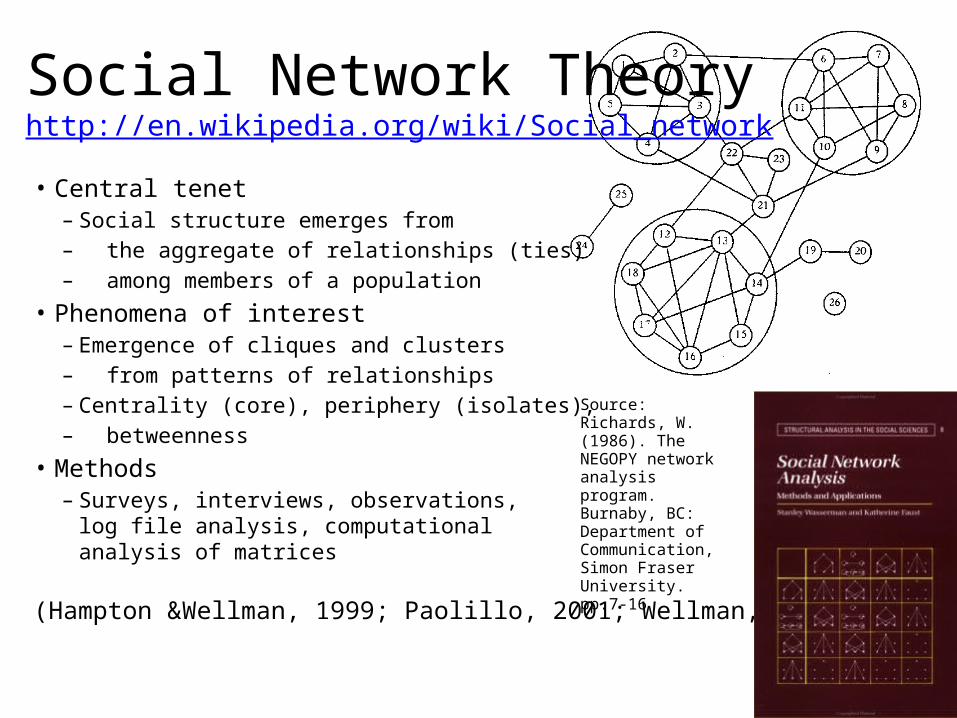
• Central tenet – Social structure emerges from – the aggregate of relationships (ties) – among members of a population
• Phenomena of interest– Emergence of cliques and clusters – from patterns of relationships– Centrality (core), periphery (isolates), – betweenness
• Methods– Surveys, interviews, observations,
log file analysis, computational analysis of matrices
(Hampton &Wellman, 1999; Paolillo, 2001; Wellman, 2001)
Source: Richards, W. (1986). The NEGOPY network analysis program. Burnaby, BC: Department of Communication, Simon Fraser University. pp.7-16
Social Network Theoryhttp://en.wikipedia.org/wiki/Social_network
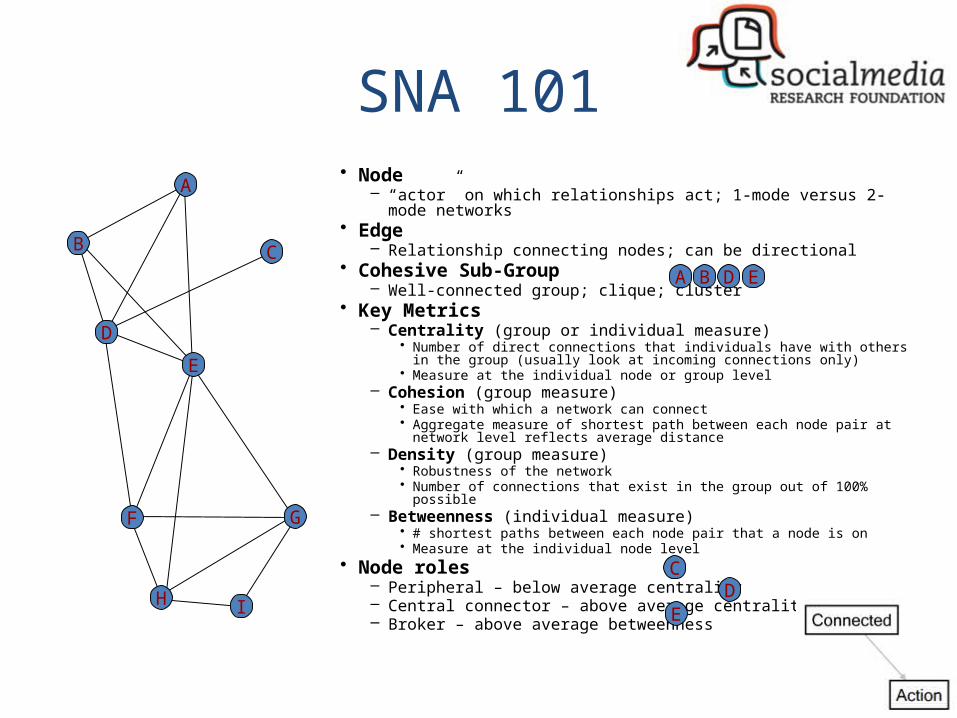
SNA 101• Node
– “actor” on which relationships act; 1-mode versus 2-mode networks• Edge
– Relationship connecting nodes; can be directional• Cohesive Sub-Group
– Well-connected group; clique; cluster• Key Metrics
– Centrality (group or individual measure)• Number of direct connections that individuals have with others in the group (usually look at
incoming connections only)• Measure at the individual node or group level
– Cohesion (group measure)• Ease with which a network can connect• Aggregate measure of shortest path between each node pair at network level reflects
average distance– Density (group measure)
• Robustness of the network• Number of connections that exist in the group out of 100% possible
– Betweenness (individual measure)• # shortest paths between each node pair that a node is on• Measure at the individual node level
• Node roles– Peripheral – below average centrality– Central connector – above average centrality– Broker – above average betweenness
E
D
F
A
CB
H
G
I
CD
E
A B D E
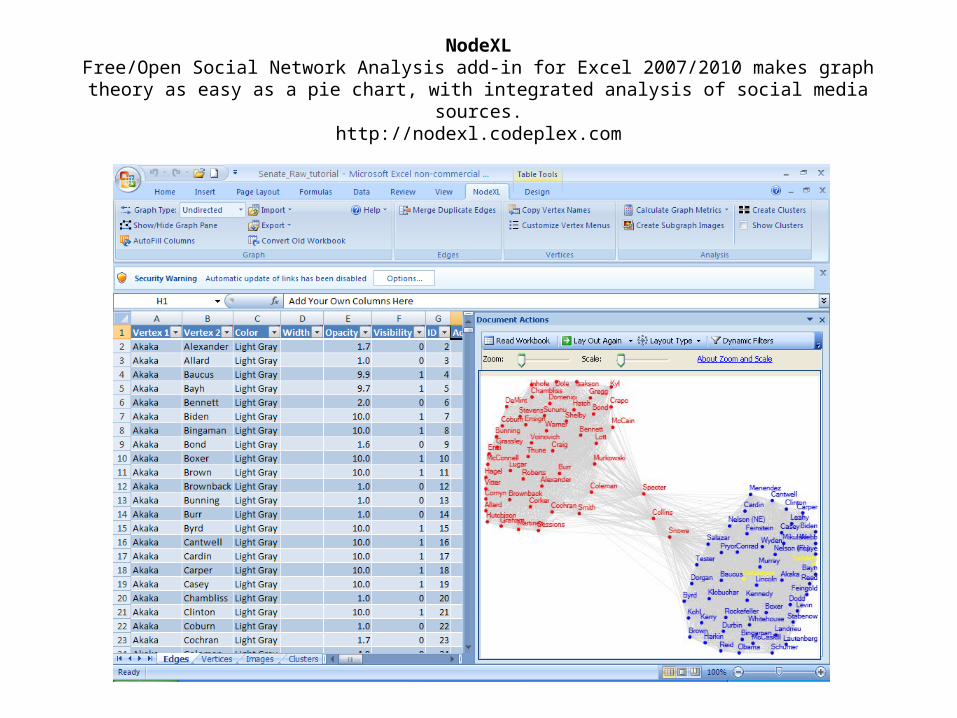
NodeXLFree/Open Social Network Analysis add-in for Excel 2007/2010 makes graph
theory as easy as a pie chart, with integrated analysis of social media sources.http://nodexl.codeplex.com
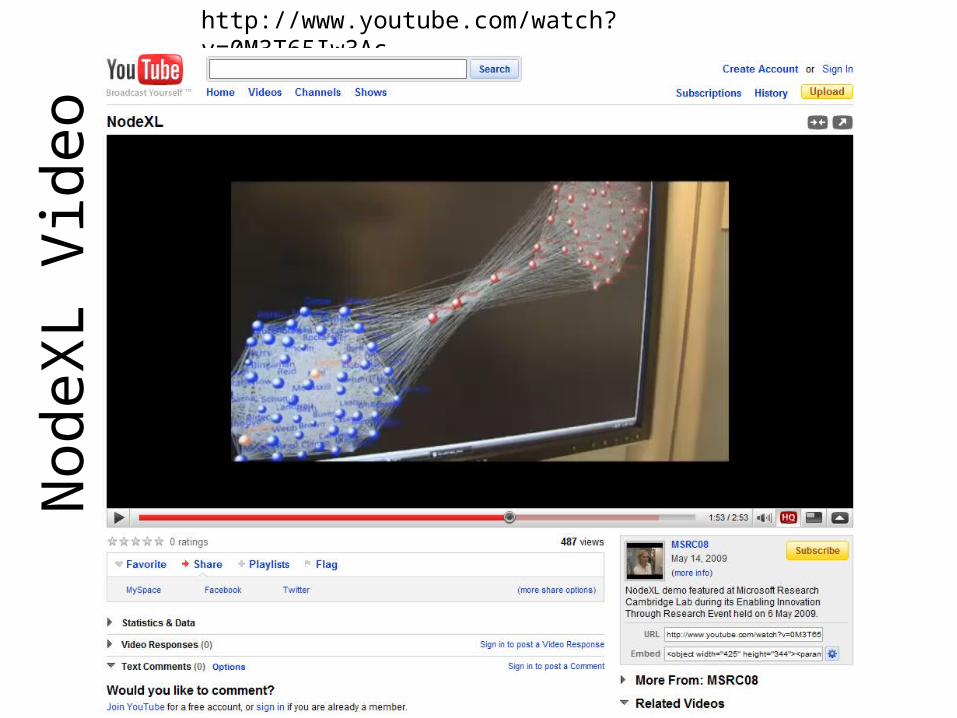
http://www.youtube.com/watch?v=0M3T65Iw3Ac
Nod
eXL
Vide
o
Goal: Make SNA easier
• Existing Social Network Tools are challenging for many novice users
• Tools like Excel are widely used• Leveraging a spreadsheet as a host for SNA
lowers barriers to network data analysis and display
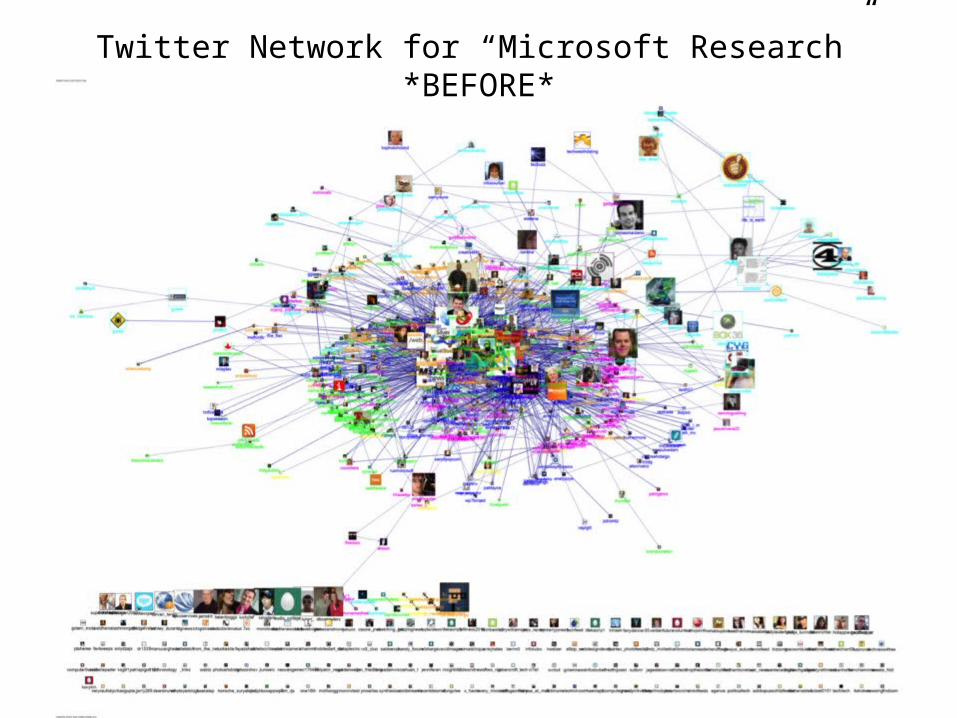
Twitter Network for “Microsoft Research”*BEFORE*
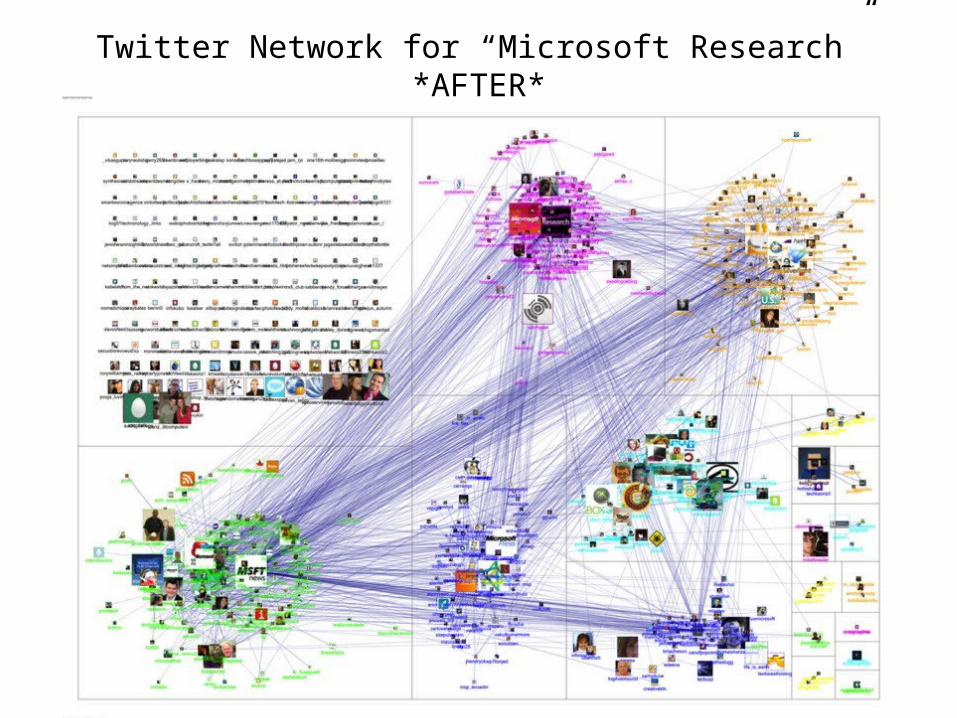
Twitter Network for “Microsoft Research”*AFTER*
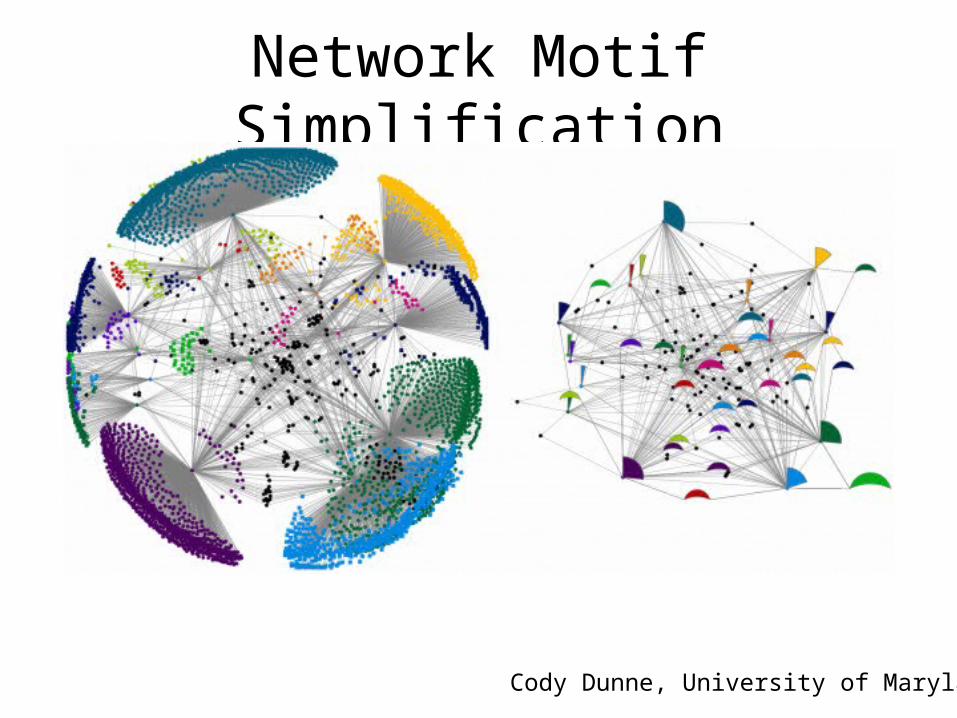
Network Motif Simplification
Cody Dunne, University of Maryland
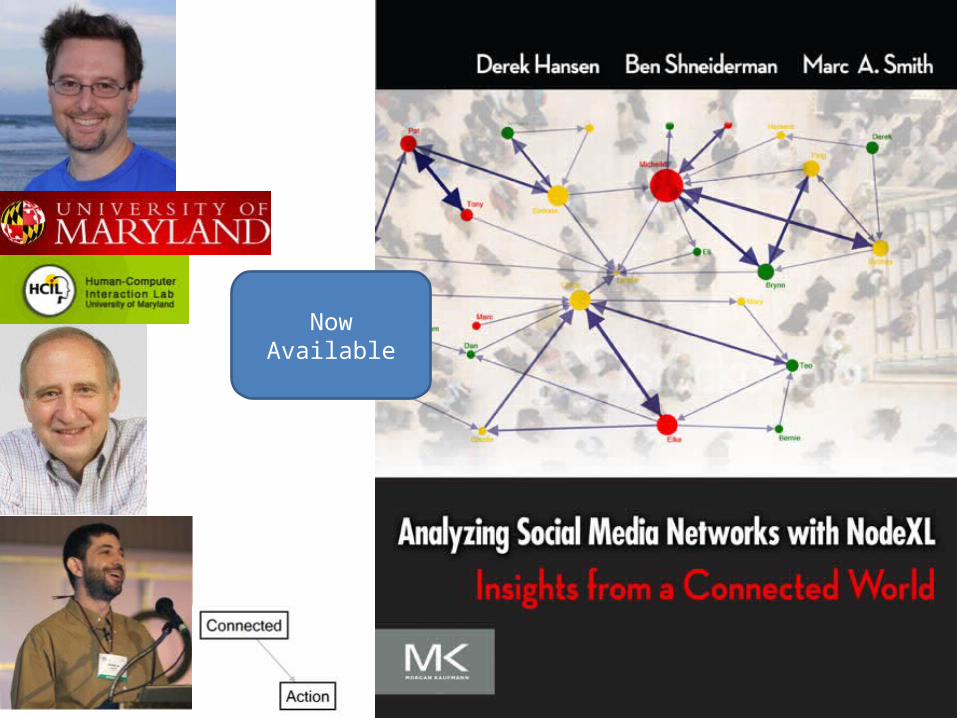
Now Available
Communities in Cyberspace
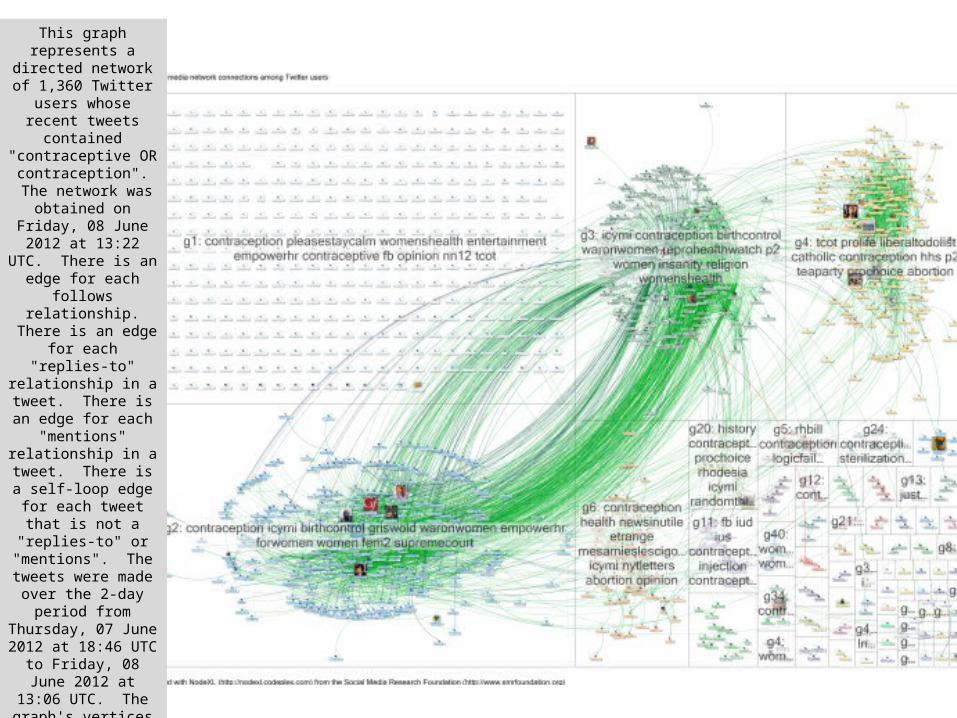
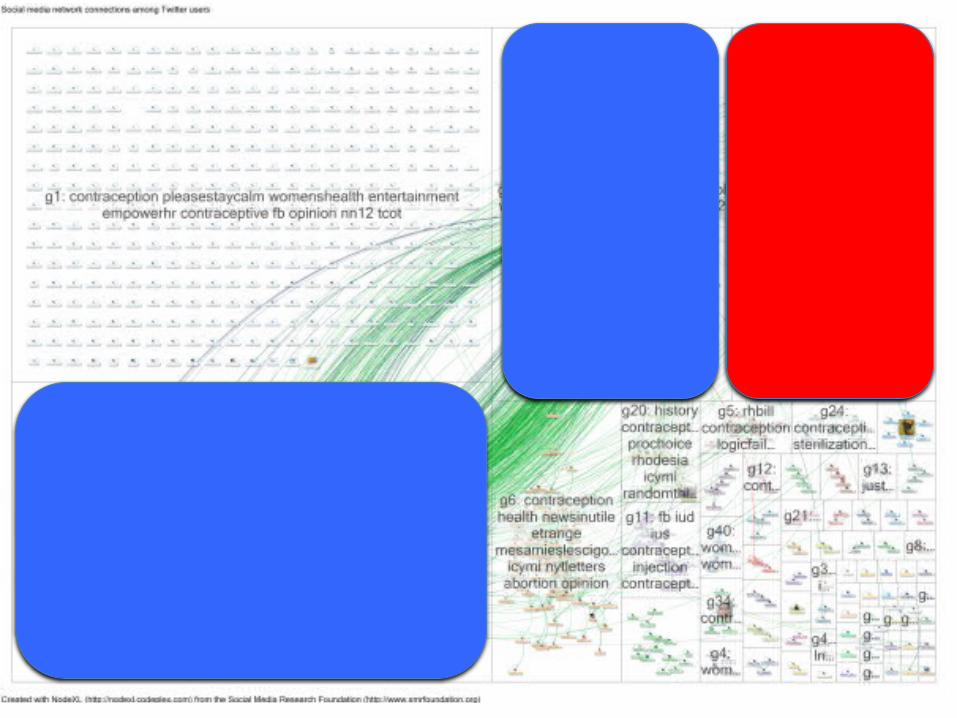
This graph represents a directed network of 1,360 Twitter users
whose recent tweets contained "contraceptive OR contraception". The network was obtained
on Friday, 08 June 2012 at 13:22 UTC. There is
an edge for each follows relationship. There is an edge for each "replies-
to" relationship in a tweet. There is an edge
for each "mentions" relationship in a tweet.
There is a self-loop edge for each tweet that is not
a "replies-to" or "mentions". The tweets were made over the 2-
day period from Thursday, 07 June 2012 at 18:46 UTC to Friday, 08 June 2012 at 13:06
UTC. The graph's vertices were grouped by cluster using the Clauset-Newman-Moore cluster
algorithm. The edge colors are based on
relationship values. The vertex sizes are based on
each user’s number of followers. Table 1
reports the summary network metrics that describe the graph.
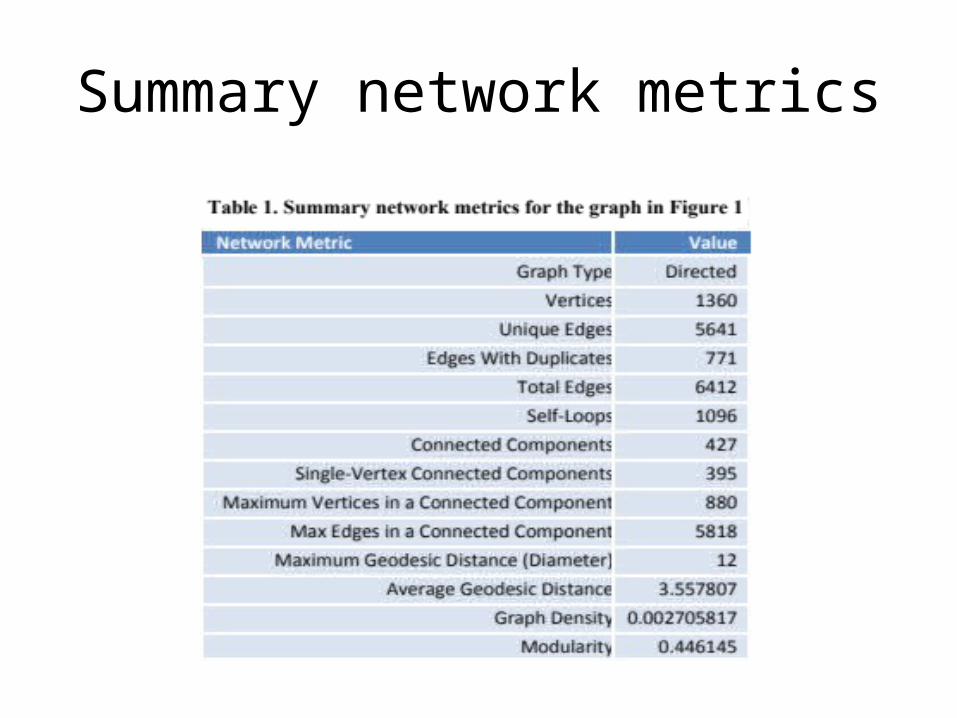
Summary network metrics
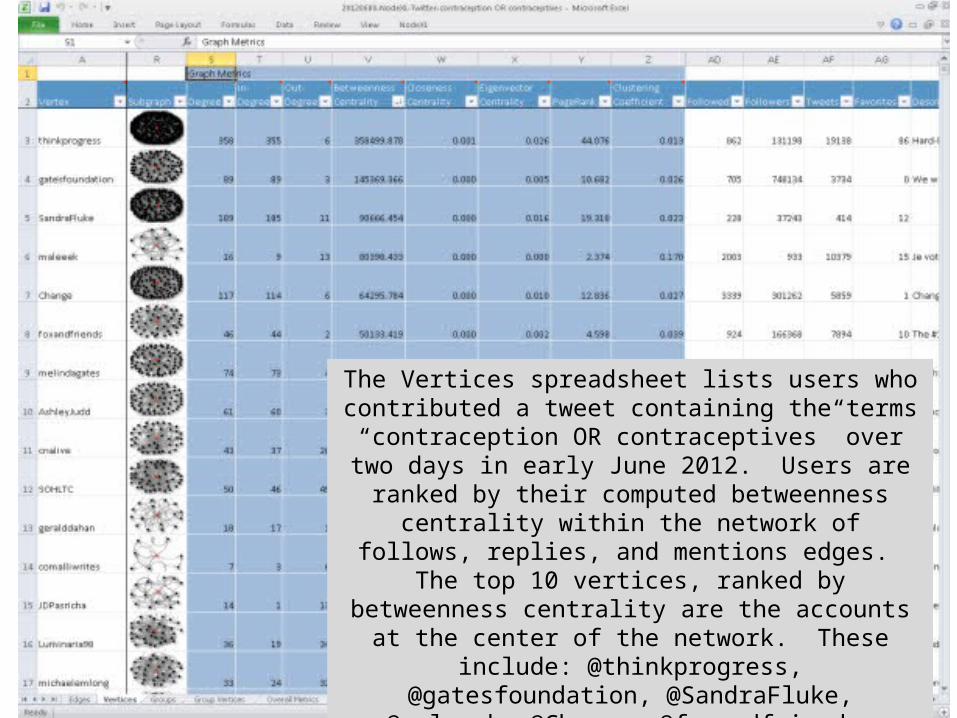
The Vertices spreadsheet lists users who contributed a tweet containing the terms “contraception OR
contraceptives” over two days in early June 2012. Users are ranked by their computed betweenness centrality within the network of follows, replies, and mentions edges. The top 10 vertices, ranked by betweenness centrality are the accounts
at the center of the network. These include: @thinkprogress, @gatesfoundation, @SandraFluke,
@maleeek, @Change, @foxandfriends, @melindagates, @AshleyJudd, @cnalive, and @SOHLTC.
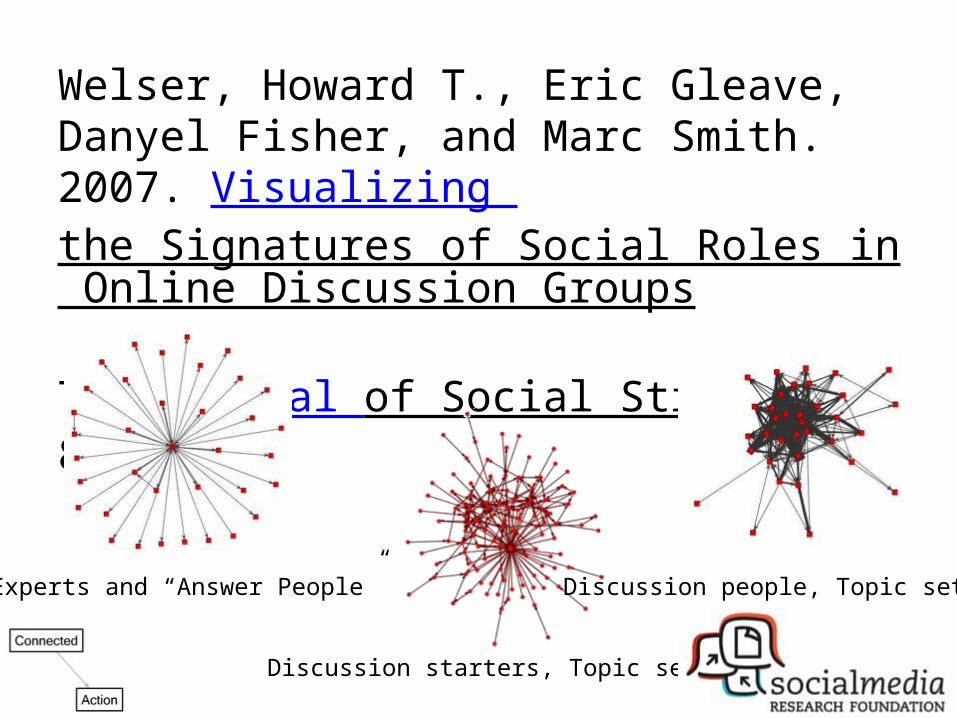
Welser, Howard T., Eric Gleave, Danyel Fisher, and Marc Smith. 2007. Visualizing the Signatures of Social Roles in Online Discussion Groups. The Journal of Social Structure. 8(2).
Experts and “Answer People”
Discussion starters, Topic setters
Discussion people, Topic setters
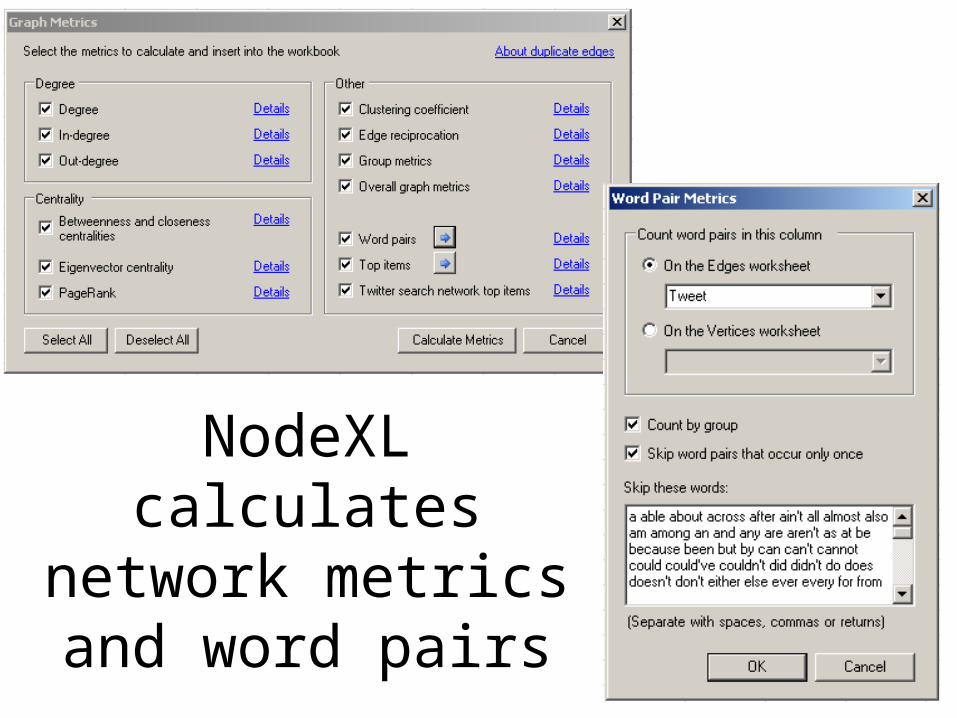
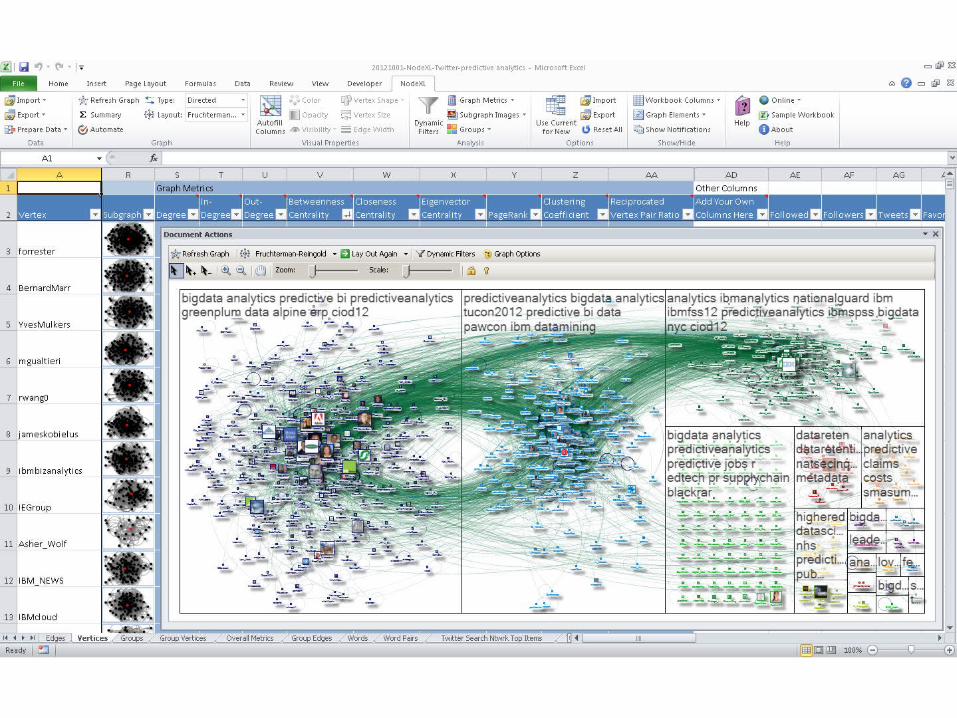
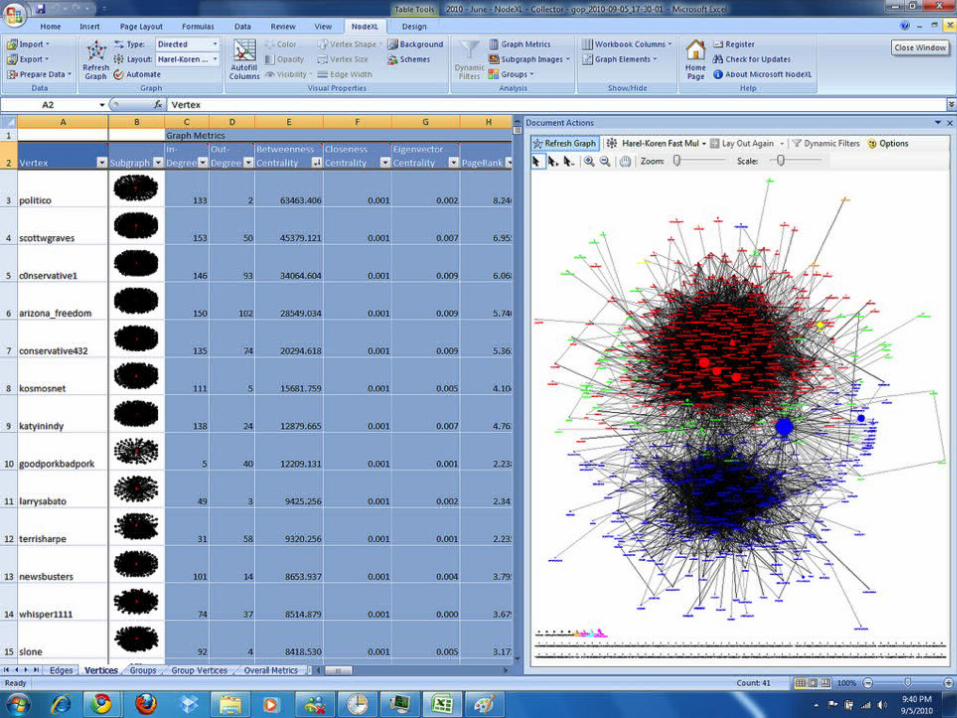
NodeXL calculates network metrics and
word pairs
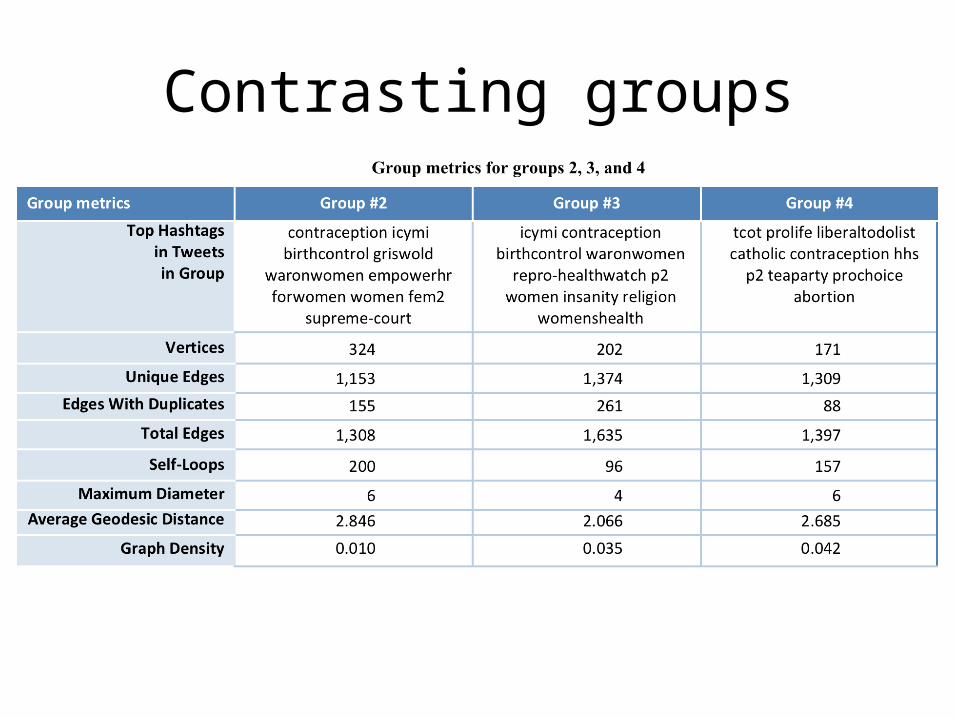
Contrasting groups
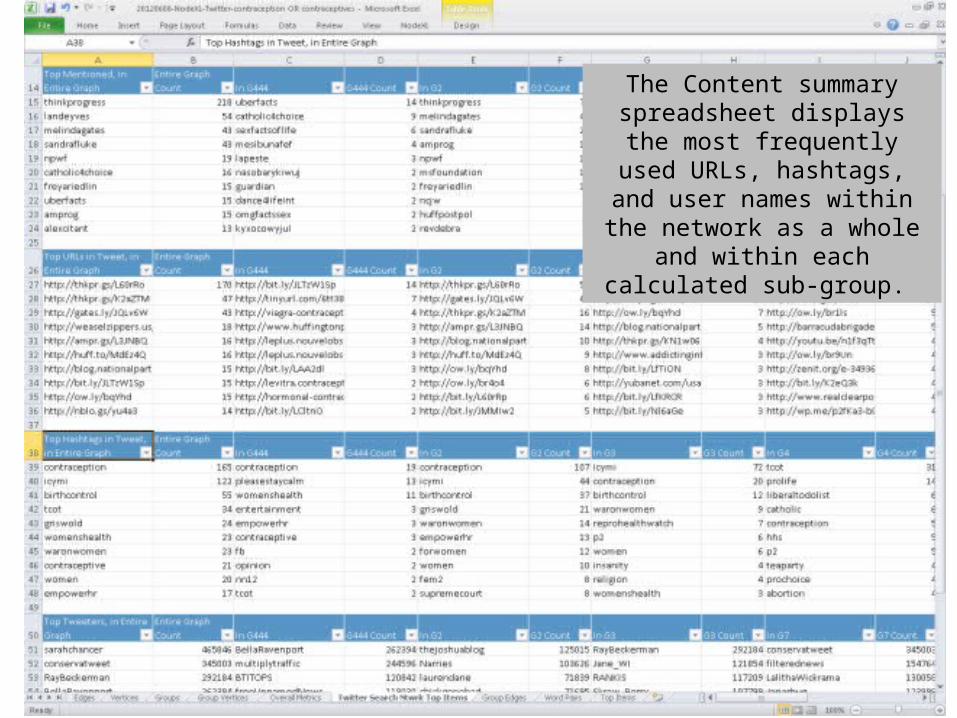
The Content summary spreadsheet displays the most
frequently used URLs, hashtags, and user names within the
network as a whole and within each calculated sub-group.
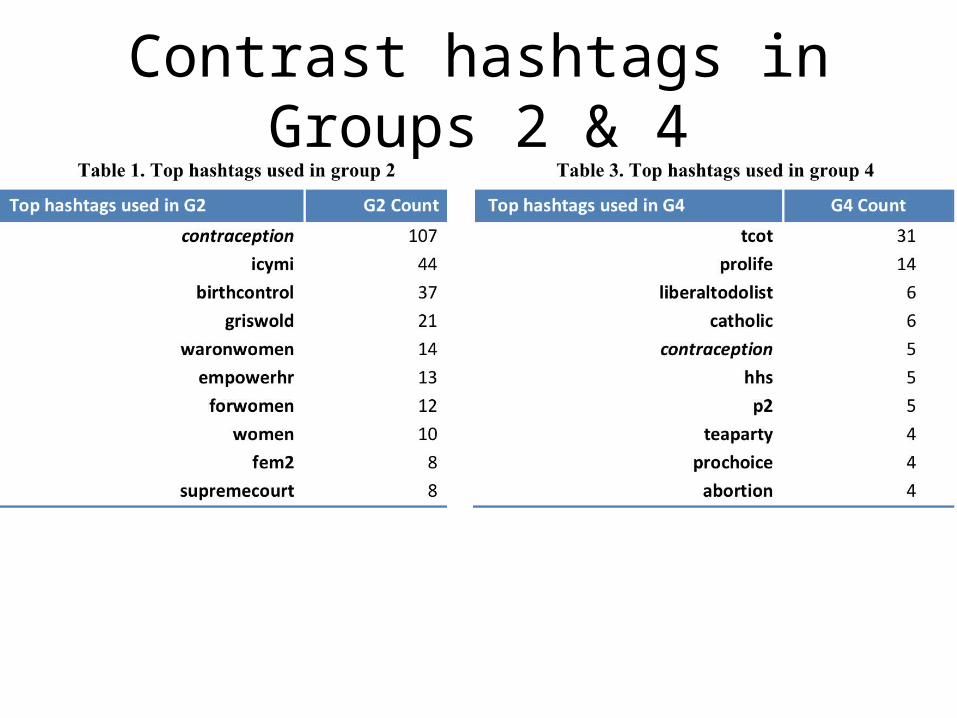
Contrast hashtags in Groups 2 & 4
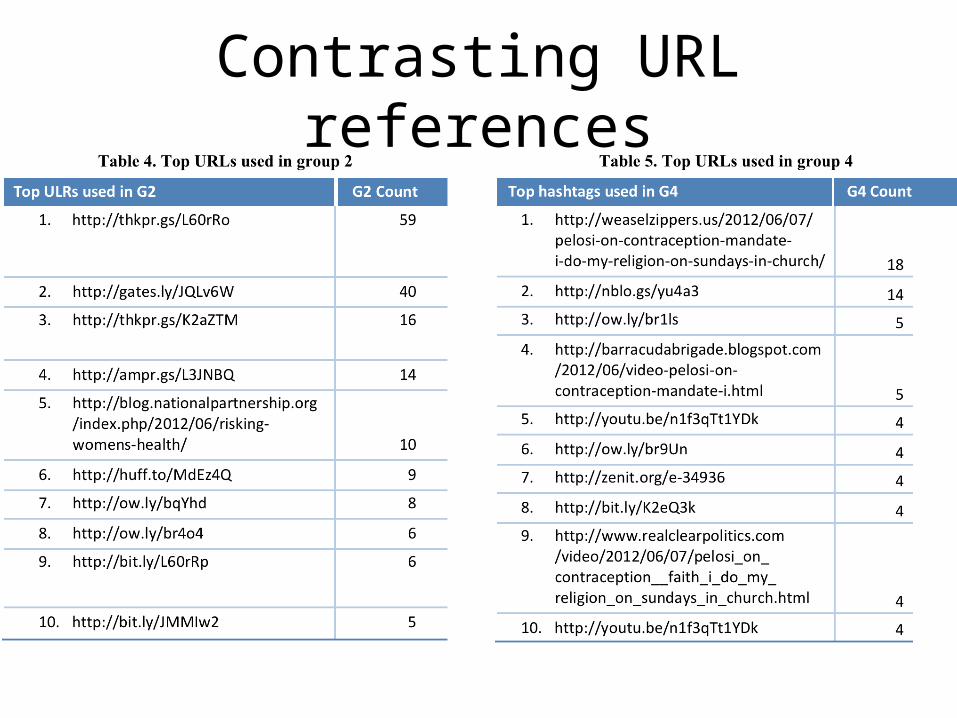
Contrasting URL references
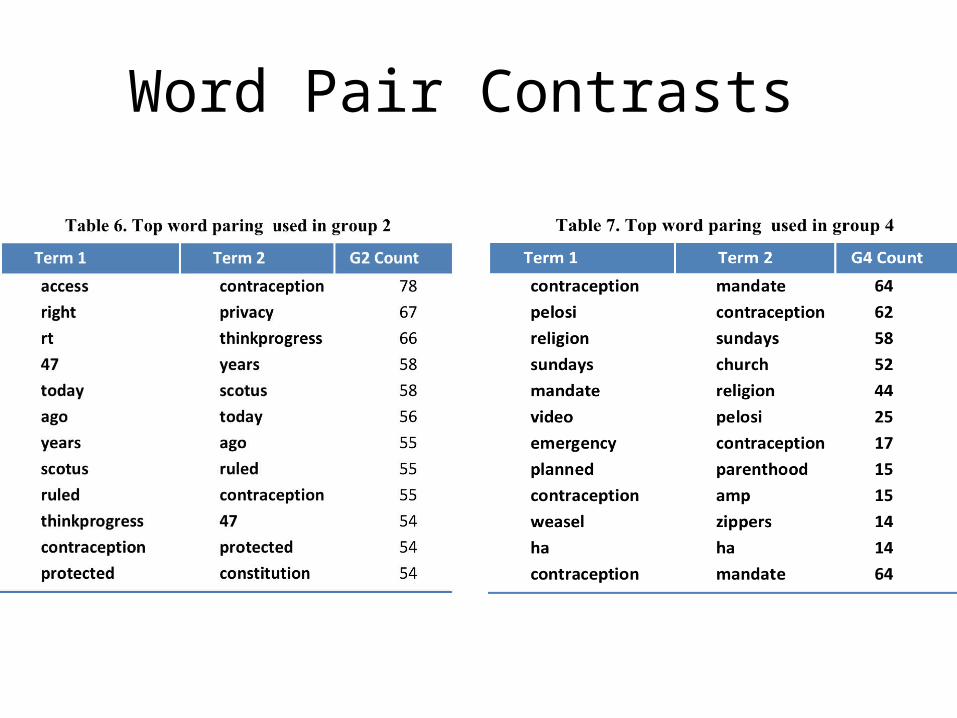
Word Pair Contrasts
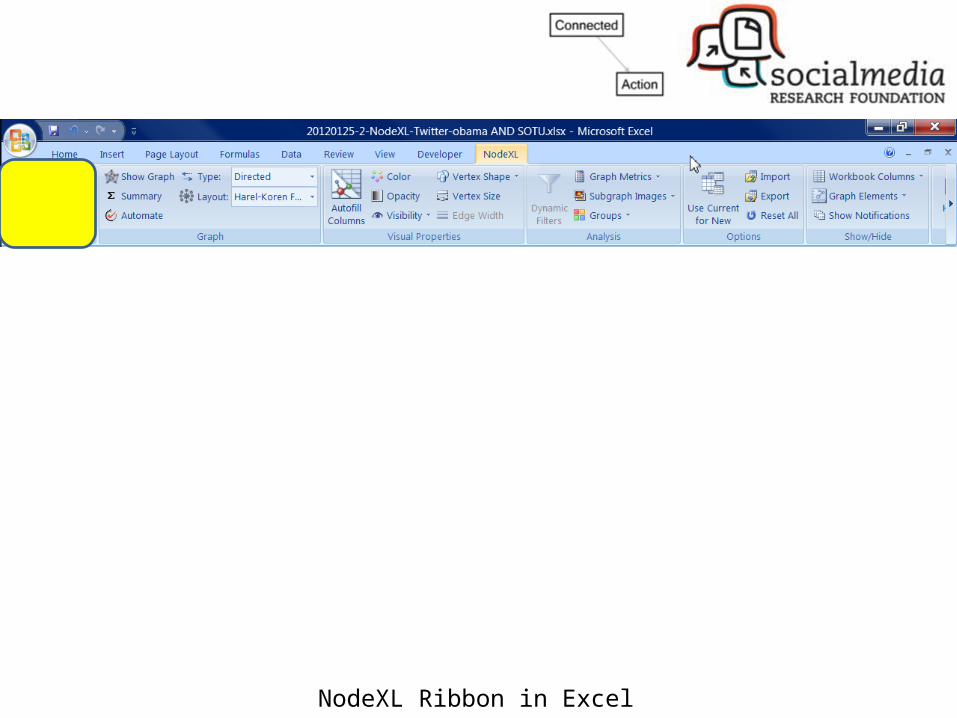
NodeXL Ribbon in Excel
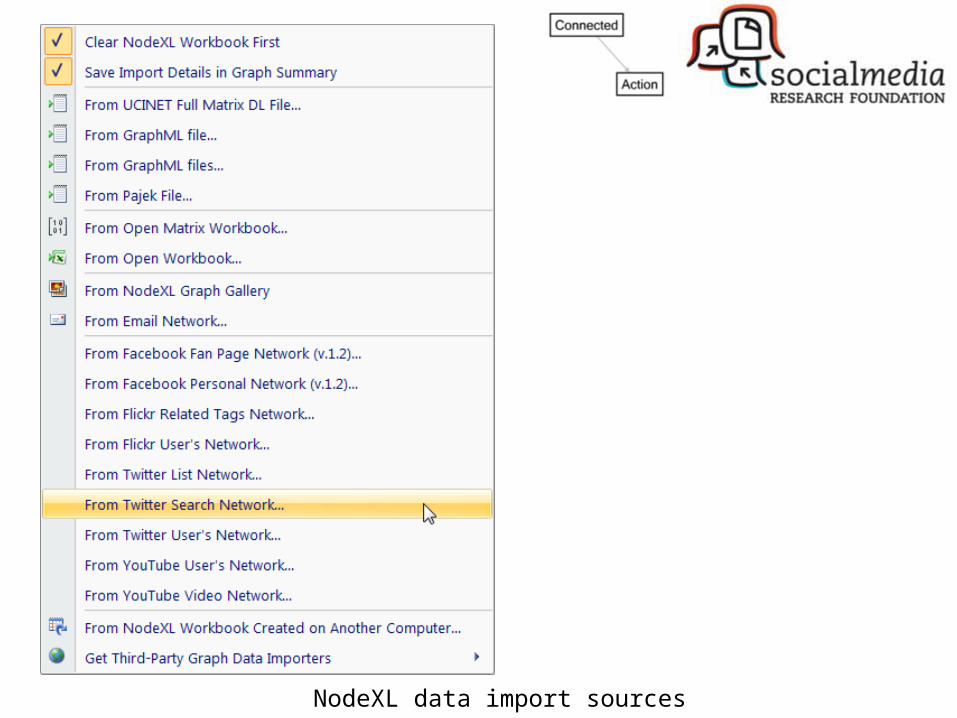
NodeXL data import sources
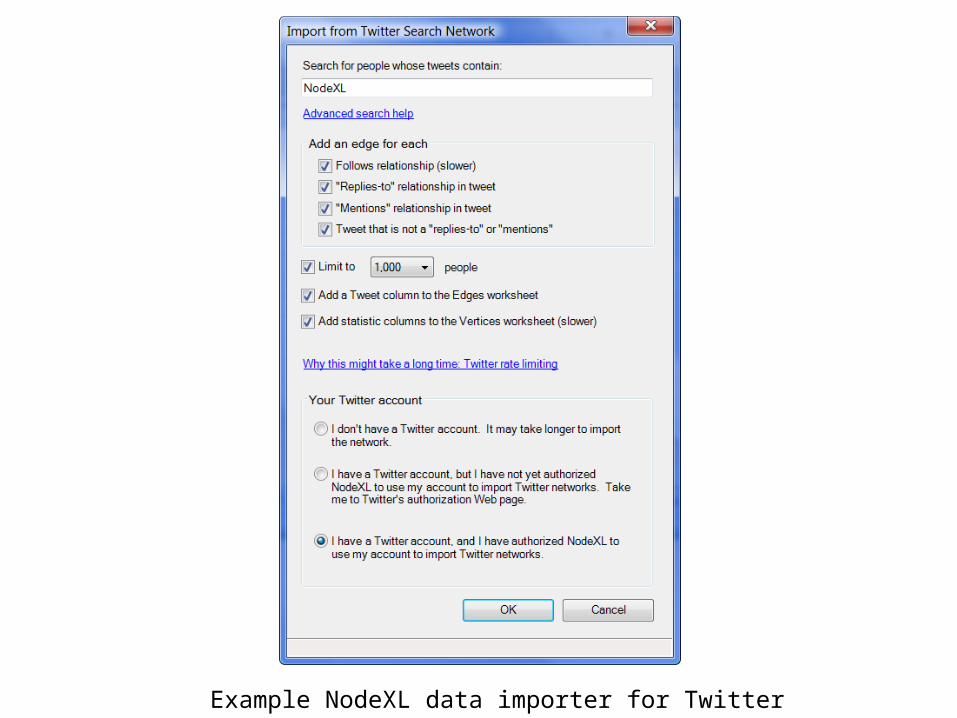
Example NodeXL data importer for Twitter
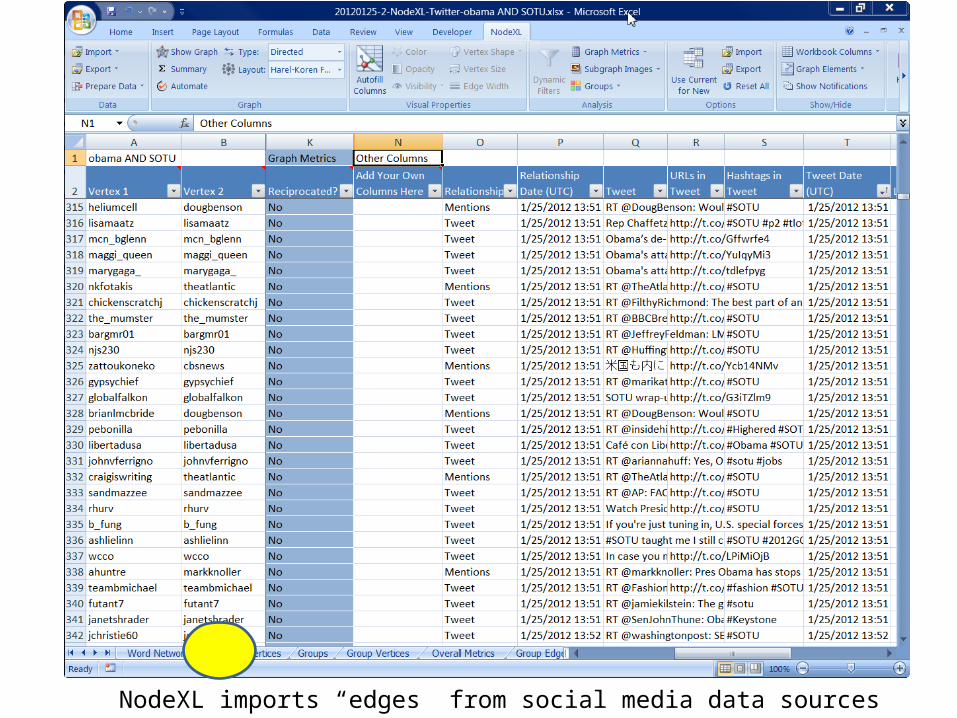
NodeXL imports “edges” from social media data sources
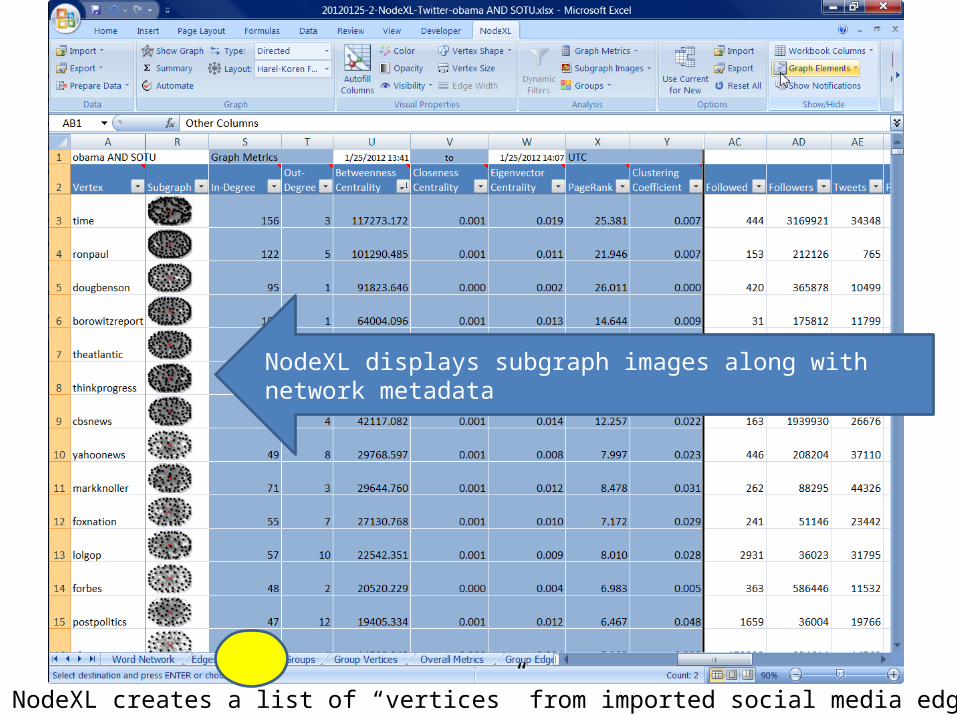
NodeXL creates a list of “vertices” from imported social media edges
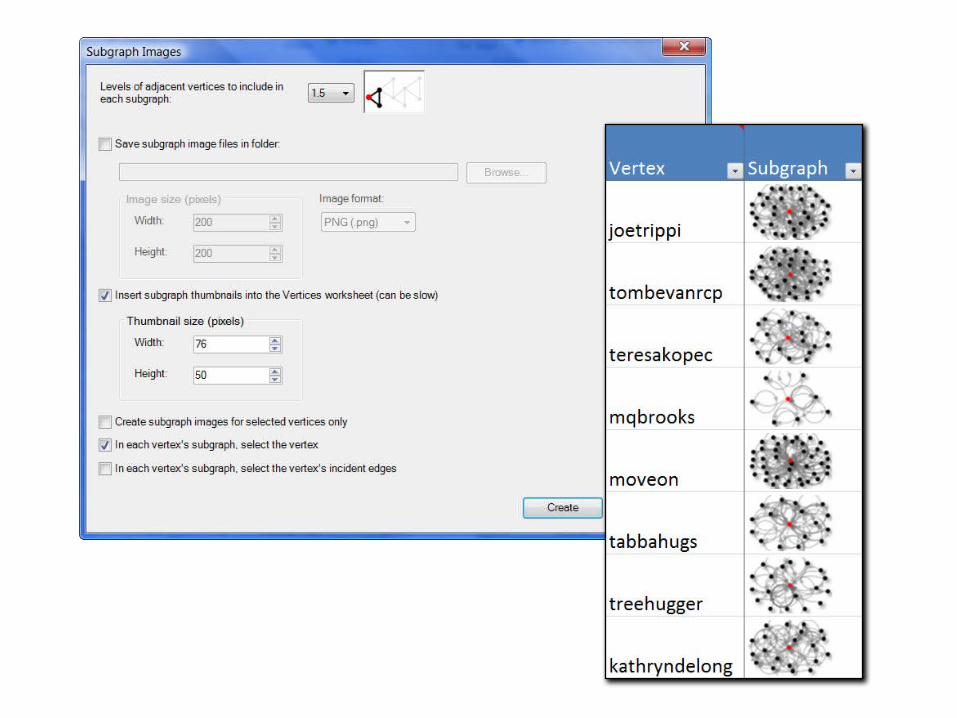
NodeXL displays subgraph images along with network metadata
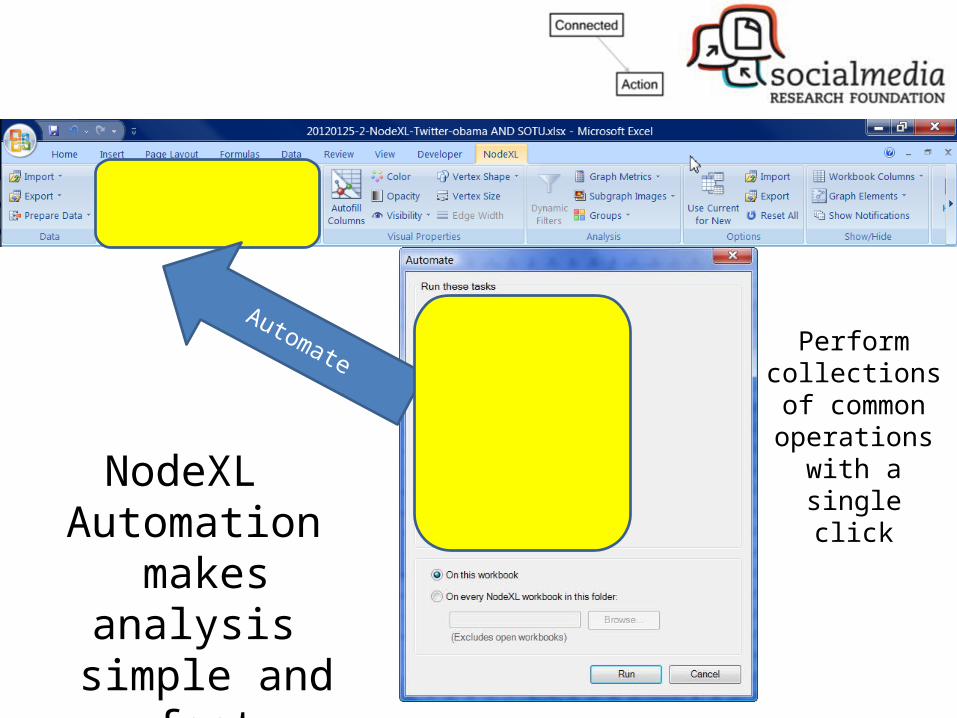
Automate
NodeXL Automation
makes analysis simple and fast
Perform collections of
common operations with
a single click
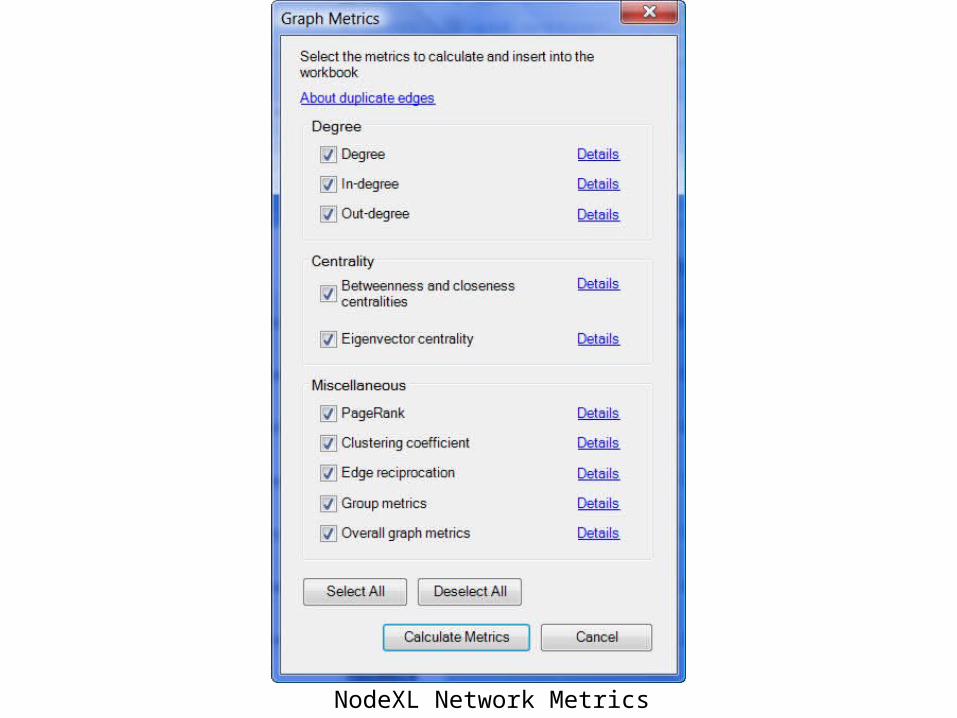
NodeXL Network Metrics
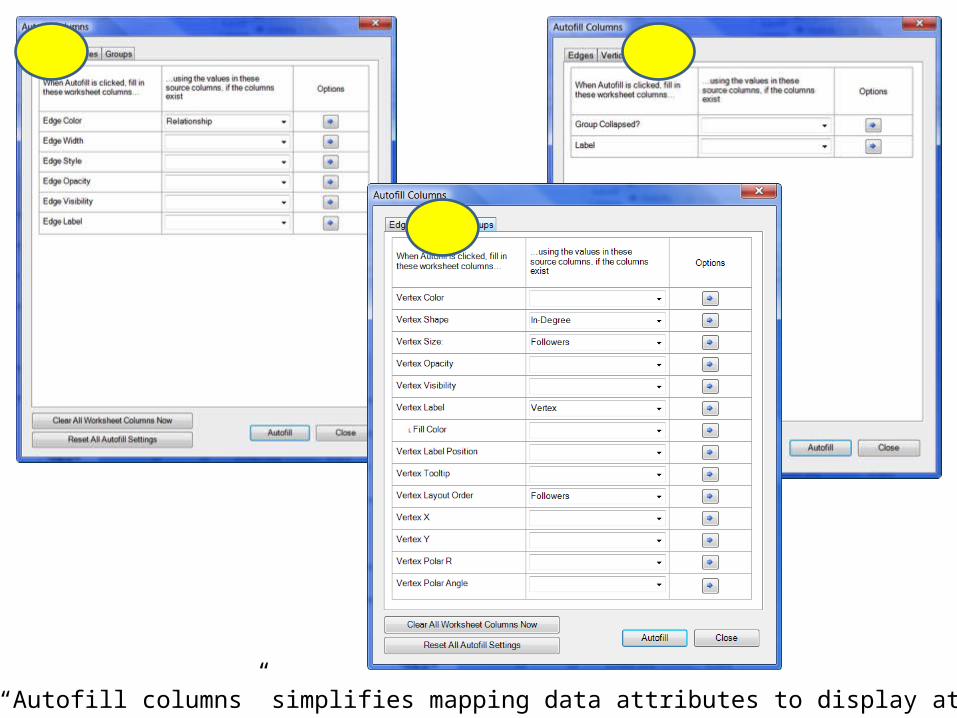
NodeXL “Autofill columns” simplifies mapping data attributes to display attributes
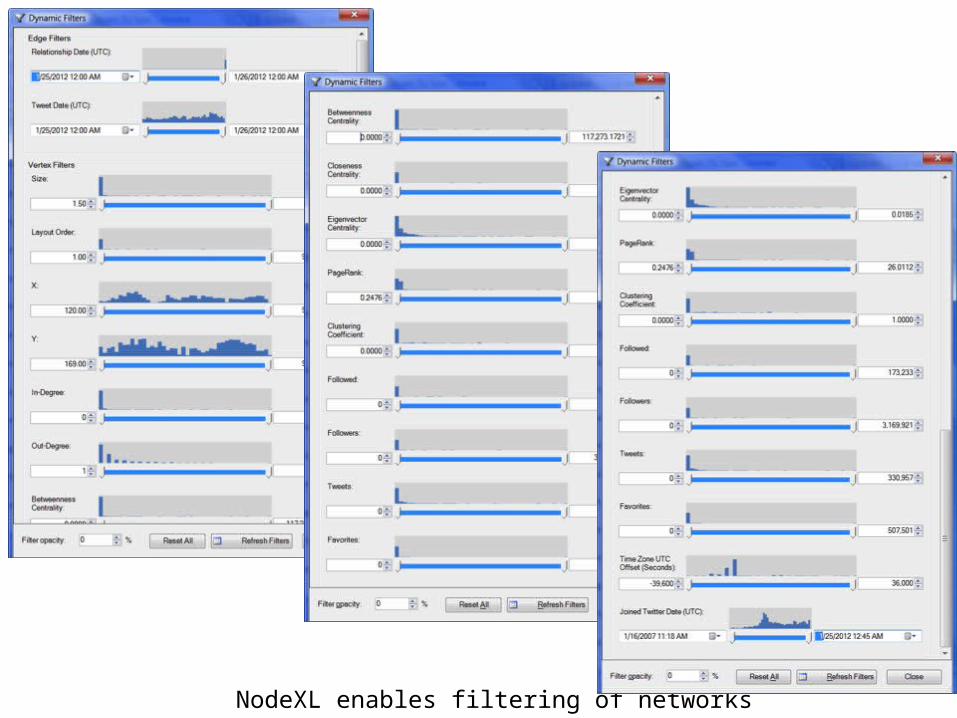
NodeXL enables filtering of networks
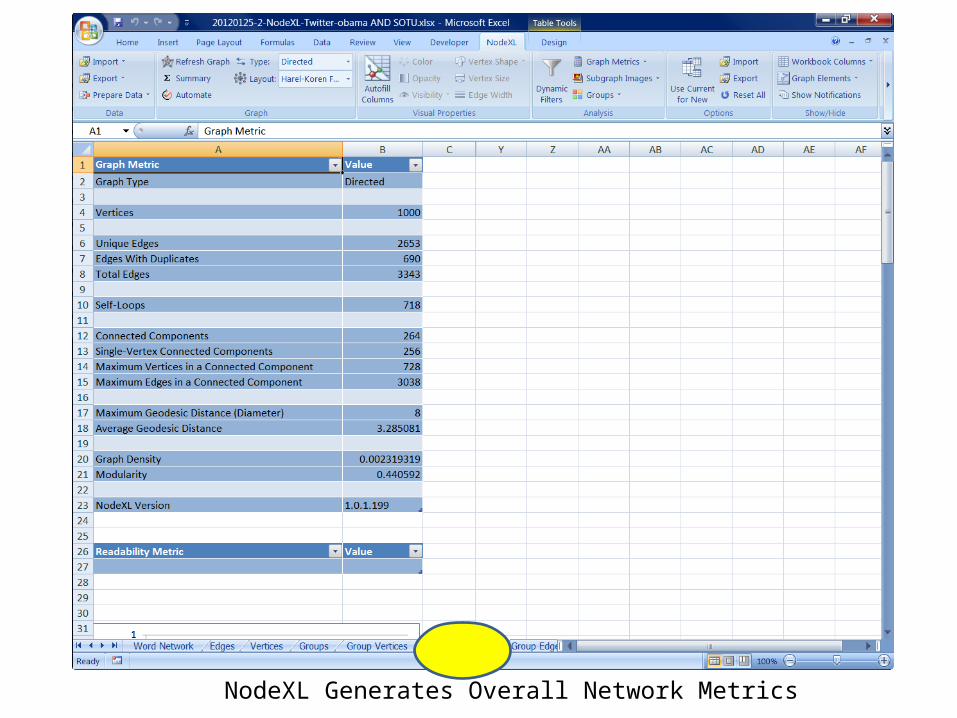
NodeXL Generates Overall Network Metrics
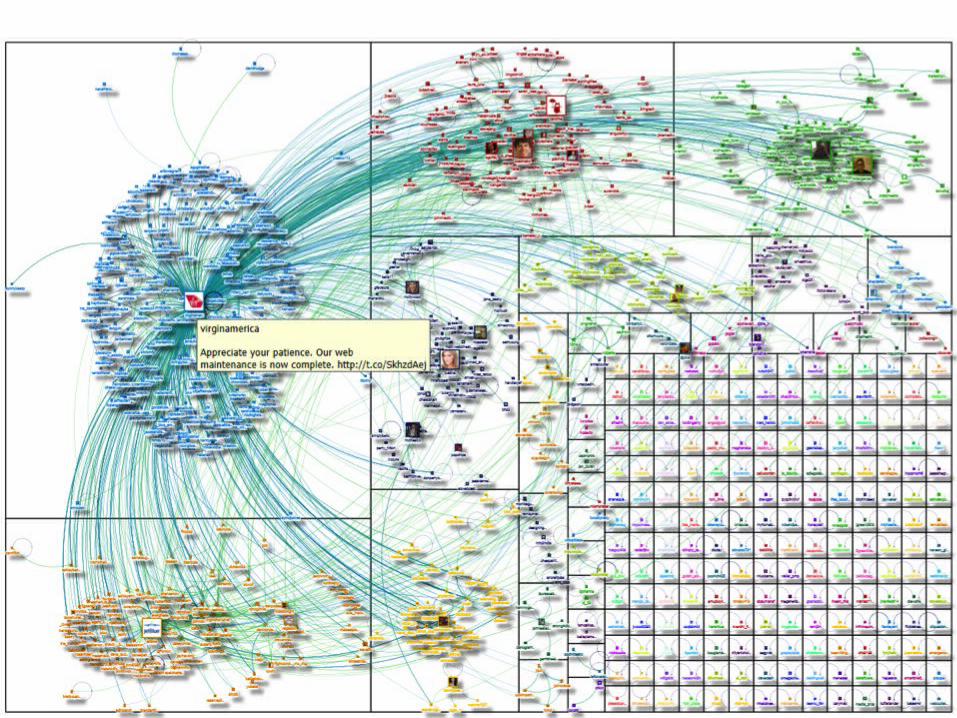
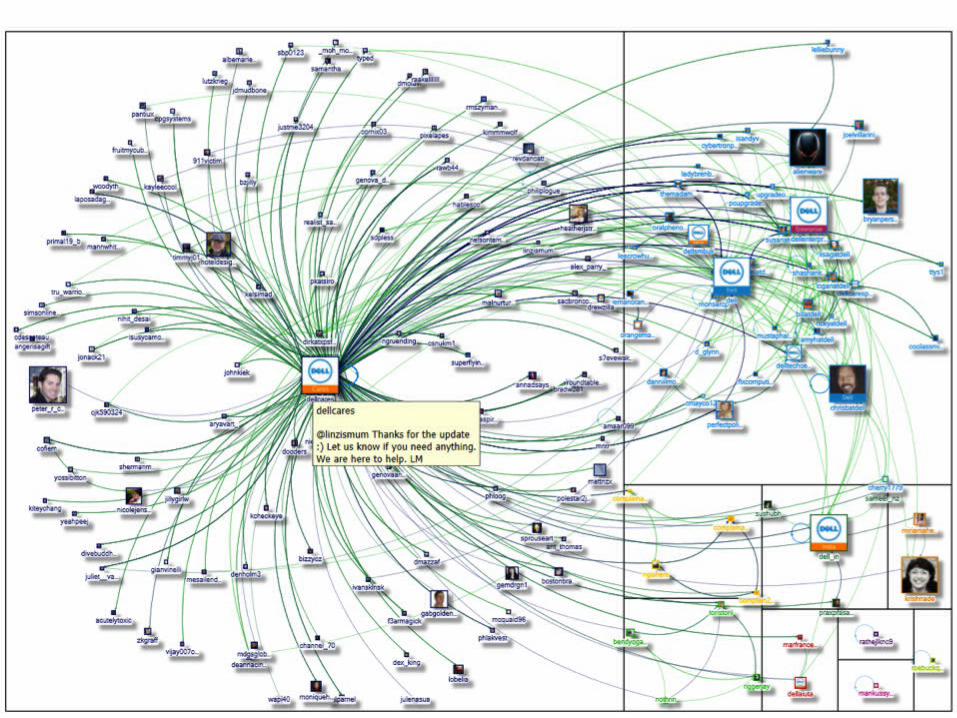
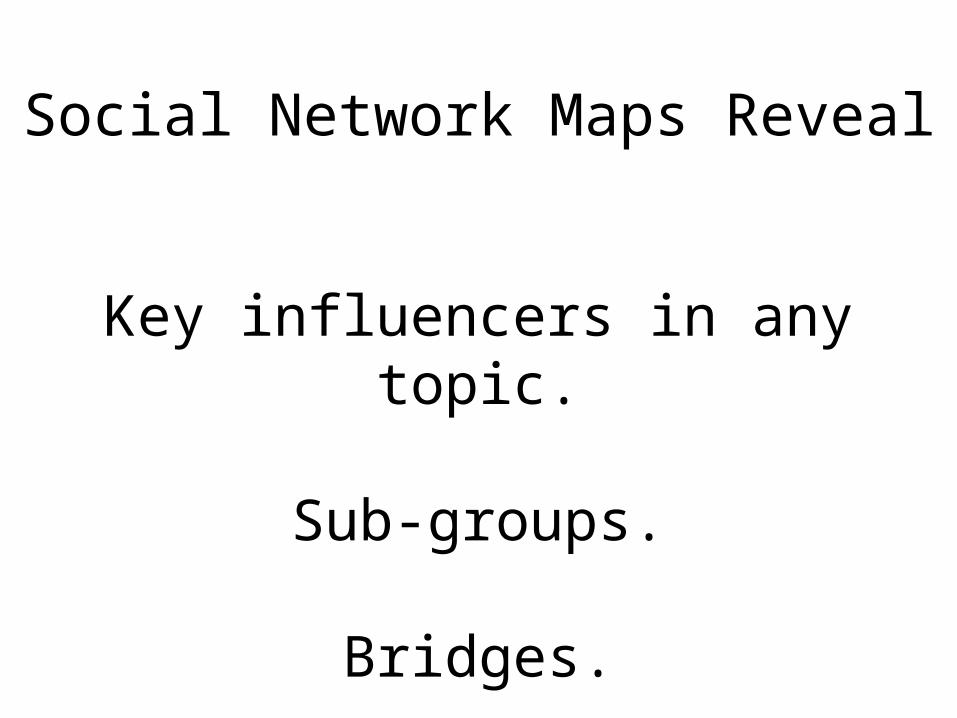
Social Network Maps Reveal
Key influencers in any topic.
Sub-groups.
Bridges.
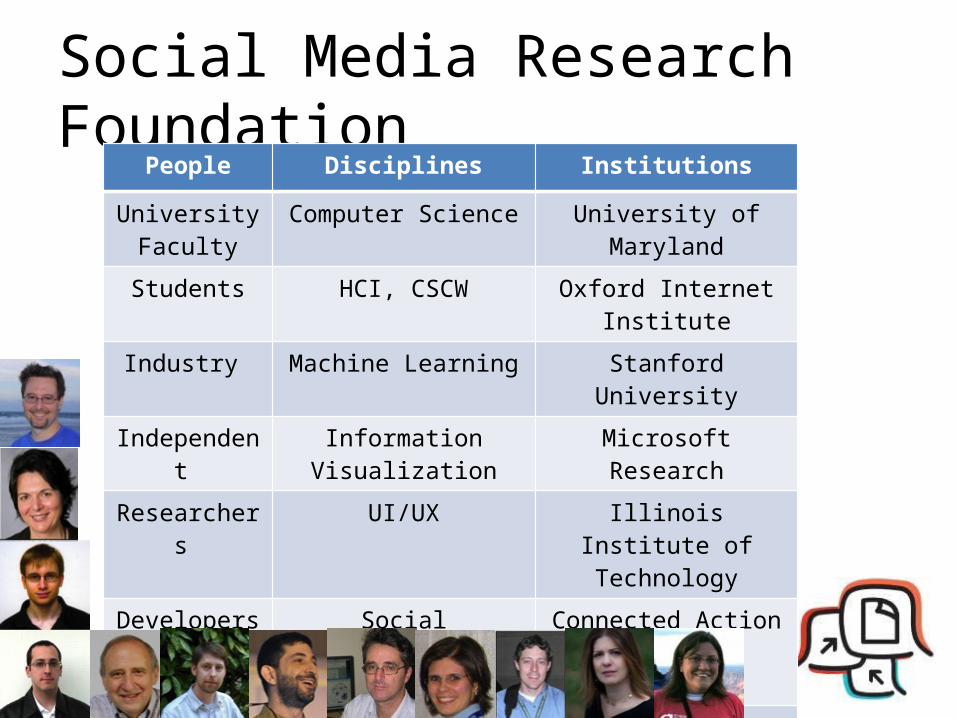
Social Media Research FoundationPeople Disciplines Institutions
University Faculty
Computer Science University of Maryland
Students HCI, CSCW Oxford Internet Institute
Industry Machine Learning Stanford University
Independent Information Visualization Microsoft Research
Researchers UI/UX Illinois Institute of Technology
Developers Social Science/Sociology Connected Action
Network Analysis Cornell
Collective Action Morningside Analytics
What we are trying to do:Open Tools, Open Data, Open Scholarship
• Build the “Firefox of GraphML” – open tools for collecting and visualizing social media data
• Connect users to network analysis – make network charts as easy as making a pie chart
• Connect researchers to social media data sources• Archive: Be the “Allen Very Large Telescope Array”
for Social Media data – coordinate and aggregate the results of many user’s data collection and analysis
• Create open access research papers & findings• Make “collections of connections” easy for users to
manage
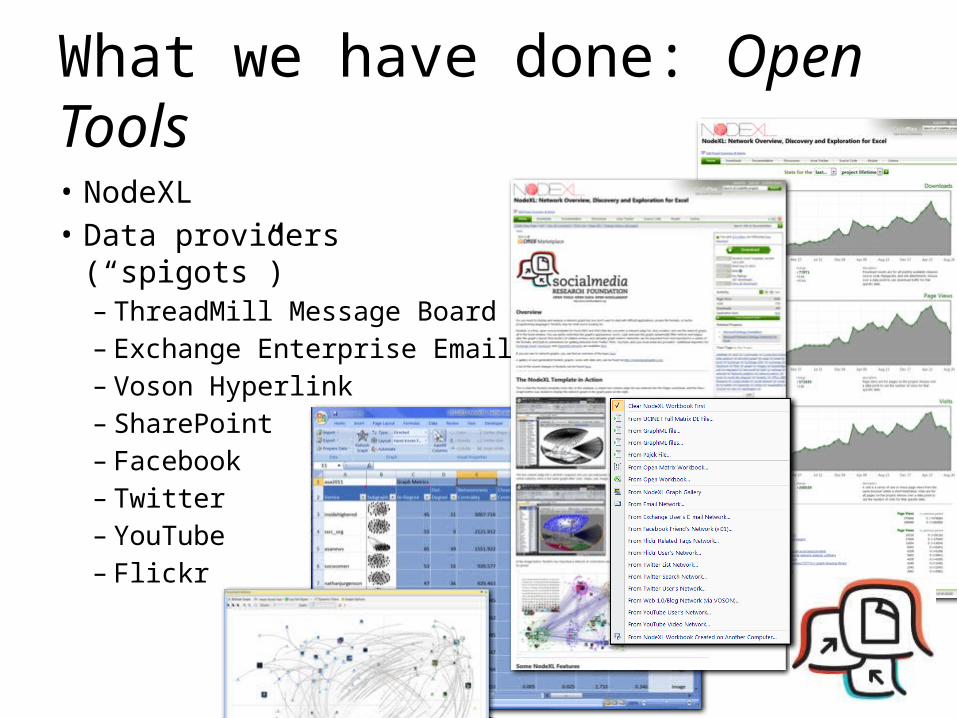
What we have done: Open Tools
• NodeXL• Data providers (“spigots”)
– ThreadMill Message Board– Exchange Enterprise Email– Voson Hyperlink– SharePoint– Facebook– Twitter– YouTube– Flickr
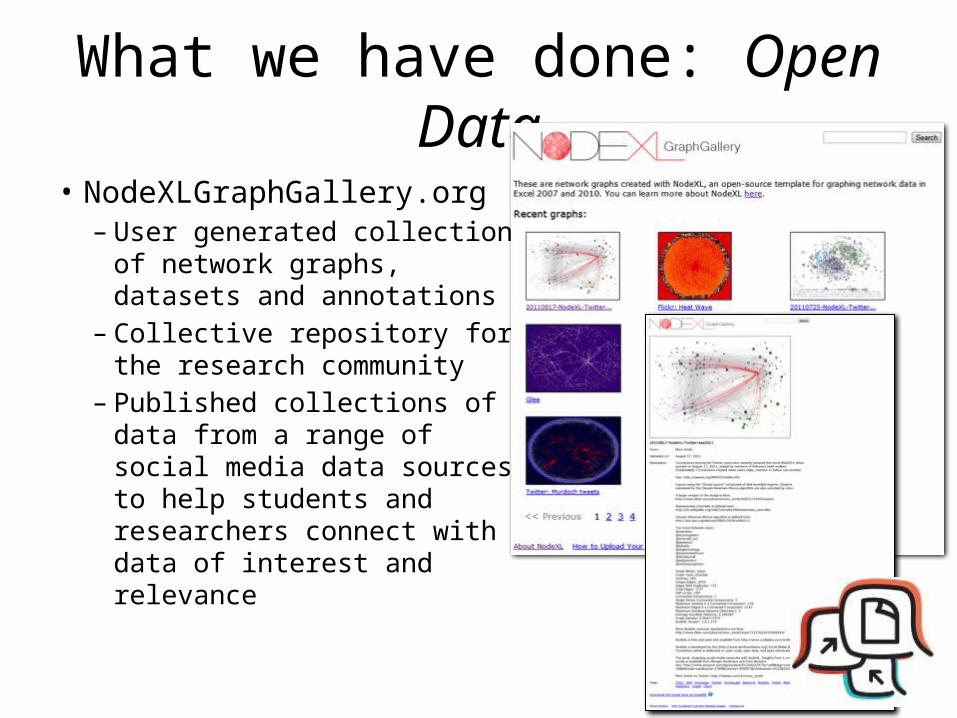
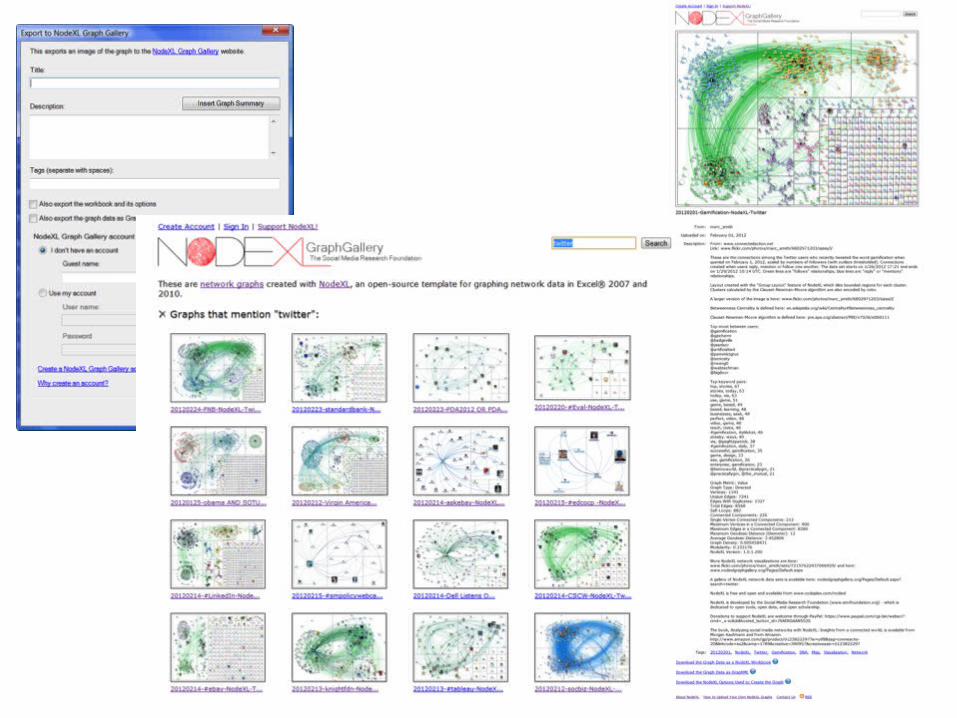
What we have done: Open Data
• NodeXLGraphGallery.org– User generated collection of
network graphs, datasets and annotations
– Collective repository for the research community
– Published collections of data from a range of social media data sources to help students and researchers connect with data of interest and relevance
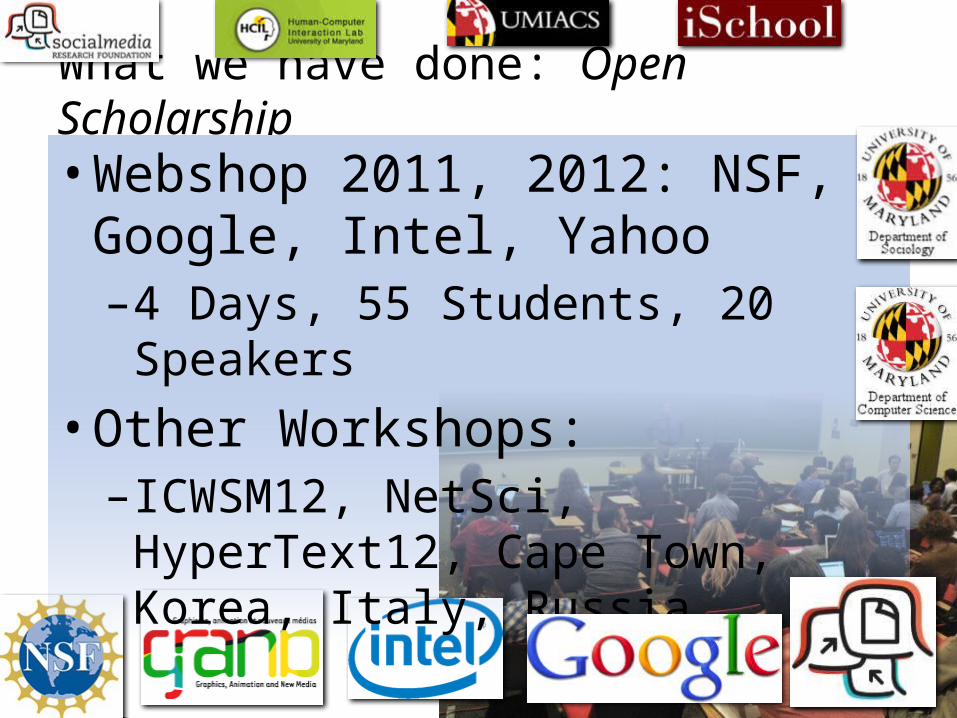
What we have done: Open Scholarship
• Webshop 2011, 2012: NSF, Google, Intel, Yahoo–4 Days, 55 Students, 20 Speakers
• Other Workshops: –ICWSM12, NetSci, HyperText12, Cape
Town, Korea, Italy, Russia
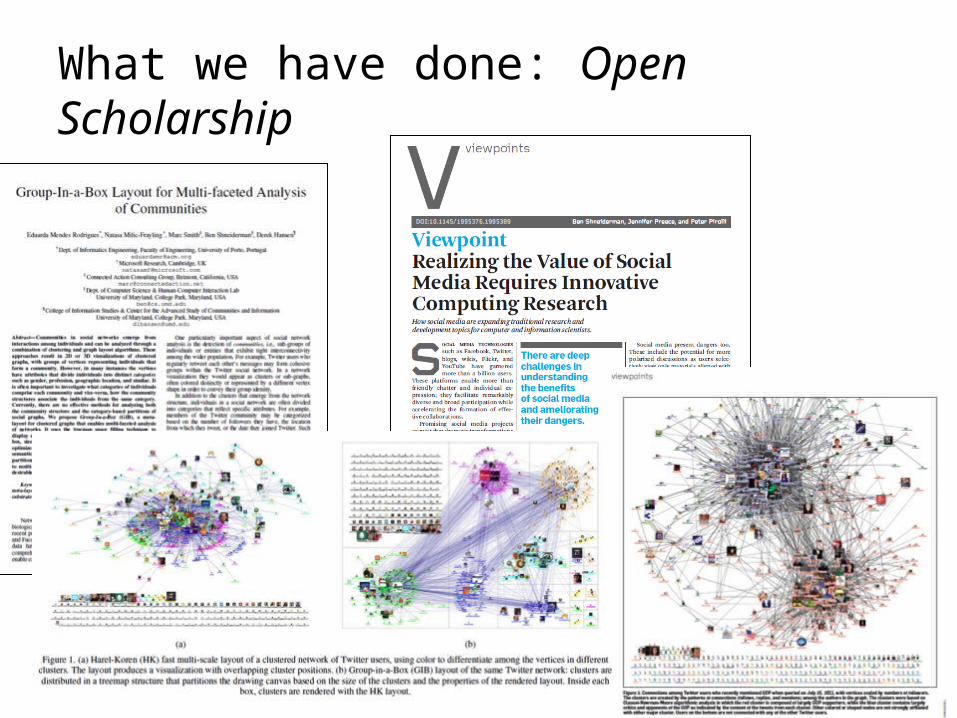
What we have done: Open Scholarship
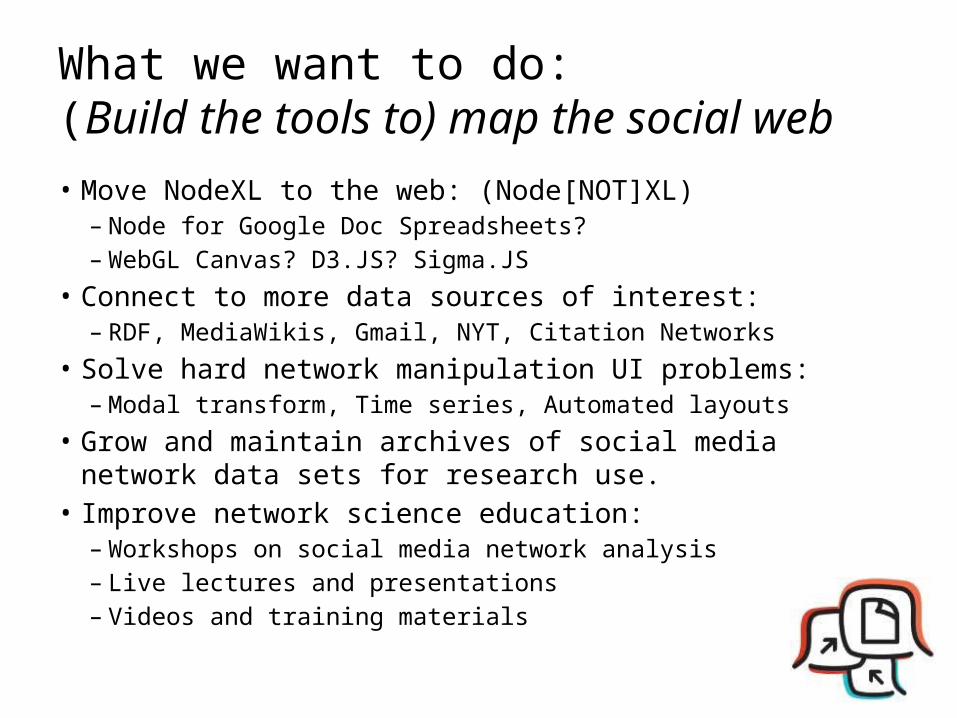
What we want to do: (Build the tools to) map the social web• Move NodeXL to the web: (Node[NOT]XL)
– Node for Google Doc Spreadsheets? – WebGL Canvas? D3.JS? Sigma.JS
• Connect to more data sources of interest:– RDF, MediaWikis, Gmail, NYT, Citation Networks
• Solve hard network manipulation UI problems:– Modal transform, Time series, Automated layouts
• Grow and maintain archives of social media network data sets for research use.
• Improve network science education:– Workshops on social media network analysis– Live lectures and presentations– Videos and training materials
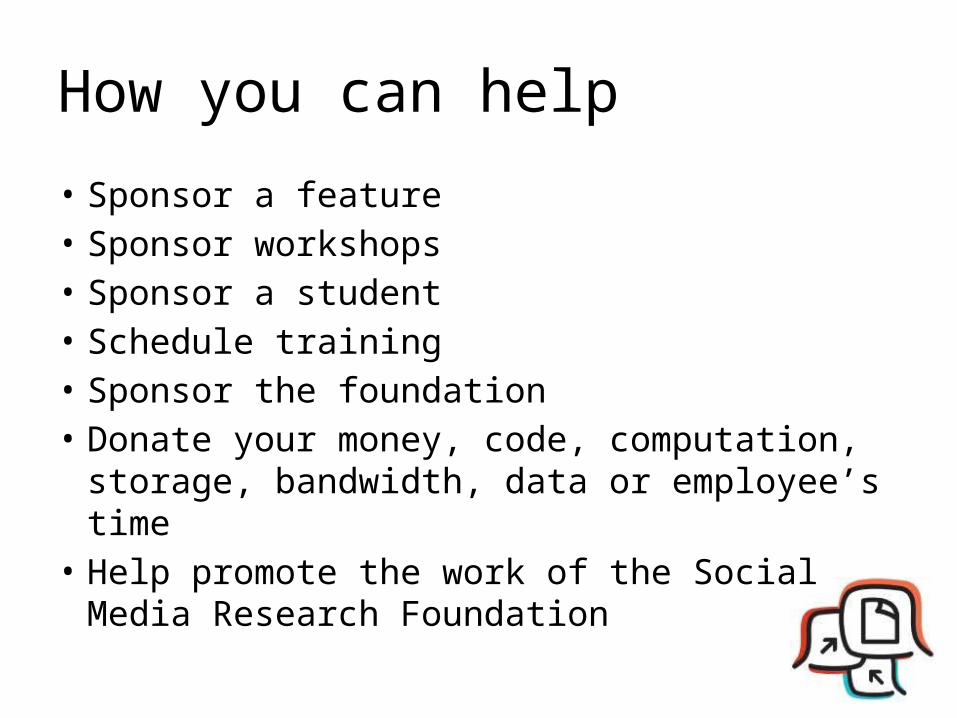
How you can help
• Sponsor a feature• Sponsor workshops• Sponsor a student• Schedule training• Sponsor the foundation• Donate your money, code, computation, storage,
bandwidth, data or employee’s time• Help promote the work of the Social Media
Research Foundation
Who is the mayor of your hashtag?
Find out at: http://netbadges.com
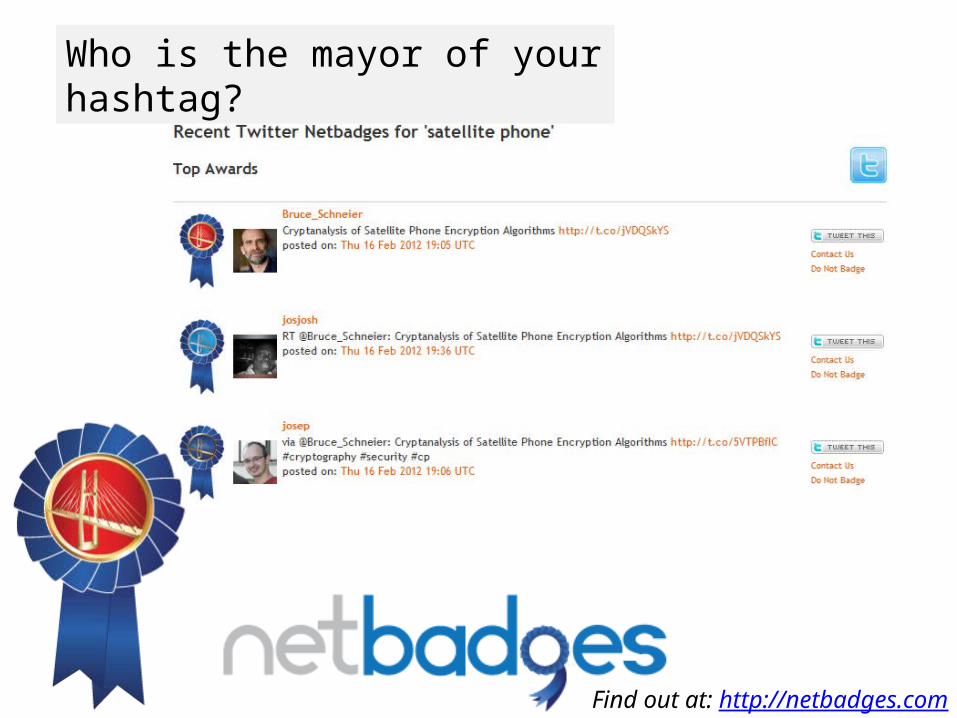
Who is the mayor of your hashtag?
Find out at: http://netbadges.com
http://netbadges.com
Who is the mayor of your hashtag?
Find out at: http://netbadges.com
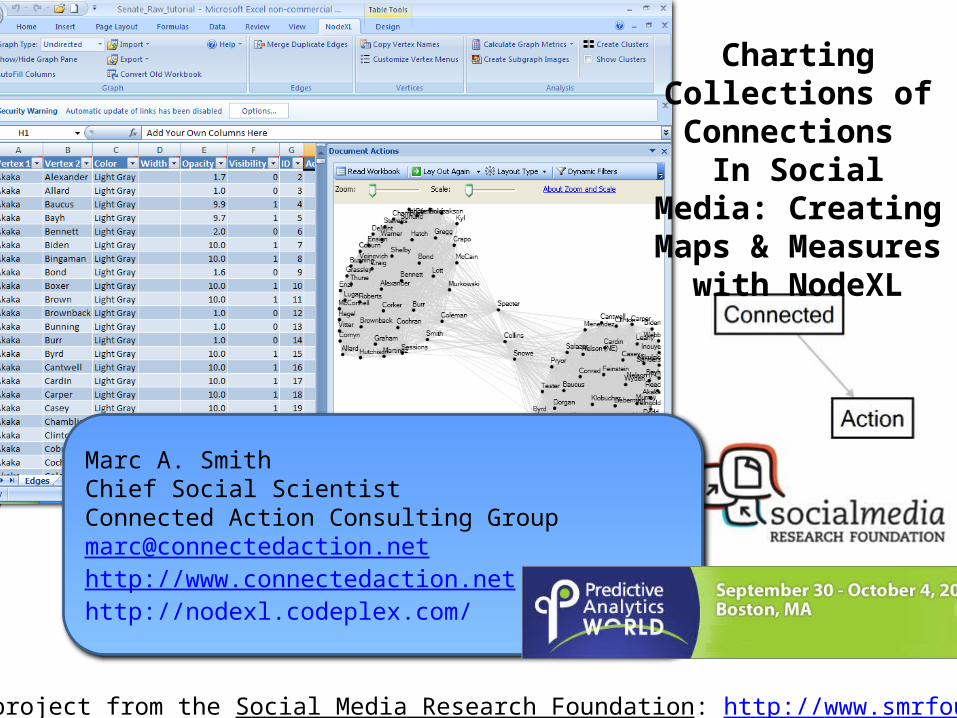
Marc A. SmithChief Social ScientistConnected Action Consulting [email protected]://www.connectedaction.nethttp://nodexl.codeplex.com/
A project from the Social Media Research Foundation: http://www.smrfoundation.org
Charting Collections of Connections
In Social Media: Creating Maps & Measures with
NodeXL