Embed Size (px)
Citation preview

CIO Perspectives: From Operations to the Executive Suite
Rich Razon
Co-Founder, PureShare, Inc.
1-415-656-9692

Agenda:
Metrics across an Organizational Hierarchy
CIO Tenets
CIO Interviews
Strategic Insights
Executive Briefings
CIO Perspectives: From Operations to the Executive Suite

CIO Perspectives: From Operations to the Executive Suite
Operations Executive Suite
Executive Briefings
Compound Metrics
Strategic Insights
Objectives:
Help bridge the info gap from operations to the executives
Get to know CIO metrics and reporting tenets
Know how to leverage metrics for messaging

CIO Tenet # 1
Transparency
Open access to performance measures
and targets that apply to all levels of the
organization.

Customers
VPs
Executives
Directors
Managers
Team Leaders
Staff
• Strategic Insights
• Executive Briefing
• External Focus
• Sound bites
• Highly Summarized
• Compound Metrics
• Logical Rollups
• Mobile
• Internally Focused
• Highly Detailed
• Operations-centric
• Real-time
• Multiple form factors
• Ad-hoc
Changing Metrics and Reporting Needs Across an Organizational Hierarchy

Metrics Support the Organization Design
Empower all levels of management
Teams focus on operations
Senior managers provide leadership, direction, and oversight
Executives concentrate on decisions that shape the company
Each level has a unique profile
Tailored and connected views
As you go higher in the organization, the scope of metrics expands and the need for
summarization increases

CIO Tenet # 2
Automation
Eliminate manual handling and consolidation
where possible to reduce errors and latency.
Automation builds trust and confidence!
.

Senior Executives
& Board
Partners
Customers
Team Leaders
Peers
Management
360 Degree Views: A Metrics Challenge

Heterogeneous Environments: Automation to derive metrics
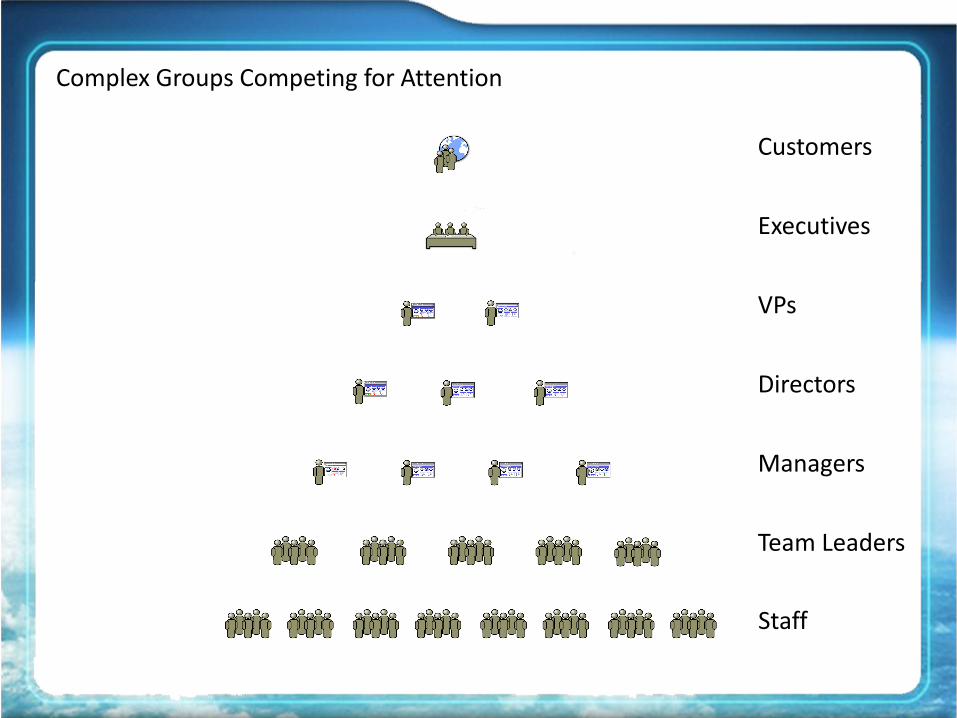
Complex Groups Competing for Attention
Customers
VPs
Executives
Directors
Managers
Team Leaders
Staff

Disparate Tools Within Each Group:
Customers
VPs
Executives
Directors
Managers
Team Leaders
Staff

CIO Tenet # 3
Clarity
• Who is it for?
• What does it mean?
• Why is it important?
.

External Business
Internal Business
IT
Operations Projects Innovation
Madeline Weiss, SIM APC
IT Operations Performance
IT Project Performance
Technical Innovation
Internal Business Process Metrics
Internal Business Improvement
Metrics
Internal Business Process
Innovation Metrics
Business Metrics
Business Metrics Improvements
Business Innovation
CIO Management Metrics:
Escalating the IT Value Conversation beyond IT

Pg 1 Baseline Time Period FY12 Average
Metric # Metric Ave FY11 Jul-11 Aug-11 Sep-11 Oct-11 Nov-11 Dec-11 Jan-12
Year to
Date How We Measure
(%)
Blue Chip Project Delivery: predictable performance - Ability to innovate: Where can we improve and create new value?
1a Percentage of in flight blue chip projects on
schedule 72% 73% 82% 91% 82%
Monthly project reports -
how are we doing
1b Percentage of in flight blue chip projects
within budget 87% 82% 91% 100% 91%
Monthly project reports -
how are we doing
Qualitative Feedback: It feels good to be our customer, use our services, and work within the Office of the CIO - How do our customers see us?
2a Voice of the Users- Annual CIO Poll 68.1% This is an annual random survey of users of the services. Baseline established from question "How satisfied are you with the overall service experience with services provided by the Offices of the CIO?" To be conducted in February -
March 2012 68.1%
Annual CIO poll sent out to
a random sample of all
users
2b Voice of the ERP Business Sponsors 42.7% Survey was conducted in August-September, 2011. Returns are being analyzed. 42.7% Positive responses over
total responses
2c Voice of the Employee 61.5% Question "Overall, how satisfied are you at being an employee ?" Survey to be conducted with staff after FY11 year
end reviews. 61.5%
Positive responses over
total responses
2d Voice of the service desk users (incidents &
service requests)* Mean=4.66
(92.3%)
Mean=4.70 (93.3%)
Mean=4.63 (91.3%)
Mean=4.62 (91.2%)
Mean=4.65
(91.9%)
Transaction surveys of our
incident and request
fulfillment processes
Sample Manually Prepared CIO Scorecard

Automated IT Scorecard, with best-practice visualization

Sample Scorecard Drilldown to Details

Executive Video Wall Example

CIO Tenet # 4
Context
• Must answer the question: ‘So What?’ .
How to deliver messages with context?
Focus on “Strategic Insights”

Key metrics that develop penetrating understanding
Must be valuable to the user, worthy of attention
“a bite-sized chunk of knowledge” for rapid review
Types include any combination of:
Inform – Educate, provide context and/or talking points
Awareness – Make aware of current status, recent events
Progress – Show trending vs. baselines
Results – Metrics showing results vs. targets & objectives
Anticipate – Leading indicators, contributing factors
What is a Strategic Insight?

What does a Strategic Insight look like?
Display as single row
Easily consumable
No mental calculations
Will be stacked in a list
Must answer
‘So What?’

Example Executive Dashboard (Global View)


Teams
Senior Leaders
Middle Mgmt
Strategic Insights
Connecting the Business to Strategic Insights
Mgmt Tools
Summary Rollups
Briefing Notes
Execs
Exec Briefing
Briefing Notes
The Business
Operations Dashboards and
Reports

Metrics Hub facilitates new Strategic Insights
New insights from combining metrics
Added areas make framework richer
Internal Core Areas
Other Internal Supporting
Areas
Industry
Benchmarks Execs Strategic Insights
Layer other areas Marketing, Sales,
Finance, HR, etc.
Intertwine results with the business
Industry metrics as baseline comparison
Market share, cust sat, profitability, efficiency, etc.

Top Executive Baselines for Compound Metrics
Financials
Revenue, Cost, Profit, Investment metrics
People and Organizations
Staff, Competency, Compliance, Customers
Infrastructure
Assets, Network devices, ports, bandwidth
Company Output or Activity
Transactions, Production Volumes
Sales and Marketing / Industry
Pipeline, market share, industry benchmarks

CIO Tenet # 5
Continual Improvement
Not a project with a finite end- metrics management must
continue to evolve as long as the business continues to evolve
.

Systematic Approach towards Deploying Executive Metrics
Deliver immediate value, constantly improve
Build metrics catalog, add/refine metrics Ultimate goal: strategic insights gained from combining metrics
Get everyone ‘on the same page’
Keep adding automated links to more data sources Automation builds trust and confidence in the measures and their ready
availability.
Rollout views in web-based framework Make results readily accessible
Adoption is success

Transparency
Open access to performance measures that apply to all organizational levels, top-to-bottom.
Automation
Eliminate manual handling and consolidation where possible to reduce errors and report latency. Automation builds trust and confidence.
Clarity
Unambiguous as to what metrics are, what they mean, who they are for and why they are important.
Context
Answers the question ‘So what?’
Continual Improvement
Metrics and performance management is not a ‘project’ with a finite end. It is a process that will continue as the business evolves.
5 Core CIO Tenets:

For Additional Info, please contact:
Rich Razon
Co-Founder, PureShare, Inc.
1-415-656-9692