Embed Size (px)
Citation preview

Royal Government of Cambodia National Committee for Sub-National Democratic Development
Commune/Sangkat Fund Technical Manual
Volume IStudy and Design Guidelines
2009

VOLUME I:STUDY AND DESIGN GUIDELINES


I-i
CONTENTS
PREFACE ...................................................................................................................... iv�
List of Abbreviations ..................................................................................................... v�
PART 1: INTRODUCTION .............................................................................................. 1�
1� Introduction ......................................................................................................... 2�1.1� Preamble .......................................................................................................................... 2�1.2� Commune/Sangkat Fund Technical Manual ................................................................. 2�1.3� Scope of Technical Manual ............................................................................................ 4�1.4� Contents of Technical Manual ....................................................................................... 4�
PART 2: TECHNICAL FORMS ....................................................................................... 6�
2� Technical Forms ................................................................................................. 7�2.1� Introduction ..................................................................................................................... 7�2.2� Technical Forms are Mandatory .................................................................................... 8�2.3� Differences between Technical Forms ......................................................................... 8�2.4� Getting Design Guidance ............................................................................................... 8�2.5� Example Technical Forms .............................................................................................. 8�2.6� Transportation Infrastructure, Group Output Code 1010000 ...................................... 8�2.6.1� Form T11 Transport: Roads ........................................................................................... 9�2.6.2� Form T12 Transport: Structures .................................................................................. 17�2.7� Irrigation System, Group Output Code 1020000 ........................................................ 23�2.7.1� Form T21 Irrigation: Project ......................................................................................... 23�2.7.2� Form T22 Irrigation: Earthwork ................................................................................... 33�2.7.3� Form T23 Irrigation: Structure ..................................................................................... 43�2.8� Water Supply, Group Output Code 1030000 .............................................................. 51�2.8.1� Form T31 Water Supply ................................................................................................ 51�2.9� Education Facility, Group Output Code 1040000 ....................................................... 62�2.9.1� Form T41 Education Facility ........................................................................................ 62�2.10� Health, Group Output Code 1050000 .......................................................................... 70�2.10.1� Form T51 Health ........................................................................................................ 70�2.11� Sanitation, Group Output Code 1100000 .................................................................... 77�2.11.1� Form T101 Sanitation ............................................................................................... 77�
PART 3: TEMPLATE DESIGNS FOR LOCAL INFRASTRUCTURE ........................... 86�
3� Template Designs for Local Infrastructure ..................................................... 87�3.1� Background ................................................................................................................... 87�3.2� NCDD Templates ........................................................................................................... 87�3.3� Available Templates ..................................................................................................... 87�3.4� How to Read and Use the Drawings ............................................................................ 87�
I-ii
3.4.1� Size ................................................................................................................................. 87�3.4.2� Drawing scales .............................................................................................................. 88�3.4.3� Dimensions ................................................................................................................... 88�3.4.4� Revisions ....................................................................................................................... 88�3.4.5� Variable dimensions ..................................................................................................... 88�3.4.6� How to read the steel details and the steel schedule ................................................ 88�3.5� AutoCAD Standards ..................................................................................................... 89�3.5.1� AutoCAD Version .......................................................................................................... 90�3.5.2� General settings ............................................................................................................ 90�3.5.3� AutoCAD file name ....................................................................................................... 90�3.5.4� Drawing number ........................................................................................................... 90�3.5.5� Paper size ...................................................................................................................... 91�3.5.6� Pen assignment for plotting ........................................................................................ 91�3.5.7� Layer definition ............................................................................................................. 91�3.5.8� Text style and fonts ...................................................................................................... 92�3.5.9� Line types / widths ........................................................................................................ 93�3.5.10� Hatch .......................................................................................................................... 93�3.5.11� Dimensions................................................................................................................ 93�3.5.12� Blocks ........................................................................................................................ 94�3.5.13� External references (x-ref) ....................................................................................... 94�3.5.14� Viewports ................................................................................................................... 94�3.5.15� Plotting....................................................................................................................... 94�
PART 4: MATERIALS, QUANTITIES AND COSTS .................................................... 95�
4� Materials, Quantities & Costs .......................................................................... 96�4.1� Project Cost Estimation ............................................................................................... 96�4.2� Tables of Quantities and Labor Costs ........................................................................ 96�4.3� Net Quantities ............................................................................................................... 96�4.4� Cost Estimation Using the Project Generator ............................................................ 97�
PART 5: STUDY AND DESIGN GUIDELINES ........................................................... 109�
5� Study and Design Guidelines ........................................................................ 110�5.1� Introduction ................................................................................................................. 110�5.1.1� Limitations ................................................................................................................... 110�5.1.2� Using the design guidance ........................................................................................ 110�5.2� Transport Infrastructure: Group 101 ......................................................................... 111�5.2.1� Sub-Group 10101 and 10102: Roads: Form T11 ...................................................... 111�5.2.2� Sub-Group 10103 to 10108: Road Structures: Form T12 ........................................ 117�5.3� Irrigation System: Group 102 .................................................................................... 131�5.3.1� Irrigation Project: Form T21 ....................................................................................... 131�5.3.2� Irrigation Earthwork: Form T22 ................................................................................. 134�5.3.3� Irrigation structure: Form T23 ................................................................................... 139�5.4� Water Supply: Group 103 ........................................................................................... 140�5.5� Education Facilities: Group 104 ................................................................................ 148�5.6� Health Facilities: Group 105 ...................................................................................... 149�5.7� Market Construction: Group 106 ............................................................................... 150�5.8� Crop Storage and Processing: Group 107 ............................................................... 150�5.9� Social Infrastructure: Group 108 ............................................................................... 150�
I-iii
5.10� Energy: Group 109 ...................................................................................................... 150�5.11� Sanitation: Group 110 ................................................................................................. 150�5.11.1� Latrines .................................................................................................................... 151�5.11.2� Waste water and solid waste ................................................................................. 151�5.11.3� Drainage ................................................................................................................... 151�5.12� Flood Protection Structures: Group 111 .................................................................. 153�
ANNEX 1: TECHNICAL FORMS ................................................................................ 154�Technical Form T11 – Transport: Roads .............................................................................. 155�Technical Form T12 – Transport: Structures ....................................................................... 159�Technical Form T21 – Irrigation: Project .............................................................................. 163�Technical Form T22 – Irrigation: Earthwork ......................................................................... 167�Technical Form T23 – Irrigation: Structure .......................................................................... 172�Technical Form T31 – Water Supply ..................................................................................... 175�Technical Form T41 – Education Facility ............................................................................. 179�Technical Form T51 – Health ................................................................................................. 181�Technical Form T101 – Sanitation ......................................................................................... 183�
I-iv
PREFACE This book is the first volume of Commune Sangkat Fund Technical Manual produced by the
National Committee for Sub-National Democratic Development (NCDD) with the help of the
Ministry of Rural Development (MRD), the Ministry of Water Resources and Meteorology
(MoWRAM), and others. Commune Sangkat Fund Technical Manual consists of 7 parts which
are divided into 3 volumes as the followings:
� Volume I : Study and Design Guidelines
� Volume II : Specifications for Construction Materials and Works
� Volume III : Contract Supervision
This first volume states mainly the study and design guidelines for the implementation of small-
scale infrastructure projects financed by Commune Sangkat Fund. It comprises 5 parts among 7
parts of Commune Sangkat technical manual as the followings:
� Part 1 : Introduction
� Part 2 : Technical Forms
� Part 3 : Template Designs for Local Infrastructure
� Part 4 : Materials, Quantities and Costs
� Part 5 : Study and Design Guidelines
For part 6 which instructs on specifications for construction materials and works is in Volume II;
while the final part- part 7 is in volume III which explains about contract supervion by the use of
Construction Check Lists.

I-v
List of Abbreviations
ADT Average Daily TrafficApplet A spreadsheet to calculate Design flow and structure size AASHTO American Association for State Highway and Transportation OfficialBOQ Bill of FQuantity CBR California Bearing RatioCSO Civil Society Organization C/S Commune/Sangkat CIP Community Investment Program DFT District Facilitation Team DCP Dynamic Cone Penetration Test DoLA Department of Local Administration DBST Double Bituminous Surface TreatmentEA Environmental Assessment EIA Environmental Impact Assessment EMP Environmental Management Plan ExCom Executive Committee FWUC Farmer Water User CommitteeGPS Global Positioning System GTFM Generalised Tropical Flood ModelHFWL High Flood Water LevelIO International OrganizationLAU Local Administration UnitNGO Non-Governmental Organization MEF Ministry of Economy and Finance M&E Monitoring and Evaluation MoI Ministry of Interior MRD Ministry of Rural Development NCDD National Committee for Sub-National Democratic Development O&M Operation & MaintenancePBC Planning and Budgeting Committee PCU Passenger Car Unit PFT Provincial Facilitation Team PIM Project Implementation Manual PMC Project Management Committee PRDC Provincial Rural Development Committee PSDD Project Support for Decentralization and Deconcentration PDoWRAM Provincial Department of Water Resource and Meteorology SBST Single Bituminous Surface TreatmentST 1 Sub-Tertiary 1 ST 2 Sub-Tertiary 2 ST 3 Sub-Tertiary 3 T TertiaryTSO Technical Support OfficerTSU Technical Support UnitTRRL Transport Road Research Laboratory (DCP Model)


I-1
PART 1: INTRODUCTION

Part 1: Introduction
Study and Design Guidelines I-2
1 Introduction
1.1 Preamble The principal and first order document for implementation of projects under the Commune/Sangkat Fund (C/S Fund) is the C/S Fund Project Implementation Manual (PIM).
The C/S Fund Technical Manual (this document) is a second order document dealing only with technical aspects of C/S Fund infrastructure projects and particularly the interface with the C/S Fund Project Generator software developed for infrastructure projects. C/S Fund service projects are not dealt with by the Technical Manual.
If there is a conflict between the C/S Technical Manual/Project Generator and the PIM then the PIM takes precedence.
1.2 Commune/Sangkat Fund Technical Manual The C/S Fund Technical Manual is for the design and construction of small-scale infrastructure projects financed by the Fund. The Technical Manual is used with an interactive software package called the C/S Fund Project Generator.
It has been produced by the National Committee for Sub-National Democratic Development (NCDD) with the help of the Ministry of Rural Development (MRD), the Ministry of Water Resources and Meteorology (MoWRAM), and others.
It originated as the Seila Technical Manual and the accompanying interactive software package called the Seila Template Program developed between 2001 – 2006. The Seila material and procedures were used and evolved over several years with some success and were taken over by NCDD. The many strong features of the approach were recognized but there were some problems also. In particular the Template designs and program were somewhat inflexible and it was difficult to update or add new designs. Also the many forms and procedures required by the Project Implementation Manual (PIM) although they provided a strong system in themselves were demanding on time and resources in the provinces; and had to be completed within a very short time window in the annual project cycle. Consequently many of the forms were often incomplete and seldom properly checked prior to approval. In addition the construction supervision was inadequate with the result that it was common for infrastructure works to be of poor quality and not completed to the full dimensions.
The new manual differs in several ways:
� The core ‘template program’ function has been retained but rewritten on a flexible software platform; it incorporates standard design drawings (prepared in AutoCAD but saved and accessed in PDF format) linked to spreadsheets which calculate quantities and costs according to variable dimensions.
� The concept of checklist-type feasibility study PIM forms from the Seila Template process have been upgrade to interactive ‘Technical Forms’ built into the Project Generator software in combination with the Template program component. Hence the forms call in the outputs of the template program automatically by use of links and dropdown menus allowing rapid and quality assured assembly of a project portfolio.
� The new technical forms in “ project generator ” provide design guidance where technical design is required. The user must answer simple questions by either filling data or choosing answer from multiple choice answers.In some technical forms, advice on type and dimensions of infrastructure will be provided in order to choose project output. To obtain the advice, you need to do some calculation by using several small Excel programs called “Applet”. The programs are interactive, the user can change some design requirements, or in some cases vary the design criteria used, until an acceptable design is produced. The user can choose the final design choice which can be less than recommended if there is good reason.

Part 1: Introduction
Study and Design Guidelines I-3
� For construction supervision the Technical Guidelines incorporate an updated and expanded version of construction checklist forms developed by MRD.
� The Project Generator can be expanded to cover other requirements of the PIM.
This Technical Manual is distributed to all Provincial Departments of Rural Development (PDRD), and to contractors working on C/S Fund infrastructure projects. It is also available to other organisations working in rural infrastructure.
The C/S Fund Technical Manual is primarily intended as a resource to be used in design of infrastructure projects of the Commune and Sangkat Councils. Most of the projects are small and simple. There are many different projects with similar outputs. For example, in 2002 the Commune Councils constructed about 1200 road culverts and about 1100 wells.
The drawings in the C/S Fund Technical Manual can be used for about 90% of all the infrastructure project outputs implemented by the Commune Councils.
Most of the drawings are not new, they are generally based on designs in current use by line ministries, in some cases simplified or condensed so that they can be used by small works contractors. Other designs have been taken from development sector literature and adapted always with the emphasis on suitability for use in contemporary rural communities in Cambodia. Almost all the drawings in the original Seila Manual have been used on many successful projects already.
Most Commune and Sangkat projects will be constructed by small contractors who do not have high level technical skills, or a lot of equipment. The drawings in the C/S Fund Technical Manual can help the Communes and the contractors to achieve good results in the following ways:
� The drawings are available in Khmer and English languages;
� The drawings are easy to read, by people who do not have high technical education (If you think that the drawings are not easy to read, please complain and we will try to improve them!);
� The project outputs shown in the drawings are easy to construct, without a lot of special equipment;
� The designs do not need a very high quality of construction technique, to achieve a successful project. For example, concrete structures built using the designs will be strong enough, even if the quality of the concrete is not very good.
When the Commune Council implements a project, they must follow technical guidelines from the Ministry that is responsible for the sector. For example, road projects should follow guidelines from the Ministry of Rural Development, and irrigation projects should follow guidelines of the Ministry of Water Resources and Meteorology.
Because the Ministries have helped to produce the Technical Manual (and the earlier Seila Technical Manual), the drawings in the Manual follow Ministry guidelines. If the Commune chooses a drawing from the Manual for their project, they know that the drawing follows the guidelines. However, the Commune can choose to use a different drawing (one that is not in the Manual) if they prefer.
The drawings show technical designs for project outputs. Before choosing a drawing for the project outputs, the project designer must decide what types of outputs are needed, how big the outputs must be and where the outputs must be. However, provided that the basic field data is collected the interactive Technical Forms in the Project Generator will provide most of the information required to assemble the design file.
Part 1: Introduction
Study and Design Guidelines I-4
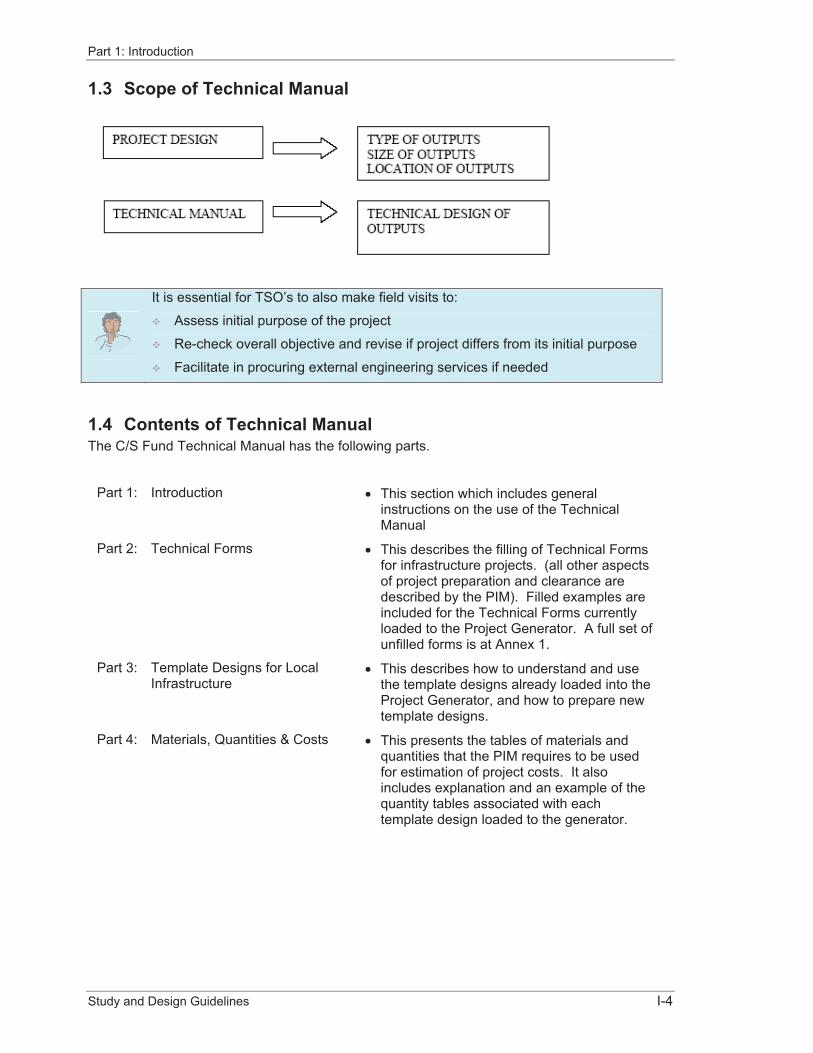
1.3 Scope of Technical Manual
It is essential for TSO’s to also make field visits to:
� Assess initial purpose of the project
� Re-check overall objective and revise if project differs from its initial purpose
� Facilitate in procuring external engineering services if needed
1.4 Contents of Technical Manual The C/S Fund Technical Manual has the following parts.
Part 1: Introduction � This section which includes general instructions on the use of the Technical Manual
Part 2: Technical Forms � This describes the filling of Technical Forms for infrastructure projects. (all other aspects of project preparation and clearance are described by the PIM). Filled examples are included for the Technical Forms currently loaded to the Project Generator. A full set of unfilled forms is at Annex 1.
Part 3: Template Designs for Local Infrastructure
� This describes how to understand and use the template designs already loaded into the Project Generator, and how to prepare new template designs.
Part 4: Materials, Quantities & Costs � This presents the tables of materials and quantities that the PIM requires to be used for estimation of project costs. It also includes explanation and an example of the quantity tables associated with each template design loaded to the generator.

Part 1: Introduction
Study and Design Guidelines I-5
Part 5: Study and Design Guidelines � This section provides basic guidance on the technical aspects of study and design such as slope stability, hydrological and hydraulic considerations, choice of materials, etc. Filling the Technical Forms guides most of the design decisions and small ‘applet’ programs are called for simple design calculations. The design guidance is for about 90% of projects, the remaining 10%, because they are unique or have special circumstance will require ‘specialist design input’.
Part 6: Specifications for Construction Materials and Works
� This provides explanations and instruction on use of the specifications use a tabular format. This is followed by revised and expanded tabulated specifications.
Part 7: Contract Supervision � This section explains the use of Construction Check Lists. Examples of filled check lists for two types of project are included. The full set of 32 check lists is at Annex 3.

Part 2: Technical Forms
Study and Design Guidelines I-6
PART 2: TECHNICAL FORMS
Part 2: Technical Forms
Study and Design Guidelines I-7
2 Technical Forms
2.1 Introduction This section describes how to comply with the requirements of the Project Implementation Manual (PIM) that for an infrastructure project the Technical Assistant prepares Technical Information Forms. These forms are part of the core process of Project Preparation and Technical Clearance.
It is required that the Technical Assistant will assist the Project Management Committee to study the technical aspects of the project at the project site in close cooperation with the User Groups and local community organizations to collect important and necessary information for filling in the Project Information Form and Technical Information forms.
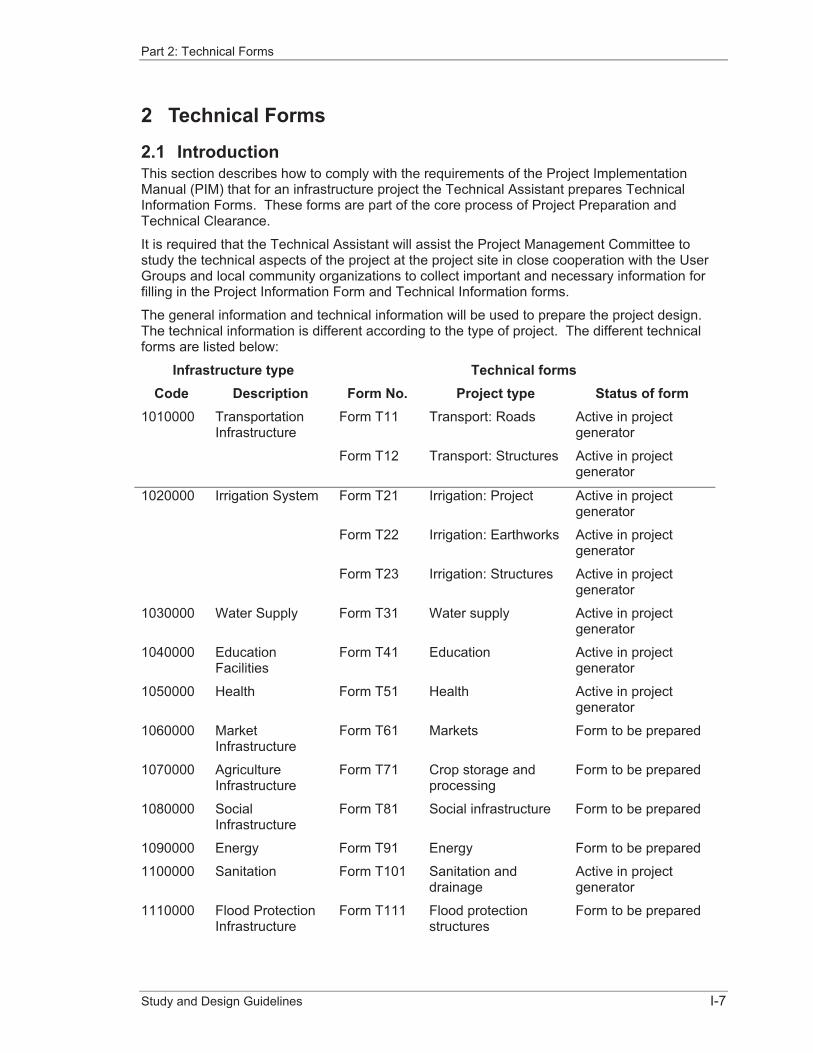
The general information and technical information will be used to prepare the project design. The technical information is different according to the type of project. The different technical forms are listed below:
Infrastructure type Technical forms Code Description Form No. Project type Status of form
1010000 Transportation Infrastructure
Form T11 Transport: Roads Active in project generator
Form T12 Transport: Structures Active in project generator
1020000 Irrigation System Form T21 Irrigation: Project Active in project generator
Form T22 Irrigation: Earthworks Active in project generator
Form T23 Irrigation: Structures Active in project generator
1030000 Water Supply Form T31 Water supply Active in project generator
1040000 Education Facilities
Form T41 Education Active in project generator
1050000 Health Form T51 Health Active in project generator
1060000 Market Infrastructure
Form T61 Markets Form to be prepared
1070000 Agriculture Infrastructure
Form T71 Crop storage and processing
Form to be prepared
1080000 Social Infrastructure
Form T81 Social infrastructure Form to be prepared
1090000 Energy Form T91 Energy Form to be prepared
1100000 Sanitation Form T101 Sanitation and drainage
Active in project generator
1110000 Flood Protection Infrastructure
Form T111 Flood protection structures
Form to be prepared

Part 2: Technical Forms
Study and Design Guidelines I-8
It will be noted in the ‘status of form’ column that that there are “Forms to be prepared” for five of the infrastructure group. This is because at the time of writing this manual there are no templates loaded into the Project Generator for these groups and very few such projects have ever been executed. This is anticipated to change in the future and it is intended to develop additional Technical Forms at that time when the precise requirements for the forms will be known.
2.2 Technical Forms are Mandatory It is mandatory to complete in full the appropriate Technical Forms active in the Project Generator. If the forms are not completed the Project Generator will not allow the project preparation and technical clearance process to proceed.
2.3 Differences between Technical Forms Each Technical Form is structured differently depending on the types and numbers of infrastructure outputs for which it can be used and also the design processes necessary and described in the design guidance.
2.4 Getting Design Guidance Design guidance is provided at Part 6 of this manual.
As far as is possible the Technical Forms incorporate the design guidance to advise the on the recommended output(s) and sizes where relevant. In some places there are MS Excel applets linked to the forms that will do the calculations required. The limitations of the applets are explained at Part 6 of this Manual.
Care has been taken to take a realistic approach so that the advice will be correct most of the time; and certainly a big improvement on past practice for some classes of infrastructure which are often built without any consideration of the design needs.
Design advice can still be overridden by the choosing a different output or size, which may be for a justified reason.
2.5 Example Technical Forms The remainder of this section describes the Technical Forms prepared to date and active in the Project Generator. There is a flow chart for each form illustrating the process of filling the form and where design calculations are made in the background.
Each flow chart is followed by an example of that form output by the generator. The appearance and content of the output depends on how the form was filled in the Project Generator, the recommendations of the design guidance, and the final choices made for the infrastructure output. Blank unfilled examples of the Technical Forms are at Annex 1.
2.6 Transportation Infrastructure, Group Output Code 1010000 There are two types of Technical Form for Transport Infrastructure:
� Form T11 for roads
� Form T12 for road structures.
Generally only one Form T11 will be required provided the road width and surface type is the same for the full length of the road. If it changes, e.g. because of increased traffic after a road junction, then more than one T11 might be filled.
There must be one Form T12 for each road structure, e.g. if there is one 5 m concrete bridge and three 1.0 m diameter pipe culverts then four T12 must be filled.
Part 2: Technical Forms
Study and Design Guidelines I-9
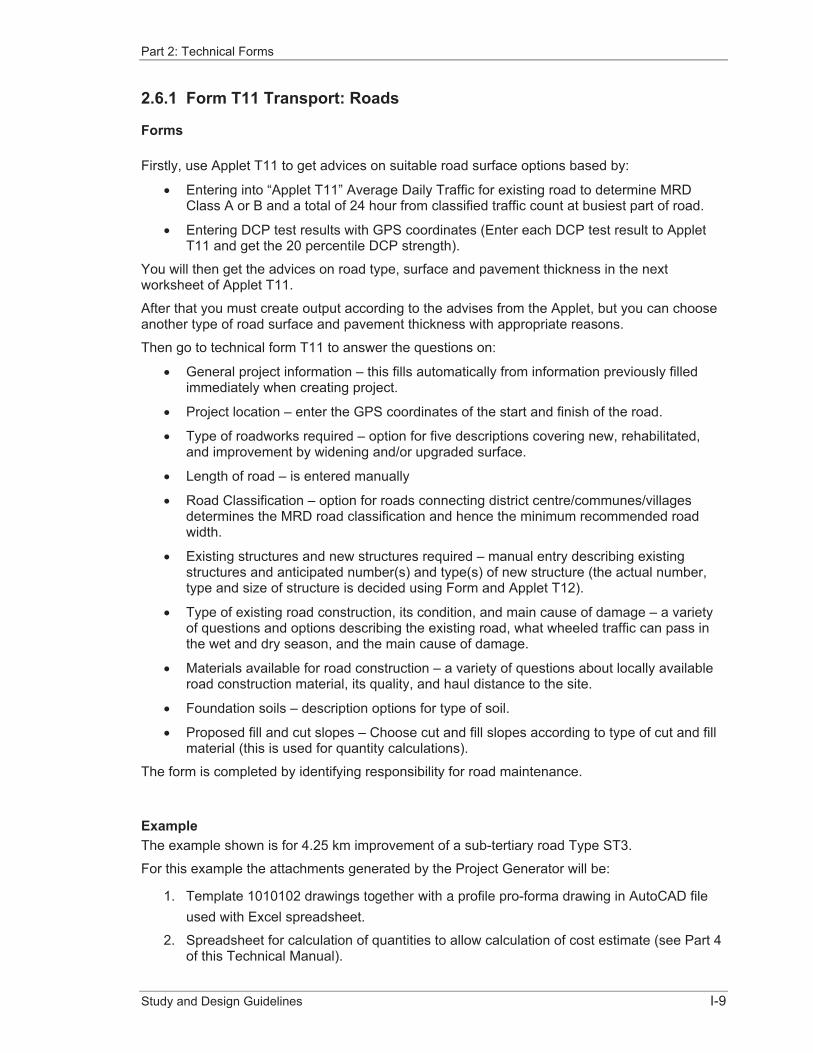
2.6.1 Form T11 Transport: Roads
Forms
Firstly, use Applet T11 to get advices on suitable road surface options based by:
� Entering into “Applet T11” Average Daily Traffic for existing road to determine MRD Class A or B and a total of 24 hour from classified traffic count at busiest part of road.
� Entering DCP test results with GPS coordinates (Enter each DCP test result to Applet T11 and get the 20 percentile DCP strength).
You will then get the advices on road type, surface and pavement thickness in the next worksheet of Applet T11.
After that you must create output according to the advises from the Applet, but you can choose another type of road surface and pavement thickness with appropriate reasons.
Then go to technical form T11 to answer the questions on:
� General project information – this fills automatically from information previously filled immediately when creating project.
� Project location – enter the GPS coordinates of the start and finish of the road.
� Type of roadworks required – option for five descriptions covering new, rehabilitated, and improvement by widening and/or upgraded surface.
� Length of road – is entered manually
� Road Classification – option for roads connecting district centre/communes/villages determines the MRD road classification and hence the minimum recommended road width.
� Existing structures and new structures required – manual entry describing existing structures and anticipated number(s) and type(s) of new structure (the actual number, type and size of structure is decided using Form and Applet T12).
� Type of existing road construction, its condition, and main cause of damage – a variety of questions and options describing the existing road, what wheeled traffic can pass in the wet and dry season, and the main cause of damage.
� Materials available for road construction – a variety of questions about locally available road construction material, its quality, and haul distance to the site.
� Foundation soils – description options for type of soil.
� Proposed fill and cut slopes – Choose cut and fill slopes according to type of cut and fill material (this is used for quantity calculations).
The form is completed by identifying responsibility for road maintenance.
ExampleThe example shown is for 4.25 km improvement of a sub-tertiary road Type ST3.
For this example the attachments generated by the Project Generator will be:
1. Template 1010102 drawings together with a profile pro-forma drawing in AutoCAD file used with Excel spreadsheet.
2. Spreadsheet for calculation of quantities to allow calculation of cost estimate (see Part 4 of this Technical Manual).

Part 2: Technical Forms
Study and Design Guidelines I-10
3. Specification (see Part 6 of this Technical Manual)
4. One Form T12 for each structure identified as needed.
5. Construction check lists (see Part 7 of this Technical Manual).
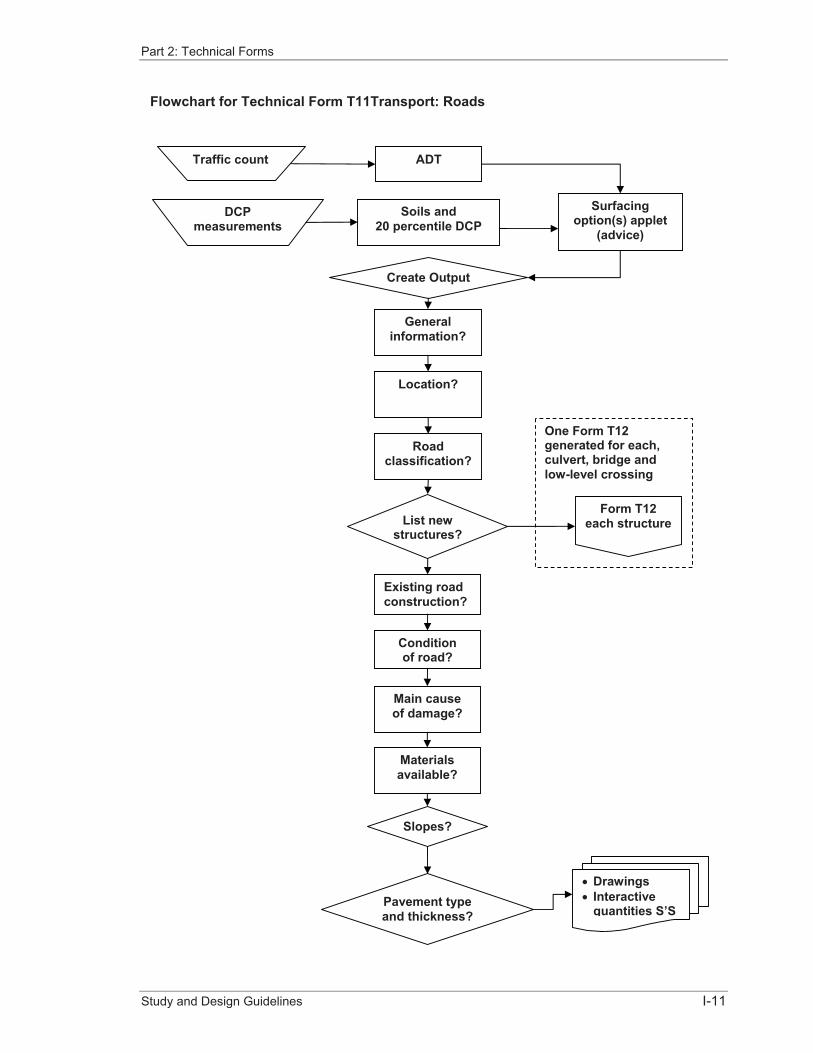
The flow chart and example Project Generator output follow below.
Part 2: Technical Forms
Study and Design Guidelines I-11
General information?
Location?
Roadclassification?
Existing road construction?
List new structures?
Condition of road?
Main cause of damage?
Materialsavailable?
Form T12 each structure
One Form T12 generated for each, culvert, bridge and low-level crossing
� Drawings � Interactive
quantities S’S
Slopes?
Flowchart for Technical Form T11Transport: Roads
Pavement type and thickness?
Create Output
DCPmeasurements
Soils and 20 percentile DCP
ADT Traffic count
Surfacingoption(s) applet
(advice)
Part 2: Technical Forms
Study and Design Guidelines I-12
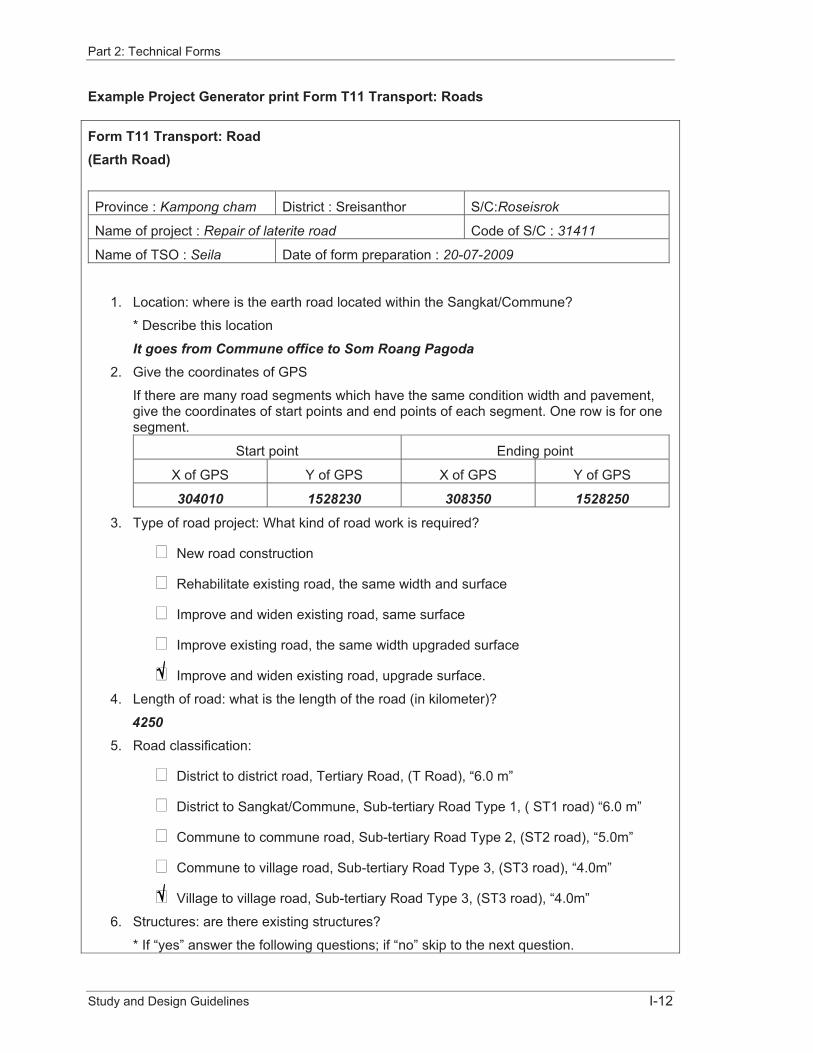
Example Project Generator print Form T11 Transport: Roads
Form T11 Transport: Road (Earth Road)
Province : Kampong cham District : Sreisanthor S/C:Roseisrok
Name of project : Repair of laterite road Code of S/C : 31411
Name of TSO : Seila Date of form preparation : 20-07-2009
1. Location: where is the earth road located within the Sangkat/Commune?
* Describe this location
It goes from Commune office to Som Roang Pagoda 2. Give the coordinates of GPS
If there are many road segments which have the same condition width and pavement, give the coordinates of start points and end points of each segment. One row is for one segment.
Start point Ending point
X of GPS Y of GPS X of GPS Y of GPS
304010 1528230 308350 15282503. Type of road project: What kind of road work is required?
� New road construction
� Rehabilitate existing road, the same width and surface
� Improve and widen existing road, same surface
� Improve existing road, the same width upgraded surface
� Improve and widen existing road, upgrade surface.
4. Length of road: what is the length of the road (in kilometer)?
42505. Road classification:
� District to district road, Tertiary Road, (T Road), “6.0 m”
� District to Sangkat/Commune, Sub-tertiary Road Type 1, ( ST1 road) “6.0 m”
� Commune to commune road, Sub-tertiary Road Type 2, (ST2 road), “5.0m”
� Commune to village road, Sub-tertiary Road Type 3, (ST3 road), “4.0m”
� Village to village road, Sub-tertiary Road Type 3, (ST3 road), “4.0m”
6. Structures: are there existing structures?
* If “yes” answer the following questions; if “no” skip to the next question.

Part 2: Technical Forms
Study and Design Guidelines I-13
� Yes
� No
7. List number, description and dimensions of existing structures.
1. 1 small wooden bridge 2m span, 2. Three single pipe culverts 0.6m,3. Carriageway above structure is 3m.
8. What new structures are required (number of each)?
* fill a form T12 for each structure, number the structure in the table.
Bridge culvert drift vented causeway
6
9. Type of existing road: is there existing path, car-track or road ?
� Yes
� No
10. Is the road on an embankment?
� Yes
� No
11. What is the width of the road?
312. Condition of road: what is the condition of the road?
* first row for rainy season, the second row for dry season. Write “Can” or “Cannot”. Can: Can go, Cannot: Cannot go.
Bicycle Motorcycle Motor-remorque
Koyun or small truck for carrying
goods
Car or truck for carrying
people
heavy truck for carrying
goods
Can Can Can Can Cannot Cannot
Can Can Can Can Can Cannot
13. Main cause of road damage: What causes the main damage?
If “Something else”, answer the below question
� Flooding
� Ponding on the road surface
� Gully erosion from runoff from the surface
� Carts pulled by animals
� Small cars or pickup trucks

Part 2: Technical Forms
Study and Design Guidelines I-14
� Heavy trucks for carrying goods
� Something else (fill in the below question)
14. Others main causes:
15. Material availability for road construction.
Remark: For the material which are required for road construction for the road type you have chosen skip to others questions!
16. Fill material from roadside borrow as dug:
� Meets specification requirements for Type 3 Fill
� Meets specification requirements for Type 1
� Can meet specification for Type 3 material by mixing with imported material
� Can meet specification for Type 1 material by mixing with imported material
� Is unsuitable material (mud, organic soils or Peat).
17. Fill material from remote borrow pit:
� Meets specification requirements for Type 3 Fill
� Meets specification requirements for Type 1
18. Distance of borrow pit(s) from road (Km):
0.619. Source of sand:
� Borrow pit
� Stream bed
20. Distance from road (Km):
221. Source of gravel:
� Borrow pit
� Stream bed
22. Distance from road (Km):
223. Laterite
Put “good”, “medium” or “poor” in the box of quality.
Source distance of transportation (Km) quality
Punley mountain 15 Poor24. Type of stone from quarry
* It the source is not borrow pit, please choose the answer below
� Hard metamorphic rock (granite, basalt, etc)

Part 2: Technical Forms
Study and Design Guidelines I-15
� Limestone
� Sandstone
25. Type of stone for stream bed:
* If the source is not stream bed, please choose the answer below
� Hard metamorphic rock (granite, basalt, etc)
� Limestone
� Sandstone
26. Water supply for earth work
Source distance from road (Km)
Domestic well 127. Road traffic: what are the proportion of the cars and trucks using the road?
*Write in percentage.
One place to another in commune
Go from the commune to a place outside the
commune or vice versa
Go from one place outside the commune to another
outside the commune
10% 90% 10%28. the proportion of the cars and trucks using the road is:
* Put it into percentage.
Belong to people who live in the commune
Belong to people who live outside the commune
48% 52%29. Foundation soils: what kind of soil the structure stand on?
* if “other”, mention in the following question:
� Soil that is very easily eroded
� Normal clay
� Sandy soils
� Gravels
� Earth with big stones in it
� Other.
30. For others soil kinds.
31. Side slope: Fill slope
Vertical Horizontal
1 1
Part 2: Technical Forms
Study and Design Guidelines I-16
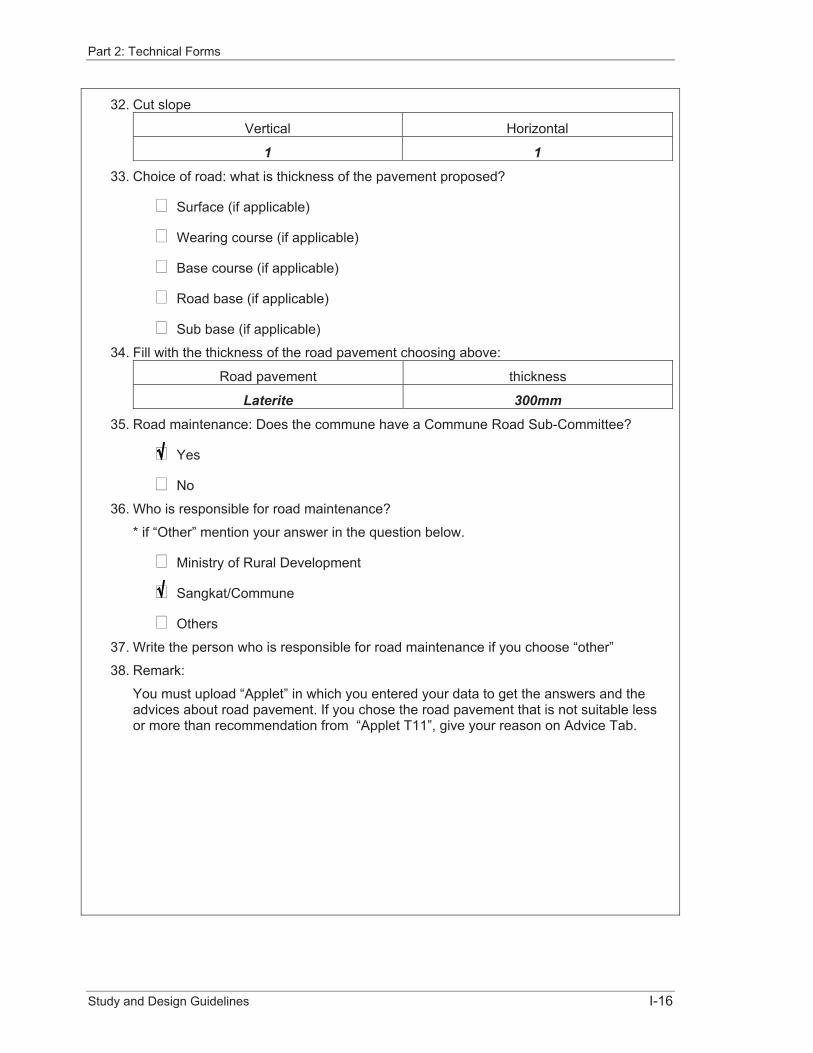
32. Cut slope
Vertical Horizontal
1 133. Choice of road: what is thickness of the pavement proposed?
� Surface (if applicable)
� Wearing course (if applicable)
� Base course (if applicable)
� Road base (if applicable)
� Sub base (if applicable)
34. Fill with the thickness of the road pavement choosing above:
Road pavement thickness
Laterite 300mm 35. Road maintenance: Does the commune have a Commune Road Sub-Committee?
� Yes
� No
36. Who is responsible for road maintenance?
* if “Other” mention your answer in the question below.
� Ministry of Rural Development
� Sangkat/Commune
� Others
37. Write the person who is responsible for road maintenance if you choose “other”
38. Remark:
You must upload “Applet” in which you entered your data to get the answers and the advices about road pavement. If you chose the road pavement that is not suitable less or more than recommendation from “Applet T11”, give your reason on Advice Tab.

Part 2: Technical Forms
Study and Design Guidelines I-17
2.6.2 Form T12 Transport: Structures
FormsFirstly, use Applet T12 to get advice on suitable type and size of drainage structure by:
� Choosing the structure type envisaged, and changing it if it will be different from the recommended structure after filling hydrology and hydraulic data.
� Filling hydrology and hydraulic data – details of the catchment draining to the structure if this can be determined (area, elevation of stream bed for slope, catchment soils, vegetation, land use and whether in a normal or high rainfall area).
After that you must create output according to the advice from the Applet, but you can choose another type and size of drainage structure with appropriate reasons. (NOTE: It is strongly recommended not to select a smaller type and size of structure than advised).
Then go to technical form T12 to answer the questions on:
� General project information – this fills automatically from information previously filled immediately when creating project.
� Project location – by entering the GPS coordinates of the structure the Project Generator creates a location plan.
� Road classification and standard – the road classification, standard and width is entered manually, but if Form T12 has been generated by a Form T11 then the information is entered the same as the road form.
� Scope of Works – requires information on the type, size and condition of the existing structure if there is one.
� Materials available for structure construction – a variety of questions about available structure construction material, its quality, and haul distance to the site.
� Foundation soils including results for DCP tests – description options for type of soil and DCP test results with GPS coordinates (Possibly enter each DCP test result to Applet T11 and get the 20 percentile DCP strength).
� Required hydraulic capacity of structure – the design flow and velocity from Applet T12 or engineer.
ExampleThe example shown is for one of the replacement pipe culverts on the previous example Form T11 for a road.
For this example the attachments generated by the Project Generator will be:
1. Template drawing for output code 1010303 (see Part 3 of this Technical Manual)
2. Quantities table to allow calculation of cost estimate (see Part 4 of this Technical Manual).
3. Specification (see Part 6 of this Technical Manual).
4. Construction check lists (see Part 7 of this Technical Manual).
The flow chart and example Project Generator output follow below.
Part 2: Technical Forms
Study and Design Guidelines I-18
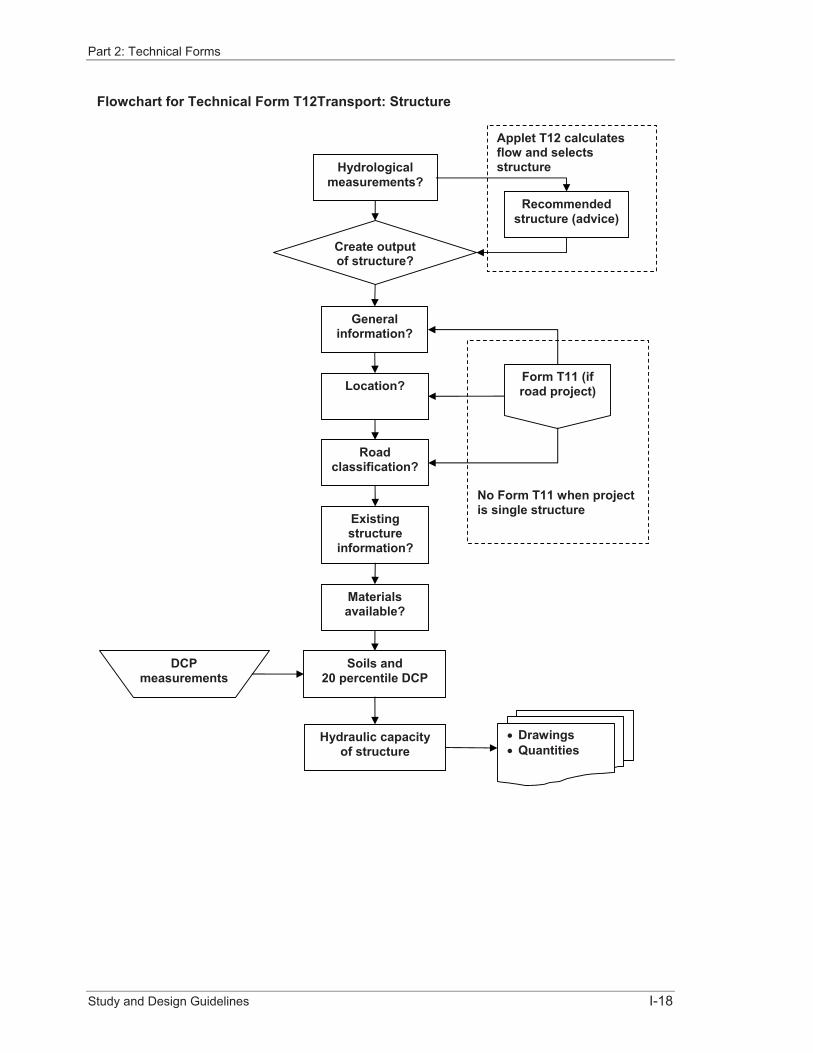
General information?
Location?
Roadclassification?
Existingstructure
information?
Materialsavailable?
DCPmeasurements
Soils and 20 percentile DCP
Form T11 (if road project)
No Form T11 when project is single structure
� Drawings � Quantities
Flowchart for Technical Form T12Transport: Structure
Applet T12 calculates flow and selects structure
Recommended structure (advice)
Create output of structure?
Hydrological measurements?
Hydraulic capacity of structure
Part 2: Technical Forms
Study and Design Guidelines I-19
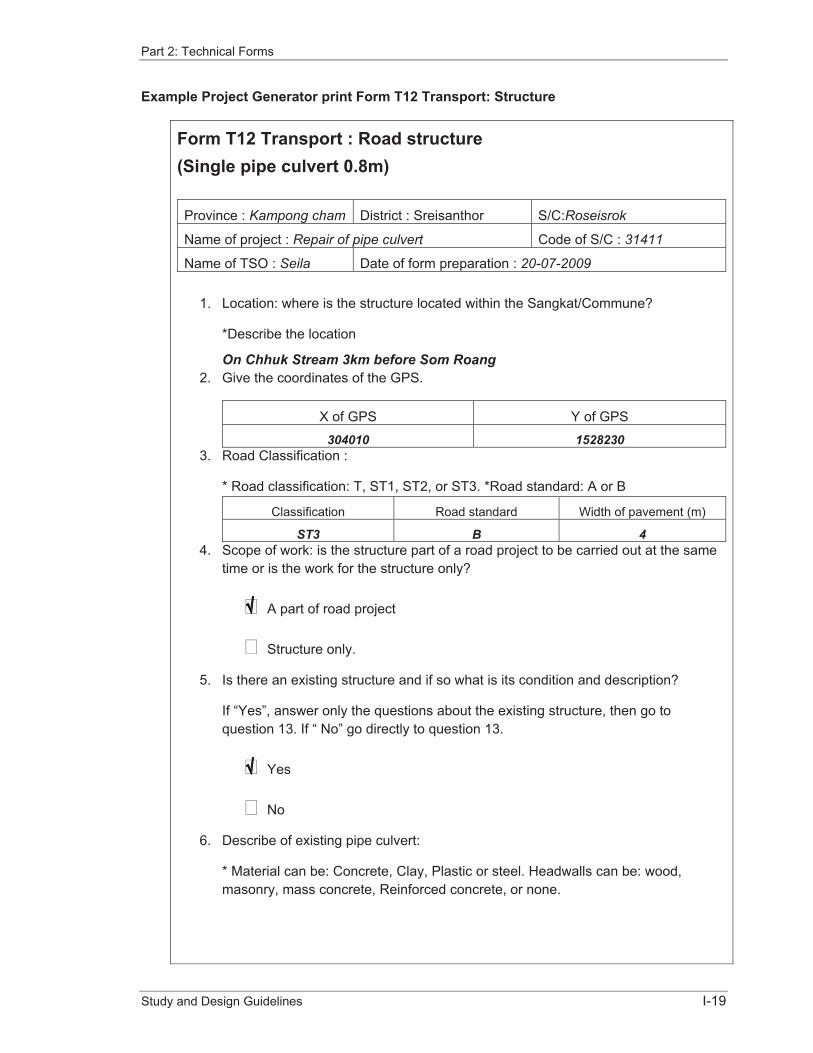
Example Project Generator print Form T12 Transport: Structure
Form T12 Transport : Road structure (Single pipe culvert 0.8m)
Province : Kampong cham District : Sreisanthor S/C:Roseisrok
Name of project : Repair of pipe culvert Code of S/C : 31411
Name of TSO : Seila Date of form preparation : 20-07-2009
1. Location: where is the structure located within the Sangkat/Commune?
*Describe the location
On Chhuk Stream 3km before Som Roang2. Give the coordinates of the GPS.
X of GPS Y of GPS
304010 15282303. Road Classification :
* Road classification: T, ST1, ST2, or ST3. *Road standard: A or B
Classification Road standard Width of pavement (m)
ST3 B 44. Scope of work: is the structure part of a road project to be carried out at the same
time or is the work for the structure only?
� A part of road project
� Structure only.
5. Is there an existing structure and if so what is its condition and description?
If “Yes”, answer only the questions about the existing structure, then go to question 13. If “ No” go directly to question 13.
� Yes
� No
6. Describe of existing pipe culvert:
* Material can be: Concrete, Clay, Plastic or steel. Headwalls can be: wood, masonry, mass concrete, Reinforced concrete, or none.
Part 2: Technical Forms
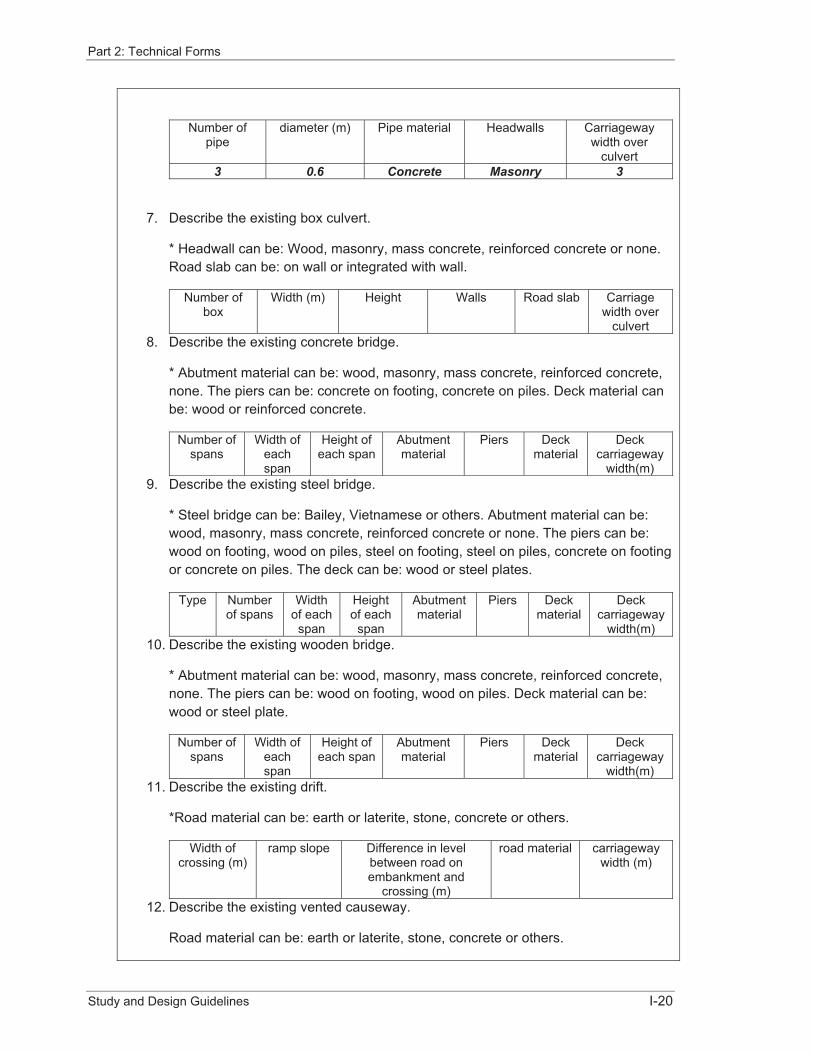
Study and Design Guidelines I-20
Number of pipe
diameter (m) Pipe material Headwalls Carriageway width over
culvert 3 0.6 Concrete Masonry 3
7. Describe the existing box culvert.
* Headwall can be: Wood, masonry, mass concrete, reinforced concrete or none. Road slab can be: on wall or integrated with wall.
Number of box
Width (m) Height Walls Road slab Carriage width over
culvert 8. Describe the existing concrete bridge.
* Abutment material can be: wood, masonry, mass concrete, reinforced concrete, none. The piers can be: concrete on footing, concrete on piles. Deck material can be: wood or reinforced concrete.
Number of spans
Width of eachspan
Height of each span
Abutmentmaterial
Piers Deck material
Deck carriageway
width(m)9. Describe the existing steel bridge.
* Steel bridge can be: Bailey, Vietnamese or others. Abutment material can be: wood, masonry, mass concrete, reinforced concrete or none. The piers can be: wood on footing, wood on piles, steel on footing, steel on piles, concrete on footing or concrete on piles. The deck can be: wood or steel plates.
Type Number of spans
Widthof each
span
Height of each
span
Abutmentmaterial
Piers Deck material
Deck carriageway
width(m)10. Describe the existing wooden bridge.
* Abutment material can be: wood, masonry, mass concrete, reinforced concrete, none. The piers can be: wood on footing, wood on piles. Deck material can be: wood or steel plate.
Number of spans
Width of eachspan
Height of each span
Abutmentmaterial
Piers Deck material
Deck carriageway
width(m)11. Describe the existing drift.
*Road material can be: earth or laterite, stone, concrete or others.
Width of crossing (m)
ramp slope Difference in level between road on embankment and
crossing (m)
road material carriageway width (m)
12. Describe the existing vented causeway.
Road material can be: earth or laterite, stone, concrete or others.
Part 2: Technical Forms
Study and Design Guidelines I-21
Width of crossing
(m)
rampslope
Difference in level between
road on embankment and crossing
(m)
roadmaterial
carriageway width (m)
Size of opening
Width/Dia
Size of opening Height
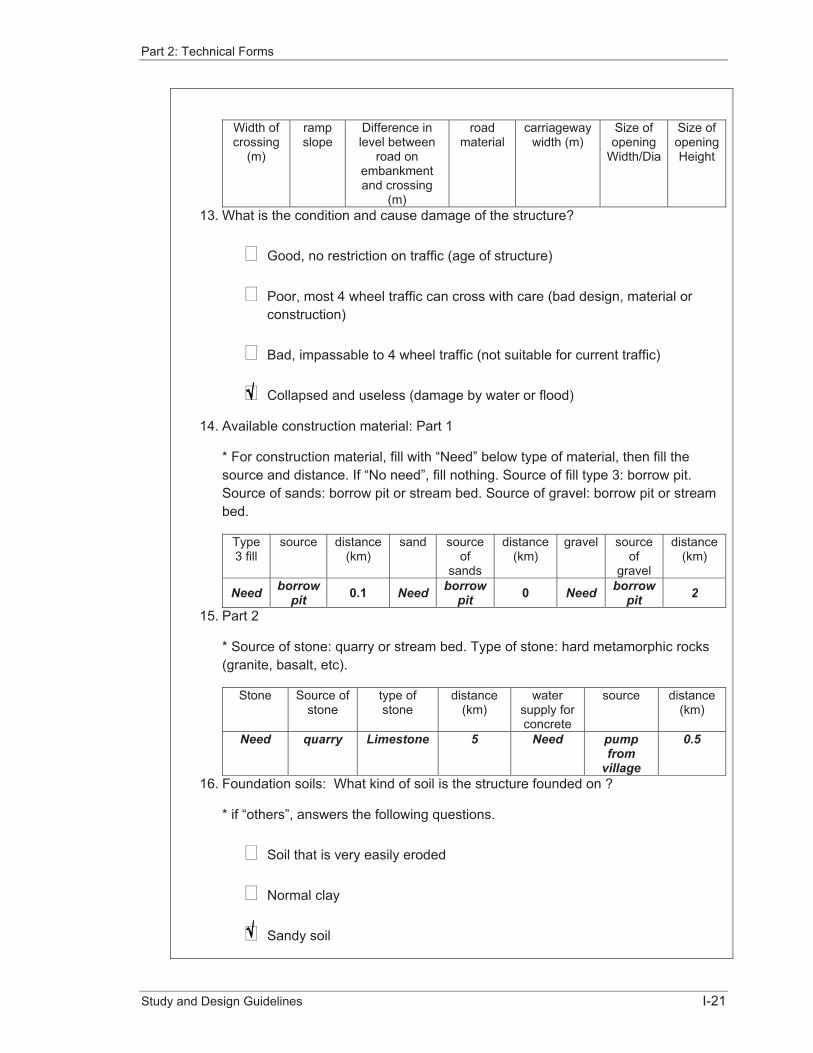
13. What is the condition and cause damage of the structure?
� Good, no restriction on traffic (age of structure)
� Poor, most 4 wheel traffic can cross with care (bad design, material or construction)
� Bad, impassable to 4 wheel traffic (not suitable for current traffic)
� Collapsed and useless (damage by water or flood)
14. Available construction material: Part 1
* For construction material, fill with “Need” below type of material, then fill the source and distance. If “No need”, fill nothing. Source of fill type 3: borrow pit. Source of sands: borrow pit or stream bed. Source of gravel: borrow pit or stream bed.
Type3 fill
source distance (km)
sand source of
sands
distance (km)
gravel source of
gravel
distance (km)
Need borrowpit 0.1 Need borrow
pit 0 Need borrowpit 2
15. Part 2
* Source of stone: quarry or stream bed. Type of stone: hard metamorphic rocks (granite, basalt, etc).
Stone Source of stone
type of stone
distance (km)
watersupply for concrete
source distance (km)
Need quarry Limestone 5 Need pumpfrom
village
0.5
16. Foundation soils: What kind of soil is the structure founded on ?
* if “others”, answers the following questions.
� Soil that is very easily eroded
� Normal clay
� Sandy soil

Part 2: Technical Forms
Study and Design Guidelines I-22
� Gravel
� Earth with big stone in it
� Others
17. Others, mention them.
18. Foundation strength of DCP (mm/blow) and location of each test.
* Location: stream bed road centre line, stream bed upstream, stream bed downstream, left bank abutment, right bank abutment or others.
DCP (mm/blow) location 23 Stream bed road centre line15 Right bank abutment35 Stream bed downstream
19. what is the 20 percentile DCP?
30.2
20. Hydrology and required hydraulic capacity of structure: did you use “Applet” to calculate the design flow, velocity, type and size of structure?
* You can use “Applet T12” to determine the simple flow system, but for the complicated one, you have to find help from an engineer.
� Yes
� No
21. Maximum design flow (m3/s) from Applet or engineer is:
* If you use Applet, write down the answer from form T12, worksheet GTFM:C32.
1.91
22. Velocity (m/s) which downstream structure can withstand is
* if you use Applet, write down the answer from form T12, worksheet GTFM:C34
2.83
23. Remark:�
Upload “Applet” in which you fill the data to get the design flow, suitable structures and the velocity above. If you don’t use Applet to get the recommended structure, give your suitable reasons and upload the related documents that you use to determine design flow and velocity. �

Part 2: Technical Forms
Study and Design Guidelines I-23
2.7 Irrigation System, Group Output Code 1020000 There are three types of Technical Form for Irrigation Systems:
� Form T21 for Irrigation: Project
� Form T22 for Irrigation: Earthwork
� Form T23 for Irrigation: Structure.
Irrigation is generally the most complex and also usually the least successful infrastructure output supported by the C/S Fund.
Form T21 is used to establish the requirements and constraints for irrigation. Even if the proposed output(s) are only an element of a larger irrigation system, it is strongly advised to complete a Form T21 to define the requirements for the C/S Fund investment. This form is required only one time for one irrigation system.
Form T22 is used for irrigation earthworks; these can be dams or dykes, canals or drains. There must be a separate T22 for each earthwork, e.g. if a project comprises a dam and two canals there must be three T22.
Form T23 is for irrigation structures, e.g. spillway, head regulator, cross regulator, culvert, etc. There must be a separate T23 for each structure, e.g for the dam and canals above there may be one spillway, one head regulator, two cross regulators and two culverts requiring six T23.
2.7.1 Form T21 Irrigation: Project
FormForm T21 requires answers for questions on:
� General project information – this fills automatically from information previously filled immediately when creating project.
� Project location – by entering the GPS coordinates of the structure (for irrigation projects choose an identifiable location, e.g. the dam across a stream).
� Description of the project – manual entry summarising details of the project, if the output is part of a larger project, describe the larger project and the purpose the output will serve in relation to that project.
� Farmer Water User Community (FWUC) – questions establishing whether there is an existing FWUC or whether farmers are prepare to form one.
� Operation and maintenance responsibilities – manual entry for proposed operation and maintenance of the project (Note: failure to implement operation and maintenance procedures is a primary cause of failure of C/S Fund irrigation investments).
� Irrigation system requirement – these questions establish what the community expects from the project, in both the dry and wet season.
� Flooding – questions about flooding establish if, when and for how long the irrigated fields flood each year because this determines the periods and quantities of irrigation water required (remember that paddy rice is traditional grown on land that floods part of each year).
� Existing irrigation systems – these questions establish the existing irrigation systems, their condition, whether they work and the perceived cause of problems.
� Water resources – these questions establish where the irrigation water will come from, what periods of the year it is available, and how it will be delivered to the fields.

Part 2: Technical Forms
Study and Design Guidelines I-24
� Rainfall records – the nearest available rainfall record should be entered, each province should keep on file and update annually the rainfall records so that they are available for such purpose.
At this stage use applet T21 to calculate the irrigation water requirement on a monthly basis; it is only necessary to enter the catchment area and chose the month of planting, and then copy the answer from Appet to the generator.
If it is a reservoir project the applet determines:
� reservoir volume required;
� whether the reservoir is large enough;
� water surplus/deficit downstream before project;
� water surplus/ deficit downstream after project;
� whether the reservoir has a negative impact on irrigation downstream;
� the percentage reduction in water passed downstream; and
� whether the impact downstream is acceptable.
If it is a river intake project the applet determines:
� whether there is enough water at the river intake;
� water surplus/deficit downstream before project;
� water surplus/deficit downstream after project;
� whether the river intake has a negative impact on irrigation downstream;
� the percentage reduction in water passed downstream; and
� whether the impact downstream acceptable.
It is probable that at the first attempt there will be too little water for the reservoir or river intake proposal to work. The planting date, irrigated area and other design inputs can be adjusted to find the best solution.
Do not be surprised if a solution is not possible, especially in locations outside the Mekong floodplain. In many such places the landscape and rainfall patterns are such that reliable supplementary irrigation by traditional methods is impossible to achieve.
A final choice is made confirming the ‘work proposed for the irrigation project’.
ExampleThe example shown is for repair a Khmer Rouge earth dam, and canals for supplementary irrigation of wet season rice. The work includes a new reservoir spillway and new head regulator using medium size water gate.
For this example the attachments generated by the Project Generator will be:
1. 4No Form T22 (for one dam and three canals)
2. 7No Form T23 (for seven structures)
The flow chart and example Project Generator output follow below.
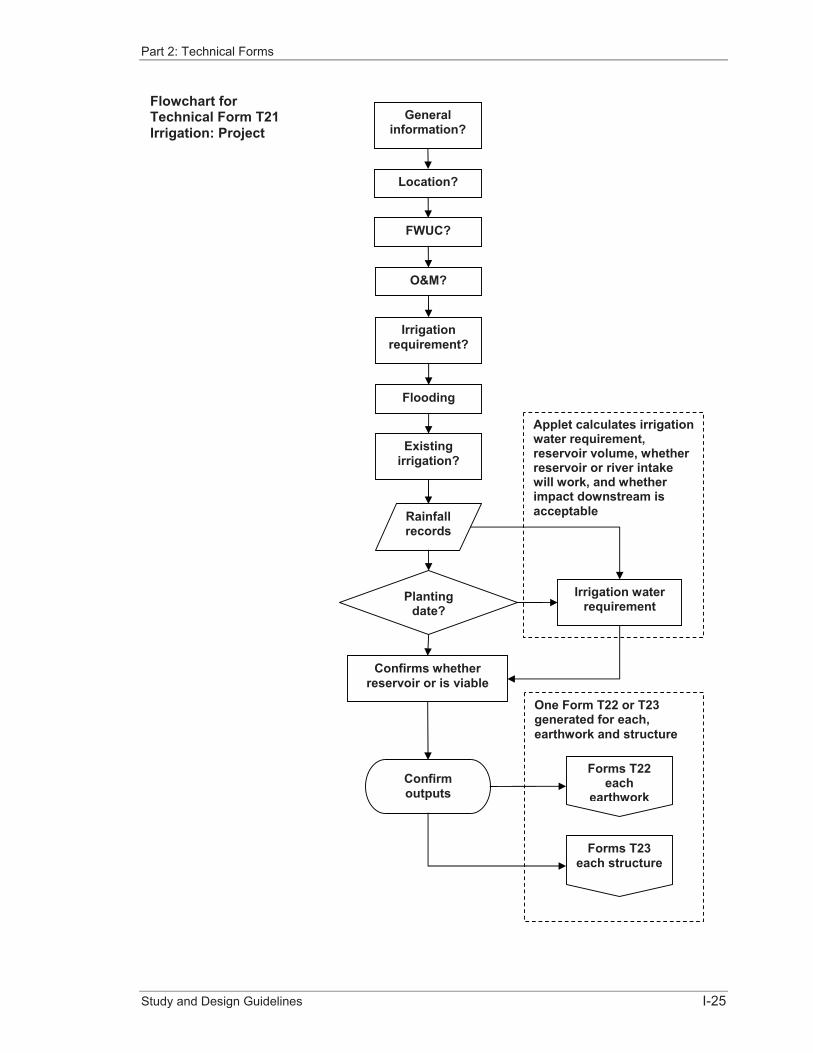
Part 2: Technical Forms
Study and Design Guidelines I-25
One Form T22 or T23 generated for each, earthwork and structure
Applet calculates irrigation water requirement, reservoir volume, whether reservoir or river intake will work, and whether impact downstream is acceptable
General information?
Location?
FWUC?
O&M?
Irrigation water requirement
Irrigationrequirement?
Plantingdate?
Confirm outputs
Flooding
Existingirrigation?
Rainfallrecords
Confirms whether reservoir or is viable
Forms T22 each
earthwork
Forms T23 each structure
Flowchart for Technical Form T21 Irrigation: Project
Part 2: Technical Forms
Study and Design Guidelines I-26
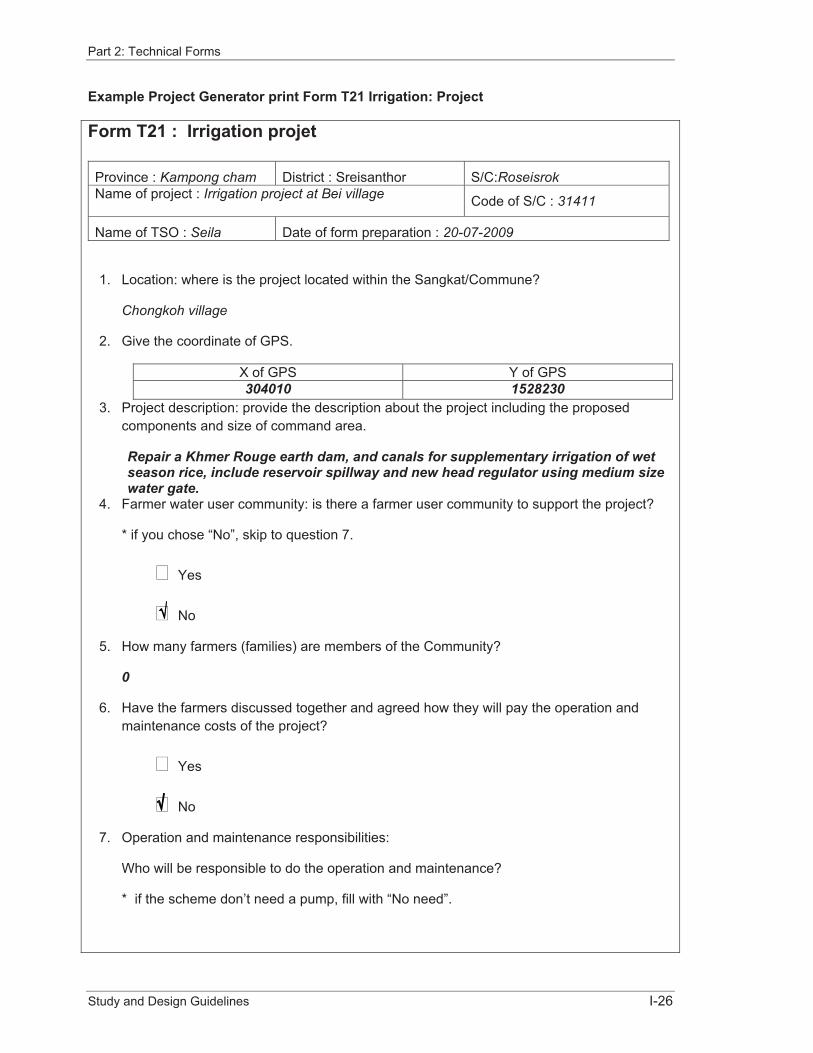
Example Project Generator print Form T21 Irrigation: Project
Form T21 : Irrigation projet
Province : Kampong cham District : Sreisanthor S/C:RoseisrokName of project : Irrigation project at Bei village Code of S/C : 31411
Name of TSO : Seila Date of form preparation : 20-07-2009
1. Location: where is the project located within the Sangkat/Commune?
Chongkoh village
2. Give the coordinate of GPS.
X of GPS Y of GPS 304010 1528230
3. Project description: provide the description about the project including the proposed components and size of command area.
Repair a Khmer Rouge earth dam, and canals for supplementary irrigation of wet season rice, include reservoir spillway and new head regulator using medium size water gate.
4. Farmer water user community: is there a farmer user community to support the project?
* if you chose “No”, skip to question 7.
� Yes
� No
5. How many farmers (families) are members of the Community?
0
6. Have the farmers discussed together and agreed how they will pay the operation and maintenance costs of the project?
� Yes
� No
7. Operation and maintenance responsibilities:
Who will be responsible to do the operation and maintenance?
* if the scheme don’t need a pump, fill with “No need”.

Part 2: Technical Forms
Study and Design Guidelines I-27
Operate the pump (if the
scheme needs a pump)?
Open and close water gates?
Collect water user fees?
Organizemaintenance
work?
Solve disputes between
farmers about the water?
No needed Gate keeper paid by
commune
communecouncil
communecouncil
communecouncil
8. Irrigation system requirement: what is the irrigated area in hectares?
* Remark: if the project will be a part of a big irrigation project, only describe the part that will be affected by the project.
Wet season dry season 100 0
9. What is the main type of crop that will be grown on the land?
wet season dry season Rice Nothing
10. How much of the land that has enough water every year already?
Wet season number of families dry season number of families 0 0 0 0
11. How much of the land that has enough water some years?
Wet season number of families dry season number of families 50 40 0 0
12. How much of the land never has enough water at present?
Wet season number of families dry season number of families 50 40 0 0
13. Total size of land and total number of families.
* Totalize the size of wet season irrigated area, the number of families, the size of dry season irrigated area, the number of families.
Wet season number of families dry season number of families 100 80 0 0
14. Flooding: Do the fields flood for some days each year?
If “Yes”, answer the following questions, if “No”, skip to question 18.

Part 2: Technical Forms
Study and Design Guidelines I-28
� Yes
� No
15. How long are the fields flooded (days)?
30
16. What is the flood depth during these days (m)?
0.15
17. What is the flood path, does the water flow concentrate is some places, describe and flow path(s) on map?
The flood water comes over the fields from the north-west and stays a long time if the flood in the big to the south-east is big.
18. Existing irrigation system: is there and existing irrigation system?
If “Yes”, answer the following question. If “No” skip to question 28.
� Yes
� No
19. When was the irrigation system built?
If ‘1980 to 2000’ or ‘After 2000’, answer the following questions. If not, skip one question below.
� French era
� Sihanouk era
� Khmer Rouge era
� 1980 to 2000
� After 2000.
20. Under what program or which donor paid for the project?
21. Does the system work?
� Working
� Working 50%

Part 2: Technical Forms
Study and Design Guidelines I-29
� Works a little
� Not working
22. What are the main components of the system and what is their condition?
� River intake
� Reservoir
� Dam
� Spillways
� Large water gates
� Canals
� Small water gates and culverts
23. What is the condition of the irrigation project?
Answer: Working, works a little, Not working or collapse for the main components of the system choosing above.
Main components of the system condition Dam Not working
Spillway CollapsedBig water gate Not working
Canal A lot of damageSmall water gate and culverts A lot of damage
24. How many months is water available?
� < 1 month
� 1 to 2 months
� 3 to 4 months
� 5 months
� 6 months
� > 6 months
Part 2: Technical Forms
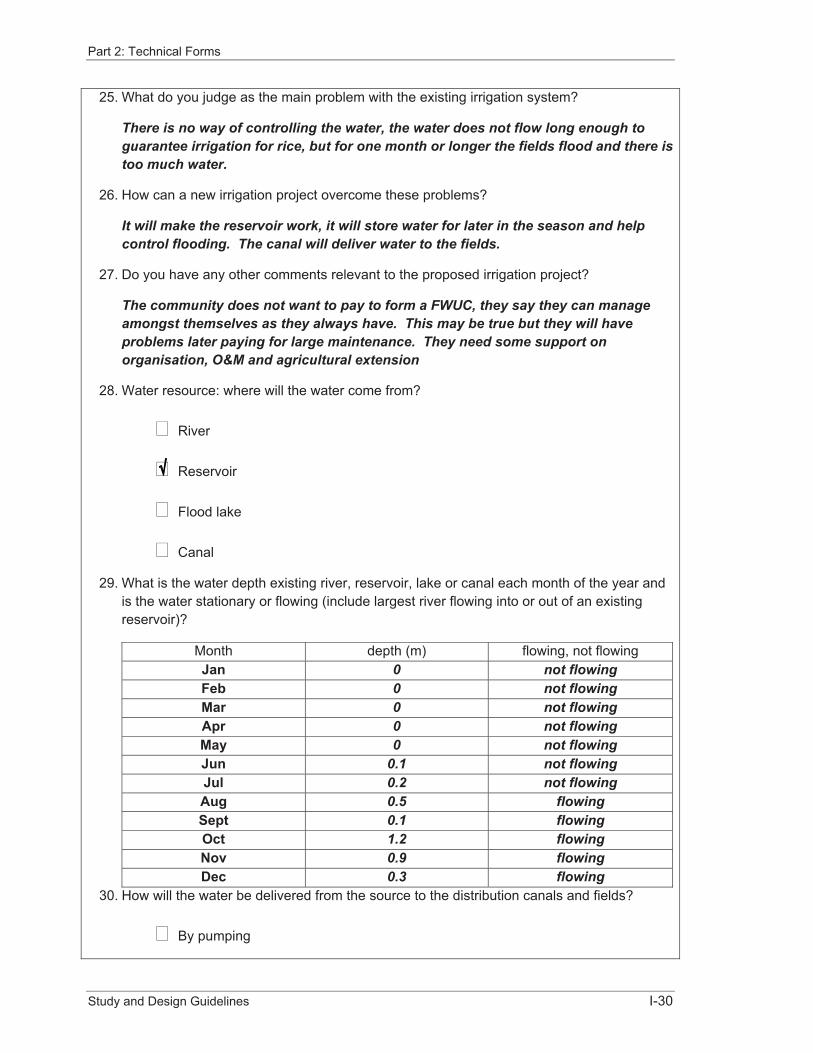
Study and Design Guidelines I-30
25. What do you judge as the main problem with the existing irrigation system?
There is no way of controlling the water, the water does not flow long enough to guarantee irrigation for rice, but for one month or longer the fields flood and there is too much water.
26. How can a new irrigation project overcome these problems?
It will make the reservoir work, it will store water for later in the season and help control flooding. The canal will deliver water to the fields.
27. Do you have any other comments relevant to the proposed irrigation project?
The community does not want to pay to form a FWUC, they say they can manage amongst themselves as they always have. This may be true but they will have problems later paying for large maintenance. They need some support on organisation, O&M and agricultural extension
28. Water resource: where will the water come from?
� River
� Reservoir
� Flood lake
� Canal
29. What is the water depth existing river, reservoir, lake or canal each month of the year and is the water stationary or flowing (include largest river flowing into or out of an existing reservoir)?
Month depth (m) flowing, not flowing Jan 0 not flowingFeb 0 not flowingMar 0 not flowingApr 0 not flowingMay 0 not flowingJun 0.1 not flowingJul 0.2 not flowingAug 0.5 flowingSept 0.1 flowingOct 1.2 flowingNov 0.9 flowingDec 0.3 flowing
30. How will the water be delivered from the source to the distribution canals and fields?
� By pumping
Part 2: Technical Forms
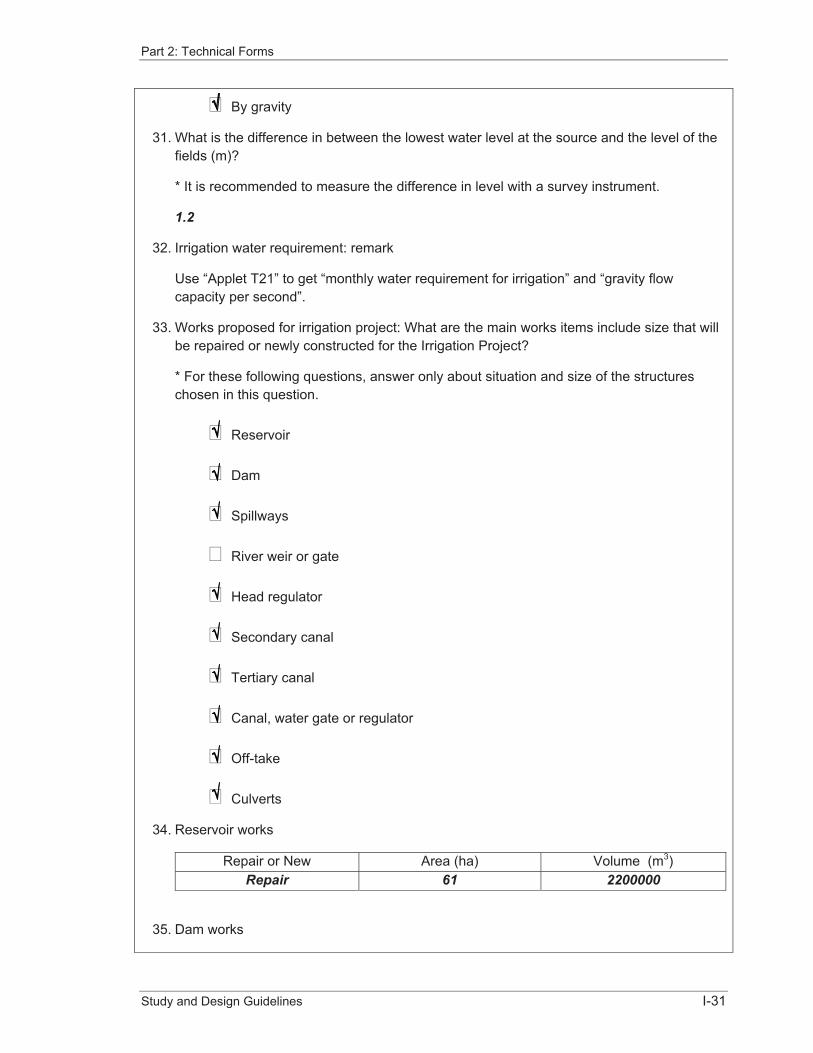
Study and Design Guidelines I-31
� By gravity
31. What is the difference in between the lowest water level at the source and the level of the fields (m)?
* It is recommended to measure the difference in level with a survey instrument.
1.2
32. Irrigation water requirement: remark
Use “Applet T21” to get “monthly water requirement for irrigation” and “gravity flow capacity per second”.
33. Works proposed for irrigation project: What are the main works items include size that will be repaired or newly constructed for the Irrigation Project?
* For these following questions, answer only about situation and size of the structures chosen in this question.
� Reservoir
� Dam
� Spillways
� River weir or gate
� Head regulator
� Secondary canal
� Tertiary canal
� Canal, water gate or regulator
� Off-take
� Culverts
34. Reservoir works
Repair or New Area (ha) Volume (m3)Repair 61 2200000
35. Dam works
Part 2: Technical Forms
Study and Design Guidelines I-32
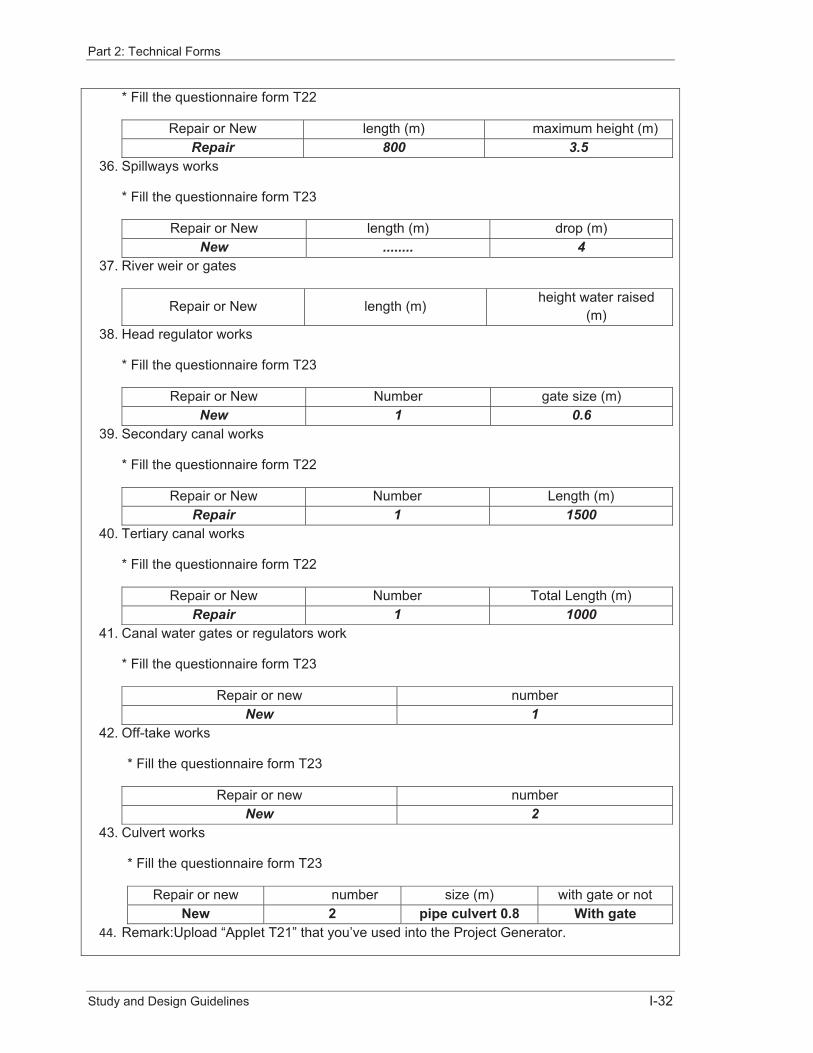
* Fill the questionnaire form T22
Repair or New length (m) maximum height (m) Repair 800 3.5
36. Spillways works
* Fill the questionnaire form T23
Repair or New length (m) drop (m) New ........ 4
37. River weir or gates
Repair or New length (m) height water raised (m)
38. Head regulator works
* Fill the questionnaire form T23
Repair or New Number gate size (m) New 1 0.6
39. Secondary canal works
* Fill the questionnaire form T22
Repair or New Number Length (m) Repair 1 1500
40. Tertiary canal works
* Fill the questionnaire form T22
Repair or New Number Total Length (m) Repair 1 1000
41. Canal water gates or regulators work
* Fill the questionnaire form T23
Repair or new number New 1
42. Off-take works
* Fill the questionnaire form T23
Repair or new number New 2
43. Culvert works
* Fill the questionnaire form T23
Repair or new number size (m) with gate or not New 2 pipe culvert 0.8 With gate
44. Remark:Upload “Applet T21” that you’ve used into the Project Generator.�
Part 2: Technical Forms
Study and Design Guidelines I-33
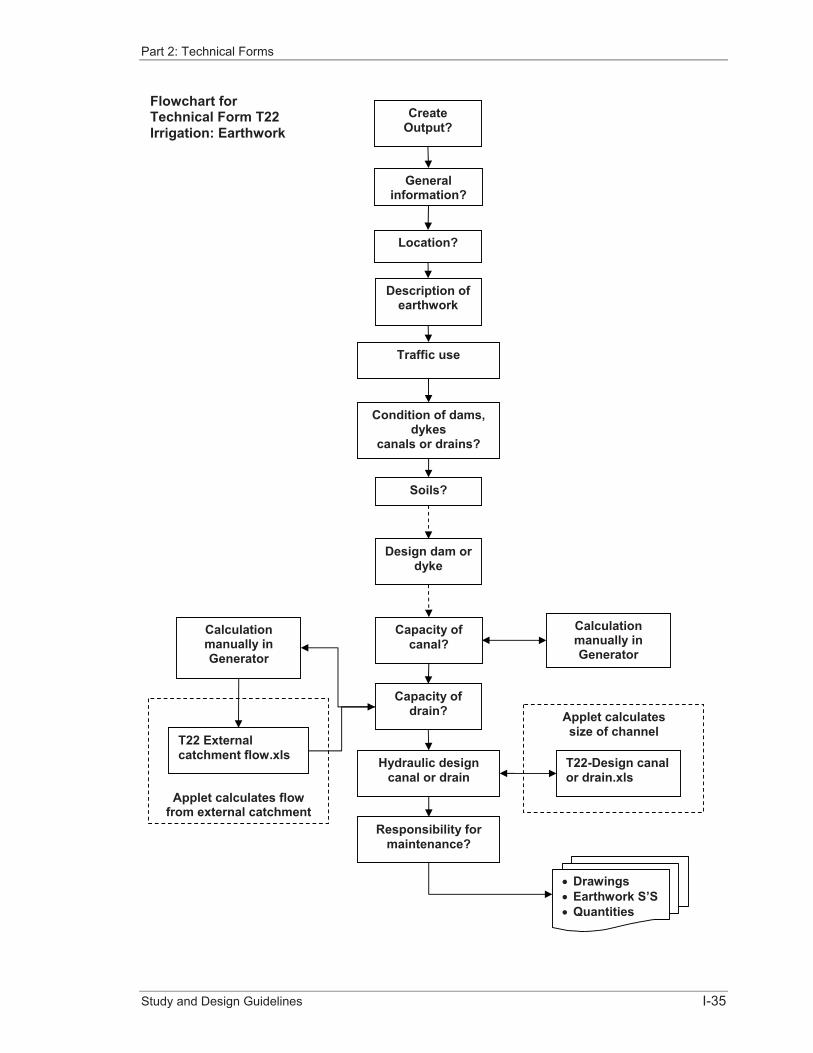
2.7.2 Form T22 Irrigation: Earthwork
FormsFirstly, create output of dam, dyke, canal or drain then open Technical Form T22 which requires answers for questions on:
� General project information – this fills automatically from information previously filled immediately when creating project.
� Project location – enter the GPS coordinates of the start and finish of the earthwork.
� Description of earthwork – select from choice of: dam, dyke, canal or drain, also select whether it is: new, improve, repair or maintenance.
� Traffic use of earthwork – these questions determine whether the earthwork will be used as a track or road and therefore the required crest width and surfacing (note: it is common for embankments to serve a dual purpose as a public road and irrigation earthwork, this complicates maintenance because traffic damage can compromise irrigation operations.
� Condition of existing dams and dykes – if the earthwork is a dam or dyke the condition must be entered manual and then a choice made from a list of common causes of damage.
� Condition of existing canal and drain - if the earthwork is a canal and drain the condition must be entered manual and then a choice made from a list of common causes of damage.
� Soils – select either the soils that will be use as (a) fill or (b) excavated for canals or drains. The advises whether the material is suitable as fill, safe fill or cut slopes, and whether canals or drains should be lined are provided next to the choices.
� Availability of fill material – if the earthwork is a dam or dyke answers on the type, questions must be answered concerning the quality, location and distance from site of fill materials.
� Design of dam or dyke – if the earthwork is a dam or dyke questions the design water level must be entered, the freeboard to calculate earthwork crest level, whether the earthwork is a road, the crest width and road surfacing, the upstream and downstream slopes, the method of slope protection for each slope, the class, thickness and filter requirements if rock riprap is used on the upstream slope.
� Capacity of canal – Manually multiply the flow rate of canal to the irrigated areas. A default flow of 2 l/s/ha to the area of fields supplied is used but can be overridden. If the canal is supplied by pumps the hours pumped each day must be entered to calculate the pumping rate.
� Capacity of drain – Manually multiply the flow rate of canal to the irrigated areas. A default flow of 3.5 l/s/ha to the area of fields drained is used but can be overridden. There are some questions to establish the concept for drainage (this is often overlooked and becomes another cause for failure). If the drain receives flow from a larger catchment area, details of this catchment must be entered in the same way as Form T12 Road: Structure in Applet T22 External catchment flow. The required flow capacity of the drain is the sum of the flow from the fields and that from a larger catchment area.
� Hydraulic design of canal or drain – Having established the required capacity of the canal or drain the hydraulic calculations are the same and the same applet is used for both types of channel. It is necessary to enter the upstream and downstream bed levels, the side slopes and bed width, the freeboard. The calculation is iterative. A water depth is entered: if it is too small Applet T22 instructs to ‘Increase depth’; if it is too large the

Part 2: Technical Forms
Study and Design Guidelines I-34
Applet instructs to ‘Decrease depth’; if the depth is correct (within a band of tolerance) the Applet prints ‘Depth OK’. The Applet then outputs the: minimum height of banks above bed level; width between tops of bank; and velocity of design flow.
� Responsibility for operation and maintenance – these questions check whether there is a FWUC to take responsibility for design and maintenance and if not who will carry out design and maintenance.
ExampleThe example shown is for rehabilitation of a Khmer Rouge canal downstream from a reservoir. But in this example the canal must also operate as a drain. Therefore it is necessary to calculate the required capacities as both a canal and a drain; then use the larger of the two flows for the hydraulic design of the channel.
For this example the attachments generated by the Project Generator will be:
1. Template drawing(s) when available for chosen output code(s) (See Part 3 of this Technical Manual).
2. Spreadsheet for calculation of earthwork quantities (See Part 4 of this Technical Manual).
3. Quantities table to allow calculation of cost estimate (See Part 4 of this Technical Manual).
4. Specification (see Part 6 of this Technical Manual).
5. Construction check lists (see Part 7 of this Technical Manual).
The flow chart and example Project Generator output follow below.
Part 2: Technical Forms
Study and Design Guidelines I-35
Applet calculates flow from external catchment
Applet calculates size of channel
Create Output?
General information?
Location?
Description of earthwork
T22-Design canal or drain.xls
Traffic use
Condition of dams, dykes
canals or drains?
Soils?
Capacity of drain?
Design dam or dyke
Capacity of canal?
Hydraulic design canal or drain
Responsibility for maintenance?
Calculation manually in Generator
Calculation manually in Generator
T22 External catchment flow.xls
� Drawings � Earthwork S’S � Quantities
Flowchart for Technical Form T22 Irrigation: Earthwork

Part 2: Technical Forms
Study and Design Guidelines I-36
Example Project Generator print Form T22 Irrigation: Earthwork
Form T22 Irrigation earthworks (Earth canal)
Province : Kampong cham District : Sreisanthor S/C:Roseisrok
Name of project : Repair earth canal Code of S/C : 31411
Name of TSO : Seila Date of form preparation : 20-07-2009
1. Location: where is the project located within the Sangkat/Commune?
Location description:
From the reservoir in Chongkoh village to rice field.
2. Provide the coordinate of GPS.
* First is the starting point, the flow row is the ending point
X of GPS Y of GPS 304010 1528030 304090 1528230
3. What type of earthwork is required?
� Build a new earthwork
� Improve the existing earthwork
� earthwork (e.g. raise or deepen, widen, add road surfacing)
� Repair a badly damage earthwork
� Periodic maintenance
4. Traffic use of earthwork: Is the earthwork used as a public road or for farm access?
If “Not used” skip to question 11.
� Public road
� Farm access
� Not used
5. Has the earthwork ever had Laterite or any other kind of improved surface in the past?
� Yes
� No
6. Is there any Laterite or any other kind of surface on the earthwork now?

Part 2: Technical Forms
Study and Design Guidelines I-37
� Yes
� No
7. What is the largest vehicle that uses the earthwork?
� Passenger car
� People walking
� Motorcycle
� Motor-remorque
� Bicycle
� Animal cart
� Light vehicle/van
� Koyun
� Medium truck (6 tyres)
� Heavy truck (6 tyres)
� Bus (>4 tyres)
� Mini-bus (4 tyres).
8. Approximately how many of these vehicles use the earthwork per day?
* In PCU units, you can use Applet T11 to help your calculation of the number of vehicle.
0
9. According the traffic of vehicle above, what type of pavement is suitable for this earthwork?
* if the number of vehicle is < 21 ‘Earth surface is satisfactory’.
* if the number of vehicle is < 25 ‘Light Laterite surface is satisfactory’
* If number of vehicles is <100 ‘Medium Laterite surface is satisfactory’
* If number of vehicles is >100 ‘Too much traffic for Laterite surface consider other option’.
10. Condition of the existing dams or dykes and Canals or drains: describe the condition of the existing earthwork.
The banks are eroded, breach and broken down so that water from the reservoir goes everywhere and often floods the fields.

Part 2: Technical Forms
Study and Design Guidelines I-38
11. What causes most damage to the earthwork?
* if “Other”, answer the question 12
� Dam: traffic, people or animal
� Erosion from rain
� Wave damage from reservoir of flooding
� Flooding overtopping and breaching
� Flooding overtopping and breaching
� Water flow along channels at toe or structures
� Others
� Canal: too small for flow
� Blocked by weed
� Silted-up
� Bank erosion
12. If “Others” mention them.
13. Soils: What kind of soil is at the project site, (a) for use as fill, (b) for excavating canals and drains?
� Clay group, stable slope: upstream 1:2.00, downstream 1:1.75, Canal and drain 1:1.25
� Sandy group, stable slope: upstream 1:2.50, downstream 1:2.00, Canal and drain 1:1.50
� Silty soil, stable slope: upstream “not suitable”, downstream “not suitable”, Canal and drain 1:1.50
� Dispersive clay, upstream “not suitable”, downstream “not suitable”, canal and drain : Line canal
� Organic soils, upstream “not suitable, downstream “not suitable”, canal and drain : Line canal.
14. Material for road construction: remark
Skip the materias which are not chosen for road construction.
15. Fill material from borrow beside earth works.

Part 2: Technical Forms
Study and Design Guidelines I-39
� Meets the specification requirement for type 3 fill
� Exceeds specification for Type 3 Fill with high clay content
16. Fill material from remote borrow pit
* fill material can be 1. Meets the specification for type 3 fill, 2. Exceeds specification for type 3 fill with high clay content.
Suitability, source (km).
Suitability source (km) Exceeds specification for type 3 3
17. Sands
* Source: borrow pit, stream bed.
Source distance (km)
18. Gravel
* Source: borrow pit, stream bed
.Source distance (km)
19. Laterite
* Source: borrow pit, stream bed. Quality: Good, medium or poor.
Source Quality distance (km)
20. Stone
* Source: quarry, stream bed. Type: granite, basalt, limestone…
Source type distance (km)
21. Water supply for earthwork
Source distance (km) Bottom of reservoir 1
22. Design of dam and dyke: What is reservoir full supply level at dam or flood levels at dyke (m)?
23. What freeboard will be allowed (m)?
* You can get the values of freeboard from PIM.
24. Dam or dyke crests level (before any road surface is added), (m).
25. Will the dam or dyke be used as a road?
26. What is the crest width?
27. Will the crest be surfaced?
If “Others”, answer the following question.
� Not surfaced

Part 2: Technical Forms
Study and Design Guidelines I-40
� Laterite
� Others
28. Others, mention them.
29. If laterite, what is the thickness of laterite (mm) ?
30. What will be the upstream slope (see advice in question 13)?
31. What will be the downstream slope (see advice in question 13)?
32. What slope protect will be provided to the upstream slope?
* If not “Rock riprap”, skip the question 34 to 36.
� None
� Grass
� Rock riprap
� Others
33. If “Others”, mention them.
34. If “Rock riprap”, What class of riprap (Class A suitable for small reservoirs)?
� Class A
� Class B
� Class C
� Class D
35. What thickness of riprap in millimeters (300 mm minimum for Class A)?
36. What filter will be placed below riprap?
� 150mm gravel
� 50mm sands over geotextile
37. What slope protect will be provided to the downstream slope?
� None
� Grass
38. Capacity of canal: Will the canal be irrigated continuously (24 hours) by gravity or by pumping?
If “Gravity”, answer the question 40, then skip the question 41. If “Pumping”, skip the question 41, then answer the question 41.
Part 2: Technical Forms
Study and Design Guidelines I-41
� Gravity
� Pumping
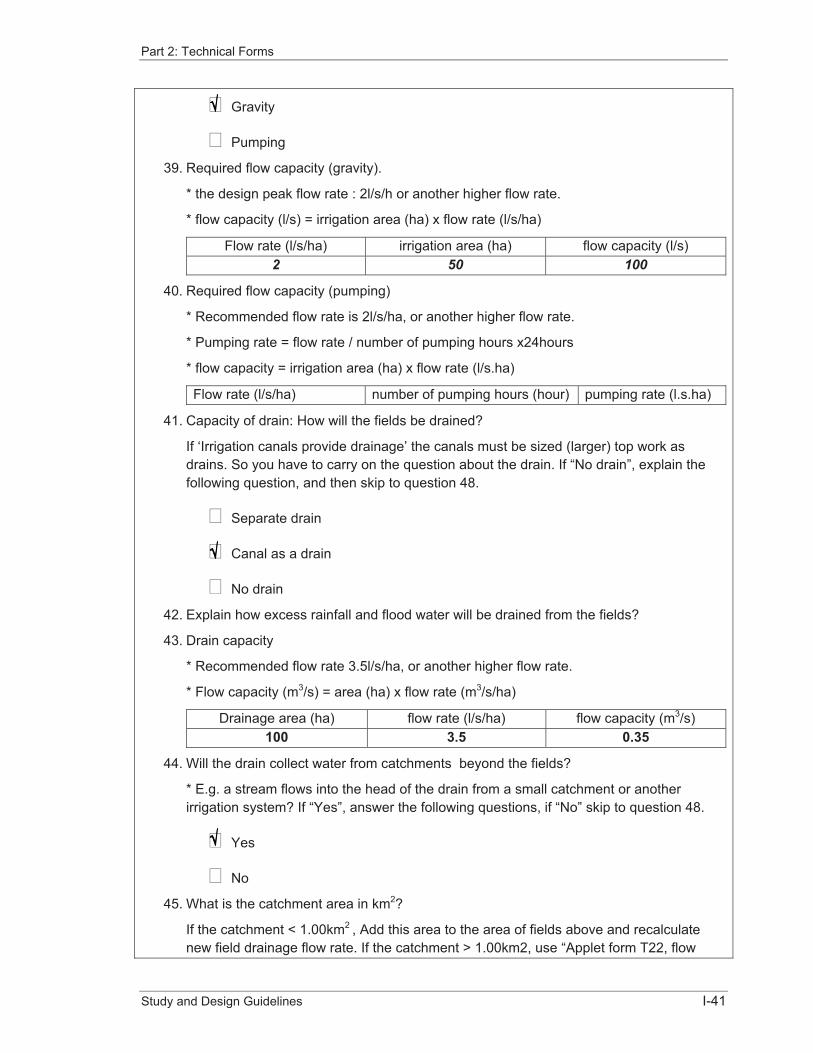
39. Required flow capacity (gravity).
* the design peak flow rate : 2l/s/h or another higher flow rate.
* flow capacity (l/s) = irrigation area (ha) x flow rate (l/s/ha)
Flow rate (l/s/ha) irrigation area (ha) flow capacity (l/s) 2 50 100
40. Required flow capacity (pumping)
* Recommended flow rate is 2l/s/ha, or another higher flow rate.
* Pumping rate = flow rate / number of pumping hours x24hours
* flow capacity = irrigation area (ha) x flow rate (l/s.ha)
Flow rate (l/s/ha) number of pumping hours (hour) pumping rate (l.s.ha)
41. Capacity of drain: How will the fields be drained?
If ‘Irrigation canals provide drainage’ the canals must be sized (larger) top work as drains. So you have to carry on the question about the drain. If “No drain”, explain the following question, and then skip to question 48.
� Separate drain
� Canal as a drain
� No drain
42. Explain how excess rainfall and flood water will be drained from the fields?
43. Drain capacity
* Recommended flow rate 3.5l/s/ha, or another higher flow rate.
* Flow capacity (m3/s) = area (ha) x flow rate (m3/s/ha)
Drainage area (ha) flow rate (l/s/ha) flow capacity (m3/s)100 3.5 0.35
44. Will the drain collect water from catchments beyond the fields?
* E.g. a stream flows into the head of the drain from a small catchment or another irrigation system? If “Yes”, answer the following questions, if “No” skip to question 48.
� Yes
� No
45. What is the catchment area in km2?
If the catchment < 1.00km2 , Add this area to the area of fields above and recalculate new field drainage flow rate. If the catchment > 1.00km2, use “Applet form T22, flow

Part 2: Technical Forms
Study and Design Guidelines I-42
external catchment” or get help from engineer to calculate the total flow (with the flow in the catchment above).
1.5
46. The flow rate of external catchment (m3/s) is:
Use “Applet T22 external catchment” then copy form column C32.
If the flow system of the external catchment is too complicate, you have to discuss with the engineer to get the flow capacity of this catchment.
2.61
47. Total drain design flow (m3/s) is the flow from irrigated area + flow from external catchment.
* Value of question 43 + value of question 46.
2.96
48. Hydraulic design of canal and drain: remark
Use “Applet T22 Hydraulic design of canal and drain” to calculate the minimum water height, bottom width and design velocity.
49. Responsibility for operation and maintenance: is there a Farmer Water Use Comity (FWUC) or similar group of people who are responsible for operation and maintenance of the earthwork.
� Yes
� No
50. Who will take to operate and maintain the earthwork ?
51. Remark
Upload all of “Applet T22” that you used into “Project generator” for engineer to examine.

Part 2: Technical Forms
Study and Design Guidelines I-43
2.7.3 Form T23 Irrigation: Structure
FormFirstly,determine the design flow across irrigation structure by:
� For Small Irrigation Flow Control Structures calculating irrigated and/or drainage flow (If your irrigation project consists of both earthwork and structure, use the earthwork flow).
� For Miscellaneous Irrigation Structures using Applet T23. In this applet you need to answer some questions about the hydrology of the catchment similar to Form T12 Road: Structure. Also the weir crest level and the maximum safe and acceptable upstream water level must be entered. The applet then outputs the length of the weir. These answers will need to be entered in the part of Spillways and diversion weirs belw.
After that create output of Irrigation Structure then answer T23 questions on:
� General project information – this fills automatically from information previously filled immediately when creating project.
� Project location – enter GPS coordinates of the structure.
� Proposed structure – select the structure type from the list, the remaining sections of the form appear as required by this choice.
� Materials available for structure construction –a variety of questions about available structure construction material, its quality, and haul distance to the site.
� Foundation soils including results for DCP tests – description options for type of soil and DCP test results with GPS coordinates (Enter each DCP test result to Applet T11 and get the 20 percentile DCP strength).
� Road crossing – questions on whether a road crosses the structure, the type of road and the numbers and types of vehicle using the road.
� Hydraulic capacity – questions require entry of the hydraulic capacity of the structure depending on whether it is a canal or drain (these answers come from the flow calculated above). There is also an important question whether the capacity can be exceeded (e.g. if a drain receives flow from an external catchment, or if a spillway passes a larger than design flood). The circumstance and consequences of an overdesign flood must be stated (this may require specialist advice).
� Spillways and diversion weirs – questions will need to be answered if this type of output is proposed by copying from the applet T23 used above.
� Pumping capacity – if the output is a pump then the pumping capacity must be confirmed, this may come from Form T22.
� Responsibility for operation and maintenance – these question check whether there is a FWUC to take responsibility for design and maintenance and if not who will carry out design and maintenance.
ExampleThe example shown is for a concrete spillway as part of the works to rehabilitate a Khmer Rouge reservoir and irrigation system.
For this example the attachments generated by the Project Generator will be:
1. No template drawing(s) are available for chosen output code(s), for the example shown a template is not suitable and a custom drawing will be needed on all occasions (See Part 3 of this Technical Manual).

Part 2: Technical Forms
Study and Design Guidelines I-44
2. No quantities table to allow calculation of cost estimate (See Part 4 of this Technical Manual).
3. Specification (see Part 6 of this Technical Manual).
4. Construction check lists (see Part 7 of this Technical Manual).
The flow chart and example Project Generator output follow below.
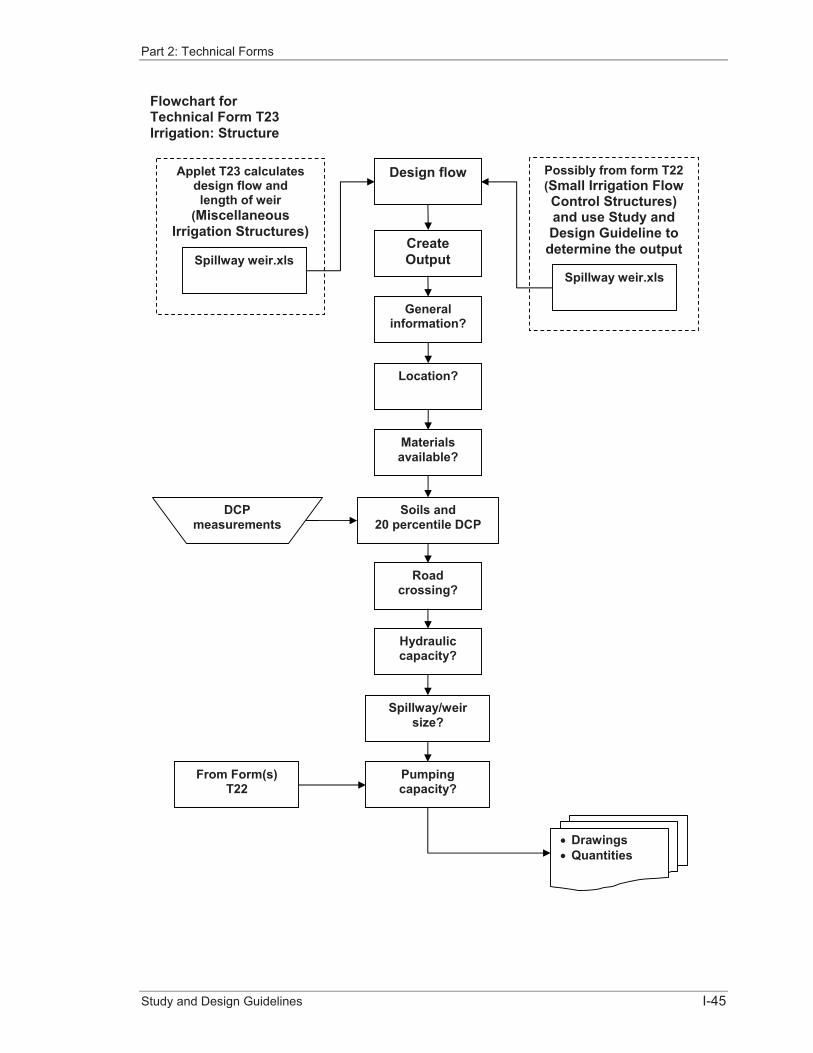
Part 2: Technical Forms
Study and Design Guidelines I-45
Flowchart for Technical Form T23 Irrigation: Structure
Design flow Applet T23 calculates design flow and length of weir
(MiscellaneousIrrigation Structures)
Spillway weir.xls
Possibly from form T22 (Small Irrigation Flow Control Structures) and use Study and Design Guideline to
determine the output
Spillway weir.xls
CreateOutput
General information?
Location?
Materialsavailable?
Soils and 20 percentile DCP
Spillway/weir size?
� Drawings � Quantities
Roadcrossing?
Hydraulic capacity?
Pumpingcapacity?
DCPmeasurements
From Form(s) T22
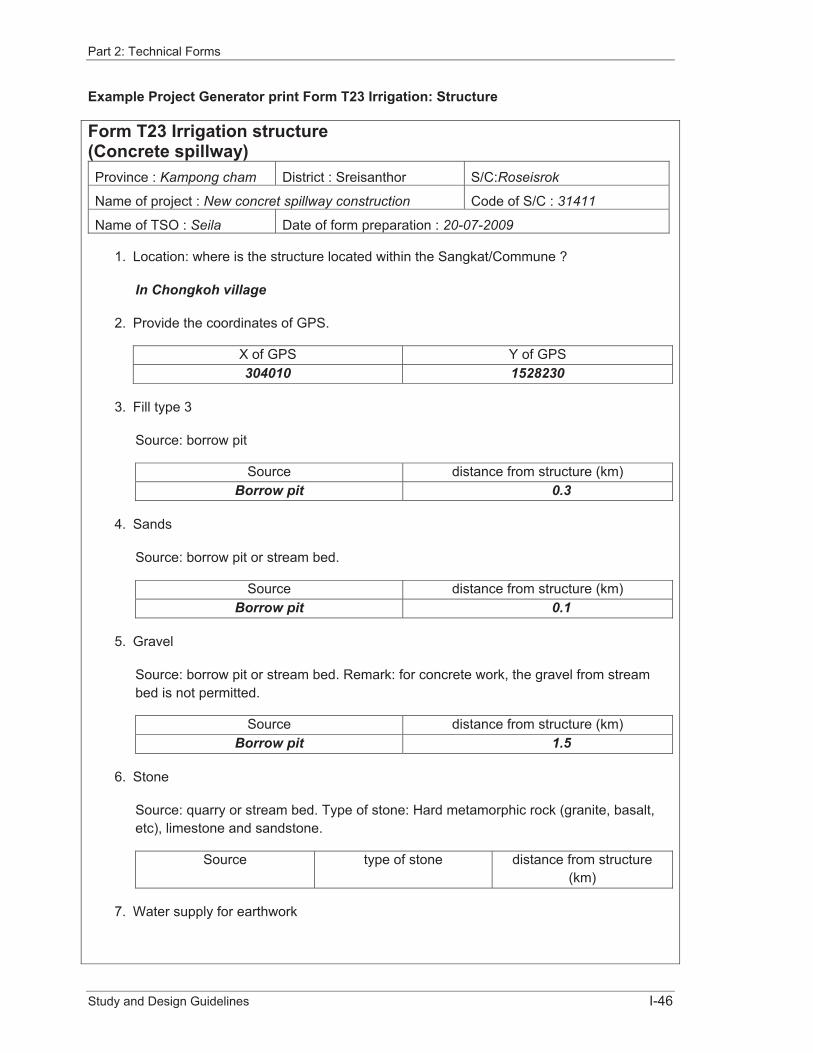
Part 2: Technical Forms
Study and Design Guidelines I-46
Example Project Generator print Form T23 Irrigation: Structure
Form T23 Irrigation structure (Concrete spillway) Province : Kampong cham District : Sreisanthor S/C:Roseisrok
Name of project : New concret spillway construction Code of S/C : 31411
Name of TSO : Seila Date of form preparation : 20-07-2009
1. Location: where is the structure located within the Sangkat/Commune ?
In Chongkoh village
2. Provide the coordinates of GPS.
X of GPS Y of GPS 304010 1528230
3. Fill type 3
Source: borrow pit
Source distance from structure (km) Borrow pit 0.3
4. Sands
Source: borrow pit or stream bed.
Source distance from structure (km) Borrow pit 0.1
5. Gravel
Source: borrow pit or stream bed. Remark: for concrete work, the gravel from stream bed is not permitted.
Source distance from structure (km) Borrow pit 1.5
6. Stone
Source: quarry or stream bed. Type of stone: Hard metamorphic rock (granite, basalt, etc), limestone and sandstone.
Source type of stone distance from structure (km)
7. Water supply for earthwork

Part 2: Technical Forms
Study and Design Guidelines I-47
Source distance from structure (km) Bottom of reservoir 0.1
8. Foundation soils: what kind of soils is the structure founded on?
If “Others”, fill the questions following.
� Very easily eroded soil
� Normal clay
� Sandy soil
� Gravel
� Earth with big stone in it
� Others
9. Other types of soils: mention them.
10. Foundation strength of DCP (mm/blow) and location of each test.
* Location: stream bed road centre line, stream bed up stream, stream bed downstream, left bank abutment, right bank abutment or others.
DCP (mm/blow) location 23 stream bed road centre line15 left bank abutment35 stream bed downstream
11. what is the 20 percentile DCP
* You can calculate this value with Applet T11
30.2
12. Crossing structure: is there an existing crossing structure ?
* if “Yes”, answer the following questions, if “Not”, go to “Flow capacity”
� Yes
� No
13. Road classification:
� District to district

Part 2: Technical Forms
Study and Design Guidelines I-48
� District to commune
� Commune to commune
� Commune to village
� Village to village
� Farm acces
14. What is the largest vehicle that uses the earthwork?
� Passenger car
� People walking
� Motorcycle
� Motor-remorque
� Bicycle
� Animal cart
� Light vehicle/van
� Koyun
� Medium truck (6 tyres)
� Heavy truck (6 tyres)
� Bus (>4 tyres)
� Mini-bus (4 tyres).
15. Flow capacity: what is the design flow capacity (can be from T22), (m3/s)?
* Calculated from canal capacity. You can skip this question for spillways or river intake. Generally, if the design structure is passed by the irrigation flow and drainage flow, you must design the structure the drainage flow, because its value is always higher.
16. What is the flow capacity at the structure (m3/s)?

Part 2: Technical Forms
Study and Design Guidelines I-49
* Calculated from canal capacity. You can copy skip question for spillways or river intake. Generally, if the design structure is passed by the irrigation flow and drainage flow, you must design the structure the drainage flow, because its value is always higher.
17. Can this flow capacity be higher than design one?
If “Can”, answer the following questions, if “Can not” skip them.
� Can
� Can not
18. Describe the circumstance and consequence for the structure also what provision will be provided to survive an extreme flow?
Using the design guidance spillways is sized for 1 in 50 year flow into the reservoir; the reservoir freeboard allows some of the flood to stay temporarily in the reservoir until it call all pass over the spillways. A concrete stilling basin and erosion protection will be provided downstream.
19. Did you use “Applet” to determine the design flow and length of structure? (Spillway and diversion weirs)
* if you don’t design the spillway or river intake, skip them.
� Yes
� No
20. Spillway and diversion weirs: is the structure for reservoir or river intake?
� Reservoir
� River intake
21. What is the design flow for spillway or river intake (m3/s) ?
* Copy from Applet T23, worksheet GTFM: C32.
15.35
22. What is the maximum safe water level at the upstream of structure? ( higher than this level, it can be flooded, overtopped).
* Copy from Applet T23, worksheet GTFP: C33.
23

Part 2: Technical Forms
Study and Design Guidelines I-50
23. What is the proposed weirs crest level? ( it is a full water level of a reservoir or river level intaking to the system).
* Copy from Applet T23, worksheet GTFM:C34.
22.5
24. Required weirs length (m):
* Copy from Applet T23, worksheet GTFM:C35.
26
25. Pumping capacity: provide the pumping capacity (m3/s).
* Answer if there is a pumping, see the irrigation project form T22.
26. Responsibility for operation and maintenance: is there a Farmer Water User Comity (FWUC) or similar group of people who are willing to take responsibility to operate and maintain the structure?
� Yes
� No
27. Who will operate and maintain the irrigation structure?
Commune council
28. Remark:
Don’t forget to upload “Applet” that you used in your calculation.
�

Part 2: Technical Forms
Study and Design Guidelines I-51
2.8 Water Supply, Group Output Code 1030000
2.8.1 Form T31 Water Supply
Technical Form T31 is used for all Water Supply Infrastructure projects including Wells, Ponds, Rainwater storage, and Piped water systems.
Not different from the Transport and Irrigation Technical Forms one Form T31 can only be used for one output, e.g. if a project comprises a ring well, a mixed well, a water storage tank and a piped deliver system, there must be four forms T31.
Because one Form T31 includes all of the questionnaires of Wells, Ponds, Rainwater storage, and Piped water systems, it is only necessary to answer to the questions related to the chosen outputs, e.g. if a project contains only a ring well, answer only questions related to well, and skip questions of ponds. Advice on questions needed to be answered and skipped are given in the Project Generator.
Another feature of Form T31 is that the Project Generator will require it to be completed if there is a water supply associated with another infrastructure output, e.g. a well for a school or health post.
FormFirstly, create proposed output and then answer the below questions on:
� General project information – this fills automatically from information previously filled immediately when creating project.
� Project location – enter the GPS coordinates of the structure.
� Number of proposed outputs – enter the number or sizes of the proposed output selected above.
� Purpose of water supply – Select from four options: domestic, school, health facility or other.
� Information about number of users – the questions identify the number and type of users; these are for statistical purposes not for calculation although the information can be used for a hand calculation if needed (see Part 5 of this Technical Manual).
� Maintenance – manual entry of who will maintain the water supply facility.
� Existing water supply – the questions are focused on where the people who will use the new water supply are getting water at present, this provides an indication of the benefit of the new water supply.
� Information about site of proposed facility – the questions focus on ownership of the land used for the water supply and whether there is a flood risk which could interrupt or permanently contaminate the water supply.
� Existing wells – for any water supply project that includes a new well or pond information from existing wells is the best indicator of water depth and variation over the year, water quantity and quality, the type of ground or rock where the well is sunk. Take time to collect and consider the information from as many wells as is practical. The questions are answered for each existing well.
� Proposed well(s) – if new wells are required the questions concern the location, well depth, water depth and ground conditions at the well site, and potential causes of contamination. Some of the questions may be difficult to answer but make best use of information from existing wells or other local knowledge. The questions are answered for each well proposed.

Part 2: Technical Forms
Study and Design Guidelines I-52
� Suitable pump for well – the dynamic water level for the proposed well determines the type of pump which can be selected.
� Proposed pond – the main issues for a pond are where the water will come from to fill it and whether it will have any water during the dry season. Ponds in sandy soil will may fill by groundwater flow but if groundwater level drops below the bottom of the pond during the dry season any water in the pond will soak away. Ponds in clay soils will not leak but rely on rainfall, water from a stream or deeper well during the dry season.
� Each form is completed by confirming the required outputs which will generate the drawings and quantities for template designs which have been loaded into the Project Generator. Where no template exist, the description and quantities will have to be prepared separately.
ExampleThe example is for a school water supply and comprises two outputs:
� Drilled well with VN No6 pump.
� Plastic rainwater tank filled by roof runoff.
For this example the attachments generated by the Project Generator will be:
1. Template drawings for the drilled well with VN No6 pump. At the time of preparation of this manual there was no template for a plastic rainwater tank and roof collection system, the particular requirements will have to be prepared for the project e.g. by reference to MoEYS standards (See Part 3 of this Technical Manual).
2. Quantities table to allow calculation of cost estimate will be produced by the project generator. The water tank can be measured as ‘1 item’ (See Part 4 of this Technical Manual).
3. Specification (see Part 6 of this Technical Manual).
4. Construction check lists (see Part 7 of this Technical Manual).
The flow chart and example Project Generator output follow below.
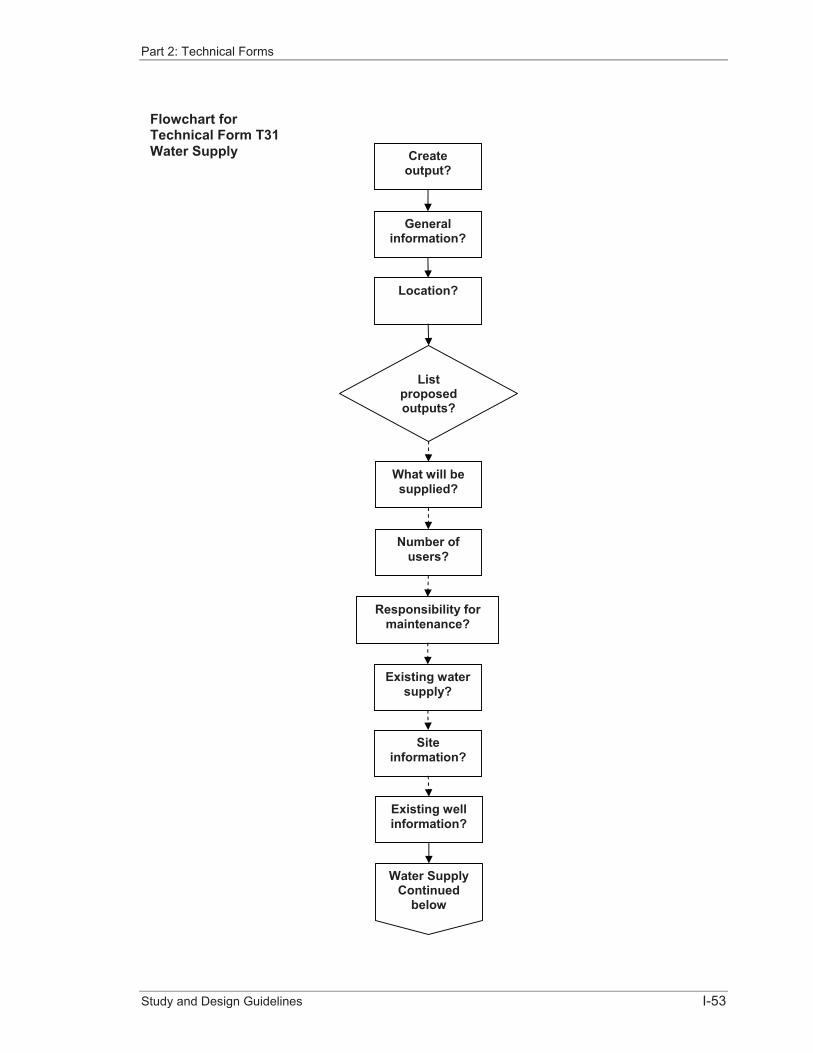
Part 2: Technical Forms
Study and Design Guidelines I-53
General information?
Location?
What will be supplied?
Listproposed outputs?
Number of users?
Responsibility for maintenance?
Existing water supply?
Siteinformation?
Existing well information?
Water Supply Continued
below
Flowchart for Technical Form T31 Water Supply Create
output?

Part 2: Technical Forms
Study and Design Guidelines I-54
or or
oror
Water Supply Continued from above
Proposedwell(s)?
ProposedPond(s)?
ProposedTank(s)?
Proposed pipe system?
Recommended Pump (advice)
Confirm well outputs?
Confirm pond outputs?
Confirm tank outputs?
Confirm pipe outputs?
Well output codes
Pond output codes
Tank output codes
Pipe output codes
� Drawings � Quantities
� Drawings � Quantities
� Drawings � Quantities
� Drawings � Quantities

Part 2: Technical Forms
Study and Design Guidelines I-55
Example Project Generator print Form T31 Water Supply
Form T31 Water supply (VN6 pump) Province : Kampong cham District : Sreisanthor S/C:Roseisrok
Name of project : Well for primary school Code of S/C : 31411
Name of TSO : Seila Date of form preparation : 20-07-2009
� Location: where is the water supply located within the Sangkat/Commune?
Phsar Leu primary school
� Provide the coordinates of GPS.
X of GPS Y of GPS 304010 1528230
� Number of proposed output: provide the number of proposed output?
* Remark: Form T31 is only for one water supply output, it mean that, if you have many exactly the same output and same output data, you just make one output, answer just one technical form and provide the number of those output.
1
� Purpose of water supply: for what purpose is the water supply used?
If the “Village”, answer the question 5, if “School” or “Health center”, answer question 6.
� Village
� School
� Health centre
� Information about number of users: how many people use the water supply? In which village do they live?
* Totalize the numbers above and write it down in the last row.
Name of village people in village number of family using the water supply
� Number of supplier in school and health post

Part 2: Technical Forms
Study and Design Guidelines I-56
* If you chose “School” in the answer above, write down only the number of rooms and number of students. If you choose “Health post” write down only the number of users in the health center.
Number of school rooms number of students or health post 8 364
� Maintenance: Who will maintain the water supply?
Provincial department of education
� Existing water supply: how many families use the existing water supply?
* if the existing water supply is for school, write down only “use for school”.
Use for school
� Have the families who will use the supply agreed to form a Water Supply Committee?
� Yes
� No
� Where does the domestic water used by these people come from now?
* Source: watercourse, natural pond, dug pond, rain water harvesting, spring, village well, household will, water-point piped. Totalize the number of users, and then write it down in the last row.
Source number of users distance to the centre of village (km) Village well 250 0.3 Family well 200 0
� Information about proposed facility: Who owns the land where the new facility will be constructed?
* if the land is in private ownership, answer the question 12.
� Community
� Private
� Does the landowner agree to construction and unrestricted use of the facility?
� Yes

Part 2: Technical Forms
Study and Design Guidelines I-57
� No
� Does the location of the facility ever flood?
* if “Yes”, answer the questions 14 and 15.
� Yes
� No
� What is the depth of flooding in meters ?
0.15
� What type of flooding?
� Seasonal and prolonged flooding from high river levels
� Short periods of flooding following heavy rain
� Existing well: what type of well are in the village or near vicinity?
* You should choose the existing well which is closest to the new well
� Dug well
� Drilled well
� Mixed well
17. Provide the coordinates of GPS
Type of well X of GPS Y of GPS Dug well 304090 1528230
18. What is the distance (closest) from the existing well to the proposed well (km)?
0.30
19. Who owns this existing well?
villagers
20. Is the existing well used for domestic water or farming?

Part 2: Technical Forms
Study and Design Guidelines I-58
� Domestic water
� Framing
21. How old is the existing well?
4 years
22. How deep is the existing well?
20
23. What is the static water level in the dry seasons?
4
24. What is the static water level in the wet seasons?
2
25. How many families use the sell?
40
26. Does the existing well have enough water all year?
� Enough
� Not enough
27. What does water from the well taste like?
� Note taste
� Salty
� Bitter
28. What is the color of the water in the existing well?
� Clear
� Gray
� Yellow

Part 2: Technical Forms
Study and Design Guidelines I-59
� Brown
29. Does it smell?
� Yes
� No
30. Has the water from the existing well ever been tested for arsenic?
� Yes, ever
� No, never
31. What kind of soil or rock is the well sunk in?
From depth (m) to depth (m) kind of soil or rock 0 6 silty sand6 20 sandstone
32. How do you know about the information on the soil or rock?
Commune chief told me.
33. How are the other well ?
� No information on other wells
� To many well to list
� Other wells similar
34. Proposed well: name of proposed well
Phsar Leu primary school well
35. What kinds of soil or rock will the well sunk in?
From depth (m) to depth (m), kind of soil or rock.
From depth (m) to depth (m) kind of soil or rock 0 6 silty sand6 20 sandstone
36. How deep is the water bearing soil or rock (the aquifer)?

Part 2: Technical Forms
Study and Design Guidelines I-60
6
37. What is the depth of proposed well?
20
38. What is the static water level in the dry season (depth below ground in metres)?
4
39. What is the estimated dynamic water level in the dry season (drawn down by pumping) (depth below ground in metres)?
6
40. How do you know the information on the proposed well?
Village well
41. Where will wastewater from the new well drain to? If “Other”, answer the question 43.
� Soak away
� Watercourse
� Pond
� Other42. If “Other”, list your answers. 43. Is there anything close to the well that could cause contamination of the well?
* If “Other”, answer the question 45.
� None
� Latrine
� Animal pens
� Cmetery
� Chemical store
� Fuel store
� Other
44. If other, list your answers.
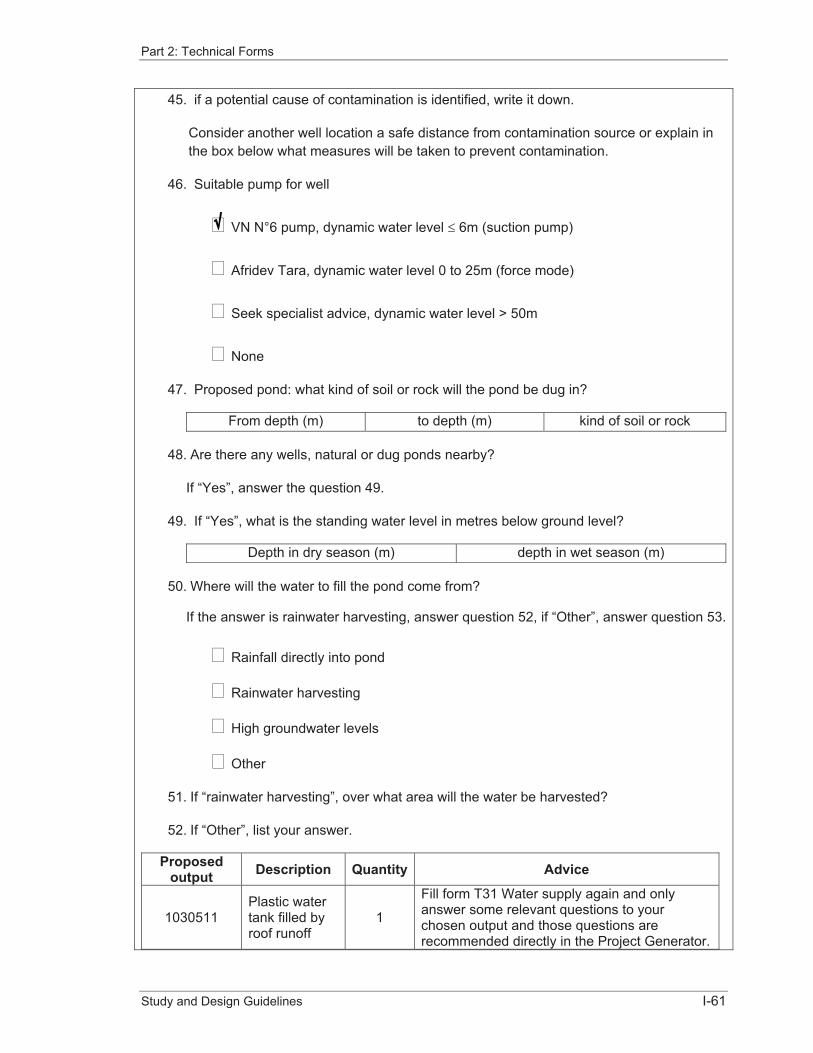
Part 2: Technical Forms
Study and Design Guidelines I-61
45. if a potential cause of contamination is identified, write it down.
Consider another well location a safe distance from contamination source or explain in the box below what measures will be taken to prevent contamination.
46. Suitable pump for well
� VN N°6 pump, dynamic water level � 6m (suction pump)
� Afridev Tara, dynamic water level 0 to 25m (force mode)
� Seek specialist advice, dynamic water level > 50m
� None
47. Proposed pond: what kind of soil or rock will the pond be dug in?
From depth (m) to depth (m) kind of soil or rock
48. Are there any wells, natural or dug ponds nearby?
If “Yes”, answer the question 49.
49. If “Yes”, what is the standing water level in metres below ground level?
Depth in dry season (m) depth in wet season (m)
50. Where will the water to fill the pond come from?
If the answer is rainwater harvesting, answer question 52, if “Other”, answer question 53.
� Rainfall directly into pond
� Rainwater harvesting
� High groundwater levels
� Other
51. If “rainwater harvesting”, over what area will the water be harvested?
52. If “Other”, list your answer.
Proposedoutput Description Quantity Advice
1030511Plastic water tank filled by roof runoff
1
Fill form T31 Water supply again and only answer some relevant questions to your chosen output and those questions are recommended directly in the Project Generator.

Part 2: Technical Forms
Study and Design Guidelines I-62
2.9 Education Facility, Group Output Code 1040000
2.9.1 Form T41 Education Facility
Technical Form T41 is used for all Education Facility Infrastructure projects including buildings, furniture, boundary walls and gates.
Not different from the Transport and Irrigation Technical Forms one Form T31 can only be used for one output, e.g. if a project comprises a school building, furniture, and boundary walls, there must be three forms T41.
Because one Form T41 includes all of the questionnaires of school building, furniture, boundary walls, and gates, it is only necessary to answer to the questions related to the chosen outputs and skip unrelated questions. Advice on questions needed to be answered and skipped are given in the Project Generator.
However when a project such as a new school building includes a water supply facility such as a well, a Water Supply Form T31 is generated and must be filled. Similarly if a latrine building is needed then a form Sanitation Form T101 is generated and must be filled.
FormFirstly, create proposed output and then answer the below questions on:
� General project information – form this fills automatically from information previously filled immediately when creating project.
� Project location – enter the GPS coordinates of the education facility.
� Quantity of proposed outputs – enter the number or length of the proposed outputs chosen above.
� Information about education requirement – the question concern the numbers of children from different villages who use the school, travel distance, number of existing and proposed classrooms, availability of teachers and the school management committee.
� Physical characteristics of the site – questions relate to flooding, UXO, land title, whether the site is large enough, whether there is a water supply and whether sanitation facilities exist.
� Foundation soils – the form provides for filling trial pit logs and recording DCP results, as many as necessary.
ExampleThe example is for:
� a new five room school,
� primary school furniture (25 four student desks, 50 two student desk, five teacher tables and chairs)
� 80 m of boundary wall,
� four latrines, and
� one well
For this example the attachments generated by the Project Generator will be:
1. Template drawing(s) when available for chosen output code (See Part 3 of this Technical Manual).
2. Forms T31 and T101 generated for outputs in Water Supply and Sanitation respectively

Part 2: Technical Forms
Study and Design Guidelines I-63
3. Quantities table to allow calculation of cost estimate will be produced by the project generator (See Part 4 of this Technical Manual).
4. Specification (see Part 6 of this Technical Manual).
5. Construction check lists (see Part 7 of this Technical Manual).
The flow chart and example Project Generator output follow below.
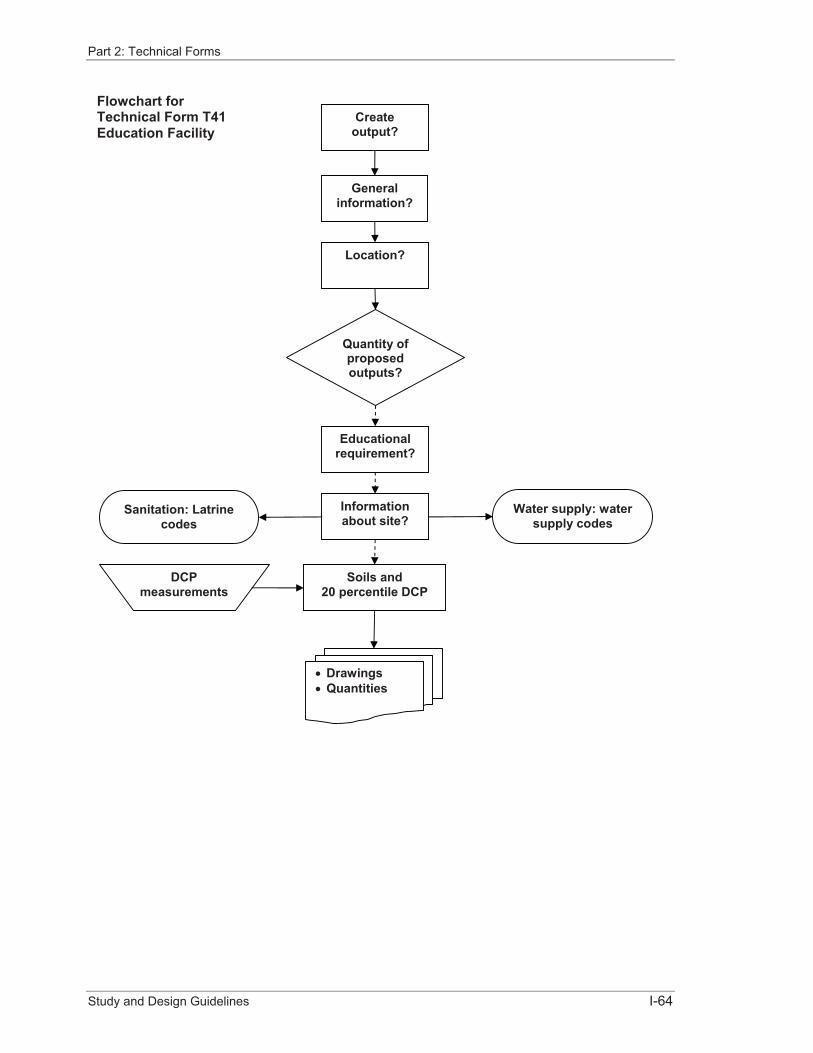
Part 2: Technical Forms
Study and Design Guidelines I-64
General information?
Location?
Educationalrequirement?
Quantity of proposed outputs?
Informationabout site?
Sanitation: Latrine codes
DCPmeasurements
Soils and 20 percentile DCP
Water supply: water supply codes
� Drawings � Quantities
Flowchart for Technical Form T41 Education Facility
Create output?

Part 2: Technical Forms
Study and Design Guidelines I-65
Example Project Generator print Form T41 Education Facility
Form T41 Education Brick School of 5 room
Province : Kampong cham District : Sreisanthor S/C:Roseisrok
Name of project : Roseisrok Primary School Code of S/C : 31411
Name of TSO : Seila Date of form preparation : 20-07-2009
1. Location: where is the education facility located within the Sangkat/Commune?
Describe the location of education facility.
1Km from Sreisanthor commune centre
2. Provide the coordinates of GPS
* Coordinate of school location
X of GPS Y of GPS
304010 1528230
3. List the number and length of the proposed facility.
* Rooms of the new school, list the number of room. Furniture: list the number of set of chairs and tables.
Primary school, training room, library, school dormitory, school yard, list the number of place. List the length of school wall and school fence in meters.
Bricks school 5 rooms with roof tile, concrete floor.
4. Information about education requirement: (about students)
How many students will use the school and which village will they come from?
Name of village Number of children go to the school
distance from village to school in kilometers
Phsar Leu 52 4 Phsar Chhnang 108 3
Chongkoh 84 1 Som Roang 120 0
5. Total number of children goes to the school.
364
6. About the number of classroom.
How many classrooms on the site now?

Part 2: Technical Forms
Study and Design Guidelines I-66
3
7. About the number of teachers
teachers provided by the education department
teachers will be hired for the school
Total number of teachers available
2 3 8
8. About the school management: is there a school parent’ committee?
� Yes
� No
9. Physical characteristics of the site: does the site ever flood in the wet season?
* if “Ever”, answer the two following questions.
� Ever
� Never
10. What is the maximum depth of flooding in meters?
0.15
11. What type of flooding?
� Seasonal flooding and prolonged by the high river level
� Short periods of flooding following heavy rain
12. Is the site free of mines and UXO?
* if “Yes”, answer the following question.
� Yes
� No
13. Does land title exist for the site?
* If “Yes”, answer the following questions.
� Yes

Part 2: Technical Forms
Study and Design Guidelines I-67
� No
14. What stage is the documentation (district, province…)?
Province
15. Is the site presently occupied?
* If “Yes”, answer the following questions
� Yes
� No
16. Whom or what? (E.g. building, rice field and will compensation be expected/demanded?)
Old school
17. Is the site presently walled or fenced?
� Yes
� No
18. Will land fill or embankments be needed to protect against flooding?
* If “Yes”, answer the question 19
� Yes
� No
19. If “Yes”, describe it.
20. Is there enough space for students to play sports?
� Yes
� No
21. Is there enough space to build more classrooms in the future?
� Yes
� No

Part 2: Technical Forms
Study and Design Guidelines I-68
22. What is the water supply at the site?
* If “Pond” or “Pumping well”, answer the following question
� None
� Pond
� Pumping well
� Piped supply from off site
23. Write down the dry season water level below ground (m)
2.6
24. How many existing latrines at the sites?
0
25. Foundation soils: (for school building construction, school fence and walls)
What kind of soil will the school be constructed on?
* Type of soil: gravel, silty sand, micaceous sand, lateritic sand, clayey sand, loams, organic clays, lateritic clays, dandy, silty or clayey peats.
Numberof trial pit
X of GPS
Y of GPS
Depth (m) Type of soil group of soil
1 304015 1528220 0.15 organicsilt
Fine grained, cohesive
1.5 silty sands course grained, non-cohesive
2.0 gravel course grained, non-cohesive
26. DCP test (mm/blow)
DCP (mm/blow) X of GPS Y of GPS 23 304015 152822015 304000 152822223 304030 1528218
27. 20 percentile of DCP (mm/blow)
30.2

Part 2: Technical Forms
Study and Design Guidelines I-69
Proposedoutput Description Quantity Advice
1040501primaryschoolfurniture
four student desks=25 two student desk= 50 teacher tables and chairs =5
Fill form T41 Education Facility again and only answer some relevant questions to your chosen output and those questions are recommended directly in the Project Generator.
1040405 boundary wall 80m
Fill form T41 Education Facility again and only answer some relevant questions to your chosen output and those questions are recommended directly in the Project Generator.
1100102 four latrines 1
Fill form T101 Sanitaiono and only answer some relevant questions to your chosen output and those questions are recommended directly in the Project Generator.
1030201 well 1
Fill form T31 Water supply and only answer some relevant questions to your chosen output and those questions are recommended directly in the Project Generator.

Part 2: Technical Forms
Study and Design Guidelines I-70
2.10 Health, Group Output Code 1050000
2.10.1 Form T51 Health Technical Form T51 provides for all Health infrastructure projects.
Not different from the Transport and Irrigation Technical Forms one Form T51 can only be used for one outputs, e.g. if a project comprises buildings, incinerator, and boundary fence, there must be three form T51.
Because one Form T51 includes all of the questionnaires of health building, Incinerator walls, fence and gates, it is only necessary to answer to the questions related to the chosen outputs. Advice on questions needed to be answered and skipped are given in the Project Generator.
However when a project such as a new health post includes a water supply facility such as a well, a Water Supply Form T31 is generated and must be filled. Similarly if a latrine building is needed then a form Sanitation Form T101 is generated and must be filled.
FormFirstly, create proposed output and then answer the below questions on:
� General project information – this fills automatically from information previously filled immediately when creating project.
� Project location – by entering the GPS coordinates of the education facility.
� Quantity of proposed outputs – enter the number or length of the proposed outputs chosen above.
� Information about health facility – the village, populations and distances travelled tpo reach the health facility as well as the availability of trained staff.
� Physical characteristics of the site – questions relate to flooding, UXO, land title, whether the site is large enough, whether there is a water supply and whether sanitation facilities exist.
� Foundation soils – the form provides for filling trial pit logs and recording DCP results, as many as necessary.
ExampleThe example is for:
� a concrete health post,
� 120 m of boundary fence,
� one wooden gate,
� one latrines building
� one rainwater collection and storage tank, and
� one well:
For this example the attachments generated by the Project Generator will be:
1. Template drawing(s) when available for chosen output code(s) (See Part 3 of this Technical Manual).
2. Forms T31 and T101 generated for outputs in Water Supply and Sanitation respectively
3. Quantities table to allow calculation of cost estimate will be produced by the project generator (See Part 4 of this Technical Manual).
4. Specification (see Part 6 of this Technical Manual).

Part 2: Technical Forms
Study and Design Guidelines I-71
5. Construction check lists (see Part 7 of this Technical Manual).
The flow chart and example Project Generator output follow below.
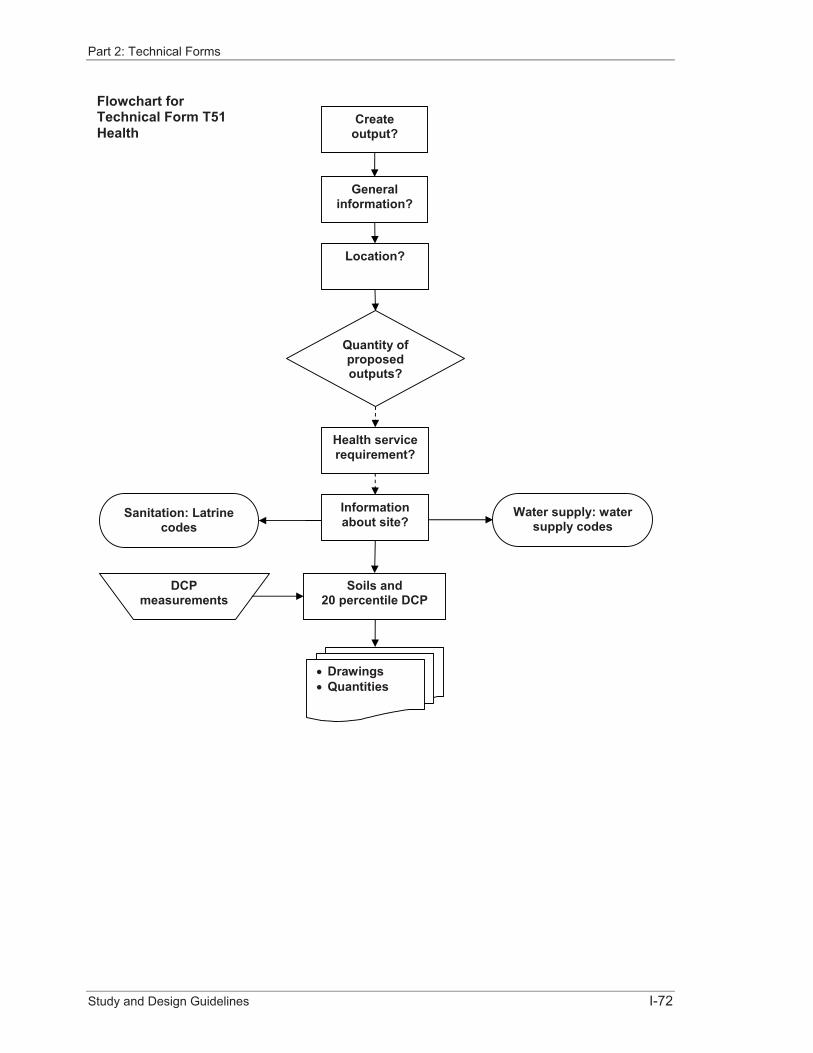
Part 2: Technical Forms
Study and Design Guidelines I-72
Flowchart for Technical Form T51 Health
� Drawings � Quantities
Water supply: water supply codes
Sanitation: Latrine codes
Soils and 20 percentile DCP
DCPmeasurements
Create output?
General information?
Location?
Health service requirement?
Quantity of proposed outputs?
Informationabout site?

Part 2: Technical Forms
Study and Design Guidelines I-73
Example Project Generator print Form T51 Health
Form T51 Health Concrete health centre
Province : Kampong cham District : Sreisanthor S/C:Roseisrok
Name of project : Roseisrok Health Post Code of S/C : 31411
Name of TSO : Seila Date of form preparation : 20-07-2009
1. Location: where is the health facility located within the Sangkat/Commune?
Next to the commune centre, in Phsar Leu market
2. Provide the coordinates of GPS
* First line is the starting point; last line is the ending point
X of GPS Y of GPS
304010 1528230
3. List the number and length of output chosen.
* Fence in meter, and other output in number.
1
4. Information about health facility: how many people will use the health facility and which villages will they come from?
* Copy the total number of people from the Project Information Form.
388
5. How many trained staff will be provided by the health department?
5
6. How many staff will be hired for the health facility?
4
7. What is the total number of staff available?
* totalize both numbers above.
9
8. Physical characteristics of the site: does the site ever flood in the wet season?
* if “Ever”, answer the following questions.

Part 2: Technical Forms
Study and Design Guidelines I-74
� Ever
� Never
9. If “Ever”, what is the maximum depth of flooding in meters?
10. If “Ever”, what type of flooding?
� Seasonal and prolonged flooding from high river levels.
� Short periods of flooding following heavy rain.
11. Is the site free of mines and UXO?
� Yes
� No
12. Does land title exist for the site? If yes, at what stage is the documentation (district, province…)
Province
13. Is the site presently occupied? If yes, list them.
* e.g. building, rice field… will compensation be expected/demanded?
Old health post
14. Is the site presently walled or fenced?
� Yes
� No
15. Will land fill or embankments be needed to protect against flooding?
� Yes
� No
16. What is the water supply at the site?
� None
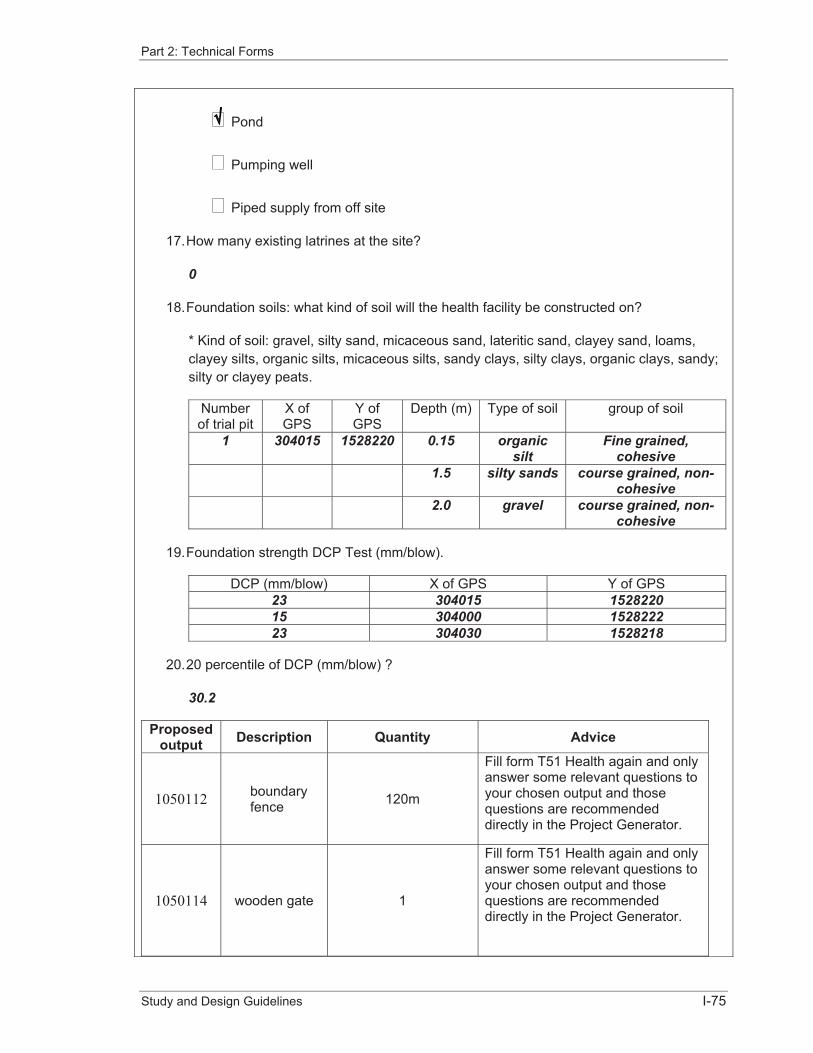
Part 2: Technical Forms
Study and Design Guidelines I-75
� Pond
� Pumping well
� Piped supply from off site
17. How many existing latrines at the site?
0
18. Foundation soils: what kind of soil will the health facility be constructed on?
* Kind of soil: gravel, silty sand, micaceous sand, lateritic sand, clayey sand, loams, clayey silts, organic silts, micaceous silts, sandy clays, silty clays, organic clays, sandy; silty or clayey peats.
Numberof trial pit
X of GPS
Y of GPS
Depth (m) Type of soil group of soil
1 304015 1528220 0.15 organicsilt
Fine grained, cohesive
1.5 silty sands course grained, non-cohesive
2.0 gravel course grained, non-cohesive
19. Foundation strength DCP Test (mm/blow).
DCP (mm/blow) X of GPS Y of GPS 23 304015 152822015 304000 152822223 304030 1528218
20. 20 percentile of DCP (mm/blow) ?
30.2
Proposedoutput Description Quantity Advice
1050112 boundaryfence 120m
Fill form T51 Health again and only answer some relevant questions to your chosen output and those questions are recommended directly in the Project Generator.
1050114 wooden gate 1
Fill form T51 Health again and only answer some relevant questions to your chosen output and those questions are recommended directly in the Project Generator.

Part 2: Technical Forms
Study and Design Guidelines I-76
1100102 four latrines 1
Fill form T101 Sanitation and only answer some relevant questions to your chosen output and those questions are recommended directly in the Project Generator.
1030511rainwater
collection and storage tank
1
Fill form T31 Water supply and only answer some relevant questions to your chosen output and those questions are recommended directly in the Project Generator.
1030201 well 1
Fill form T31 Water supply again and only answer some relevant questions to your chosen output and those questions are recommended directly in the Project Generator.
Part 2: Technical Forms
Study and Design Guidelines I-77
2.11 Sanitation, Group Output Code 1100000
2.11.1 Form T101 Sanitation Technical Form T101 provides for all Sanitation infrastructure projects.
Not different from the Transport and Irrigation Technical Forms one Form T101 can only be used for one output, e.g. if a project comprises several sections of covered drain and pipe cross connections, there must be two form T101.
Because one Form T101 includes all of the questionnaires of laterine, waste water, Solid waste management, and drainage, it is only necessary to answer to the questions related to the chosen. Advice on questions needed to be answered and skipped are given in the Project Generator.
Form� General project information – this fills automatically from information previously filled
immediately when creating project.
� Project location – enter the GPS coordinates of the proposed output, if it is a linear project such as a covered drain enter the start and finish coordinates, if it is a point project such as school laterine, enter a coordinate of the laterine.
� Quantity of proposed outputs – enter the number or length of the proposed outputs chosen above.
� Capacity of drain – questions need to be answered if one of the project outputs is a drain. Questions include the plan area of the ground drained, guidance is given on estimating this. The default runoff rate is 3.5 l/s/ha but this can be overwritten (but do not enter a lower rate). The form asks if water from upstream can flow into the drain and the catchment area; if the area is � 1 km2 (100 ha) then the form includes discharge for the area, if the area is larger then it cannot pass down the drain because the flow would be too large and another outfall must be found.
� hydraulic design of channel drain – if the output is a channel drain Applet T101 calculates the size of the drain. There is an option to accept or override the preceding capacity calculation (but do not enter a lower capacity). Enter the bed levels and length of the drain, bed width, side slope and Manning’s ‘n’ using the guidance on the form. The calculation is iterative. A water depth is entered: if it is too small the Applet instructs to ‘Increase depth’; if it is too large the form instructs to ‘Decrease depth’; if the depth is correct (within a band of tolerance) the form prints ‘Depth OK’. The Applet then outputs the: minimum height of banks above bed level; width between tops of bank; and velocity of design flow. After that you need to copy all of these results to the generator.
� Hydraulic design of pipe drain (once for each drain) – enter the depth of the bottom of the pipe below ground and the length of drain. You then calculate the maximum hydraulic gradient. Use the tables on the form to select the minimum pipe diameter, it is permitted to go a size or more up to a larger diameter. There are different tables for plastics and concrete pipes.
ExampleThe example is for covered channel drains both sides of road through a village center, each about 100 m in length, including a connecting pipe beneath the road to outfall.
For this example the attachments generated by the Project Generator will be:
1. Template drawing(s) when available for chosen output code(s) (See Part 3 of this Technical Manual).

Part 2: Technical Forms
Study and Design Guidelines I-78
2. Quantities table to allow calculation of cost estimate will be produced by the project generator (See Part 4 of this Technical Manual).
3. Specification (see Part 6 of this Technical Manual).
4. Construction check lists (see Part 7 of this Technical Manual).
The flow chart and example Project Generator output follow below.

Part 2: Technical Forms
Study and Design Guidelines I-79
Applet calculates size of channel
General information?
Location?
Capacity of drain(s)?
Quantity of proposed outputs?
Size of drain(s)?
� Drawings � Quantities
Calculation in the form
T101 Channel design.xls
Flowchart for Technical Form T101 Sanitation
Create output?
Applet calculates advise size of pipe
Pipe chart.xls
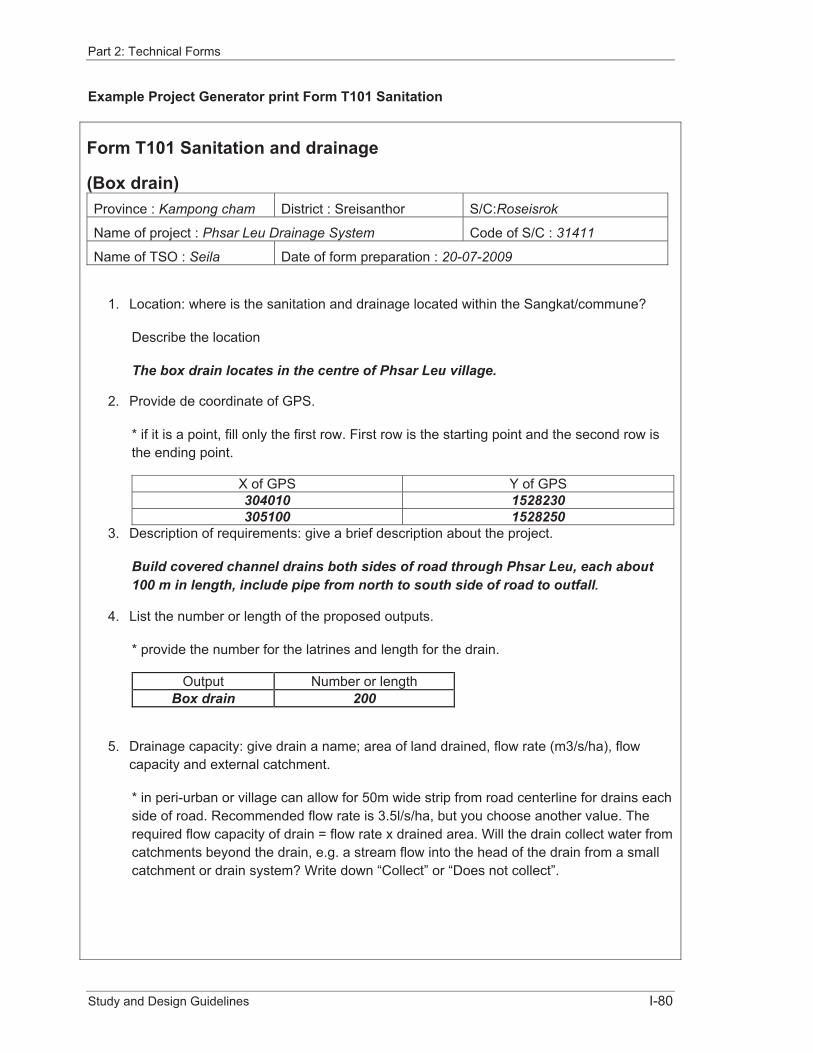
Part 2: Technical Forms
Study and Design Guidelines I-80
Example Project Generator print Form T101 Sanitation
Form T101 Sanitation and drainage
(Box drain) Province : Kampong cham District : Sreisanthor S/C:Roseisrok
Name of project : Phsar Leu Drainage System Code of S/C : 31411
Name of TSO : Seila Date of form preparation : 20-07-2009
1. Location: where is the sanitation and drainage located within the Sangkat/commune?
Describe the location
The box drain locates in the centre of Phsar Leu village.
2. Provide de coordinate of GPS.
* if it is a point, fill only the first row. First row is the starting point and the second row is the ending point.
X of GPS Y of GPS 304010 1528230305100 1528250
3. Description of requirements: give a brief description about the project.
Build covered channel drains both sides of road through Phsar Leu, each about 100 m in length, include pipe from north to south side of road to outfall.
4. List the number or length of the proposed outputs.
* provide the number for the latrines and length for the drain.
Output Number or length Box drain 200
5. Drainage capacity: give drain a name; area of land drained, flow rate (m3/s/ha), flow capacity and external catchment.
* in peri-urban or village can allow for 50m wide strip from road centerline for drains each side of road. Recommended flow rate is 3.5l/s/ha, but you choose another value. The required flow capacity of drain = flow rate x drained area. Will the drain collect water from catchments beyond the drain, e.g. a stream flow into the head of the drain from a small catchment or drain system? Write down “Collect” or “Does not collect”.

Part 2: Technical Forms
Study and Design Guidelines I-81
Name of drain Drained area (ha)
Flow rate (l/s.ha)
Flow capacity (l/s)
Externalcatchment
Box drain, north of
Phsar Leu
0.5 0.5 2.5 Collect
Box drain, south of
Phsar Leu
0.5 0.5 2.5 Does not collect
6. Remark
* if you chose “Collect”, answer the two following questions.
7. Describe briefly how the extra catchment affects the requirements, e.g. it may only affect a drain one side of the road.
Name of drain Description Box drain north of Phsar Leu There is irrigation area of 30ha flows in
the north Phsar Leu box drain 8. Give a name of drain collecting water from external catchment, area of external
catchment, flow rate (l/s/ha) and extra flow capacity.
* if catchment area > 1.0Km2, flow from this catchment will be too big for a culvert or a drain, so let think about the flow conveyance or a special advice.
* Recommended drain flow capacity is 3.5l/s.ha, but you can choose another one.
* flow capacity extra = catchment area (ha) x flow rate (l/s.ha).
Name of drain External catchment area (ha)
Flow rate (l/s.ha) Extra flow capacity (l/s)
Box drain north of Phsar Leu
30 3.5 105
9. Calculate the total design flow capacity for box culvert (l/s).
* Total design flow capacity = drain flow capacity (l/s) + extra flow capacity of external catchment (l/s)
Name of drain Design flow capacity (l/s) Box drain north of Phsar Leu 107.5 Box drain south of Phsar Leu 2.5
10. Design of box drain: remark
You must use “Applet Form T101 Drain” to determine the design flow, channel bed level, bottom width and channel velocity.
11. Result of the design of box drain and drain from Applet T101.
* Skip it if you don’t design the box drain. Copy the answer from Applet T101 that you used to calculate.

Part 2: Technical Forms
Study and Design Guidelines I-82
Name of drain Required flow capacity (l/s)
Bed depth (m) Width of box drain (m)
Design velocity (m/s)
Box drain north of
Phsar Leu
107.5 0.49 0.6 0.46
Box drain south of
Phsar Leu
2.5 0.19 0.15 0.18
12. Design of pipe drain: remark
Use “Applet Pipe Chart” to determine the diameter of pipe drain.
13. Result of the design of pipe drain from Applet Pipe Chart
* Skip it if you don’t design the pipe drain.
* calculate the flow capacity, see the suitable pipe and copy the answer from Applet Pipe Chart that you used.
Nameof drain
Requiredflowcapacity(l/s)
Pipedraindepth(m)
Pipelength(m)
Efficienthydraulicgradient
Type of pipe
Minimum diameter(m)
Chosendiameter(m)
14. Remark
Upload the Applets you’ve used to get the result as above.
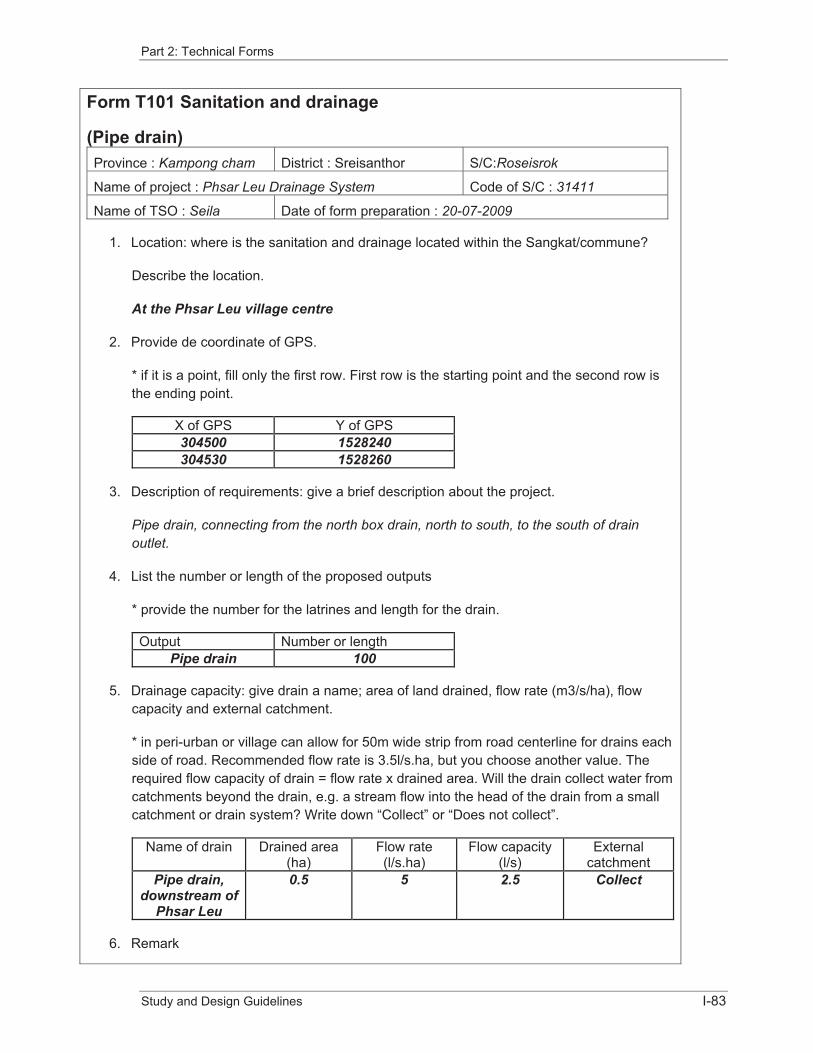
Part 2: Technical Forms
Study and Design Guidelines I-83
Form T101 Sanitation and drainage
(Pipe drain) Province : Kampong cham District : Sreisanthor S/C:Roseisrok
Name of project : Phsar Leu Drainage System Code of S/C : 31411
Name of TSO : Seila Date of form preparation : 20-07-2009
1. Location: where is the sanitation and drainage located within the Sangkat/commune?
Describe the location.
At the Phsar Leu village centre
2. Provide de coordinate of GPS.
* if it is a point, fill only the first row. First row is the starting point and the second row is the ending point.
X of GPS Y of GPS 304500 1528240 304530 1528260
3. Description of requirements: give a brief description about the project.
Pipe drain, connecting from the north box drain, north to south, to the south of drain outlet.
4. List the number or length of the proposed outputs
* provide the number for the latrines and length for the drain.
Output Number or length Pipe drain 100
5. Drainage capacity: give drain a name; area of land drained, flow rate (m3/s/ha), flow capacity and external catchment.
* in peri-urban or village can allow for 50m wide strip from road centerline for drains each side of road. Recommended flow rate is 3.5l/s.ha, but you choose another value. The required flow capacity of drain = flow rate x drained area. Will the drain collect water from catchments beyond the drain, e.g. a stream flow into the head of the drain from a small catchment or drain system? Write down “Collect” or “Does not collect”.
Name of drain Drained area (ha)
Flow rate (l/s.ha)
Flow capacity (l/s)
Externalcatchment
Pipe drain, downstream of
Phsar Leu
0.5 5 2.5 Collect
6. Remark
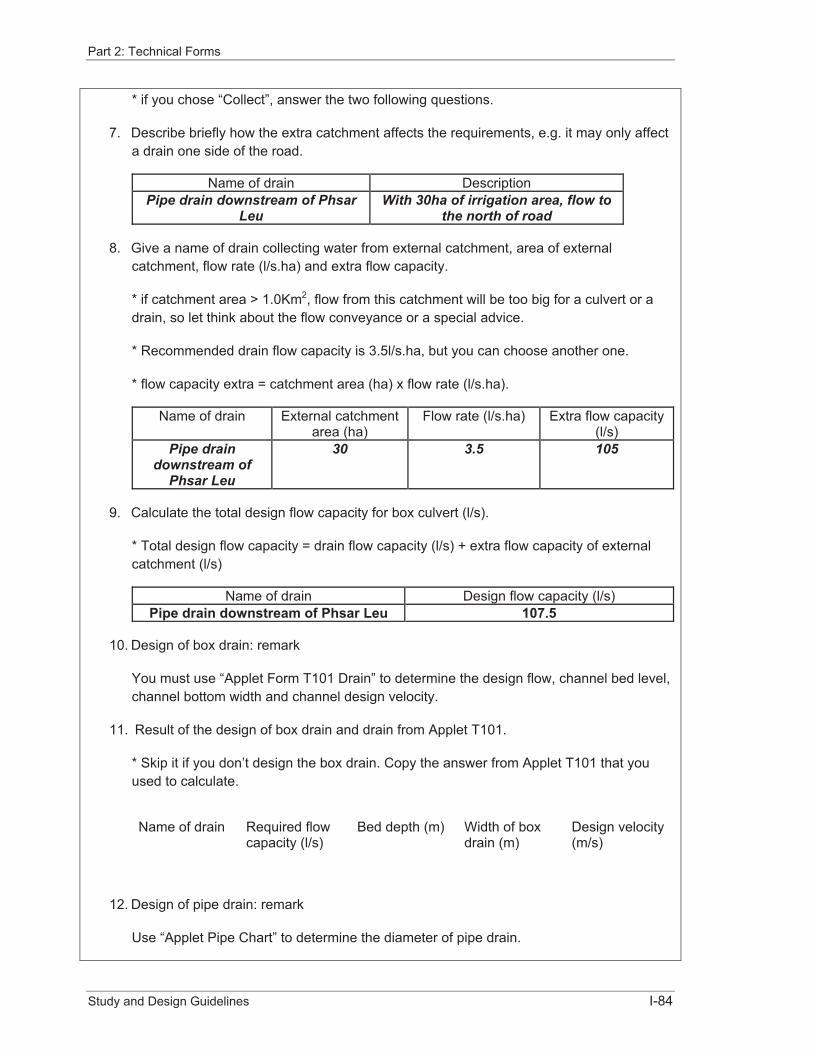
Part 2: Technical Forms
Study and Design Guidelines I-84
* if you chose “Collect”, answer the two following questions.
7. Describe briefly how the extra catchment affects the requirements, e.g. it may only affect a drain one side of the road.
Name of drain Description Pipe drain downstream of Phsar
LeuWith 30ha of irrigation area, flow to
the north of road
8. Give a name of drain collecting water from external catchment, area of external catchment, flow rate (l/s.ha) and extra flow capacity.
* if catchment area > 1.0Km2, flow from this catchment will be too big for a culvert or a drain, so let think about the flow conveyance or a special advice.
* Recommended drain flow capacity is 3.5l/s.ha, but you can choose another one.
* flow capacity extra = catchment area (ha) x flow rate (l/s.ha).
Name of drain External catchment area (ha)
Flow rate (l/s.ha) Extra flow capacity (l/s)
Pipe drain downstream of
Phsar Leu
30 3.5 105
9. Calculate the total design flow capacity for box culvert (l/s).
* Total design flow capacity = drain flow capacity (l/s) + extra flow capacity of external catchment (l/s)
Name of drain Design flow capacity (l/s) Pipe drain downstream of Phsar Leu 107.5
10. Design of box drain: remark
You must use “Applet Form T101 Drain” to determine the design flow, channel bed level, channel bottom width and channel design velocity.
11. Result of the design of box drain and drain from Applet T101.
* Skip it if you don’t design the box drain. Copy the answer from Applet T101 that you used to calculate.
Name of drain Required flow capacity (l/s)
Bed depth (m) Width of box drain (m)
Design velocity (m/s)
12. Design of pipe drain: remark
Use “Applet Pipe Chart” to determine the diameter of pipe drain.

Part 2: Technical Forms
Study and Design Guidelines I-85
13. Result of the design of pipe drain from Applet Pipe Chart
* Skip it if you don’t design the pipe drain.
* calculate the flow capacity, see the suitable pipe and copy the answer from Applet Pipe Chart that you used.
Name of drain
Requiredflowcapacity(l/s)
Pipedraindepth(m)
Pipelength(m)
Efficienthydraulicgradient
Type of pipe
Minimum diameter(m)
Chosendiameter(m)
Pipe drain downstream of Phsar Leu
107.5 1 100 0.008 Concrete 0.8 0.8
14. Remark
Upload the Applet you used to get the result as above.
I-86
PART 3: TEMPLATE DESIGNS FOR LOCAL INFRASTRUCTURE
Part 3: Template Designs for Local Infrastructure
Study and Design Guidelines I-87
3 Template Designs for Local Infrastructure
3.1 Background The C/S Fund is able to support a wide range of small infrastructure projects. The PIM at Annex 2 lists common and know types of infrastructure project allocating each a seven-digit numerical output codes. This is a ‘live list’ which might be amended and added too as special and generic project requests evolve over time.
In order to speed the process a selection of standard ‘Template’ designs was developed under the Seila Program, these included types of infrastructure most commonly requested by the communes or sangkats, and also a few simple but rarely built designs. This system proved popular and successful with the communes and sangkats as evidenced by the large number of ‘Seila’ projects built around Cambodia, albeit that some types of infrastructure are prone to technical deficiencies.
The ‘Template’ designs comprised simple drawings. Parts and some of the drawings were prepared using AutoCAD but the finished drawings were assembled as MS Excel spreadsheets. This allowed selection of alternative dimensions and automatic calculation of quantities. This was applied using the ‘Seila Template Program’; which is a customized software package.
Although it was very useful and worked well within its limits, the Seila Template Program was found to be rather inflexible. In particular it was difficult to change or add new template designs. It was therefore decided that for NCDD the C/S Fund process needed a new program which allowed easy changes and additions of templates. The new program is called the ‘Project Generator’. At the same time it was decided to review and update all the existing template designs.
3.2 NCDD Templates The new NCDD templates are AutoCAD drawings. However, they are saved for the project generator as Adobe PDF files. The Project Generator outputs the chosen template drawings to the project folder as PDF files. This means there is no need for Technical Assistant to have or use AutoCAD.
The NCDD template drawings no longer incorporate quantity spreadsheets (Note January 2009 PIM needs correcting on this point). These are now been separate MS Excel files for each template. They are called in and output separately by the Project Generator. This is discussed at Section 5.
3.3 Available Templates As previously, templates have been produced for common infrastructure outputs. There are not templates for every output code. The intention is that whenever an output is required for which there is no template, then this can be prepared as a new template and added to the Project Generator at that time.
Available templates are not listed here because the list is expected to change and increase regularly.
3.4 How to Read and Use the Drawings
3.4.1 Size The Template drawings for infrastructure outputs are prepared at original paper size A3. They should be printed at A3 size when they are used as drawings for the construction contract so that they are easy to read. Either photocopy the drawings to A3 size, or print them at A3 size from the computer.
The drawings can also be printed at A4 size, the letter sizes and other details have been chosen to be readable at this size, although they are obviously smaller than at A3 size. It is advised to use ‘standard’ or ‘high’ quality printer setting at A4 size, not ‘low’ or ‘economy’
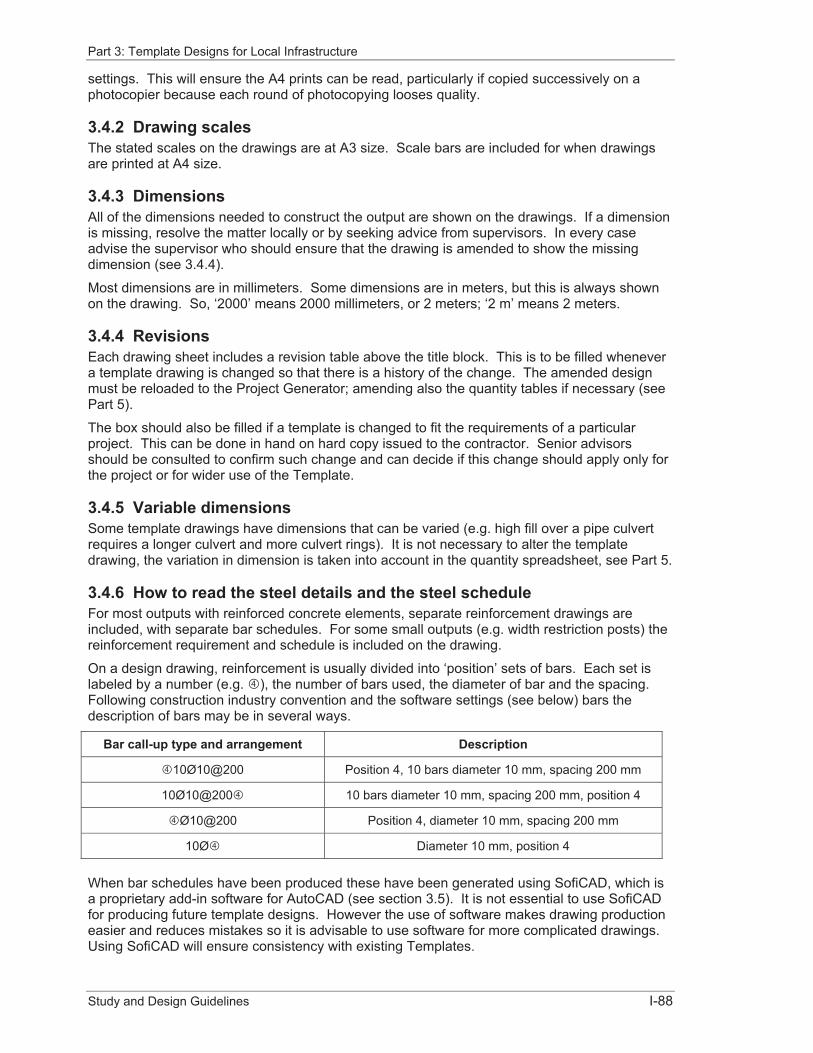
Part 3: Template Designs for Local Infrastructure
Study and Design Guidelines I-88
settings. This will ensure the A4 prints can be read, particularly if copied successively on a photocopier because each round of photocopying looses quality.
3.4.2 Drawing scales The stated scales on the drawings are at A3 size. Scale bars are included for when drawings are printed at A4 size.
3.4.3 Dimensions All of the dimensions needed to construct the output are shown on the drawings. If a dimension is missing, resolve the matter locally or by seeking advice from supervisors. In every case advise the supervisor who should ensure that the drawing is amended to show the missing dimension (see 3.4.4).
Most dimensions are in millimeters. Some dimensions are in meters, but this is always shown on the drawing. So, ‘2000’ means 2000 millimeters, or 2 meters; ‘2 m’ means 2 meters.
3.4.4 Revisions Each drawing sheet includes a revision table above the title block. This is to be filled whenever a template drawing is changed so that there is a history of the change. The amended design must be reloaded to the Project Generator; amending also the quantity tables if necessary (see Part 5).
The box should also be filled if a template is changed to fit the requirements of a particular project. This can be done in hand on hard copy issued to the contractor. Senior advisors should be consulted to confirm such change and can decide if this change should apply only for the project or for wider use of the Template.
3.4.5 Variable dimensions Some template drawings have dimensions that can be varied (e.g. high fill over a pipe culvert requires a longer culvert and more culvert rings). It is not necessary to alter the template drawing, the variation in dimension is taken into account in the quantity spreadsheet, see Part 5.
3.4.6 How to read the steel details and the steel schedule For most outputs with reinforced concrete elements, separate reinforcement drawings are included, with separate bar schedules. For some small outputs (e.g. width restriction posts) the reinforcement requirement and schedule is included on the drawing.
On a design drawing, reinforcement is usually divided into ‘position’ sets of bars. Each set is labeled by a number (e.g. �), the number of bars used, the diameter of bar and the spacing. Following construction industry convention and the software settings (see below) bars the description of bars may be in several ways.
Bar call-up type and arrangement Description
�10Ø10@200 Position 4, 10 bars diameter 10 mm, spacing 200 mm
10Ø10@200� 10 bars diameter 10 mm, spacing 200 mm, position 4
�Ø10@200 Position 4, diameter 10 mm, spacing 200 mm
10� Diameter 10 mm, position 4
When bar schedules have been produced these have been generated using SofiCAD, which is a proprietary add-in software for AutoCAD (see section 3.5). It is not essential to use SofiCAD for producing future template designs. However the use of software makes drawing production easier and reduces mistakes so it is advisable to use software for more complicated drawings. Using SofiCAD will ensure consistency with existing Templates.

Part 3: Template Designs for Local Infrastructure
Study and Design Guidelines I-89
Whenever there is an output that has a bar schedule this is loaded and output by the Project Generator together with the drawing.
An example of a bar schedule is shown below. The schedule shows the output number and steel grade for the bars.
The columns are as follows:
� Pos: position, (e.g. same as � on the drawing example above).
� No: number of bars at that position.
� d: diameter in millimeters.
� Length: total length of each piece of bar before bending in meters.
� Dbr ds: Not used.
� Type: Bar type, A1 is deformed/high yield, D1 is round bar.
� Shape code: A diagram showing the shape and dimensions of a bent bar, where dimensions vary because of a tapering shape, a table is included to show the dimensions of each bent bar. Dimension of figures are centimeters.
� Total length: Total length of steel used for all the bars at that position (e.g. for position � total length 26 x 1.9 = 49.4 meters).
� Weight: Total weight of the total length of bar in kilograms.
3.5 AutoCAD Standards The templates have as far as practical been produced to a standard AutoCAD format. This isnot 100% applicable, e.g. some templates have elements carried over from the Seila

Part 3: Template Designs for Local Infrastructure
Study and Design Guidelines I-90
Templates. It is desirable that any additional templates also follow the same standard AutoCAD format. The remainder of this sub-section specifies the AutoCAD format.
All drawing prepared using the AutoCAD software should comply with these instructions in order to facilitate data exchange and uniformity of layout.
3.5.1 AutoCAD Version AutoCAD versions released between year 2004 and 2008 have been used for all templates produced up to first issue of this Technical Manual. Regardless of the version of AutoCAD with which the drawings are produced, all drawings files are to be saved in AutoCAD 2004 format.
3.5.2 General settings � All design work should be done in MODEL space.
� The drawing unit for the MODEL space shall be ‘meters’. Drawing dimensions are in ‘millimeters’.
� Setting drawing units Menu > Format > Units > Length: Type: Decimal
Precision: 0.0000 > Angle: Type: Decimal degrees Precision: 0.000 > insertion scale: Unit to scale inserted content: meter
� Setting line typeAll linetypes should be loaded form acadiso.lin (metric system)
� Setting line scale The default setting for the Global Scale Factor is 1.0. It needs to be adjusted for different drawing scales.
Always adjust the Global Scale Factor so that axes and hidden lines are readable.
Adjustments to the Linetype Scale of single lines are needed for the secondary scales such as details. Adjustment is to be based on the leading scale: eg. If your drawing scales are: 1:50, 1:10, your global scale is to be 0.05 and the linetype scale of the single lines for the scale 1:10 should be scale to: 0.2 = (10/50). (Means x = the smaller scale divided by the bigger scale).
Menu > FORMAT > LINETYPE > adjust Global Scale Factor > disable “Use paper space units for scaling”
� The drawing frame, title block and scale bars and legends have to be in LAYOUT space. All other objects shall be in MODEL space.
� Regardless of the version of AutoCAD with which the drawings are produced, all drawings files are to be saved in AutoCAD 2004 format. Set software as follows:
Menu > TOOLS > OPTIONS > tab Open and Save > Save as: AutoCAD 2004 (*.dwg)
3.5.3 AutoCAD file name The drawing file name is the NCDD output and sheet number(s) of the drawing(s) it contains.
3.5.4 Drawing number Drawings are identified by the NCDD output number and sheet number.

Part 3: Template Designs for Local Infrastructure
Study and Design Guidelines I-91
3.5.5 Paper size A3 ISO paper formats shall be used.
Name of Format
Paper Size [mm]
Drawing Area [mm] Margins
Left Right Above Below ISO A3 420 x 297
3.5.6 Pen assignment for plotting Plot style table file NCDD.ctb is to be used for all plots.
The files contain the following pen assignments.
No. of Color Color Pen Color Line Width NCDD.ctb
1 Red (1) Black (7) 0.18 2 Yellow (2) Black (7) 0.25 3 Green (3) Black (7) 0.35 4 Cyan (4) Black (7) 0.5 5 Blue (5) Black (7) 0.7 6 Magenta (6) Black (7) 1.0 7 White/Black (7) Black (7) 0.10 8 Dark Grey (8) Black (7) 0.05 9 Bright Grey (9) Dark grey (250) 0.05
3.5.7 Layer definition The layers and settings listed below should be used as much as possible.
General layer
Layer Name Description Color Line Type PlotYes/No
1-AXIS Axes, Centre lines White Centre2 1-DIM Dimensions and Elevations Red Cont. 1-HATCH General layer for hatches 8 Cont. 1-HELP-OFF Help lines Magenta Cont. no 1-INV Invisible edges in general Red /White Hidden 1-CUT-LINE Section or cut lines Green Centre 1-TEXT General text, and Table Red Cont. Z-FRAME Frame Yellow Cont. Z-VIEWPORT View port visible 9 Cont. Z-VIEWPORT-OFF View port invisible Magenta Cont. no TITLEBLOCK The block of title Yellow Cont.
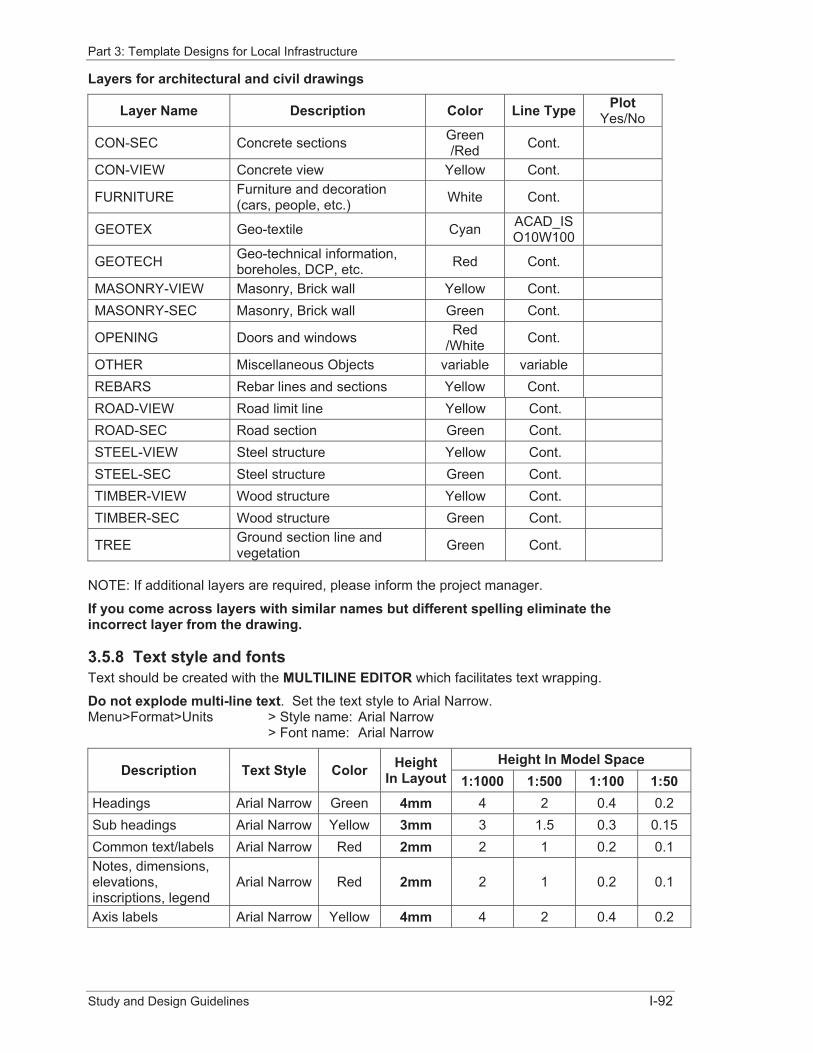
Part 3: Template Designs for Local Infrastructure
Study and Design Guidelines I-92
Layers for architectural and civil drawings
Layer Name Description Color Line Type PlotYes/No
CON-SEC Concrete sections Green/Red Cont.
CON-VIEW Concrete view Yellow Cont.
FURNITURE Furniture and decoration (cars, people, etc.) White Cont.
GEOTEX Geo-textile Cyan ACAD_ISO10W100
GEOTECH Geo-technical information, boreholes, DCP, etc. Red Cont.
MASONRY-VIEW Masonry, Brick wall Yellow Cont. MASONRY-SEC Masonry, Brick wall Green Cont.
OPENING Doors and windows Red/White Cont.
OTHER Miscellaneous Objects variable variable REBARS Rebar lines and sections Yellow Cont. ROAD-VIEW Road limit line Yellow Cont. ROAD-SEC Road section Green Cont. STEEL-VIEW Steel structure Yellow Cont. STEEL-SEC Steel structure Green Cont. TIMBER-VIEW Wood structure Yellow Cont. TIMBER-SEC Wood structure Green Cont.
TREE Ground section line and vegetation Green Cont.
NOTE: If additional layers are required, please inform the project manager.
If you come across layers with similar names but different spelling eliminate the incorrect layer from the drawing.
3.5.8 Text style and fonts Text should be created with the MULTILINE EDITOR which facilitates text wrapping.
Do not explode multi-line text. Set the text style to Arial Narrow.Menu>Format>Units > Style name: Arial Narrow > Font name: Arial Narrow
Description Text Style Color HeightIn Layout
Height In Model Space 1:1000 1:500 1:100 1:50
Headings Arial Narrow Green 4mm 4 2 0.4 0.2 Sub headings Arial Narrow Yellow 3mm 3 1.5 0.3 0.15 Common text/labels Arial Narrow Red 2mm 2 1 0.2 0.1 Notes, dimensions, elevations,inscriptions, legend
Arial Narrow Red 2mm 2 1 0.2 0.1
Axis labels Arial Narrow Yellow 4mm 4 2 0.4 0.2

Part 3: Template Designs for Local Infrastructure
Study and Design Guidelines I-93
3.5.9 Line types / widths Standard metric system AutoCAD line types are to be used only (acadiso.lin). (Exceptions to the rule should be limited.)
To use the following line types are recommended.
1 2 3 4 5 CONTINUOUS HIDDEN CENTER DOT PHANTOM
Line types shall be used as follows.
Line Type Recommended Use Line Color Line Width continuous boundary of cut surface green 0.35
continuous
visible edges and visible contours from structural elements, boundary of cut surface of small or little structural elements
yellow 0.25
continuousdimension line, dimension auxiliary line, guide note line, walking line, boundary of detail figure, simplifying figure
red 0.18
hidden invisible edges and invisible contours from structural elements yellow 0.25
center position of cutting plane green 0.35 center axes white 0.1
dot structural elements in front or above of cutting plane yellow 0.25
General setting for line type scale refer to Section 3.5.2.
3.5.10 Hatch Note:
� Do not explode hatch lines.
� Do not delete hatch boundary line but put them on a help layer.
Description Hatch Name Angle Line Type Masonry ANSI31 0 By layer Concrete, reinforced ANSI33 0 By layer Concrete, not reinforced BETONUB 0 By layer Soil EARTH 45 By layer Backfill AR-CONC 0 By layer Wood / timber Steel
3.5.11 Dimensions Use the dimension style provided in the model drawing file (NCDD 50, NCDD 100, etc.). Do not change the settings of these styles. If you need to create a dim style for another drawing scale ask for permission.
Note that the drawing unit in MODEL space is metre. However, dimensions are in ‘mm’. (The scale factor for measurement is set to 1000.)
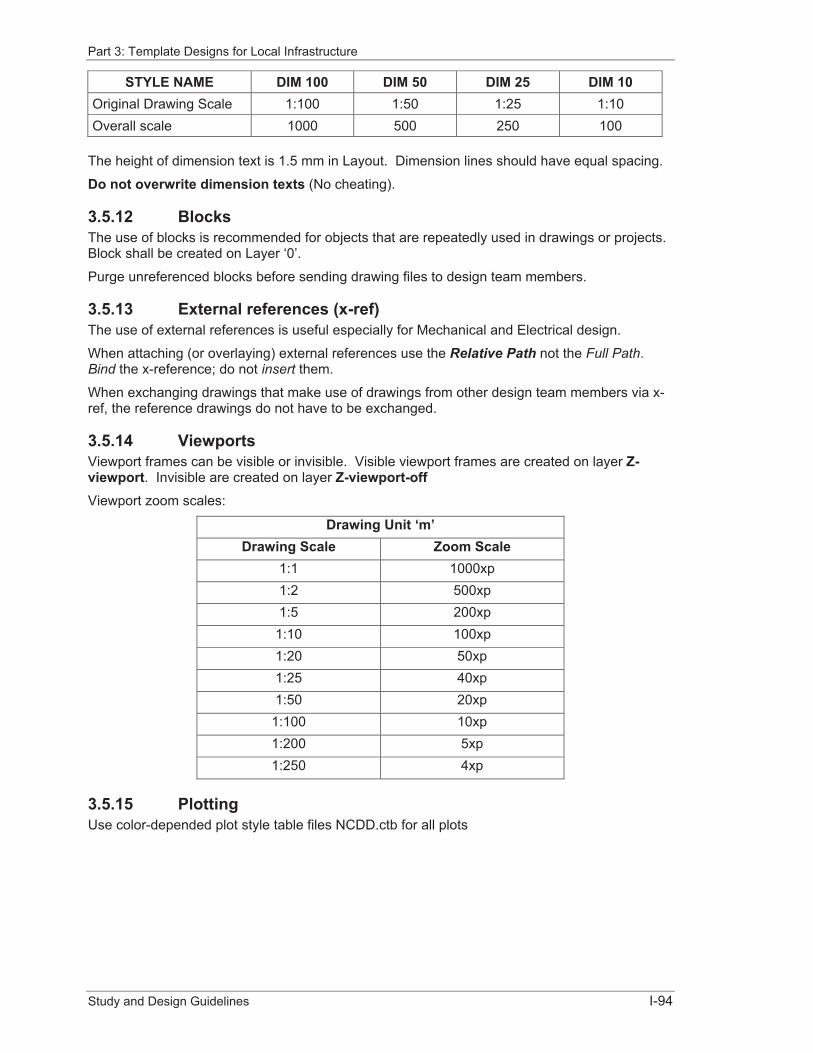
Part 3: Template Designs for Local Infrastructure
Study and Design Guidelines I-94
STYLE NAME DIM 100 DIM 50 DIM 25 DIM 10 Original Drawing Scale 1:100 1:50 1:25 1:10 Overall scale 1000 500 250 100
The height of dimension text is 1.5 mm in Layout. Dimension lines should have equal spacing.
Do not overwrite dimension texts (No cheating).
3.5.12 Blocks The use of blocks is recommended for objects that are repeatedly used in drawings or projects. Block shall be created on Layer ‘0’.
Purge unreferenced blocks before sending drawing files to design team members.
3.5.13 External references (x-ref) The use of external references is useful especially for Mechanical and Electrical design.
When attaching (or overlaying) external references use the Relative Path not the Full Path.Bind the x-reference; do not insert them.
When exchanging drawings that make use of drawings from other design team members via x-ref, the reference drawings do not have to be exchanged.
3.5.14 Viewports Viewport frames can be visible or invisible. Visible viewport frames are created on layer Z-viewport. Invisible are created on layer Z-viewport-offViewport zoom scales:
Drawing Unit ‘m’ Drawing Scale Zoom Scale
1:1 1000xp 1:2 500xp 1:5 200xp
1:10 100xp 1:20 50xp 1:25 40xp 1:50 20xp
1:100 10xp 1:200 5xp 1:250 4xp
3.5.15 Plotting Use color-depended plot style table files NCDD.ctb for all plots

I-95
PART 4: MATERIALS, QUANTITIES
AND COSTS

Part 5: Materials, Quantities and Costs
Study and Design Guidelines I-96
4 Materials, Quantities & Costs
4.1 Project Cost Estimation After the project design preparation is completed, the Technical Assistant must estimate the project cost by following the cost estimation guidelines in the PIM. To estimate the project cost, first estimate each of the outputs of the project and then sum all the estimated costs of the outputs into a total for the output project. The total estimated cost of all outputs gives the estimated cost of the project.
After estimating each project output cost the Technical Assistant will help the C/S chief to fill out the form for the project output and project estimated cost and the project will proceed to bidding, all as described in the PIM.
4.2 Tables of Quantities and Labor Costs For infrastructure projects the PIM requires that the Technical Assistant refers to the ‘Table of Material Quantities’ in this Technical Manual to find the quantities of materials that the contractor will have to buy, and how much labor he will need. These tables appear at the end of this section (Tables 1 to 7)
Note that the ‘unit quantities’ in the tables are for the complete construction task (the Net1
quantity), not quantities of all the materials and labor used to complete the task (the Gross2
quantity). The gross quantity for the construction task includes labor and waste materials, materials that will remain in the finished construction, and materials used temporally to complete the construction.
The tables give the total including labor and material including waste materials to produce the unit quantity.
For example, one cubic metre of concrete, shown on the drawing, means that all the things that are needed to make one cubic metre of concrete and listed in the tables. These includes:
� the materials in the concrete: cement, stone and sand;
� materials that will be wasted in mixing the concrete;
� wood and nails for the formwork;
� labor to construct the formwork and to mix and place the concrete; and
� equipment such as concrete mixer, vibrator and small tools.
For another example, in Table 5 the unit quantity for steel bars is:
� (1.0) tonne, but the quantity of steel used is 1.1 tonne which allows 0.1 tonne or 10% for waste;
� in addition 10 kg of binding wire is allowed for fixing each 1.0 tonne unit quantity of steel;
� the labor required per unit quantity is;
o 1 day skilled labor,
o 1 day semi-skilled labor, and
o 6 days unskilled labor.
4.3 Net Quantities The gross quantities obtained from the tables of quantities and labor costs are obtained by factoring the net quantity for wastage of the ingredients permanently incorporated into the works 1 Net: remaining after all deductions (for waste and not permanently used). 2 Gross: before any deductions (everything used).
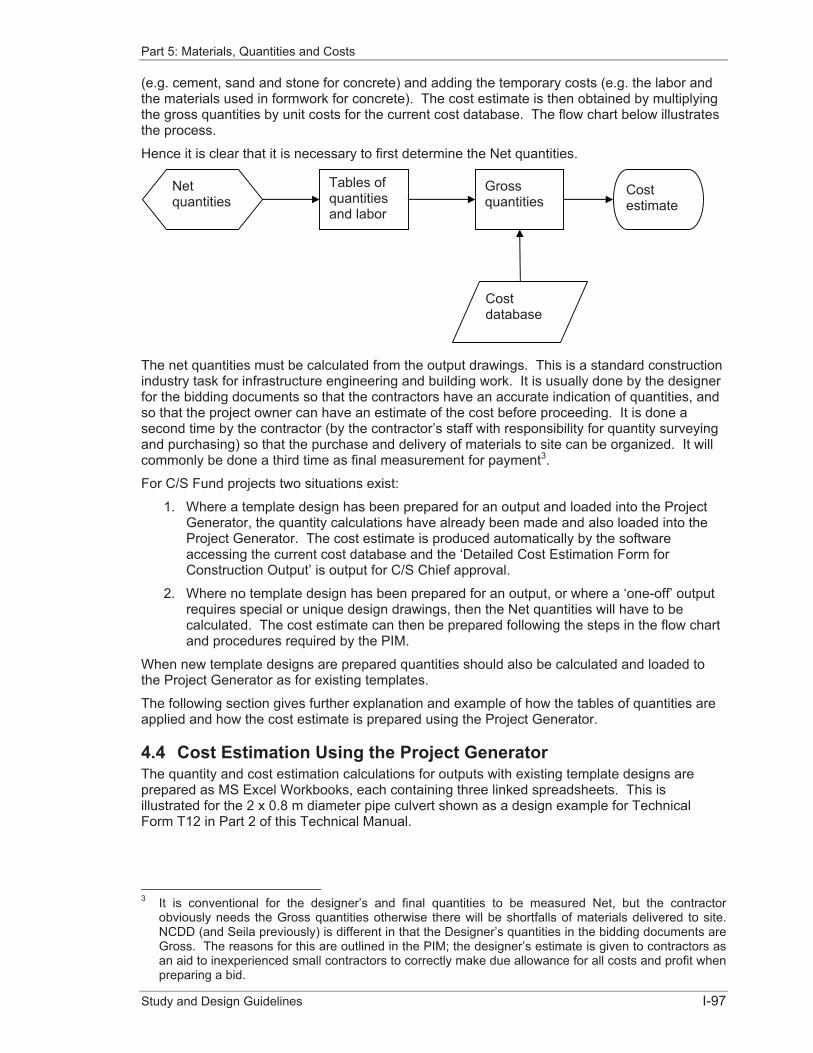
Part 5: Materials, Quantities and Costs
Study and Design Guidelines I-97
(e.g. cement, sand and stone for concrete) and adding the temporary costs (e.g. the labor and the materials used in formwork for concrete). The cost estimate is then obtained by multiplying the gross quantities by unit costs for the current cost database. The flow chart below illustrates the process.
Hence it is clear that it is necessary to first determine the Net quantities.
The net quantities must be calculated from the output drawings. This is a standard construction industry task for infrastructure engineering and building work. It is usually done by the designer for the bidding documents so that the contractors have an accurate indication of quantities, and so that the project owner can have an estimate of the cost before proceeding. It is done a second time by the contractor (by the contractor’s staff with responsibility for quantity surveying and purchasing) so that the purchase and delivery of materials to site can be organized. It will commonly be done a third time as final measurement for payment3.
For C/S Fund projects two situations exist:
1. Where a template design has been prepared for an output and loaded into the Project Generator, the quantity calculations have already been made and also loaded into the Project Generator. The cost estimate is produced automatically by the software accessing the current cost database and the ‘Detailed Cost Estimation Form for Construction Output’ is output for C/S Chief approval.
2. Where no template design has been prepared for an output, or where a ‘one-off’ output requires special or unique design drawings, then the Net quantities will have to be calculated. The cost estimate can then be prepared following the steps in the flow chart and procedures required by the PIM.
When new template designs are prepared quantities should also be calculated and loaded to the Project Generator as for existing templates.
The following section gives further explanation and example of how the tables of quantities are applied and how the cost estimate is prepared using the Project Generator.
4.4 Cost Estimation Using the Project Generator The quantity and cost estimation calculations for outputs with existing template designs are prepared as MS Excel Workbooks, each containing three linked spreadsheets. This is illustrated for the 2 x 0.8 m diameter pipe culvert shown as a design example for Technical Form T12 in Part 2 of this Technical Manual.
3 It is conventional for the designer’s and final quantities to be measured Net, but the contractor
obviously needs the Gross quantities otherwise there will be shortfalls of materials delivered to site. NCDD (and Seila previously) is different in that the Designer’s quantities in the bidding documents are Gross. The reasons for this are outlined in the PIM; the designer’s estimate is given to contractors as an aid to inexperienced small contractors to correctly make due allowance for all costs and profit when preparing a bid.
Tables of quantitiesand labor
Netquantities
Grossquantities
Costdatabase
Costestimate
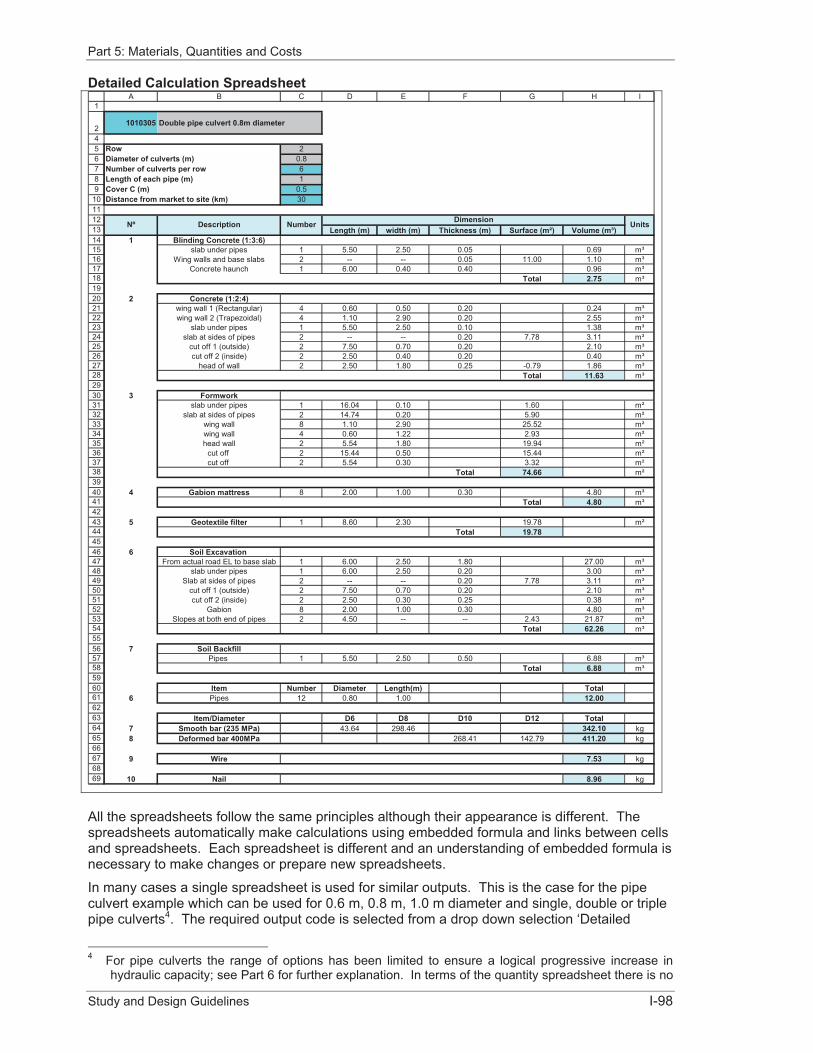
Part 5: Materials, Quantities and Costs
Study and Design Guidelines I-98
Detailed Calculation Spreadsheet 1
2456789
101112131415161718192021222324252627282930313233343536373839404142434445464748495051525354555657585960616263646566676869
A B C D E F G H I
1010305 Double pipe culvert 0.8m diameter
20.861
0.5Distance from market to site (km) 30
Length (m) width (m) Thickness (m) Surface (m²) Volume (m³)1 Blinding Concrete (1:3:6)
slab under pipes 1 5.50 2.50 0.05 0.69 m³Wing walls and base slabs 2 -- -- 0.05 11.00 1.10 m³
Concrete haunch 1 6.00 0.40 0.40 0.96 m³Total 2.75 m³
2 Concrete (1:2:4)wing wall 1 (Rectangular) 4 0.60 0.50 0.20 0.24 m³wing wall 2 (Trapezoidal) 4 1.10 2.90 0.20 2.55 m³
slab under pipes 1 5.50 2.50 0.10 1.38 m³slab at sides of pipes 2 -- -- 0.20 7.78 3.11 m³
cut off 1 (outside) 2 7.50 0.70 0.20 2.10 m³cut off 2 (inside) 2 2.50 0.40 0.20 0.40 m³
head of wall 2 2.50 1.80 0.25 -0.79 1.86 m³Total 11.63 m³
3 Formworkslab under pipes 1 16.04 0.10 1.60 m²
slab at sides of pipes 2 14.74 0.20 5.90 m²wing wall 8 1.10 2.90 25.52 m²wing wall 4 0.60 1.22 2.93 m²head wall 2 5.54 1.80 19.94 m²
cut off 2 15.44 0.50 15.44 m²cut off 2 5.54 0.30 3.32 m²
Total 74.66 m²
4 Gabion mattress 8 2.00 1.00 0.30 4.80 m³Total 4.80 m³
5 Geotextile filter 1 8.60 2.30 19.78 m²Total 19.78
6 Soil Excavation From actual road EL to base slab 1 6.00 2.50 1.80 27.00 m³
slab under pipes 1 6.00 2.50 0.20 3.00 m³Slab at sides of pipes 2 -- -- 0.20 7.78 3.11 m³
cut off 1 (outside) 2 7.50 0.70 0.20 2.10 m³cut off 2 (inside) 2 2.50 0.30 0.25 0.38 m³
Gabion 8 2.00 1.00 0.30 4.80 m³Slopes at both end of pipes 2 4.50 -- -- 2.43 21.87 m³
Total 62.26 m³
7 Soil BackfillPipes 1 5.50 2.50 0.50 6.88 m³
Total 6.88 m³
Item Number Diameter Length(m) Total6 Pipes 12 0.80 1.00 12.00
Item/Diameter D6 D8 D10 D12 Total7 Smooth bar (235 MPa) 43.64 298.46 342.10 kg8 Deformed bar 400MPa 268.41 142.79 411.20 kg
9 Wire 7.53 kg
10 Nail 8.96 kg
UnitsNº Description Number Dimension
Row
Cover C (m)
Diameter of culverts (m)Number of culverts per rowLength of each pipe (m)
All the spreadsheets follow the same principles although their appearance is different. The spreadsheets automatically make calculations using embedded formula and links between cells and spreadsheets. Each spreadsheet is different and an understanding of embedded formula is necessary to make changes or prepare new spreadsheets.
In many cases a single spreadsheet is used for similar outputs. This is the case for the pipe culvert example which can be used for 0.6 m, 0.8 m, 1.0 m diameter and single, double or triple pipe culverts4. The required output code is selected from a drop down selection ‘Detailed
4 For pipe culverts the range of options has been limited to ensure a logical progressive increase in
hydraulic capacity; see Part 6 for further explanation. In terms of the quantity spreadsheet there is no

Part 5: Materials, Quantities and Costs
Study and Design Guidelines I-99
Calculation Cell A2’. This the fills Cell B2 with the description ‘Double pipe culvert 0.8m diameter’; Cell C5 with the number of rows ‘2’; Cell C6 with the diameter ‘0.8’.
Drop down options are used for Cell C7, number of culvert rings per row ‘6’, Cell C9 cover ‘0.5’, and Cell C10 distance from market to site ‘30’ (used to calculate transport costs).
The remainder of the ‘Detailed Calculation’ worksheet contains the dimensions taken from the drawings and the calculations and summation of Net quantities for each work item, e.g. blinding concrete, concrete (1:2:4), etc.
The ‘Transport and Labor cost’ spreadsheet takes the Net quantities and factors these by the appropriate values extracted from the quantity and labor tables. The ‘Material Transport Cost’ and its distance are read from the cost database and entered at Cell D2 on the ‘Detailed Calculation’ spreadsheet C10. These are used to calculate the transport related costs in the spreadsheet.
The ‘Output Data’ spreadsheet provides the Detailed Cost Estimate Form for Construction Output. It provides a summary of quantities of material, labor and transport costs by item.
Transport and Labor cost Spreadsheet 12345
6
7
8
9
10
11
12
13
14
15
16
17
18
19
20
21
A B C D E F G H I J K
Material Transport Cost (Tonne per Km) 800 Riels30 km
No Description Unit Quantity Weight/Unit (kg)
Total Weight (kg)
Transport Cost (Riels)
Unskilled Labor (days/Unit)
Semi-skilled Labor (days/Unit)
Skilled Labor (days/Unit)
1 Cement bag 88.26 50 4413.07 106,000
2 Stone (10x20 mm) m³ 10.01 1700 17009.35 408,300
3 Stone (20x40 mm) m³ 2.47 1700 4203.68 100,900
5 Sand m³ 6.24 1700 10606.51 254,600
6 Formwork m² 74.66 10 746.56 18,000 4 19 7
7 Gabion mattress m³ 4.80 -- 0 00 0 0 0
8 Geotextile Filter m² 19.78 -- 0 00 0 0 0
9 Culvert pipe 0.6m diameter Number 12.00 250 3000.00 72,000 24 1 0
10 Smooth bars (235 MPa) kg 376.31 1 376.31 9,100 2 0 0
11 Deformed bars (400 MPa) kg 452.32 1 452.32 10,900 3 0 0
12 Wire kg 7.53 1 7.53 200 0 0 0
13 Nail kg 8.96 1 8.96 300 0 0 0
14 Soil Excavation m³ 62.26 -- 0 00 0 0 0
15 Soil Backfill m³ 6.88 -- 0 00 0 0 0
40.82 980,300 100 34 10
1
Total
Transport Distance
66 13
limit on additional pipe sizes or combination which may be added (e.g. if ISO standard 0.9 m or 1.2 m diameter pipes are imported and used).
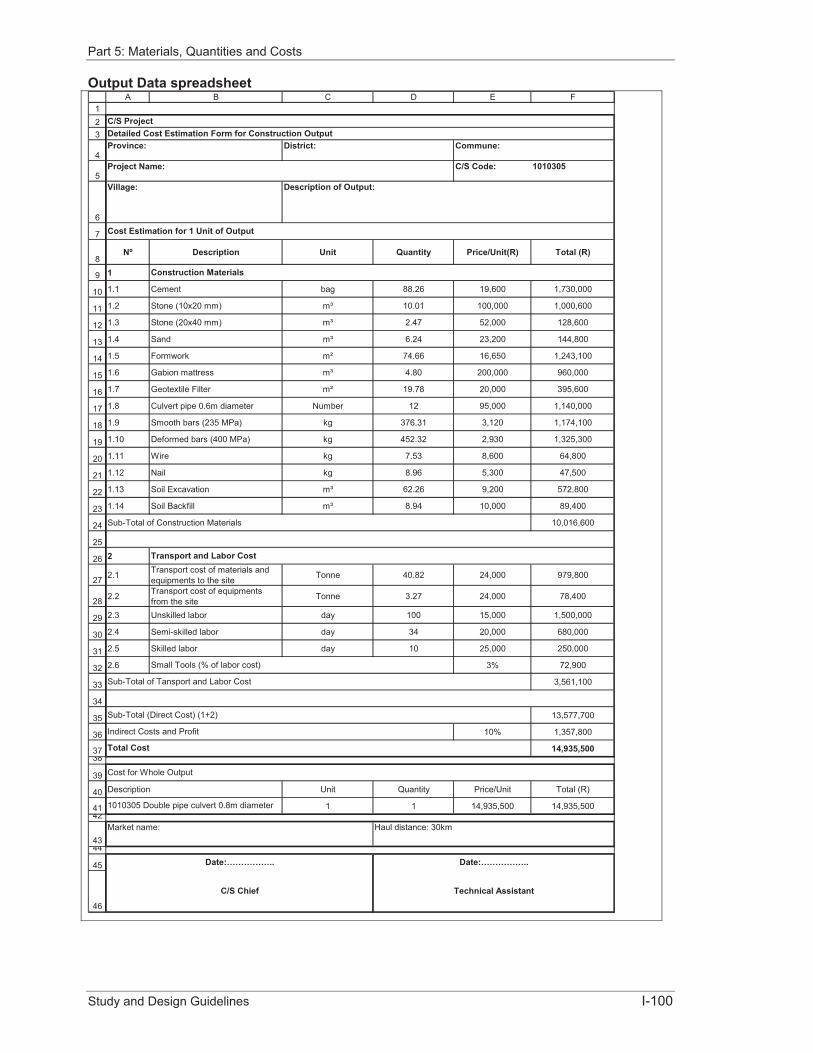
Part 5: Materials, Quantities and Costs
Study and Design Guidelines I-100
Output Data spreadsheet
123
4
5
6
7
8
9
10
11
12
13
14
15
16
17
18
19
20
21
22
23
24
25
26
27
28
29
30
31
32
33
34
35
36
3738
39
40
4142
4344
45
46
A B C D E F
C/S Code: 1010305
Nº Description Unit Quantity Price/Unit(R) Total (R)
1
1.1 Cement bag 88.26 19,600 1,730,000
1.2 Stone (10x20 mm) m³ 10.01 100,000 1,000,600
1.3 Stone (20x40 mm) m³ 2.47 52,000 128,600
1.4 Sand m³ 6.24 23,200 144,800
1.5 Formwork m² 74.66 16,650 1,243,100
1.6 Gabion mattress m³ 4.80 200,000 960,000
1.7 Geotextile Filter m² 19.78 20,000 395,600
1.8 Culvert pipe 0.6m diameter Number 12 95,000 1,140,000
1.9 Smooth bars (235 MPa) kg 376.31 3,120 1,174,100
1.10 Deformed bars (400 MPa) kg 452.32 2,930 1,325,300
1.11 Wire kg 7.53 8,600 64,800
1.12 Nail kg 8.96 5,300 47,500
1.13 Soil Excavation m³ 62.26 9,200 572,800
1.14 Soil Backfill m³ 8.94 10,000 89,400
Sub-Total of Construction Materials 10,016,600
2
2.1 Transport cost of materials and equipments to the site Tonne 40.82 24,000 979,800
2.2 Transport cost of equipments from the site Tonne 3.27 24,000 78,400
2.3 Unskilled labor day 100 15,000 1,500,000
2.4 Semi-skilled labor day 34 20,000 680,000
2.5 Skilled labor day 10 25,000 250,000
2.6 3% 72,900
3,561,100
13,577,700
10% 1,357,800
14,935,500
Description Unit Quantity Price/Unit Total (R)
1 1 14,935,500 14,935,500
Transport and Labor Cost
Construction Materials
Cost for Whole Output
Total Cost
C/S Chief Technical Assistant
1010305 Double pipe culvert 0.8m diameter
Market name: Haul distance: 30km
Date:…………….. Date:……………..
Description of Output:
Project Name:
Small Tools (% of labor cost)
Indirect Costs and Profit
Sub-Total (Direct Cost) (1+2)
C/S ProjectDetailed Cost Estimation Form for Construction Output
Sub-Total of Tansport and Labor Cost
Province:
Cost Estimation for 1 Unit of Output
District: Commune:
Village:
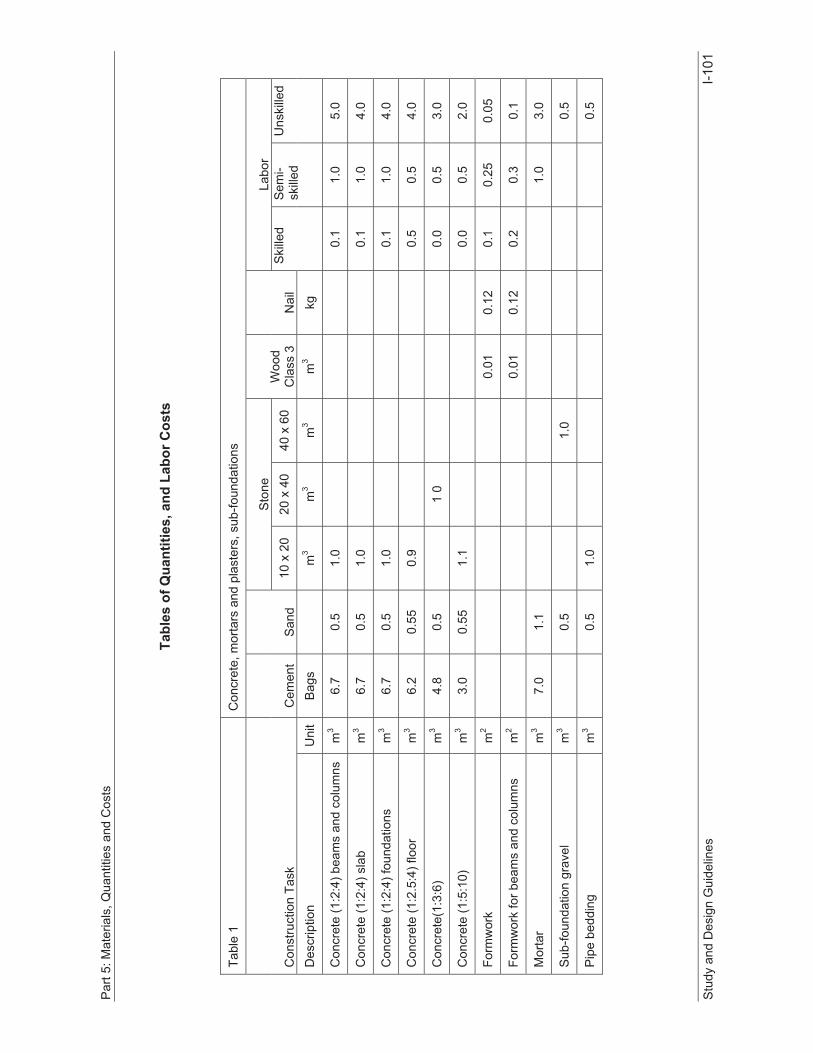
Par
t 5: M
ater
ials
, Qua
ntiti
es a
nd C
osts
Stu
dy a
nd D
esig
n G
uide
lines
I-1
01
Tabl
es o
f Qua
ntiti
es, a
nd L
abor
Cos
ts
Tabl
e 1
Con
cret
e, m
orta
rs a
nd p
last
ers,
sub
-foun
datio
ns
Con
stru
ctio
n Ta
sk
Cem
ent
San
d
Sto
neW
ood
Cla
ss 3
N
ail
Labo
r 10
x 2
0 20
x 4
0 40
x 6
0 S
kille
d S
emi-
skille
d U
nski
lled
Des
crip
tion
Uni
tB
ags
m
3 m
3 m
3 m
3 kg
Con
cret
e (1
:2:4
) bea
ms
and
colu
mns
m
3 6.
7 0.
5 1.
0
0.
1 1.
0 5.
0
Con
cret
e (1
:2:4
) sla
b m
3 6.
7 0.
5 1.
0
0.
1 1.
0 4.
0
Con
cret
e (1
:2:4
) fou
ndat
ions
m
3 6.
7 0.
5 1.
0
0.
1 1.
0 4.
0
Con
cret
e (1
:2.5
:4) f
loor
m
3 6.
2 0.
55
0.9
0.5
0.5
4.0
Con
cret
e(1:
3:6)
m
3 4.
8 0.
5
1 0
0.
0 0.
5 3.
0
Con
cret
e (1
:5:1
0)
m3
3.0
0.55
1.
1
0.
0 0.
5 2.
0
Form
wor
k m
2
0.01
0.
12
0.1
0.25
0.
05
Form
wor
k fo
r bea
ms
and
colu
mns
m
2
0.01
0.
12
0.2
0.3
0.1
Mor
tar
m3
7.0
1.1
1.0
3.0
Sub
-foun
datio
n gr
avel
m
3
0.5
1.0
0.5
Pip
e be
ddin
g m
3
0.5
1.0
0.5

Par
t 5: M
ater
ials
, Qua
ntiti
es a
nd C
osts
Stu
dy a
nd D
esig
n G
uide
lines
I-1
02
Tabl
es o
f Qua
ntiti
es, a
nd L
abor
Cos
ts
Tabl
e 2
Roo
f Mat
eria
ls
Con
stru
ctio
n Ta
sk
Squ
are
tiles
Fi
sh s
cale
ro
of ti
le
Fibr
o Zi
nc
Labo
r
0.55
x 1
.2 m
0.
5 x
3 m
Ski
lled
Sem
i-ski
lled
Uns
kille
d D
escr
iptio
n U
nit
Tile
pie
ce
Tile
pie
ce
She
et
She
et
Dra
gon
scal
e ro
of ti
le
m2
70
0.
1 0.
1 0.
1
Squ
are
tile
roof
ing
m2
16
0.
1 0.
1 0.
1
fibro
roof
m
2
2.
5
0.05
0.
05
0.05
Zinc
roof
m
2
0.9
0.
05
0.05
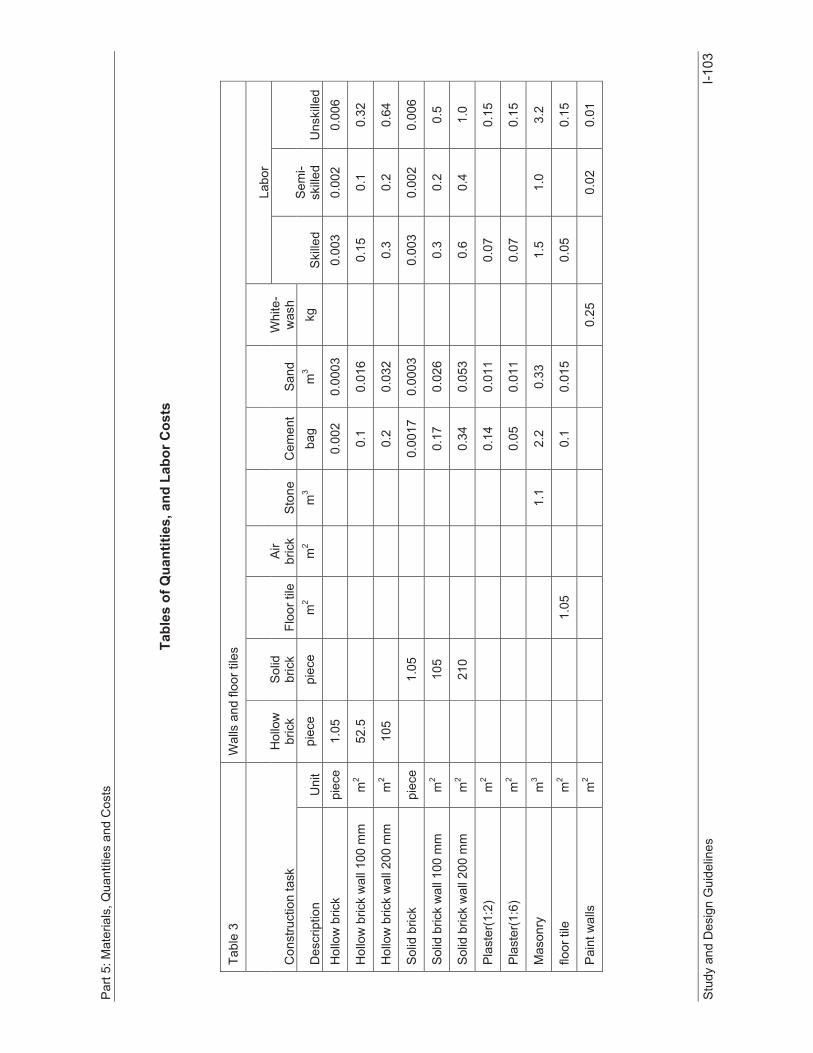
Par
t 5: M
ater
ials
, Qua
ntiti
es a
nd C
osts
Stu
dy a
nd D
esig
n G
uide
lines
I-1
03
Tabl
es o
f Qua
ntiti
es, a
nd L
abor
Cos
ts
Tabl
e 3
Wal
ls a
nd fl
oor t
iles
Con
stru
ctio
n ta
sk
Hol
low
br
ick
Sol
idbr
ick
Floo
r tile
Air
bric
k S
tone
C
emen
t S
and
Whi
te-
was
h
Labo
r
Ski
lled
Sem
i-sk
illed
Uns
kille
d D
escr
iptio
n U
nit
piec
e pi
ece
m2
m2
m3
bag
m3
kg
Hol
low
bric
k pi
ece
1.05
0.
002
0.00
03
0.
003
0.00
2 0.
006
Hol
low
bric
k w
all 1
00 m
m
m2
52.5
0.
1 0.
016
0.
15
0.1
0.32
Hol
low
bric
k w
all 2
00 m
m
m2
105
0.2
0.03
2
0.3
0.2
0.64
Sol
id b
rick
piec
e
1.05
0.00
17
0.00
03
0.
003
0.00
2 0.
006
Sol
id b
rick
wal
l 100
mm
m
2
105
0.
17
0.02
6
0.3
0.2
0.5
Sol
id b
rick
wal
l 200
mm
m
2
210
0.
34
0.05
3
0.6
0.4
1.0
Pla
ster
(1:2
) m
2
0.14
0.
011
0.
07
0.
15
Pla
ster
(1:6
) m
2
0.05
0.
011
0.
07
0.
15
Mas
onry
m
3
1.
1 2.
2 0.
33
1.
5 1.
0 3.
2
floor
tile
m
2
1.
05
0.1
0.01
5
0.05
0.15
Pai
nt w
alls
m
2
0.25
0.02
0.
01
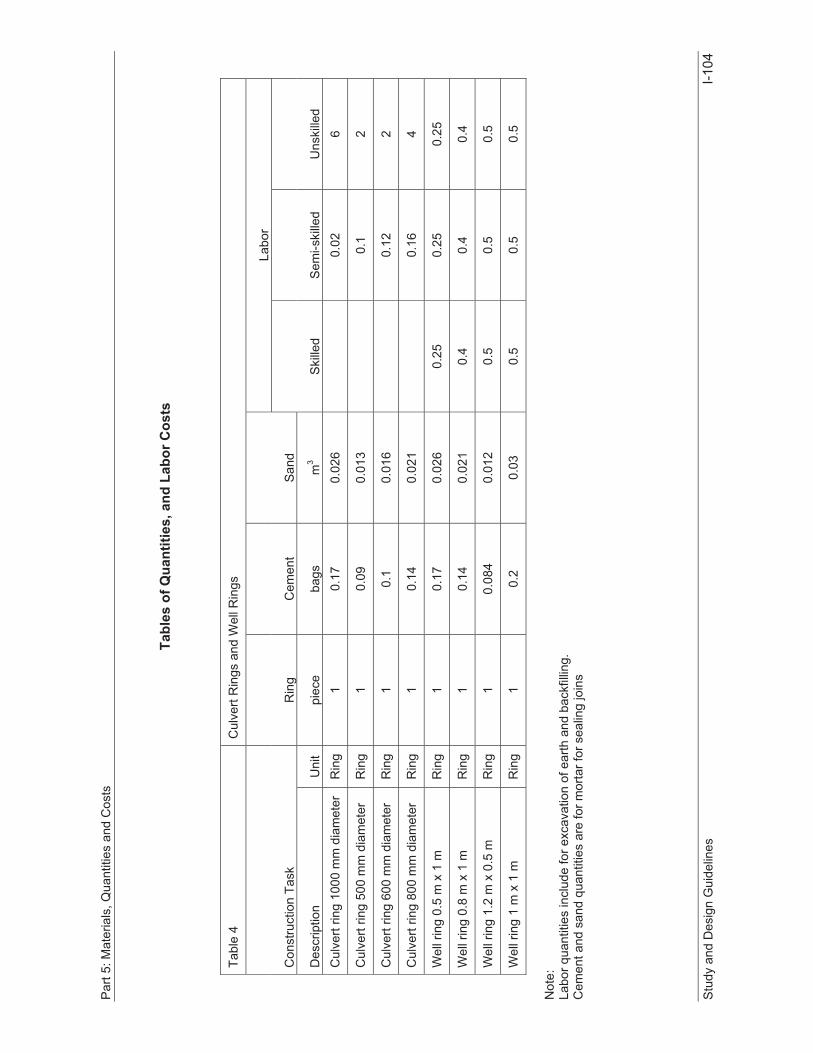
Par
t 5: M
ater
ials
, Qua
ntiti
es a
nd C
osts
Stu
dy a
nd D
esig
n G
uide
lines
I-1
04
Tabl
es o
f Qua
ntiti
es, a
nd L
abor
Cos
ts
Tabl
e 4
Cul
vert
Rin
gs a
nd W
ell R
ings
Con
stru
ctio
n Ta
sk
Rin
g C
emen
t S
and
Labo
r
Ski
lled
Sem
i-ski
lled
Uns
kille
d D
escr
iptio
n U
nit
piec
e ba
gs
m3
Cul
vert
ring
1000
mm
dia
met
er
Rin
g 1
0.17
0.
026
0.
02
6
Cul
vert
ring
500
mm
dia
met
er
Rin
g 1
0.09
0.
013
0.
1 2
Cul
vert
ring
600
mm
dia
met
er
Rin
g 1
0.1
0.01
6
0.12
2
Cul
vert
ring
800
mm
dia
met
er
Rin
g 1
0.14
0.
021
0.
16
4
Wel
l rin
g 0.
5 m
x 1
m
Rin
g 1
0.17
0.
026
0.25
0.
25
0.25
Wel
l rin
g 0.
8 m
x 1
m
Rin
g 1
0.14
0.
021
0.4
0.4
0.4
Wel
l rin
g 1.
2 m
x 0
.5 m
R
ing
1 0.
084
0.01
2 0.
5 0.
5 0.
5
Wel
l rin
g 1
m x
1 m
R
ing
1 0.
2 0.
03
0.5
0.5
0.5
Not
e:
Labo
r qua
ntiti
es in
clud
e fo
r exc
avat
ion
of e
arth
and
bac
kfilli
ng.
Cem
ent a
nd s
and
quan
titie
s ar
e fo
r mor
tar f
or s
ealin
g jo
ins
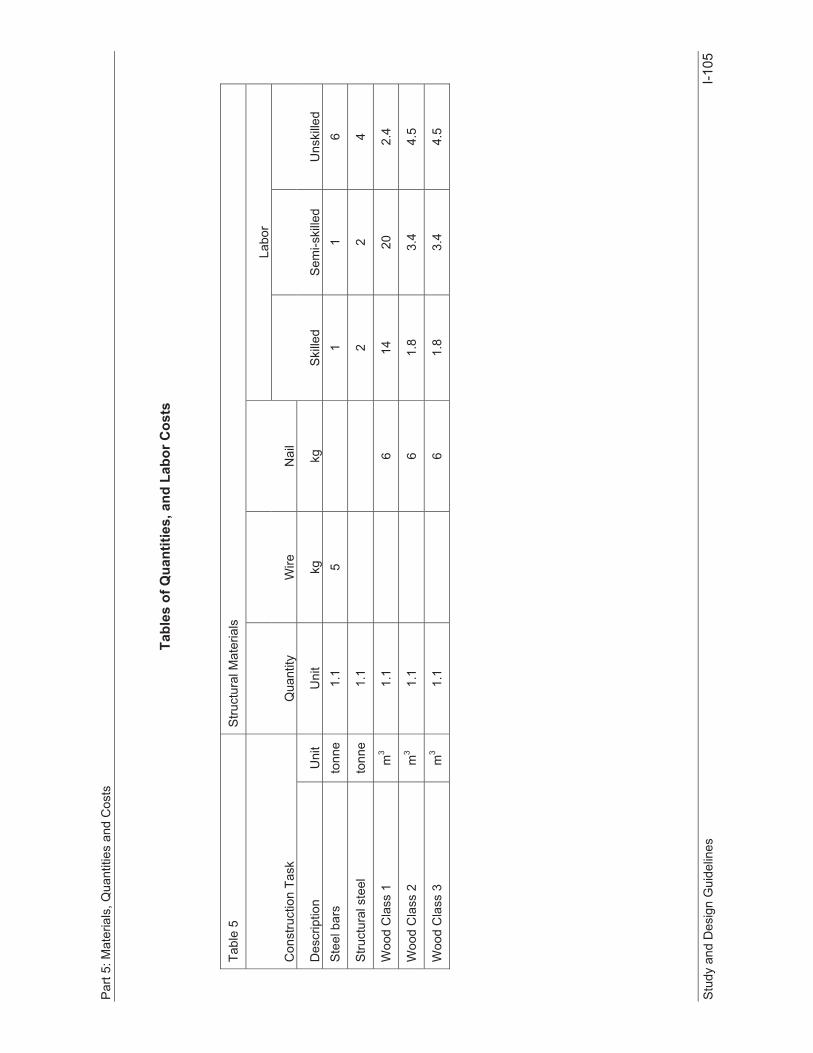
Par
t 5: M
ater
ials
, Qua
ntiti
es a
nd C
osts
Stu
dy a
nd D
esig
n G
uide
lines
I-1
05
Tabl
es o
f Qua
ntiti
es, a
nd L
abor
Cos
ts
Tabl
e 5
Stru
ctur
al M
ater
ials
Con
stru
ctio
n Ta
sk
Qua
ntity
W
ire
Nai
l
Labo
r
Ski
lled
Sem
i-ski
lled
Uns
kille
d D
escr
iptio
n U
nit
Uni
t kg
kg
S
teel
bar
s to
nne
1.1
5
1 1
6
Stru
ctur
al s
teel
to
nne
1.1
2 2
4
Woo
d C
lass
1
m3
1.1
6
14
20
2.4
Woo
d C
lass
2
m3
1.1
6
1.8
3.4
4.5
Woo
d C
lass
3
m3
1.1
6
1.8
3.4
4.5
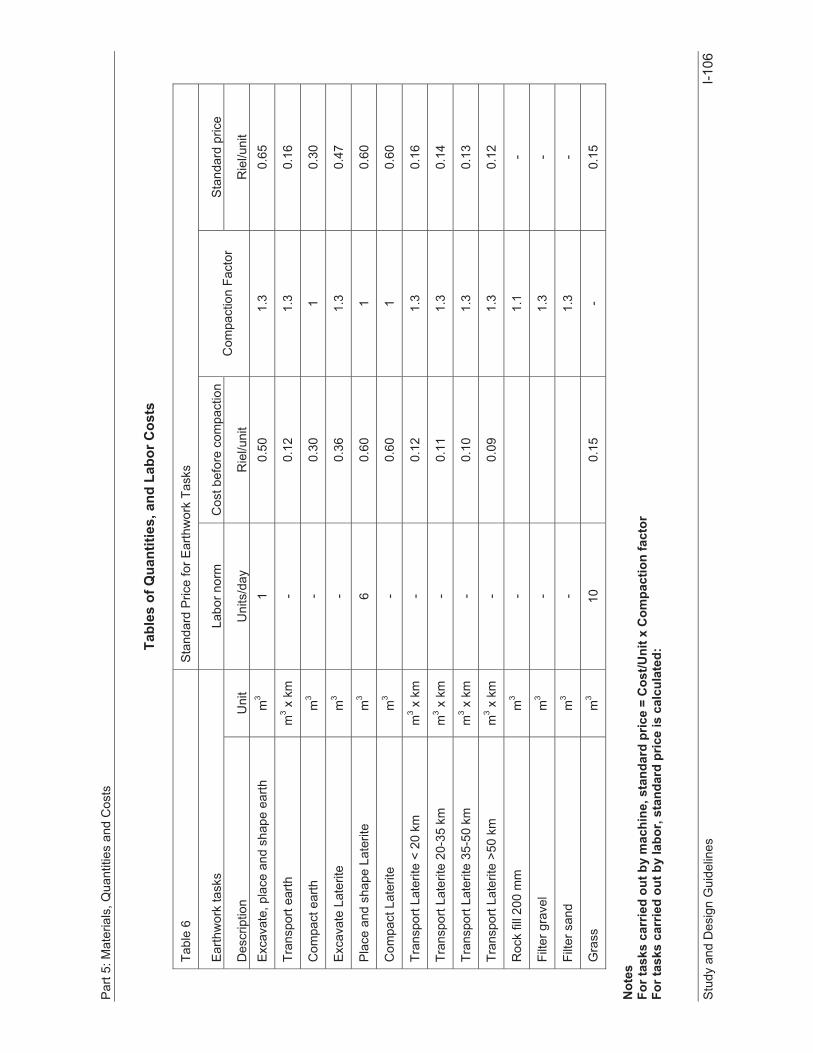
Par
t 5: M
ater
ials
, Qua
ntiti
es a
nd C
osts
Stu
dy a
nd D
esig
n G
uide
lines
I-1
06
Tabl
es o
f Qua
ntiti
es, a
nd L
abor
Cos
ts
Tabl
e 6
Sta
ndar
d P
rice
for E
arth
wor
k Ta
sks
Ear
thw
ork
task
s La
bor n
orm
C
ost b
efor
e co
mpa
ctio
nC
ompa
ctio
n Fa
ctor
S
tand
ard
pric
e
Des
crip
tion
Uni
t U
nits
/day
R
iel/u
nit
Rie
l/uni
t E
xcav
ate,
pla
ce a
nd s
hape
ear
th
m3
1 0.
50
1.3
0.65
Tran
spor
t ear
th
m3 x
km
-
0.12
1.
3 0.
16
Com
pact
ear
th
m3
- 0.
30
1 0.
30
Exc
avat
e La
terit
e m
3-
0.36
1.
3 0.
47
Pla
ce a
nd s
hape
Lat
erite
m
36
0.60
1
0.60
Com
pact
Lat
erite
m
3-
0.60
1
0.60
Tran
spor
t Lat
erite
< 2
0 km
m
3 x k
m-
0.12
1.
3 0.
16
Tran
spor
t Lat
erite
20-
35 k
m
m3 x
km
- 0.
11
1.3
0.14
Tran
spor
t Lat
erite
35-
50 k
m
m3 x
km
- 0.
10
1.3
0.13
Tran
spor
t Lat
erite
>50
km
m
3 x k
m-
0.09
1.
3 0.
12
Roc
k fil
l 200
mm
m
3-
1.
1 -
Filte
r gra
vel
m3
-
1.3
-
Filte
r san
d m
3-
1.
3 -
Gra
ss
m3
10
0.15
-
0.15
Not
es
For t
asks
car
ried
out b
y m
achi
ne, s
tand
ard
pric
e =
Cos
t/Uni
t x C
ompa
ctio
n fa
ctor
Fo
r tas
ks c
arrie
d ou
t by
labo
r, st
anda
rd p
rice
is c
alcu
late
d:

Par
t 5: M
ater
ials
, Qua
ntiti
es a
nd C
osts
Stu
dy a
nd D
esig
n G
uide
lines
I-1
07
Labo
r Cos
t = (C
ost p
er la
bor d
ay)/(
Labo
r nor
m)
Sm
all t
ools
cos
t = L
abor
Cos
t x 3
%
Stan
dard
Pric
e =
Labo
r Cos
t + S
mal
l Too
ls C
ost +
Mat
eria
ls C
ost
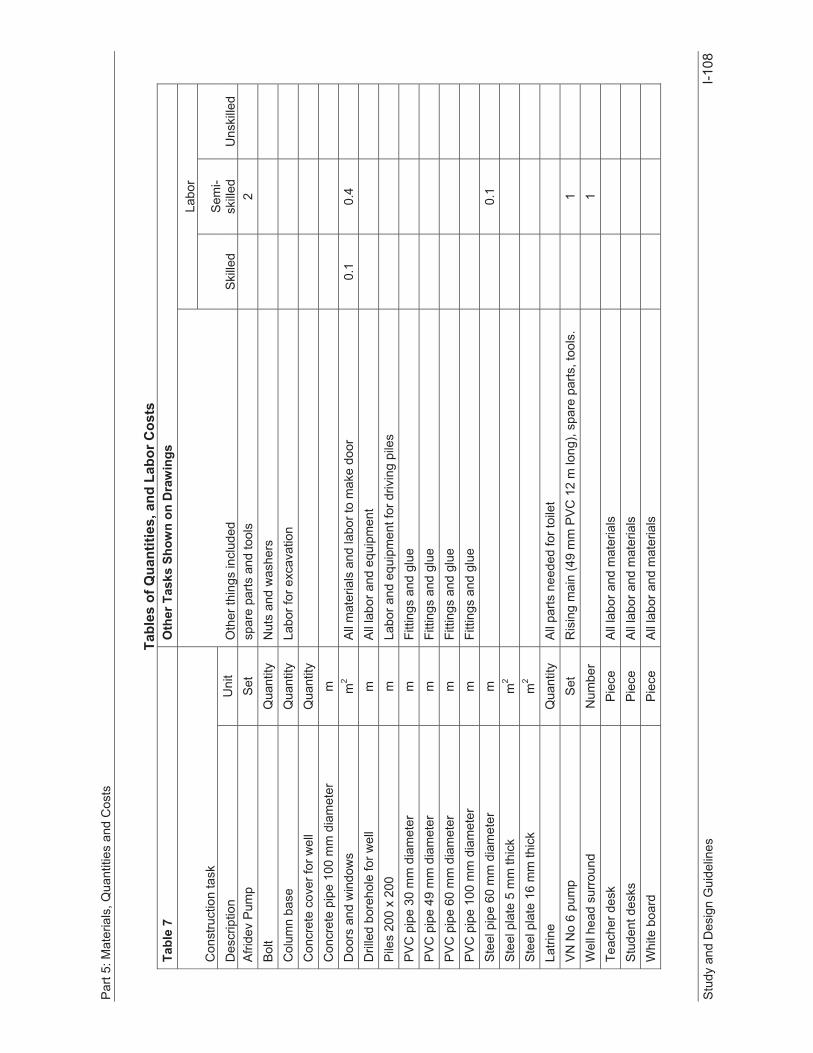
Par
t 5: M
ater
ials
, Qua
ntiti
es a
nd C
osts
Stu
dy a
nd D
esig
n G
uide
lines
I-1
08
Tabl
es o
f Qua
ntiti
es, a
nd L
abor
Cos
ts
Tabl
e 7
Oth
er T
asks
Sho
wn
on D
raw
ings
Con
stru
ctio
n ta
sk
Oth
er th
ings
incl
uded
Labo
r
Ski
lled
Sem
i-sk
illed
Uns
kille
d D
escr
iptio
n U
nit
Afri
dev
Pum
p S
et
spar
e pa
rts a
nd to
ols
2
B
olt
Qua
ntity
N
uts
and
was
hers
Col
umn
base
Q
uant
ity
Labo
r for
exc
avat
ion
C
oncr
ete
cove
r for
wel
l Q
uant
ity
Con
cret
e pi
pe 1
00 m
m d
iam
eter
m
D
oors
and
win
dow
s m
2 A
ll m
ater
ials
and
labo
r to
mak
e do
or
0.1
0.4
D
rille
d bo
reho
le fo
r wel
l m
A
ll la
bor a
nd e
quip
men
t
Pile
s 20
0 x
200
m
Labo
r and
equ
ipm
ent f
or d
rivin
g pi
les
P
VC
pip
e 30
mm
dia
met
er
m
Fitti
ngs
and
glue
PV
C p
ipe
49 m
m d
iam
eter
m
Fi
tting
s an
d gl
ue
P
VC
pip
e 60
mm
dia
met
er
m
Fitti
ngs
and
glue
PV
C p
ipe
100
mm
dia
met
er
m
Fitti
ngs
and
glue
Ste
el p
ipe
60 m
m d
iam
eter
m
0.
1
Ste
el p
late
5 m
m th
ick
m2
Ste
el p
late
16
mm
thic
k m
2
La
trine
Q
uant
ity
All
parts
nee
ded
for t
oile
t
VN
No
6 pu
mp
Set
R
isin
g m
ain
(49
mm
PV
C 1
2 m
long
), sp
are
parts
, too
ls.
1
W
ell h
ead
surro
und
Num
ber
1
Teac
her d
esk
Pie
ce
All
labo
r and
mat
eria
ls
S
tude
nt d
esks
P
iece
A
ll la
bor a
nd m
ater
ials
Whi
te b
oard
P
iece
A
ll la
bor a
nd m
ater
ials

I-109
PART 5: STUDY AND DESIGN GUIDELINES

Part 5: Study and Design Guidelines
Study and Design Guidelines I-110
5 Study and Design Guidelines
5.1 Introduction This section presents a suite of basic guidelines and procedures to help a non-specialist or non-technical person prepare a simple project design.
The scope of C/S Fund infrastructure projects is broad since it includes topics such as foundations and earthworks, buildings and structures, road engineering, resource and flood hydrology, groundwater wells, water supply, sanitation and drainage, irrigation and hydraulics. Most of these are specialist topics in their own right and even the most experienced international infrastructure expert or engineer is unlikely to be good at every topic. Therefore everyone needs a little help sometimes and this section tries to provide it.
5.1.1 Limitations Infrastructure design can be very complex. It is very difficult to reduce design to a few simple rules and guidelines. There is always a risk that the conditions at the site are outside the simplifying assumptions made for the guidelines. Yet it is equally difficult to instruct a non-specialist to spot these situations.
The problem in the past under the Seila Program and similar work by The Social Fund, NGOs and others is that the complexities of design have been too daunting for the people on the ground. Consequently they often ignored even basic and essential design procedures, took a chance and unquestioningly built whatever the community asked for. Not every time but more often than not the infrastructure variously did not work as intended or broke very soon after it was built, often because bad design choices meant it required maintenance and repair beyond the means of the community.
In fact for all the caution expressed above about the limitations of simple guidelines, in the majority of cases for simple infrastructure these guidelines, used correctly, will provide a safe and sustainable design. Most importantly the guidelines should avoid most of the big mistakes made by not carrying out design at all.
About 90% of the projects are for simple infrastructure. It is for this 90% that the guidelines have been carefully chosen. The other 10% of projects are typically outside the guidelines because they are unusual, have some complex issues, or are components of a larger project that needs a full design process; in such cases specialist advice and/or assistance should be obtained. Overall the objective of this approach is to improve the success rate of C/S Fund infrastructure projects.
5.1.2 Using the design guidance The design guidance is presented in the same order as the NCDD infrastructure group and sub-group codes. The codes are repeated in the titles.
Important note and design decisions are incorporated into the Technical Forms. Most of the forms are linked to seperated sub-programs called ‘Applets’ which are already uploaded into the Project Generator, and need to be downloaded to carry out the design to fill into Technical forms. The filled applets must be uploaded back into the Project Generator. The forms and/or applets will automatically give guidance on the recommended design and dimensions or materials as appropriate.
Guidance given in this way is highlighted in a box with a computer symbol throughout this design guideline.
The form to which the advice applies is repeated in the titles.
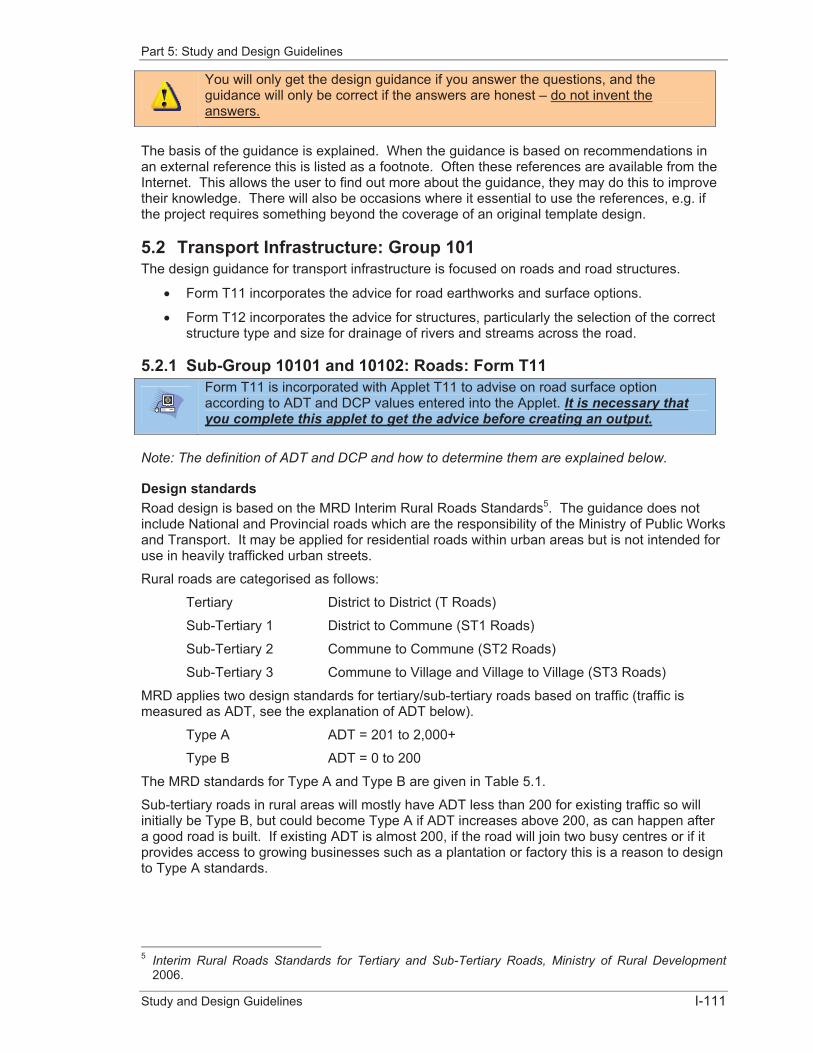
Part 5: Study and Design Guidelines
Study and Design Guidelines I-111
You will only get the design guidance if you answer the questions, and the guidance will only be correct if the answers are honest – do not invent the answers.
The basis of the guidance is explained. When the guidance is based on recommendations in an external reference this is listed as a footnote. Often these references are available from the Internet. This allows the user to find out more about the guidance, they may do this to improve their knowledge. There will also be occasions where it essential to use the references, e.g. if the project requires something beyond the coverage of an original template design.
5.2 Transport Infrastructure: Group 101 The design guidance for transport infrastructure is focused on roads and road structures.
� Form T11 incorporates the advice for road earthworks and surface options.
� Form T12 incorporates the advice for structures, particularly the selection of the correct structure type and size for drainage of rivers and streams across the road.
5.2.1 Sub-Group 10101 and 10102: Roads: Form T11 Form T11 is incorporated with Applet T11 to advise on road surface option according to ADT and DCP values entered into the Applet. It is necessary that you complete this applet to get the advice before creating an output.
Note: The definition of ADT and DCP and how to determine them are explained below.
Design standards Road design is based on the MRD Interim Rural Roads Standards5. The guidance does not include National and Provincial roads which are the responsibility of the Ministry of Public Works and Transport. It may be applied for residential roads within urban areas but is not intended for use in heavily trafficked urban streets.
Rural roads are categorised as follows:
Tertiary District to District (T Roads)
Sub-Tertiary 1 District to Commune (ST1 Roads)
Sub-Tertiary 2 Commune to Commune (ST2 Roads)
Sub-Tertiary 3 Commune to Village and Village to Village (ST3 Roads)
MRD applies two design standards for tertiary/sub-tertiary roads based on traffic (traffic is measured as ADT, see the explanation of ADT below).
Type A ADT = 201 to 2,000+
Type B ADT = 0 to 200
The MRD standards for Type A and Type B are given in Table 5.1.
Sub-tertiary roads in rural areas will mostly have ADT less than 200 for existing traffic so will initially be Type B, but could become Type A if ADT increases above 200, as can happen after a good road is built. If existing ADT is almost 200, if the road will join two busy centres or if it provides access to growing businesses such as a plantation or factory this is a reason to design to Type A standards.
5 Interim Rural Roads Standards for Tertiary and Sub-Tertiary Roads, Ministry of Rural Development
2006.
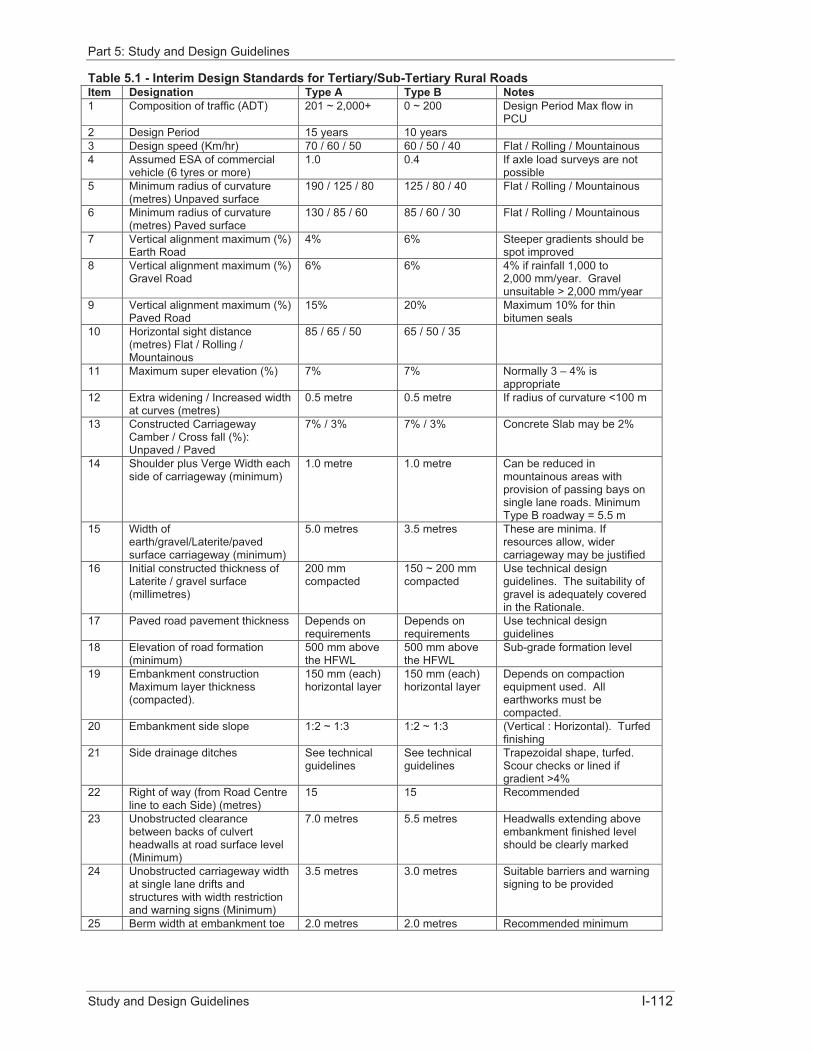
Part 5: Study and Design Guidelines
Study and Design Guidelines I-112
Table 5.1 - Interim Design Standards for Tertiary/Sub-Tertiary Rural Roads Item Designation Type A Type B Notes1 Composition of traffic (ADT) 201 ~ 2,000+ 0 ~ 200 Design Period Max flow in
PCU2 Design Period 15 years 10 years 3 Design speed (Km/hr) 70 / 60 / 50 60 / 50 / 40 Flat / Rolling / Mountainous 4 Assumed ESA of commercial
vehicle (6 tyres or more) 1.0 0.4 If axle load surveys are not
possible 5 Minimum radius of curvature
(metres) Unpaved surface 190 / 125 / 80 125 / 80 / 40 Flat / Rolling / Mountainous
6 Minimum radius of curvature (metres) Paved surface
130 / 85 / 60 85 / 60 / 30 Flat / Rolling / Mountainous
7 Vertical alignment maximum (%) Earth Road
4% 6% Steeper gradients should be spot improved
8 Vertical alignment maximum (%) Gravel Road
6% 6% 4% if rainfall 1,000 to 2,000 mm/year. Gravel unsuitable > 2,000 mm/year
9 Vertical alignment maximum (%) Paved Road
15% 20% Maximum 10% for thin bitumen seals
10 Horizontal sight distance (metres) Flat / Rolling / Mountainous
85 / 65 / 50 65 / 50 / 35
11 Maximum super elevation (%) 7% 7% Normally 3 – 4% is appropriate
12 Extra widening / Increased width at curves (metres)
0.5 metre 0.5 metre If radius of curvature <100 m
13 Constructed Carriageway Camber / Cross fall (%): Unpaved / Paved
7% / 3% 7% / 3% Concrete Slab may be 2%
14 Shoulder plus Verge Width each side of carriageway (minimum)
1.0 metre 1.0 metre Can be reduced in mountainous areas with provision of passing bays on single lane roads. Minimum Type B roadway = 5.5 m
15 Width of earth/gravel/Laterite/paved surface carriageway (minimum)
5.0 metres 3.5 metres These are minima. If resources allow, wider carriageway may be justified
16 Initial constructed thickness of Laterite / gravel surface (millimetres)
200 mm compacted
150 ~ 200 mm compacted
Use technical design guidelines. The suitability of gravel is adequately covered in the Rationale.
17 Paved road pavement thickness Depends on requirements
Depends on requirements
Use technical design guidelines
18 Elevation of road formation (minimum)
500 mm above the HFWL
500 mm above the HFWL
Sub-grade formation level
19 Embankment construction Maximum layer thickness (compacted).
150 mm (each) horizontal layer
150 mm (each) horizontal layer
Depends on compaction equipment used. All earthworks must be compacted.
20 Embankment side slope 1:2 ~ 1:3 1:2 ~ 1:3 (Vertical : Horizontal). Turfed finishing
21 Side drainage ditches See technical guidelines
See technical guidelines
Trapezoidal shape, turfed. Scour checks or lined if gradient >4%
22 Right of way (from Road Centre line to each Side) (metres)
15 15 Recommended
23 Unobstructed clearance between backs of culvert headwalls at road surface level (Minimum)
7.0 metres 5.5 metres Headwalls extending above embankment finished level should be clearly marked
24 Unobstructed carriageway width at single lane drifts and structures with width restriction and warning signs (Minimum)
3.5 metres 3.0 metres Suitable barriers and warning signing to be provided
25 Berm width at embankment toe 2.0 metres 2.0 metres Recommended minimum
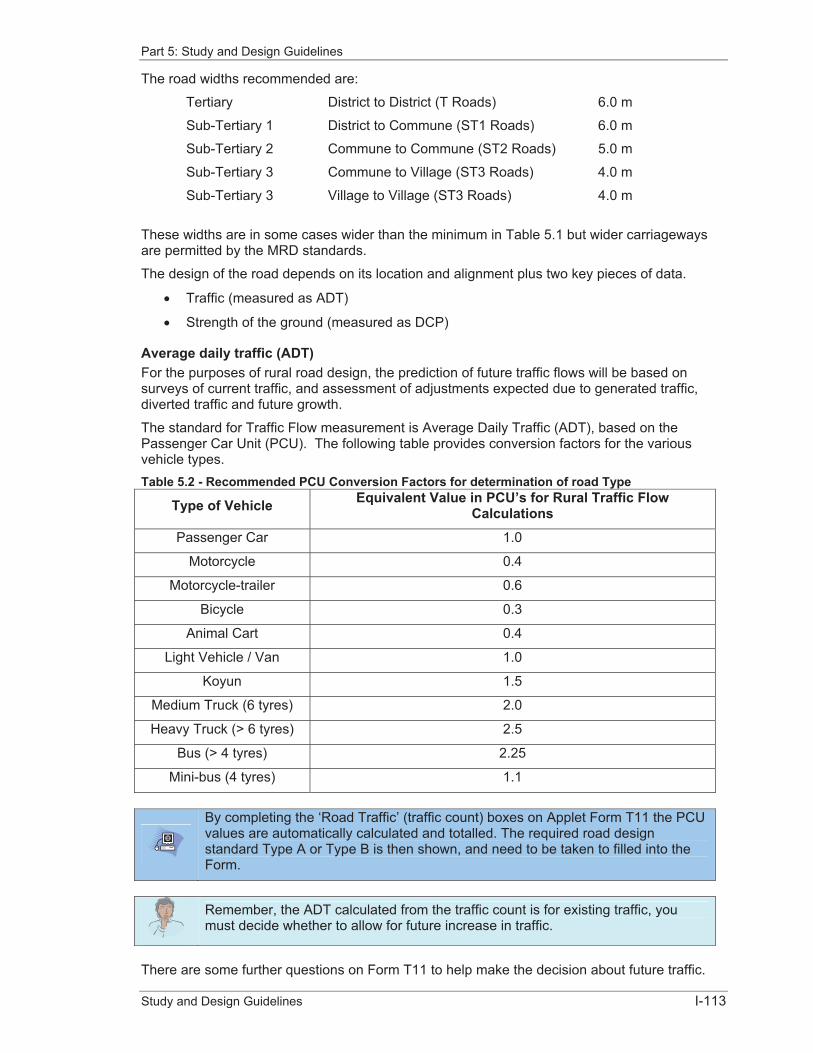
Part 5: Study and Design Guidelines
Study and Design Guidelines I-113
The road widths recommended are:
Tertiary District to District (T Roads) 6.0 m
Sub-Tertiary 1 District to Commune (ST1 Roads) 6.0 m
Sub-Tertiary 2 Commune to Commune (ST2 Roads) 5.0 m
Sub-Tertiary 3 Commune to Village (ST3 Roads) 4.0 m
Sub-Tertiary 3 Village to Village (ST3 Roads) 4.0 m
These widths are in some cases wider than the minimum in Table 5.1 but wider carriageways are permitted by the MRD standards.
The design of the road depends on its location and alignment plus two key pieces of data.
� Traffic (measured as ADT)
� Strength of the ground (measured as DCP)
Average daily traffic (ADT) For the purposes of rural road design, the prediction of future traffic flows will be based on surveys of current traffic, and assessment of adjustments expected due to generated traffic, diverted traffic and future growth.
The standard for Traffic Flow measurement is Average Daily Traffic (ADT), based on the Passenger Car Unit (PCU). The following table provides conversion factors for the various vehicle types. Table 5.2 - Recommended PCU Conversion Factors for determination of road Type
Type of Vehicle Equivalent Value in PCU’s for Rural Traffic Flow Calculations
Passenger Car 1.0
Motorcycle 0.4
Motorcycle-trailer 0.6
Bicycle 0.3
Animal Cart 0.4
Light Vehicle / Van 1.0
Koyun 1.5
Medium Truck (6 tyres) 2.0
Heavy Truck (> 6 tyres) 2.5
Bus (> 4 tyres) 2.25
Mini-bus (4 tyres) 1.1
By completing the ‘Road Traffic’ (traffic count) boxes on Applet Form T11 the PCU values are automatically calculated and totalled. The required road design standard Type A or Type B is then shown, and need to be taken to filled into the Form.
Remember, the ADT calculated from the traffic count is for existing traffic, you must decide whether to allow for future increase in traffic.
There are some further questions on Form T11 to help make the decision about future traffic.
Part 5: Study and Design Guidelines
Study and Design Guidelines I-114
Dynamic Cone Penetration Test (DCP) The dynamic cone penetrometer (DCP) and the test it performs have been introduced for C/S Fund projects under NCDD; previously it was not required for projects under Seila Program although there was no prohibition on its use.
The TRRL DCP (Dynamic Cone Penetrometer 40-T0012/A) has been in widespread use in Cambodia for many years, particularly on MRD projects. The TRRL DCP is an instrument designed for the rapid in-situ measurement of the structural properties of existing road pavements constructed with unbound materials. Continuous measurements can be made down to a depth of approximately 850 mm or when extension shafts are used to a recommended maximum depth of 2 m. Where pavement layers have different strengths the boundaries can be identified and the thickness of the layers determined.
A typical test takes only a few minutes and therefore the instrument provides a very efficient method of obtaining information which would normally require the digging of test-pits. Normally, for road one DCP test needs to be made for every 500m length or 2000 m² area.
Road pavement design is often based upon the CBR (California Bearing Ratio) of the ground or existing road. Many people have tried to correlate DCP measurements with CBR but there are many difficulties involved and it takes a lot of experience to use the results correctly if big foundations or major roads are involved. However for low-cost roads and structures the DCP can be used as an indicator of CBR sufficient for most design decisions. Line 4 on Figure 5.1 has been used in this design guidance. The recommend CBR for different types of pavement and pavement thickness have been back-converted to DCP so that the DCP measurements can be used directly for design.
The GPS coordinates and results in mm/blow are entered on Applet T11 for tests along the road alignment, as many tests as needed. The applet then calculates the 20 percentile DCP for all the tests (20 percentile is the value for which 80% of test sites are equal or stronger).
If all tests give similar results then the 20 percentile value can be used for design. But if the soil strength indicated by the test in some locations is much lower than the 20 percentile value then you should consider a stronger road design for these places.
The 20 percentile DCP or individual tests results for locations with weak soil are used together with the ADT to select the type of road and pavement thickness. If the road is at grade (ground level) then the DCP tests in the ground are used. If the road is on an existing embankment then the embankment must be tested. If the road will be built on new embankment, then the guidance assumes that this will be built with correctly compacted and suitable fill, and that it will therefore be good for road pavement construction.
Surfacing options Once the ADT and DCP data are entered on the first worksheet of Appet T11, suitable surfacing options are listed automatically including the thickness of pavement layers when these apply on the second worksheet of the form.
All options are listed, including the more expensive paved road options. However unacceptable options are shown as unsuitable surfacing, e.g. earth roads are not suitable for ADT > 20 and will be shown as unsuitable if ADT is 45.

Part 5: Study and Design Guidelines
Study and Design Guidelines I-115
Figure 5.1 – Conversion of DCP to CBR
The basis of the design guidance incorporated into Form T11 for road types used by the C/S Fund is as follows.
Type: 1010101 Earth road Traffic: Suitable for ADT � 20 ADT of which no more than 2 heavy trucks, buses or
mini buses. Pavement: No guidance for DCP test results but > 15 mm/blow indicates the ground is
too weak for at grade road construction, either the ground must be excavated and compacted or the road must be on compacted fill embankment.
Part 5: Study and Design Guidelines
Study and Design Guidelines I-116
Types: 1010102 Laterite road 1010103 Natural gravel road 1010104 Sand road 1010105 Crushed stone road Note: Unbound natural sand is unsuitable for road pavements but compacted stone dust used for roads in some parts of Cambodia is commonly referred to as a ‘sand road’.
Traffic: Light traffic: Suitable for ADT � 25 ADT of which no more than 2 heavy trucks, buses or mini buses.
Medium traffic: Suitable for ADT � 100 ADT of which no more than 21 heavy trucks, buses or mini buses.
Heavy traffic ADT > 100 – Unpaved roads are unsuitablePavement6: Light traffic: At grade or in cut: If DCP < 15 mm/blow pavement
thickness 150 mm. If DCP = 15 to 32 mm/blow print pavement thickness 200 mm. If DCP > 32 mm/blow print pavement thickness 250 mm but also consider other surface.
On embankment: Pavement thickness 200 mm Medium traffic: At grade or in cut: If DCP < 15 mm/blow pavement
thickness 250 mm but also consider other surface If DCP = 15 to 32 mm/blow print pavement thickness 300 mm but also consider other surface If DCP > 32 mm/blow prints pavement thickness more than 300 mm but also consider other surface.
On embankment: Pavement thickness 300 mm but also consider other surface.
Type: 1010201 Dressed stone road Traffic: Not a constraint for use for rural or residential road. Pavement7: Stone layer: Stone thickness for all uses not less than 150 mm Sand sub-base layer: Stone shall be bedded on a sand layer not less than
50 mm
Type: 1010202 Mass concrete road Traffic: Not a constraint for use for rural or residential road. Pavement8: Concrete slab: Slab thickness 200 mm Sand road-base layer: Sand road-base thickness 50 mm Sand sub-base layer: Sand sub-base thickness 300 mm
Type: 1010203 Steel-reinforced concrete road Traffic: Not a constraint for use for rural or residential road. Pavement: Concrete slab: Thickness 150 mm
6 PIARC, TRL & Intech Associates. Rural Road Surfacing: Surface Options – Gravel, Ref: RR Surface
3h, June 2003. (Note: Pavement thicknesses adopted are for high rainfall more than 1,500 mm/year with long dry season).
7 Gourley Dr C et al. Low Cost Road Surfacing (LCS) Project, LCS Working Paper No12 – Paving the Way for Rural Development & Poverty, CSIR, TRL, Intech Associates, September 2002.
8 Azam A I et al. Low Cost Road Surfacing (LCS) Project, LCS Working Paper No7 – Bamboo Reinforced Concrete Pavement Road Construction in Cambodia, ILO, Intech Associates, June 2002.

Part 5: Study and Design Guidelines
Study and Design Guidelines I-117
Sand road-base layer: Thickness 50 mm Sand sub-base layer: Thickness 300 mm
Type: 1010204 Mesh-reinforced concrete road Traffic: Not a constraint for use for rural or residential road. Pavement: Concrete slab: Thickness 150 mm Sand road-base layer: Thickness 50 mm Sand sub-base layer: Thickness 300 mm
Type: 1010205 Double Bituminous Surface Treatment (DBST) road Traffic: Not a constraint for use for rural or residential road. Pavement: Surface: Two layers of stone chippings. Road-bas: Thickness 75 mm Sub-base: Thickness 225 mm
Type: 1010206 Single Bituminous Surface Treatment (SBST) road Traffic: Not a constraint for use for rural or residential road. Pavement: Surface: Two layers of stone chippings. Road-bas: Thickness 75 mm Sub-base: Thickness 225 mm
Type: 1010207 Asphalt concrete (AC) road Traffic: Not a constraint for use for rural or residential road. Pavement: Surface: NOT YET DECIDED. Road-bas: Thickness 75 mm Sub-base: Thickness 225 mm
Type: 1010208 Brick paved road Traffic: Not a constraint for use for rural or residential road. Pavement9: Brick layer: Brick thickness for all uses not less than 70 mm Sand sub-base layer: Bricks shall be bedded on a sand layer not less than
50 mm
Road Suface and Pavement Thickness The road surface must be chosen and its thickness must be entered as recommended by Applet T11.
Form T11 requires you to choose road surface and enter pavement thickness. This is deliberate with the intention of permitting selection of a non-recommend thickness. For example a 200mm Laterite road may be chosen even when Applet T11 suggests only 300mm laterite road types are suitable. This allows the project to proceed even if there is insufficient money for the recommended road type and pavement thickness. The form provides a record that design advice was not followed and this may require you to later justify the decision.
The questions on Form T11 for Materials for Construction should be considered when selecting the type of road, e.g. if Laterite has to be hauled 100 km it is probably not the best choice, either in terms of initial construction, or in terms of maintainability.
5.2.2 Sub-Group 10103 to 10108: Road Structures: Form T12 This design guidance relates to road structures that provide drainage across the road and includes all types of bridges, culverts and low-level crossings. 9 Gourley Dr C et al. Low Cost Road Surfacing (LCS) Project, LCS Working Paper No12 – Paving the
Way for Rural Development & Poverty, CSIR, TRL, Intech Associates, September 2002.

Part 5: Study and Design Guidelines
Study and Design Guidelines I-118
There must be one T12 form for each road structure. The form will attach with it an Applet T12 used to obtain advice on structures to be chosen before creating a project. If catchment area can be defined, it is a must to use the applet.
Note:Explanation on questions to be answered in the applet can be found from the Hydrology and hydraulic capacity section below.
Design standards Template designs for culverts provide a minimum unobstructed width of 5.5 m between the backs of culvert headwalls at road surface level. This complies with the MRD Design Standards for Type B roads (Table 5.1). For Type A roads the width should be 7.0 m. Pipe culverts can be made wider by adding extra pipes. For box culverts width between headwalls of the box section walls and slabs will have to be increased and will require more concrete and reinforcing steel. Extra width will also be needed for a high embankment because the bottom of the slopes is farther apart.
Template designs for concrete bridges provide an unobstructed width of 4.5 m which is consistent with contemporary MRD road projects. A wider roadway will require a modified design which will require the assistance of a qualified structural engineer. The particular concern is the hanging beams which support the bridge; these also provide the bridge parapets. The beam reinforcement would have to be increased for a wider roadway. Also the abutment walls and deck slab will have to be increased in width and will require more concrete and reinforcing steel, as well as extra piles for piled foundations.
Concrete bridges are designed for AASHTO HS 20-44 20 tonne loading.
The wooden bridge template design is unchanged from the Seila Template and has a notional 5 tonne loading.
Steel bridges including Bailey Bridges are not covered by this design guidance and specialist advice should be sought on an as-needed basis.
Road classification The road classification, standard and width are entered manually, but if Form T12 has been generated by a Form T11 then the information is entered the same as the road form.
If the project is for an isolated road structure then the road classification, road standard and road width questions will have to be answered. It is not necessary to conduct a traffic count to determine the road standard; judgement can be used to answer this question.
Scope of works The questions relating to the scope of works focus on the description, sizes, condition and causes of damage to existing structures. It is important to complete this information in order to understand the problems at the site, e.g. a culvert that collapsed due to scour is a very definite indication that the structure was too small for the flow, and/or that the new structure requires scour protection.
Pay attention to the questions asked and think about the causes of the problems.
Material available for construction These questions indicate whether there will be problems complying with the Specification, e.g. if gravel will come from a river then it will be rounded and unsuitable for concrete.
Soils and Dynamic Cone Penetration Test (DCP) Information on soils and DCP tests is needed to consider whether the foundations will be strong enough to support the structure, also whether they will be particularly vulnerable to erosion and scour.

Part 5: Study and Design Guidelines
Study and Design Guidelines I-119
The DCP results are used in the same way as described for road projects. One test may be sufficient for a small culvert but for large culverts and bridges it is recommended to check each bank and the water channel, as many times as necessary.
For concrete bridges it is recommended to have an investigation borehole at each abutment. It is recognised that this adds to the cost but a bridge is a big investment. If the bridge is on piled foundations the risk of not sinking an investigation borehole is reduced.
The template designs for concrete bridges are for single spans and do not require an intermediate pier. However, if multiple spans are required then investigation boreholes should also be sunk in the river bed as close as practical to each pier location. Hydrology and hydraulic capacity The size of a bridge, culvert or low level crossing and any protection works must be chosen for the flow and flood conditions at the site. Deciding flow and flood conditions can be difficult where the land is very flat and/or where the natural drainage has been altered by roads, embankments and irrigation systems.
Two situations occur:
� flow at the structure comes from a single catchment; or
� the structure is in a flat and/or flood area where water can come from distant and large catchments.
The design guidance is focused on being able to define the catchment and its characteristics. This is described first below. The guidance that applies for large flat and flood areas follows.
By answering a few simple questions about the catchment on Applet Form T12 you will automatically be told the estimated peak flood flow, advised on the most suitable size of structure, and told the exit velocity for flow from the structure.
What do we mean by a catchment? The catchment area at a structure is the area of land from which water (runoff) flows to that structure when there is rain. (If you collect rainwater from a roof, the catchment is the area of land kept dry by the roof). Figure 5.2 – Example of a catchment
It is easier to understand the concept of catchment area where the land is hilly and there are streams in every valley. When there is rainfall, the stream that the water flows to is controlled by the slope of the land, e.g. if 30% of the land where the rain falls slopes towards stream A, then it will receive 30% of the rainfall, the remaining 70% will flow to other streams.
The line separating the catchment of stream A from the other streams is the water divide where water flows away in two directions into adjacent catchments. This is a line drawn following the highest ground between the catchments. Therefore, catchment boundaries are usually defined on contoured maps such as the example at Figure 5.2. Sometimes however, particularly when the land is very flat, it is not the contours that form a catchment boundary but an artificial boundary such as a field bund, track or road embankment that intercepts flow and sends it in a different direction and into a different catchment than would be the case for the natural undeveloped landscape.
Water divide
Catchment area A = 5.8 km2
Culvert

Part 5: Study and Design Guidelines
Study and Design Guidelines I-120
Catchment boundaries cannot cross a stream. Every plot of land must be in the catchment of one stream or another, if you draw the catchment divides between several streams and have any area of land left over where you do not know where the water flows, it means you have made a mistake and need to correct the boundaries.
Factors that control catchment runoff The main factors which control the size and time of runoff are:
� Catchment area � Rainfall � Land slope � Vegetation � Soils � Catchment shape � Available (flood water) storage in lakes, swamps and rice paddies � Settlements (villages, towns and infrastructure)
The above list is in declining order of importance, although the order may sometimes change, for example a large lake would be near the top of the list.
The interrelationships between these factors that control the peak runoff are extremely complex, and despite years of global research and observation, the estimation of runoff remains approximate and uncertain. Fortunately, most catchment characteristics change only very slowly with time. Their interaction is therefore reflected in the size, shape and type of river or waterway. It is as important to visit the site and look at the channel and land upstream and downstream of the structure; as it is to consider the other listed factors.
Where the river channel or waterway has already been spanned by a bridge or culvert, the length of time that the structure has successfully resisted being washed away and its performance during floods will provide useful information for design. It can be argued that if the structure has survived without damage it is already the optimum size for the site, eliminating the need for further hydrological studies. One flaw in this argument is that many unimproved roads are at low-level on little or no embankment and flood flows can then easily bypass a structure without causing major damage. An improved road on a raised embankment will completely change this situation (Figure 5.3).
The key point is that field investigation must be thorough, and the conclusions made must be well considered, in order to avoid mistakes.
Figure 5.3 - The difference between flow bypassing a culvert where the road is at low-level or where it is on embankment.
Overland flow
Overland flow too large for culvert can bypass and flow over low-level
road with minimal damage.
Flow Flow
Low-level road Road on embankment
Culvert
Road
Overland flow too large for culvert floods upstream of high embankment until it
flows across the road with risk of erosion, scour and embankment breach.

Part 5: Study and Design Guidelines
Study and Design Guidelines I-121
Methods of flow estimation The recommended method of flow estimation is the Generalised Tropical Flood Model10
(GTFM). This method has been used quite often in Cambodia, usually by consultants, the first use was probably for the emergency flood projects at MPWT in 2001 and subsequently projects under MRD and MOWRAM. It gives good results for small to medium catchments up to and larger than would require the culvert and small bridge template designs accompanying this design guidance. The method takes into account all the factors that affect catchment runoff and the information can usually be obtained from available maps. The method is also easy to use in a spreadsheet or as an applet.
The alternatives to the GTFM include:
� Rational method
� US Soil Conservation Service (Curve Number) Method
� SWAT Model.
The Rational Method is intended for urban catchments and because of the simplifying assumptions that apply only for these conditions it should not be used for rural catchment more than 0.8 km2 area otherwise it grossly overestimates flow11. Because the method is so simple to use it is used mistakenly by many people. The GTFM can be used for small catchments so there is no need to consider the Rational Method.
The US SCS Method is quite complicated to use correctly and requires catchment data not generally available directly from maps. Since it is no more reliable than the GTFM it has not been used.
The SWAT model is a river basin, or catchment, scale model developed for the United States Department of Agriculture Agricultural Research Service and used by the Mekong River Commission. It is intended for water resource planning rather than peak flow prediction, requiring the software and knowledge how to use it. These factors make it unsuitable for road structure design.
The next few sections give the basic theory for using the GTFM, it is good to understand these but it is not essential provided the questions on Form T12 are answered correctly.
RainfallAll the methods of flow estimation discussed above including the GTFM are known as rainfall-runoff models, that means a ‘design’ rainfall is assumed for the catchment and the models take into account the factors that determine what percentage of the rain will appear as runoff at the structure, what percentage stays in the catchment in the soils, or is used by vegetation, etc, and also the timing and size of the peak flow at the structure.
For road structure design it is necessary to know the rainfall intensity in mm/hr over different durations between 5 minutes and 24 hours, and for different return periods. This information can be obtained by measuring rainfall with a continuously recording rain gauge over a period of not less than 10 years. In Cambodia such a record only exists for Phnom Penh International Airport (Pochentong) for a period of 16 years, although the national coverage of rain gauges and records is fairly good these are all daily (24 hour) rain gauges. This is overcome by using the method of Rainfall Ratios and converting the 24 hour rainfall to shorter duration by applying indices derived by back analyses of the record at Pochentong. This technique is described in
10 Watkins L H and Fiddes D. Highway and Urban Hydrology in the Tropics, Pentech Press, London,
92-100 (1984). 11 Chow V T. Handbook of Applied Hydrology, McGraw-Hill Co, London (1964).

Part 5: Study and Design Guidelines
Study and Design Guidelines I-122
Watkins and Fiddes12. The indices vary from region to region according to rainfall characteristics but the rainfall at Phnom Penh is representative of that for lowland Cambodia.
To avoid the need to obtain rainfall records and use different rainfall charts for each location the design guidance is based on long term rainfall records at 21 locations covering the most populace areas of the country. The 80 percentile values for these data are shown in Figure 5.4 and Figure 5.5 as rainfall rainfall-intensity-duration and total rainfall curves respectively for return periods 1 in 2.3313, 5, 10, 25, 50 and 100 years.
By default the design guidance applied by T12 uses these rainfall curves for design because they are appropriate for most places in Cambodia. However, the form has the option to apply 33% greater rainfall in known high rainfall areas.
Return period The larger and more expensive structures are designed for a longer return period rainfall/flow than the smaller ones; the logic is that it is easier and cheaper to replace a small structure than a large one. This approach is used in all countries and is applied by MRD for road structures. This design guidance applies the following standards.
Table 5.3 – Road structure design return period for peak flow Structure type Design return period TR
Bridge �10m 1 in 50 year Small bridge <10m 1 in 25 year
Large box 1 in 25 year Small box 1 in 10 year
Low level crossing 1 in 10 year Pipe 1 in 10 year
GTFMThe advice on use of the GTFM that follows is applied automatically by answering all the questions on T12. This is explained in Design procedures below.
The Generalised Tropical Flood Model is expressed by the formula:
B
AR T
ARFFAPCQ�
�����
360Where QR : peak flow of return period R years (m3/s).
R : return period (years). CA : is the percentage runoff coefficient. P : is the design storm rainfall (i.e. total rainfall in mm not intensity in
mm/h) of hydrograph base time (TB hours). A : is the catchment area in km2.F : is the peak flow factor to convert the average flow generated by the
model to peak flow, F=2.5 is suitable for structures in Cambodia. ARF : is the area reduction. TB : is the hydrograph base time (hours).
12 Watkins L H and Fiddes D. Highway and Urban Hydrology in the Tropics, Pentech Press, London,
92-100 (1984) 13 A return period of 1 in 2.33 years is the mean annual peak rainfall.
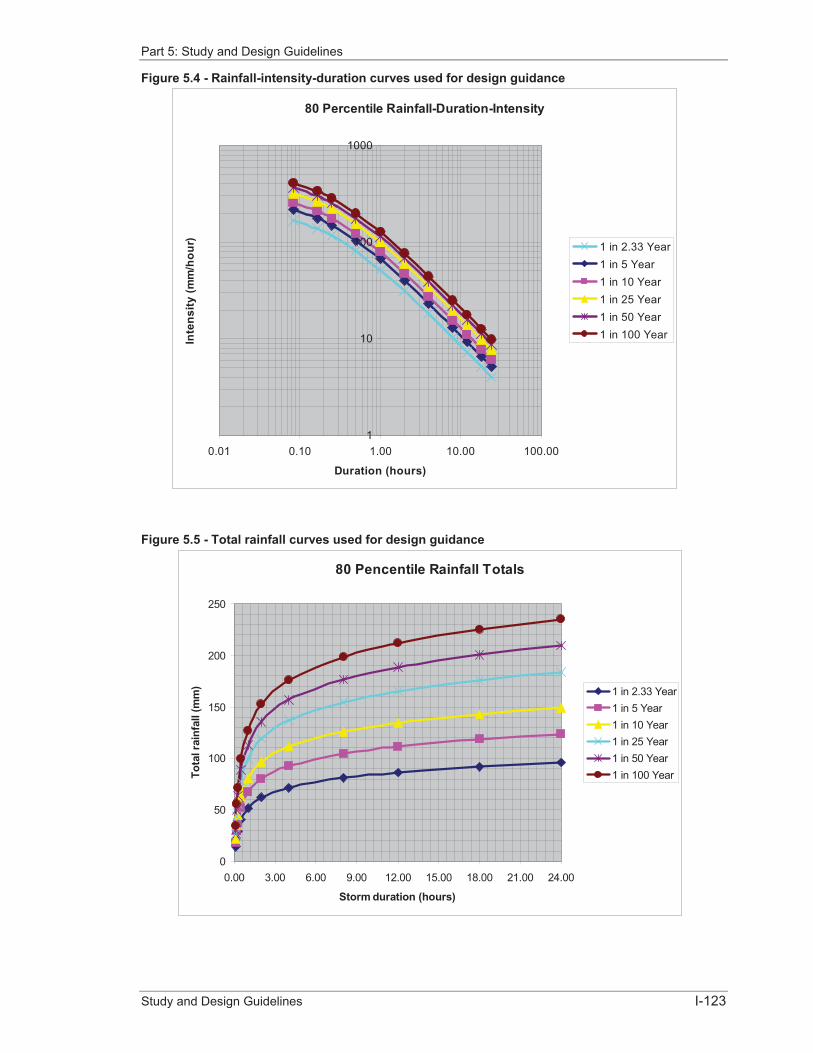
Part 5: Study and Design Guidelines
Study and Design Guidelines I-123
Figure 5.4 - Rainfall-intensity-duration curves used for design guidance
80 Percentile Rainfall-Duration-Intensity
1
10
100
1000
0.01 0.10 1.00 10.00 100.00
Duration (hours)
Inte
nsity
(mm
/hou
r) 1 in 2.33 Year1 in 5 Year1 in 10 Year1 in 25 Year1 in 50 Year1 in 100 Year
Figure 5.5 - Total rainfall curves used for design guidance
80 Pencentile Rainfall Totals
0
50
100
150
200
250
0.00 3.00 6.00 9.00 12.00 15.00 18.00 21.00 24.00
Storm duration (hours)
Tota
l rai
nfal
l (m
m) 1 in 2.33 Year
1 in 5 Year1 in 10 Year1 in 25 Year1 in 50 Year1 in 100 Year

Part 5: Study and Design Guidelines
Study and Design Guidelines I-124
The peak flow QR is the flow used to select the structure type and size. The hydraulic capacity is chosen to pass this flow.
The return period R is selected for the proposed structure (Table 5.3). If the structure required is different to that originally proposed it may be necessary to restart the calculation (by changing the proposed structure at the beginning of the form) until the return period is correct for the structure type and size.
The percentage runoff coefficient CA is express by the formula:
LWSA CCCC ���Where CS : is the standard value of contributing runoff coefficient, from and is
dependant on Soil Class I , from Table 5.4 and Slope Class S , from Figure 5.6.
CW : is the catchment wetness factor which is dependent on soil moisture recharge (SMR). Because Cambodia is within a wet zone (SMR > 75 mm) the value adopted should always be 1.00.
CL : is the land use factor from Table 5.6.
Soil Class I is selected from Table 5.4. Table 5.4 – Soil Class ISoil characteristic Description Soil class (I)Impermeable rural Rock surface 1Impermeable settlements Paved urban, village centre 1
Very low permeability
Clay soils with high swelling potential; shallow soils over largely impermeable layer, very high water table.
2
Flooded paddy Mostly flooded paddy in wet season 2
Low to very low permeability Impeded drainage and areas of flooded paddy in wet season 2.5
Low permeability Drainage slightly impeded when soil fully wetted. 3Low to fairly permeable Deep soils but areas of flooded paddy in wet season 3.5
Fairly permeable Deep soils of relatively high infiltration rate when wetted. 4
Very permeable Soils with very high infiltration rates such as sands, gravels and aggregated clays. 5
Slope is measured along the path taken by the water, therefore this must be along the length of the stream or flow path, not the straight line distance but the distance allowing for twists and turns of the stream, or the valley if there is no stream. Slope must also be representative for the catchment. For this reason it is measured between two point 10% and 85% distance up the catchment measured from the structure. This eliminates error due to a steep rise at the top of the catchment, a situation which is common in many places in Cambodia where steep mountains are beside flat plains. Hence slope is calculated from the formula.
10075.0
1085 ���
�LElvElv
Slope
Where Elv85: is the elevation 85% of the distance up the catchment from the structure (m)
Elv10: is the elevation 10% of the distance up the catchment from the structure (m)
L: The distance between the structure and the catchment boundary measured along the stream and the flow line beyond the stream to the boundary (m)
100: Conversion to percent.
Slope Class S is read off Figure 5.6.

Part 5: Study and Design Guidelines
Study and Design Guidelines I-125
Figure 5.6 – Slope Class S
Having determined the soil class S and slope class I the standard value of contributing runoff coefficient CS is calculated from the following formula. Values for CS are also shown in Table 5.5.
SICS 81253 ���Where CS: is the standard value of contributing runoff coefficient.
I: is the Soil Class. S: is the Slope Class.
Table 5.5 – Standard value contributing runoff coefficient CS
Slope Class S Soil Class I1 2 3 4 5
1 49 37 25 13 1 2 57 45 33 21 9 3 65 53 41 29 17 4 73 61 49 37 25 5 81 69 57 45 33 6 89 77 65 53 41
Land use class CL is looked-up from Table 5.6.
Catchment slope classification
0
5
10
15
20
25
30
1 2 3 4 5 6
Slope Class (S)
Ave
rage
cat
chm
ent s
lope
(%)

Part 5: Study and Design Guidelines
Study and Design Guidelines I-126
Table 5.6 – Land Use Class CLLand use characteristics Catchment type CLSettlements Urban or village centre 1.00Bare soils Largely bare soil 1.50Cultivated Intensive cultivation 1.50Grassland Grass cover 1.00Dense vegetation Dense vegetation (particularly in valleys) 0.50Forest thin soil Forest: (a) shallow impermeable soils 1.00Forest steep slopes Forest: (b) very steep (S5, S6) permeable
soils 0.67
Forest other Forest: (c) deep soils and gentle slopes 0.33
The design rainfall P is obtained from Figure 5.5 for the calculated value of TB (see below) and the selected return period.
If you have reason to think the structure is in a high rainfall area then it is recommended that Pbe increased by 33%. This is done automatically by selecting the high rainfall option on Form T12.
The catchment area A is measured from the map.
The peak flow factor F converts the average flow generated by the model to peak flow, F=2.5 is a suitable peak flow factor for structures in Cambodia.
The area reduction factor ARF is introduced to take into account that rainfall at any given instant varies over the catchment. In simple terms, the average rainfall intensity at any instant for a catchment will be less than the rainfall measured at a single point in the catchment, and the difference increases with increasing size of catchment. Therefore, this is not significant for small catchments but becomes so as catchment size increases. The relationship adopted for ARF is suitable for the convective rainfall14 that occurs in Cambodia:
50.033.004.01 ATARF ���Where T : is duration in hours
A : area in km2
This equation applies for storms of up to 8 hours duration. For longer durations on large catchments the value calculated for T = 8 hours is used.
The hydrograph base time TB can be thought of as being made up of three components: the storm duration, the time taken for the surface runoff to drain into the stream system; and the flow time down to the structure.
Base time TB is expressed by the formula:
SB TSACT �
�� 2
5.0
Where C : a constant, which is 30 for Cambodian catchments. A : the catchment area (km2).S : the Slope Class S.TS : the surface cover flow time from Table 5.7.
14 Convective rainfall occurs where there is low pressure and air movement is mostly vertical.
Evaporation is high early in the day and moisture is carried high by vertical currents. Rainfall occurs usually in the afternoon or early evening.
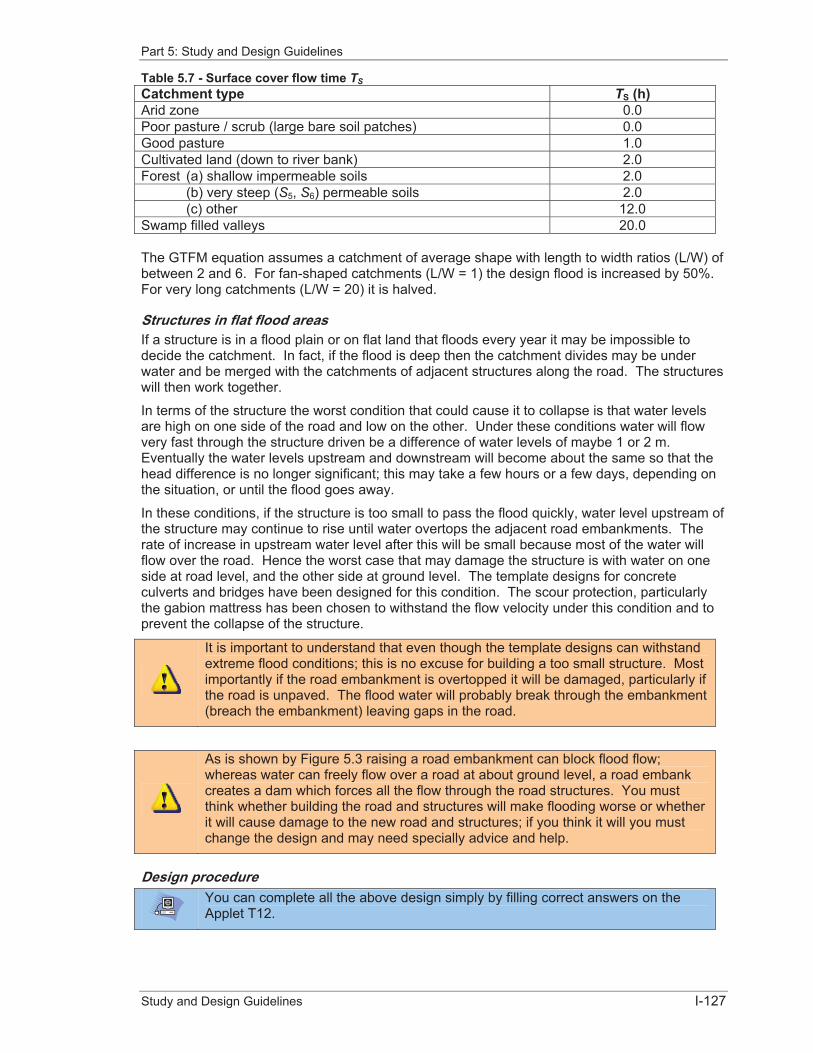
Part 5: Study and Design Guidelines
Study and Design Guidelines I-127
Table 5.7 - Surface cover flow time TS
Catchment type TS (h) Arid zone 0.0 Poor pasture / scrub (large bare soil patches) 0.0 Good pasture 1.0 Cultivated land (down to river bank) 2.0 Forest (a) shallow impermeable soils 2.0 (b) very steep (S5, S6) permeable soils 2.0 (c) other 12.0 Swamp filled valleys 20.0
The GTFM equation assumes a catchment of average shape with length to width ratios (L/W) of between 2 and 6. For fan-shaped catchments (L/W = 1) the design flood is increased by 50%. For very long catchments (L/W = 20) it is halved.
Structures in flat flood areas If a structure is in a flood plain or on flat land that floods every year it may be impossible to decide the catchment. In fact, if the flood is deep then the catchment divides may be under water and be merged with the catchments of adjacent structures along the road. The structures will then work together.
In terms of the structure the worst condition that could cause it to collapse is that water levels are high on one side of the road and low on the other. Under these conditions water will flow very fast through the structure driven be a difference of water levels of maybe 1 or 2 m. Eventually the water levels upstream and downstream will become about the same so that the head difference is no longer significant; this may take a few hours or a few days, depending on the situation, or until the flood goes away.
In these conditions, if the structure is too small to pass the flood quickly, water level upstream of the structure may continue to rise until water overtops the adjacent road embankments. The rate of increase in upstream water level after this will be small because most of the water will flow over the road. Hence the worst case that may damage the structure is with water on one side at road level, and the other side at ground level. The template designs for concrete culverts and bridges have been designed for this condition. The scour protection, particularly the gabion mattress has been chosen to withstand the flow velocity under this condition and to prevent the collapse of the structure.
It is important to understand that even though the template designs can withstand extreme flood conditions; this is no excuse for building a too small structure. Most importantly if the road embankment is overtopped it will be damaged, particularly if the road is unpaved. The flood water will probably break through the embankment (breach the embankment) leaving gaps in the road.
As is shown by Figure 5.3 raising a road embankment can block flood flow; whereas water can freely flow over a road at about ground level, a road embank creates a dam which forces all the flow through the road structures. You must think whether building the road and structures will make flooding worse or whether it will cause damage to the new road and structures; if you think it will you must change the design and may need specially advice and help.
Design procedure You can complete all the above design simply by filling correct answers on the Applet T12.
Part 5: Study and Design Guidelines
Study and Design Guidelines I-128
Form T12 incorporates applet T12 that completes the recommended hydrological and hydraulic calculations. You need to answer a series of questions in the applet, then you need to copy the necessary responses and recommendations directly to the form.
The questions are listed below together with explanation of the reason for the questions and advice on how to answer.
What type of structure is envisaged?Choose the type of structure you expect to provide.
The applet needs this information to select the correct return period, Table 5.3.
Can catchment be defined?This question decides whether the flow to the structure is from a large flat flood area or a catchment that can be measured.
If the catchment cannot be defined then the form prints ‘Flow estimation not possible, design for road overtopping’ and no further questions appear.
If you get this response you should seek specialist advice because the project proposal may not be viable and sustainable.
What is the catchment area in km2?Used by the applet for calculations. Measured from Topo Map What is the length of catchment in metres?Used by the applet for calculations. Measured from Topo Map What is the land elevation 10% up catchment?What is the land elevation 85% up catchment?Used together with the length of the catchment to calculate the catchment slope. The applet then selects the Slope Class S.
The most reliable way to measure elevation is by topographical survey. Hand held GPS cannot be used because the elevation measurement shown is only approximate. Often it is possible to get acceptable slope measurements from maps. For example if the catchment is between 10 m interval contours 4.0 km apart then the land slope is (10 ÷ 4000) x 100 = 2.5%. You adjust the answers so that the program calculates this slope. Be careful using spot heights on maps, they often show roads level and are not correct for general land level and slope.
What are the catchment soil characteristics?Used by the applet to select Soil Class I. You chose from the selection in Table 5.4,
the table provides more detailed description for guidance. Be careful to choose soils representative for the catchment because the soils at the road may be different.
What are the catchment land use characteristics?Used by the applet to select Land Use Class CL.
You chose from the selection in Table 5.6, the table provides more detailed description for guidance. Be careful to choose for land use in the catchment not that beside the road.
What are the catchment surface cover flow time characteristics?Used by the applet to select Surface Cover Flow Time TS.
You chose from the selection in Table 5.7.
Part 5: Study and Design Guidelines
Study and Design Guidelines I-129
Is location a normal or very heavy rainfall location?The applet will factor-up the rainfall by 33% if you answer that it is a heavy rainfall location.
You use this option if you believe there is unusually high rainfall, maybe because the road is in a mountain location, because the streams are big, or local people have told you so. For all other areas chose ‘normal’.
Then you need to copy the following calculation results from Applet T12 to Form T12: � Design(peak) flow in cubic metres per second � A suitable structure � Velocity at the structure outlet in metres per second.
Does this match the structure entered at method selection?The program asks this question as a cross-check that the recommended structure is the same as you proposed.
If the structures are different you may need to repeat the process by starting with the recommended structure. This is particularly necessary if the recommended structure needs to be designed for a different return period.
Structure flow capacity and velocity The flow and therefore the exit velocity of a structure depends on the relative water levels upstream and downstream of the structure. The flow condition that has the lowest design discharge is different to that which has the highest exit velocity (because the latter is for the highest design discharge). The design guidance generated by Form T12 for flow uses safe assumptions for the condition giving the lowest flow, and the condition giving the highest velocity, these being the worst cases for design.
There are six recognized flow types, strictly these apply for culverts but there is no difference hydraulically between a box culvert and a small bridge. A primary reference is Bodhaine15.
The flows, velocities and associated flow types applied by the applet are listed in Table 5.8. The flow types are defined as follows:
Type A: Part full, critical depth at inlet
Type E: Full, wall friction, backwater from downstream
Type F: Full, wall friction, critical depth at outlet
Note that there is a progressive increase in capacity for the structures listed in Table 5.8. These are the preferred structures. For example you could use 4 x 0.6 m pipes for a flow of 1.7 m3/sbut it is better to use a single 1.0 m pipe which will provide 1.80 m3/s capacity.
In the interests of ease of maintenance and to reduce blockage it is good practice not to use pipes smaller than 1.0 m diameter. Also note that it is acceptable (and in many countries also required for environmental reasons) to set the bottom of the pipe 100 to 200 mm below the stream bed, the reduction in capacity is negligible but it minimises the need to ramp a road over a culvert.
Wooden and steel bridges Form T12 does not specifically recommend wooden or steel bridges. This is because they will usually be temporary structures which will in the future be replaced by a concrete bridge or large box culvert. However Form T12 can still be used to estimate the peak flow at the bridge. Table 5.8 can even be used as a rough guide to the required length of a wooden or steel bridge; it can be seen that each metre of full height span provides about 8 m3/s of flow capacity.
15 Bodhaine GL. 1968, Measurement of Peak Discharge at Culverts by Indirect Methods: U.S. Geol.
Survey Techniques Water-Resources Inv., book 3, chap. A3, 60 p, 1968.
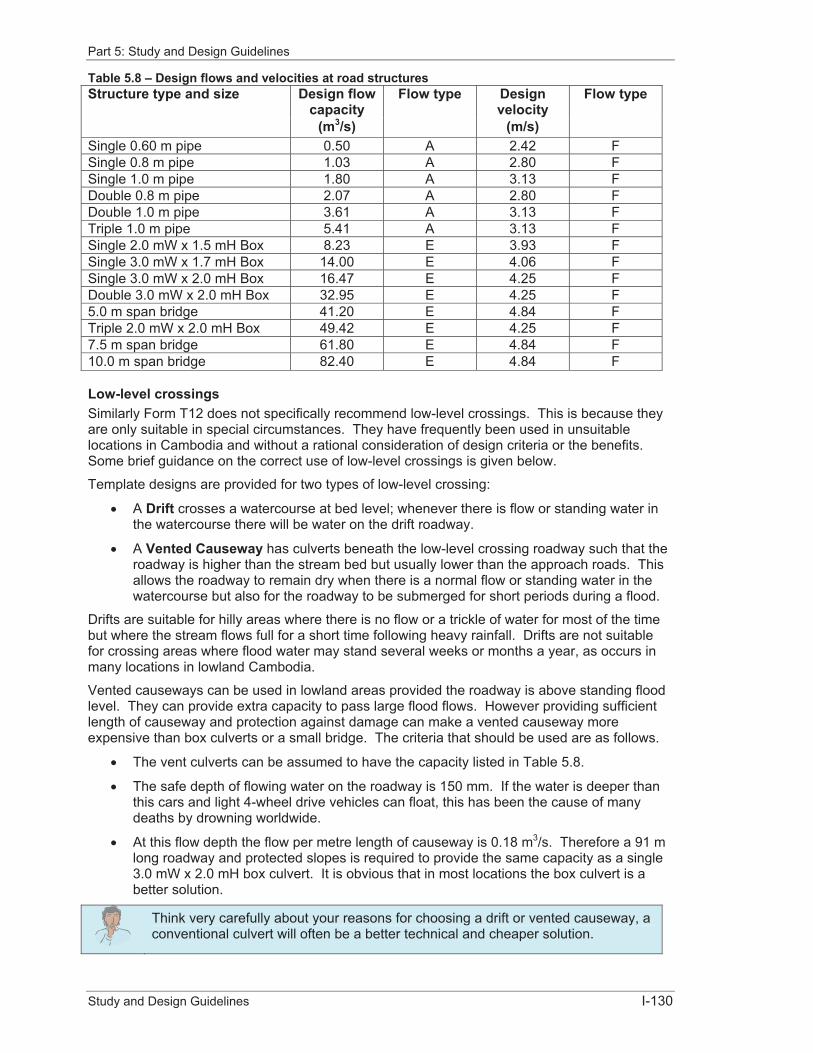
Part 5: Study and Design Guidelines
Study and Design Guidelines I-130
Table 5.8 – Design flows and velocities at road structures Structure type and size Design flow
capacity Flow type Design
velocity Flow type
(m3/s) (m/s) Single 0.60 m pipe 0.50 A 2.42 F Single 0.8 m pipe 1.03 A 2.80 F Single 1.0 m pipe 1.80 A 3.13 F Double 0.8 m pipe 2.07 A 2.80 F Double 1.0 m pipe 3.61 A 3.13 F Triple 1.0 m pipe 5.41 A 3.13 F Single 2.0 mW x 1.5 mH Box 8.23 E 3.93 F Single 3.0 mW x 1.7 mH Box 14.00 E 4.06 F Single 3.0 mW x 2.0 mH Box 16.47 E 4.25 F Double 3.0 mW x 2.0 mH Box 32.95 E 4.25 F 5.0 m span bridge 41.20 E 4.84 F Triple 2.0 mW x 2.0 mH Box 49.42 E 4.25 F 7.5 m span bridge 61.80 E 4.84 F 10.0 m span bridge 82.40 E 4.84 F
Low-level crossings Similarly Form T12 does not specifically recommend low-level crossings. This is because they are only suitable in special circumstances. They have frequently been used in unsuitable locations in Cambodia and without a rational consideration of design criteria or the benefits. Some brief guidance on the correct use of low-level crossings is given below.
Template designs are provided for two types of low-level crossing:
� A Drift crosses a watercourse at bed level; whenever there is flow or standing water in the watercourse there will be water on the drift roadway.
� A Vented Causeway has culverts beneath the low-level crossing roadway such that the roadway is higher than the stream bed but usually lower than the approach roads. This allows the roadway to remain dry when there is a normal flow or standing water in the watercourse but also for the roadway to be submerged for short periods during a flood.
Drifts are suitable for hilly areas where there is no flow or a trickle of water for most of the time but where the stream flows full for a short time following heavy rainfall. Drifts are not suitable for crossing areas where flood water may stand several weeks or months a year, as occurs in many locations in lowland Cambodia.
Vented causeways can be used in lowland areas provided the roadway is above standing flood level. They can provide extra capacity to pass large flood flows. However providing sufficient length of causeway and protection against damage can make a vented causeway more expensive than box culverts or a small bridge. The criteria that should be used are as follows.
� The vent culverts can be assumed to have the capacity listed in Table 5.8.
� The safe depth of flowing water on the roadway is 150 mm. If the water is deeper than this cars and light 4-wheel drive vehicles can float, this has been the cause of many deaths by drowning worldwide.
� At this flow depth the flow per metre length of causeway is 0.18 m3/s. Therefore a 91 m long roadway and protected slopes is required to provide the same capacity as a single 3.0 mW x 2.0 mH box culvert. It is obvious that in most locations the box culvert is a better solution.
Think very carefully about your reasons for choosing a drift or vented causeway, a conventional culvert will often be a better technical and cheaper solution.
Part 5: Study and Design Guidelines
Study and Design Guidelines I-131
Drifts and vented causeways can be used as spillways for small irrigation reservoirs, provided proper consideration is given to erosion protection downstream, seek specialist advice.
5.3 Irrigation System: Group 102 The design guidance for an Irrigation system is presented in three parts.
� Form T21 gathers general information about the irrigation system, estimates the irrigation water requirements and lists the canals and structures that may be needed.
� Form T22 is used for the design of earthworks which includes canals and drains, dams and dykes.
� Form T23 is used for all irrigation structures including headworks and distribution system structures.
5.3.1 Irrigation Project: Form T21 It is unusual for a completely new irrigation system to be built under the C/S Fund; such projects are usually built by MOWRAM/PDOWRAM under donor support. It is more usual for the C/S Fund to repair or improve part of an existing irrigation system. Often these are systems built by the Khmer Rouge Regime which have fallen into disrepair because they were badly conceived, designed and constructed. Sometimes a system will have been rehabilitated by donors who often only provide headworks but leave the community to complete the distribution canals – which is seldom done because communities lack the knowledge and resources to do this on their own. Occasionally systems date from the Sihanouk or French eras.
Although a lot of money has been spent on irrigation infrastructure in recent times, including support through the C/S Fund, the works have tended to be piecemeal because no consideration has been given to the overall operation of the system or how it interacts with adjoining land. The issues are very complex and beyond the scope of this design guidance. However the completion of Form T21 is intended to draw attention to key issues to help C/S Fund investment in irrigation to be more effective and also alert when more specialist advice is needed.
Irrigation infrastructure in Cambodia is most often used for supplementary irrigation of wet season rice. This is especially so for those systems which rely on rainfall upon a catchment. It is unlikely that such systems can support irrigation of more than 10% of the area for part or all of the dry season. A longer irrigation season is possible in areas benefiting from the annual Mekong, Tonle Sap and Bassac flood. In these places it is common to find deep water and recession cropping, the so called ‘Preks’ or ‘Colmatage’ systems, or land where water is pumped from seasonal flood lakes.
Form T21 links with an applet that estimates the irrigation water requirement for rice on a monthly basis. It assesses the water resource and whether it is sufficient for a river fed system or if a reservoir is needed, the required volume of the reservoir. The water resource assessment also gives consideration to competing irrigation water demands upstream and downstream of the project.
The design guidance incorporated into Form T21 is loosely based on the ICID Checklist16 for rapid feasibility study of irrigation systems.
Irrigation system requirement There are a series of questions on Form T21 which establish the areas of land that require water in the wet and dry season and the crops that will be grown. These questions must be
16 International Commission for Irrigation and Drainage. Checklist to Assist Preparation of Small-
Scale Irrigation Projects in Sub-Saharan Africa, via Department for International Development, London, England, 1998.

Part 5: Study and Design Guidelines
Study and Design Guidelines I-132
answered because the information is used to calculate irrigation water requirements later in the form.
There are also questions about water shortage.
FloodingThe questions on floods have two purposes:
� Find out if the fields are flooded for part of the year, if this is the case then the system should manage the water levels for the maximum benefit to the cropping.
� Find out if flooding is a significant constraint to cropping, either because it will damage a standing crop or it will dictate the time a crop is planted.
Existing irrigation system The questions about the existing irrigation system are to establish the age of the system, its current condition and what are perceived as the main problems – very importantly which months of the year water is available.
Water resource There is a simple series of questions that establish where the water comes from and when it is available. The questions about water depth and flow should be answered with the help of the community. The key issue is to find out which months there is flow in the system.
E.g. there is no point in building a dam to irrigate in June when the water in the stream that will fill the reservoir never flows until August!
There is an important question to establish whether water can flow to the fields by gravity or whether it must be pumped.
There are also questions to establish the competition for water, about the approximate area of irrigable land upstream and downstream of the project. Promoters of irrigation systems in Cambodia seldom consider this issue but it is very important. Even if there is little working irrigation now, maybe in the future the villages upstream will also have a scheme. Unless the water resource is large enough for both projects the water previously available for the C/S Fund project will be reduced and it may no longer be viable.
Rainfall record Rainfall records are available for Provincial Capitals, and since about 2001 most District Towns. Sometimes the records are incomplete but will be good enough for this purpose.
Rainfall records only need to be collected once. The records for the whole province should be obtained and updated annually. Work through the PDOWRAM to obtain the records.
Form T21 allows for a rainfall record at or near the project and a second record for the catchment. In most cases only one record will be available, probably for neither of these locations but for the nearest District or Provincial town. It is OK to use this record but if more local records are available use these instead.
Fill both rainfall columns into Applet T21 because the numbers entered are used to calculate the irrigation water requirement and assess the water resource.
Irrigation water requirement The irrigation water requirement is needed to check the demand for water against available water – this is known as a ‘water balance’.
Form T21 uses applet T21 that calculates the irrigation water requirement for rice on a monthly basis. After the calculation, upload the Applet to the geneator.
Part 5: Study and Design Guidelines
Study and Design Guidelines I-133
It is necessary to enter the catchment area. The applet then uses the irrigated area and the rainfall data previously entered. It is also necessary to enter the planting date for rice. The applet then outputs the water requirement each month as the total quantity of water in m3, as the flow rate in m3/s if water is pumped 8 hours each day, and as the flow rate in m3/s if water is delivered over 24 hours by gravity. An approximate water balance is also made to estimate the storage volume required of a reservoir.
Dependable rainfall The rainfall records are converted to ‘dependable rain’. Dependable rain is the monthly rainfall having an 80% probability of exceedance17 (i.e. that is likely to occur in the particular month under consideration in four years out of five). The dependable rainfall is calculated with the following formula:
Pdep = 0.6Ptot - 10 (for Ptot < 70 mm/month)
Pdep = 0.8Ptot - 24 (for Ptot > 70 mm/month)
where Pdep and Ptot are respectively monthly mean dependable rainfall and monthly mean measured rainfall in millimetres.
Once you have entered the monthly rainfall record, the applet calculates dependable rainfall on a monthly basis.
Crop water requirement It is time consuming to estimate the variation in crop water requirements throughout the cropping season (requiring estimates of evapotranspiration, use of crop factors, etc). For rice monoculture the variation project to project is small and for small rice irrigation projects in Cambodia it is accurate enough to assume approximate typical but safe estimates of monthly crop water requirements. On this basis, it is sufficient to know only the total area under irrigated crops each month. For paddy rice, all months from the start of nursery and land preparation to harvest should be included. The following has been assumed for design guidance:
First month: Nursery requirement 100 mm Second month Land preparation and planting 400 mm
Third month Growing 300 mm Fourth month Growing 300 mm Fifth month Growing 200 mm Sixth month Harvest 50 mm
For recession rice the nursery, land preparation and planting requirements can be omitted on the assumption that these activities are carried out on flooded land.
Planting month The planting month can be varied. You should try different planting months to see how this affects water requirements and reservoir volume. It is probable that farmers will have to change their usual planting date to get the maximum benefit from irrigation. These issues should be discussed with the Commune (or FWUC if one exists or will be established).
Irrigation water requirement The net irrigation requirement is calculated by deducting the dependable rainfall from the crop water requirement.
The overall efficiency of distribution, from water source to the soil in which the plant is growing, is typically 40% for surface (channel) irrigated schemes. Therefore the actual irrigation requirement is calculated as:
Net irrigation requirement ÷ 0.4 17 FAO Irrigation and Drainage Papers No 25 "Effective Rainfall" and No 46 "CROPWAT: A Computer
Program for Irrigation Planning and Management"
Part 5: Study and Design Guidelines
Study and Design Guidelines I-134
The applet calculates the net irrigation water requirement for the chosen month of planting taking into account the contribution from dependable rainfall.
Work proposed for irrigation project Form T21 is finished by filling the requirement for earthworks and structures, stating whether these are new or repairs, and the expected sizes. This generates Forms T22 and T23 for each separate output required.
5.3.2 Irrigation Earthwork: Form T22 Irrigation earthworks Form T22 is used for design of canals and drains, dams and dykes. There must be one form for each earthwork, e.g. there must be one form for one dam, and two additional forms if there are two canals. This is because the design guidance can only be specific to one earthwork at a time, and in the case of more than one canal or drain the flow in each will be different each time.
Form T22 will design dam and dyke cross-sections including any road surface, it also calculates flow in a canal or drain calling-up an applet T22 to calculate drainage flow from an external catchment. A second applet T22 is called-up for the hydraulic design of canal and drain cross-sections.
Traffic use of earthwork These questions are included because irrigation earthworks are often used as roads, not just farm roads but tertiary and sub tertiary roads. The questions focus on the condition of existing earthworks used as road and the traffic that will use the earthwork when it is completed. The guidance is similar to Form T11 except that a traffic count is not required and instead the traffic is estimated. The heaviest vehicle using the road is also considered.
If the road on the earthwork already carries a lot of traffic it is worthwhile to make a traffic count even though Form T22 does not specifically require it.
Condition of existing earthworks These questions are asked to establish why the earthworks need repair. If there is a clear cause of damage then the design must protect against the same damage in the future.
Don’t repair damaged infrastructure until you establish why the damage occurred. If you do so then the same damage may occur again. Ask local people how the damage occurred but do not assume that their answers are correct, think whether the cause is for more complex reasons than they say.
SoilsThe soils at the site determine the safe slopes for canals and drains, dams and dykes. The form provides advice on safe slopes according to the soil type identified; in the case of a canal or drain if the soil is poor Form T22 can advise channel lining.
Fill material These questions establish whether suitable fill material is available. If it is not then specialist advice may be needed in order to proceed with the design.
Design of dam or dyke It is necessary to answer a series of question on Form T22 to complete the design. The questions are listed below together with explanation of the reason for the questions and advice on how to answer.
What is reservoir full supply level at dam or flood levels at dyke (m)?Give the level using the project datum. This information is needed to work out the
Part 5: Study and Design Guidelines
Study and Design Guidelines I-135
height of the dam or dyke. What freeboard will be allowed (m)?Freeboard is extra height above the water level to provide a margin of safety, allow for some settlement and erosion, and for waves that may be caused by a wind.
Freeboard should not be less than 1.0 m, add more if waves are expected to be a problem (0.5 m can be assumed for small reservoirs). Do not include the depth of road surfacing when deciding freeboard; this must be added in addition to freeboard.
Will the dam or dyke be used as a road? This influences the crest width and the
surface protection. What is the crest width? Minimum for a farm road is 2.0 m but 4.0 m is
better. If it is a tertiary road use the guidance for Transport Infrastructure.
Will the crest be surfaced?What thickness of Laterite (mm)? Follow the advice on surfacing depending on
the expected traffic use. What will be the upstream slope (see advice for soils above)?What will be the downstream slope (see advice for soils above)? The advice provided in response to the soil
questions should be followed. Under no circumstances should steeper slopes be used.
What slope protect will be provided to the upstream slope?Select from the options. As a minimum it is advised to use grass
slope protection. For a reservoir or a flood dyke where there is open water more than 1.0 m deep and extending more than 500 m distance each year, it is best to use riprap.
If ‘rock riprap’ is chosen the following questions appear. What class of riprap?Answer Class A, B, C or D Class A rip rap is suitable for small
reservoirs.What thickness of riprap in millimetres? 300 mm is the minimum thickness for
Class A riprap. What filter will be placed below riprap?There must always be a filter below riprap Use either a 150 mm gravel layer or a 50 mm
sand layer over a geotextile filter fabric.
What slope protection will be provided to the downstream slope? It is advisable to provide grass.
Capacity of canal Canals should be designed to supply not less than 2 litres/second/hectare to the fields supplied. This assumes water is supplied continuously over 24 hours; if the water is pumped then the canal must be larger, e.g. if it is only pumped 6 hours each day the rate must be:
2 x 24 ÷ 6 = 8 l/s/h
It does not matter whether the farmers take the water in turn or all at the same time, 2 l/s/h will meet the peak requirements for paddy rice.
Part 5: Study and Design Guidelines
Study and Design Guidelines I-136
The required capacity of the canal depending on the answers given to the questions on Form T22. It is the factor between area supplied and supply rate.
You must enter the area supplied by the canal. The default supply rate advised by the form for calculation is 2 l/s/h but you can enter another flow rate. You answer whether the supply is by gravity or pumping. When it is by pumping you must decide how long the pumps will run each day. Then you need to calculate the capacity of the canal for the selected method of delivery and fill into the form as advised in the Project Generator itself.
Capacity of drain Only rarely will purpose built irrigation drains be provided under the C/S fund. However, it is common for rehabilitated canals to function as both a canal and drain, particularly Khmer Rouge built systems. The capacity required for a drain is greater than that for a canal. Therefore, wherever a canal may operate as a drain it is important to check the design as a drain.
When no drain is provided the form requires explanation of how the irrigation system is drained, e.g. water may drain into a river.
Form T22 requires the calculation of required capacity including taking into account an external catchment also served by the drain which needs to be calculated by using Applet T22 Extenal Catchment Flow.
Drains should be designed to convey not less than 3.5 l/s/h from the fields drained. The default drainage rate used by the form for calculation is 3.5 l/s/h but the form allows you to choose another flow rate.
Often a drain will also collect runoff from other fields or have a catchment upstream. When this is the case you must answer so on the form and enter the catchment area. If this area is �1.0 km2 then it assumes these are fields and you need to calculate the extra flow based on 3.5 l/s/h (or whatever other value you have entered on the form). If it is larger than 1.0 km2 the form needs the additional flow result form applet T22 External Catchment Flow. The Applet T22 applies the GTFM as described for Applet T12, except that it designs for the mean annual flood (about 5 year return period) and only outputs the flow.
Hydraulic design of canal or drain Once you know the flow in the canal or drain you must calculate the channel size. This is the hydraulic design.
Form T22 uses applet T22-Design of canal or drain to calculate the channel size for the flow calculated as described above. All you need to do is select a few design criteria and the Applet includes advice on how to choose these.
Manning’s formula The simplest way to design a channel is to use Manning’s formula but first it is necessary to understand the Continuity Equation.
The continuity equation describes the fact that flow rate can be calculated by multiplying the cross sectional area of flow by velocity of flow, it is written:
VAQ ��
Where: Q = flow rate (discharge) (m3/s)A = cross-sectional area of the flow (m2)V = velocity (m/s)
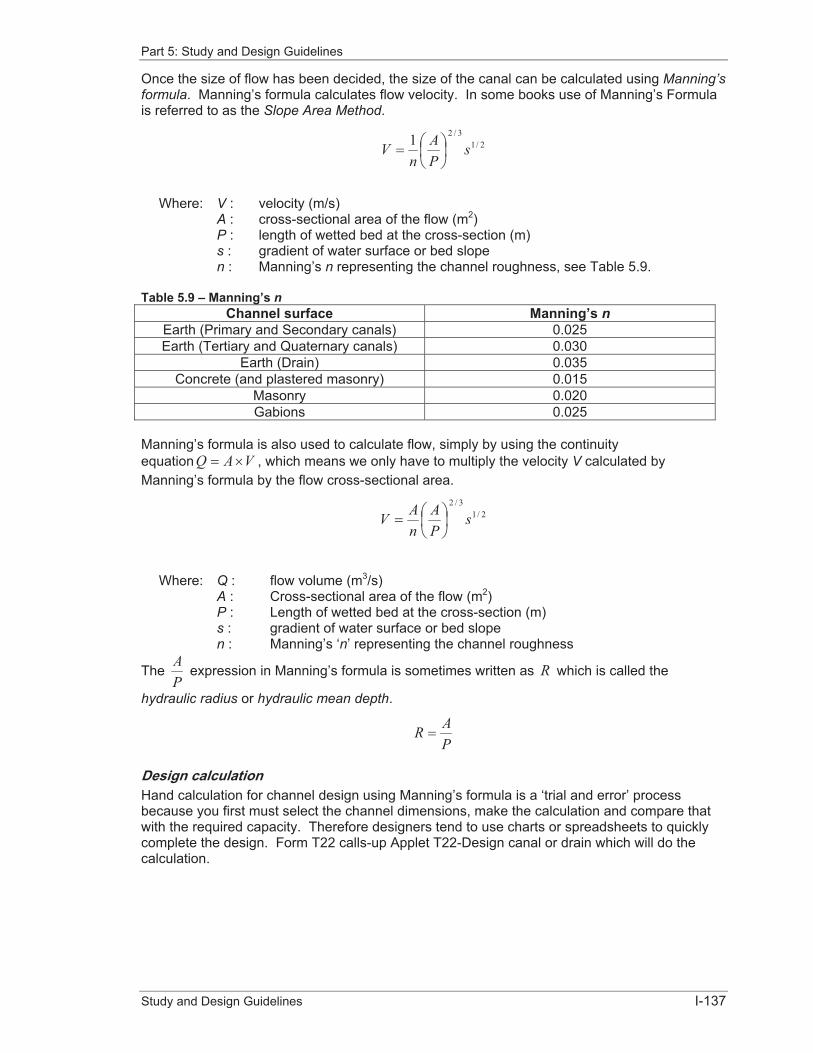
Part 5: Study and Design Guidelines
Study and Design Guidelines I-137
Once the size of flow has been decided, the size of the canal can be calculated using Manning’s formula. Manning’s formula calculates flow velocity. In some books use of Manning’s Formula is referred to as the Slope Area Method.
2/13/21 s
PA
nV �
�� �
Where: V : velocity (m/s) A : cross-sectional area of the flow (m2)P : length of wetted bed at the cross-section (m) s : gradient of water surface or bed slope n : Manning’s n representing the channel roughness, see Table 5.9.
Table 5.9 – Manning’s nChannel surface Manning’s n
Earth (Primary and Secondary canals) 0.025 Earth (Tertiary and Quaternary canals) 0.030
Earth (Drain) 0.035 Concrete (and plastered masonry) 0.015
Masonry 0.020 Gabions 0.025
Manning’s formula is also used to calculate flow, simply by using the continuity equation VAQ �� , which means we only have to multiply the velocity V calculated by Manning’s formula by the flow cross-sectional area.
2/13/2
sPA
nAV �
�� �
Where: Q : flow volume (m3/s)A : Cross-sectional area of the flow (m2)P : Length of wetted bed at the cross-section (m) s : gradient of water surface or bed slope n : Manning’s ‘n’ representing the channel roughness
ThePA
expression in Manning’s formula is sometimes written as R which is called the
hydraulic radius or hydraulic mean depth.
PAR �
Design calculation Hand calculation for channel design using Manning’s formula is a ‘trial and error’ process because you first must select the channel dimensions, make the calculation and compare that with the required capacity. Therefore designers tend to use charts or spreadsheets to quickly complete the design. Form T22 calls-up Applet T22-Design canal or drain which will do the calculation.
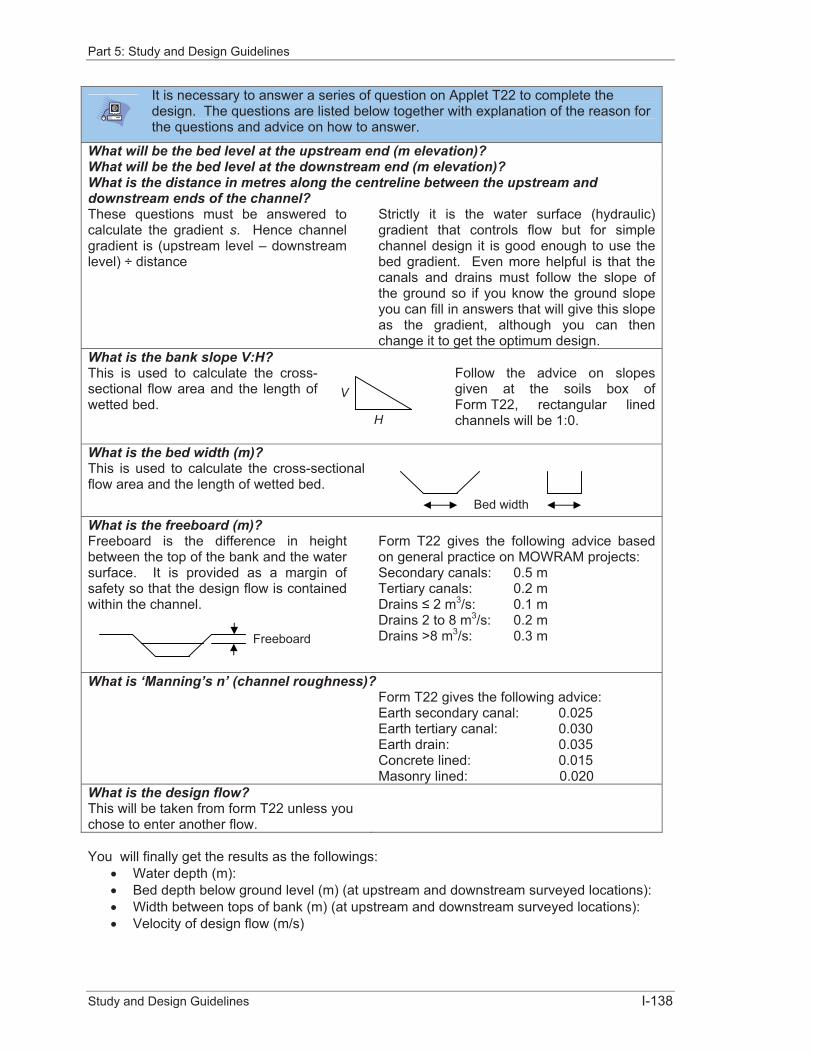
Part 5: Study and Design Guidelines
Study and Design Guidelines I-138
It is necessary to answer a series of question on Applet T22 to complete the design. The questions are listed below together with explanation of the reason for the questions and advice on how to answer.
What will be the bed level at the upstream end (m elevation)?What will be the bed level at the downstream end (m elevation)?What is the distance in metres along the centreline between the upstream and downstream ends of the channel?These questions must be answered to calculate the gradient s. Hence channel gradient is (upstream level – downstream level) ÷ distance
Strictly it is the water surface (hydraulic) gradient that controls flow but for simple channel design it is good enough to use the bed gradient. Even more helpful is that the canals and drains must follow the slope of the ground so if you know the ground slope you can fill in answers that will give this slope as the gradient, although you can then change it to get the optimum design.
What is the bank slope V:H?This is used to calculate the cross-sectional flow area and the length of wetted bed.
Follow the advice on slopes given at the soils box of Form T22, rectangular lined channels will be 1:0.
What is the bed width (m)?This is used to calculate the cross-sectional flow area and the length of wetted bed.
What is the freeboard (m)? Freeboard is the difference in height between the top of the bank and the water surface. It is provided as a margin of safety so that the design flow is contained within the channel.
Form T22 gives the following advice based on general practice on MOWRAM projects: Secondary canals: 0.5 m Tertiary canals: 0.2 m Drains � 2 m3/s: 0.1 m Drains 2 to 8 m3/s: 0.2 m Drains >8 m3/s: 0.3 m
What is ‘Manning’s n’ (channel roughness)? Form T22 gives the following advice:
Earth secondary canal: 0.025 Earth tertiary canal: 0.030 Earth drain: 0.035 Concrete lined: 0.015 Masonry lined: 0.020
What is the design flow?This will be taken from form T22 unless you chose to enter another flow.
You will finally get the results as the followings: � Water depth (m): � Bed depth below ground level (m) (at upstream and downstream surveyed locations): � Width between tops of bank (m) (at upstream and downstream surveyed locations): � Velocity of design flow (m/s)
V
H
Bed width
Freeboard
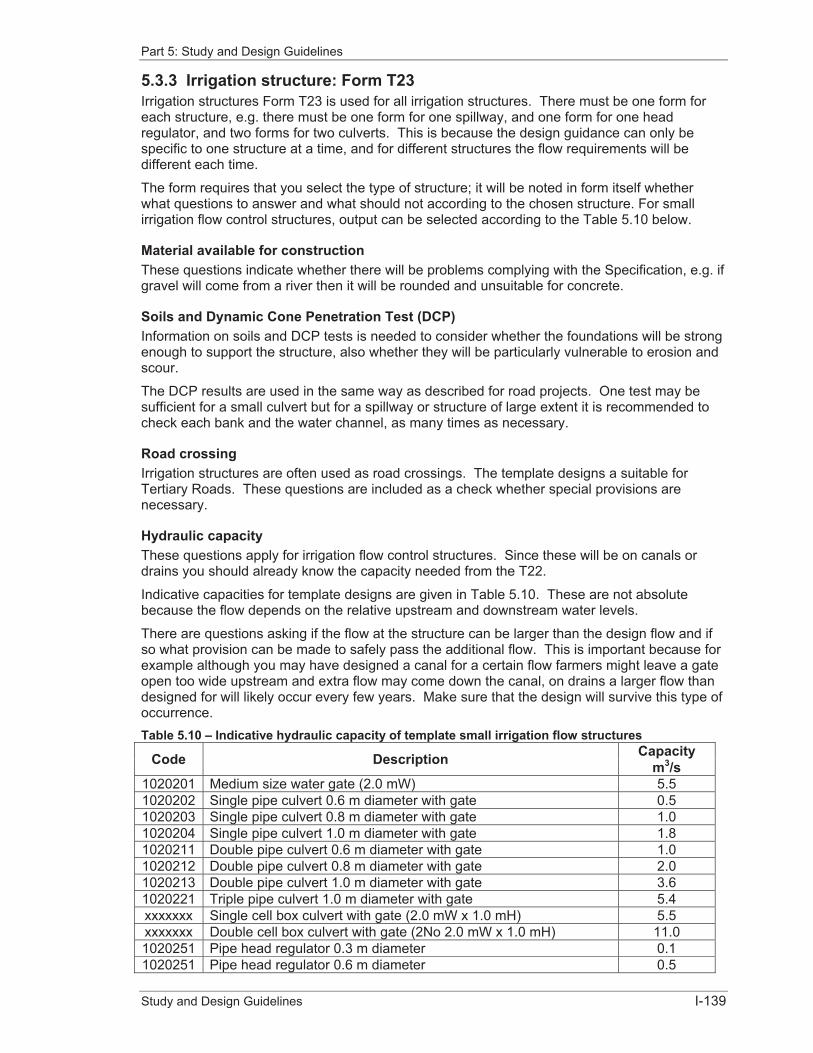
Part 5: Study and Design Guidelines
Study and Design Guidelines I-139
5.3.3 Irrigation structure: Form T23 Irrigation structures Form T23 is used for all irrigation structures. There must be one form for each structure, e.g. there must be one form for one spillway, and one form for one head regulator, and two forms for two culverts. This is because the design guidance can only be specific to one structure at a time, and for different structures the flow requirements will be different each time.
The form requires that you select the type of structure; it will be noted in form itself whether what questions to answer and what should not according to the chosen structure. For small irrigation flow control structures, output can be selected according to the Table 5.10 below.
Material available for construction These questions indicate whether there will be problems complying with the Specification, e.g. if gravel will come from a river then it will be rounded and unsuitable for concrete.
Soils and Dynamic Cone Penetration Test (DCP) Information on soils and DCP tests is needed to consider whether the foundations will be strong enough to support the structure, also whether they will be particularly vulnerable to erosion and scour.
The DCP results are used in the same way as described for road projects. One test may be sufficient for a small culvert but for a spillway or structure of large extent it is recommended to check each bank and the water channel, as many times as necessary.
Road crossing Irrigation structures are often used as road crossings. The template designs a suitable for Tertiary Roads. These questions are included as a check whether special provisions are necessary.
Hydraulic capacity These questions apply for irrigation flow control structures. Since these will be on canals or drains you should already know the capacity needed from the T22.
Indicative capacities for template designs are given in Table 5.10. These are not absolute because the flow depends on the relative upstream and downstream water levels.
There are questions asking if the flow at the structure can be larger than the design flow and if so what provision can be made to safely pass the additional flow. This is important because for example although you may have designed a canal for a certain flow farmers might leave a gate open too wide upstream and extra flow may come down the canal, on drains a larger flow than designed for will likely occur every few years. Make sure that the design will survive this type of occurrence. Table 5.10 – Indicative hydraulic capacity of template small irrigation flow structures
Code Description Capacity m3/s
1020201 Medium size water gate (2.0 mW) 5.5 1020202 Single pipe culvert 0.6 m diameter with gate 0.5 1020203 Single pipe culvert 0.8 m diameter with gate 1.0 1020204 Single pipe culvert 1.0 m diameter with gate 1.8 1020211 Double pipe culvert 0.6 m diameter with gate 1.0 1020212 Double pipe culvert 0.8 m diameter with gate 2.0 1020213 Double pipe culvert 1.0 m diameter with gate 3.6 1020221 Triple pipe culvert 1.0 m diameter with gate 5.4 xxxxxxx Single cell box culvert with gate (2.0 mW x 1.0 mH) 5.5 xxxxxxx Double cell box culvert with gate (2No 2.0 mW x 1.0 mH) 11.0 1020251 Pipe head regulator 0.3 m diameter 0.1 1020251 Pipe head regulator 0.6 m diameter 0.5
Part 5: Study and Design Guidelines
Study and Design Guidelines I-140
1020251 Pipe head regulator 0.8 m diameter 1.0 1020251 Pipe head regulator 1.0 m diameter 1.8 1020252 Check structure Varies
Spillways and diversion weirs A dam spillway, or a weir across a river that raises water levels to divert flow for irrigation must be designed to pass flood flow without suffering damage. It is common for spillways on reservoirs in lowland areas to flow up to two months a year because the reservoirs are too small to capture all the wet season flow. Weirs across rivers will spill water for even longer, in some locations all through the year.
The design should be for a large flood. International practice is to design for very large floods because of the risk of loss of life and damage should a dam fail because of too small a spillway. These standards are not applied to small irrigation reservoirs in Cambodia; in flat areas the reasons can include the relatively small storage volume and that water escaping is not confined in a valley but can quickly spread over the fields. These are not universally safe assumptions and would not be appropriate for a reservoir in a hill valley with a village or scattered houses downstream.
The guidance applies for small lowland reservoirs in flat areas. In these cases spillways and river weirs can be designed for a 1 in 50 year peak flow. In the case of a reservoir the flow will actually be lower than this because some of the flood will be delayed a short time passing through the reservoir but for simplicity this has been ignored.
Form T23 uses an applet to estimate the peak flow and to calculate the length of weir required to pass the design flood.
When a spillway or weir is proposed Form T23 will call-up Applet T23 Length of weir which estimates the peak flow and calculate the length of weir. Flow is estimated using the GTFM as described for Form T12, except that it designs for the 1 in 50 year flood and only outputs the flow.
The Applet will ask for the maximum acceptable water level upstream of the spillway or weir and the proposed crest level. The maximum acceptable water level should take into account property that could be flooded or the freeboard allowed at a dam. The crest level will be the full supply level for a reservoir or the level needed for water to flow to a diversion canal. The difference between the two water levels is the head available at the weir. The applet works out how much water will flow over a metre length of weir at this head. It then divides this into the 1 in 50 year peak flow to calculate the length of weir needed.
The weir must be capable of passing the full flood flow. Never include flow that could bypass the weir by opening a water gate or head regulator because when the flood comes there may be no one there to open the gate. This was a frequent problem with Khmer Rouge schemes which relied on someone opening the gates to pass the flood flow – it is amongst the many reasons why so many of these structures have failed.
Pumping capacity If the selected output is a pump then the pump capacity must be entered. This may have been calculated on a Form T22 if a canal is included in the project.
5.4 Water Supply: Group 103 Simple design guidance is provided for Water Supply. Four types of water supply infrastructure are addressed:
� Wells
� Ponds
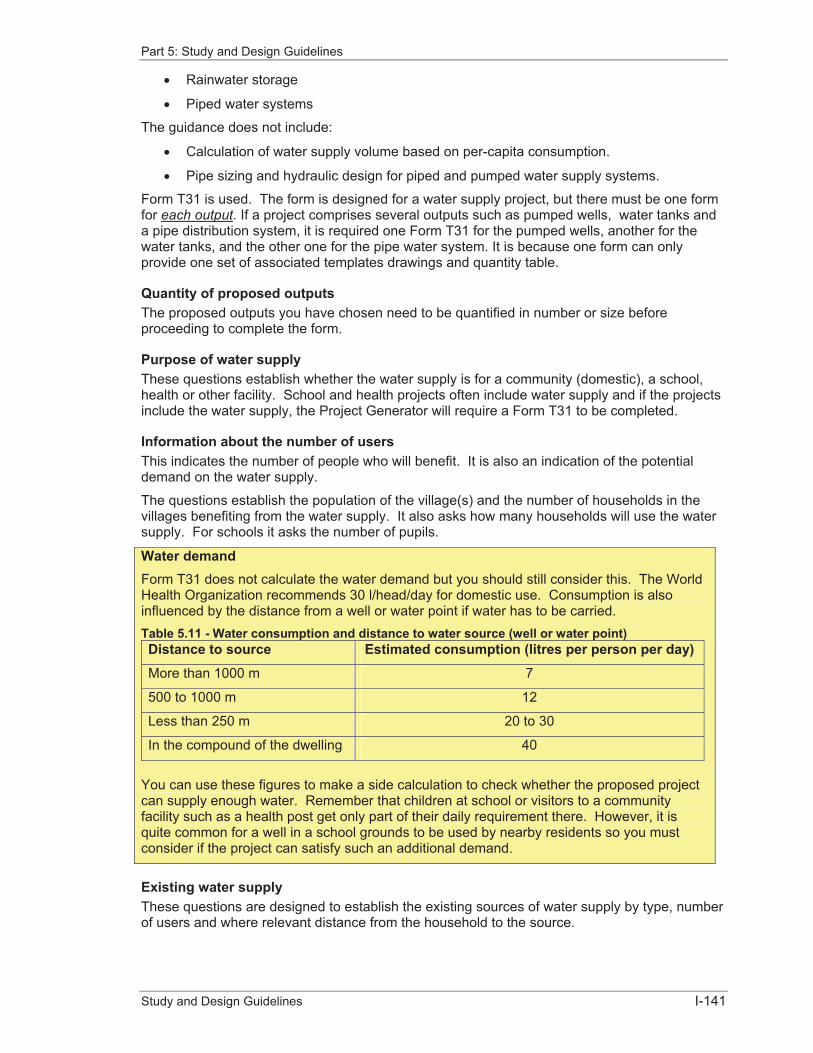
Part 5: Study and Design Guidelines
Study and Design Guidelines I-141
� Rainwater storage
� Piped water systems
The guidance does not include:
� Calculation of water supply volume based on per-capita consumption.
� Pipe sizing and hydraulic design for piped and pumped water supply systems.
Form T31 is used. The form is designed for a water supply project, but there must be one form for each output. If a project comprises several outputs such as pumped wells, water tanks and a pipe distribution system, it is required one Form T31 for the pumped wells, another for the water tanks, and the other one for the pipe water system. It is because one form can only provide one set of associated templates drawings and quantity table.
Quantity of proposed outputs The proposed outputs you have chosen need to be quantified in number or size before proceeding to complete the form.
Purpose of water supply These questions establish whether the water supply is for a community (domestic), a school, health or other facility. School and health projects often include water supply and if the projects include the water supply, the Project Generator will require a Form T31 to be completed.
Information about the number of users This indicates the number of people who will benefit. It is also an indication of the potential demand on the water supply.
The questions establish the population of the village(s) and the number of households in the villages benefiting from the water supply. It also asks how many households will use the water supply. For schools it asks the number of pupils.
Water demand Form T31 does not calculate the water demand but you should still consider this. The World Health Organization recommends 30 l/head/day for domestic use. Consumption is also influenced by the distance from a well or water point if water has to be carried. Table 5.11 - Water consumption and distance to water source (well or water point) Distance to source Estimated consumption (litres per person per day) More than 1000 m 7
500 to 1000 m 12
Less than 250 m 20 to 30
In the compound of the dwelling 40
You can use these figures to make a side calculation to check whether the proposed project can supply enough water. Remember that children at school or visitors to a community facility such as a health post get only part of their daily requirement there. However, it is quite common for a well in a school grounds to be used by nearby residents so you must consider if the project can satisfy such an additional demand.
Existing water supply These questions are designed to establish the existing sources of water supply by type, number of users and where relevant distance from the household to the source.

Part 5: Study and Design Guidelines
Study and Design Guidelines I-142
Will the new water supply replace the water supply or will it be additional to the original supply? Will the existing and new systems compete for the same water?
Information about site of proposed facility These questions establish ownership of the land, if the land is not in public ownership there may be disputes about access in the future.
Political considerations may influence accessibility. There may be pressure to put the well near the dwelling of an influential member of the community. A compromise may be necessary.
There are also questions about flooding. There is a risk of contamination of the supply if the land floods; a well provides a path for pollution to reach the groundwater which can be permanently contaminated making it unusable for water supply. It may be necessary to construct the water supply, e.g. a well head, on a mound or platform so that it is accessible and protected against contamination when there is a flood.
Existing wells Information on existing wells is very useful for designing a new well. The primary objective when sinking a new well is to sink it where ground water is likely to be found. Existing wells are the best indication of the presence of ground water. The history of the old well will provide information on seasonal changes in the water tab1e, which may indicate that the new well should be deeper than the old one. The questions ask about the type of well and its use, the depth of water particularly during the dry season, the soil and rock that the well is sunk in. The questions about the colour, taste and smell of the water are good indicators of the water quality18.
Form T31 is designed to collect information about every nearby well. However, if there are many existing wells, household hand pumps or farm tube wells, then it is only necessary to get a representative sample of wells, say a few wells for one project depending on how much they vary. The location of all existing wells should be plotted using MangoMap.
Proposed wells Groundwater is water that is stored underground in porous layers called aquifers and can be a reliable source of drinking water. Naturally occurring sources of groundwater are usually free from disease causing bacteria. There is usually less seasonal variation in groundwater quantities than in surface water.
Wells are used to extract groundwater. A well is simply a hole that pierces an aquifer so that water may be pumped or lifted out. Wells can be classified according to their method of construction. Five types of wells are: hand-dug, driven, jetted, bored, and cable tool.
18 These questions are the same as used on the RGC National Water Well Log Sheet.
Useful Definitions Aquifer A water-saturated geologic zone that
will yield water to springs and wells.
Bacteria One-celled microorganisms which multiply by simple division and which can be seen through a microscope.
Contaminate To make unclean by introducing an infectious (disease-causing) impurity such as bacteria.
Drawdown The distance between the water table and the water level in a well during continued pumping.
Ground Water Water stored below the ground’s surface.
Impermeable Not allowing liquid to pass through.
Permeability The ability of soil to absorb liquid.
Porosity A soil’s ability to store water.
Water Table The top or upper limit, of an aquifer.
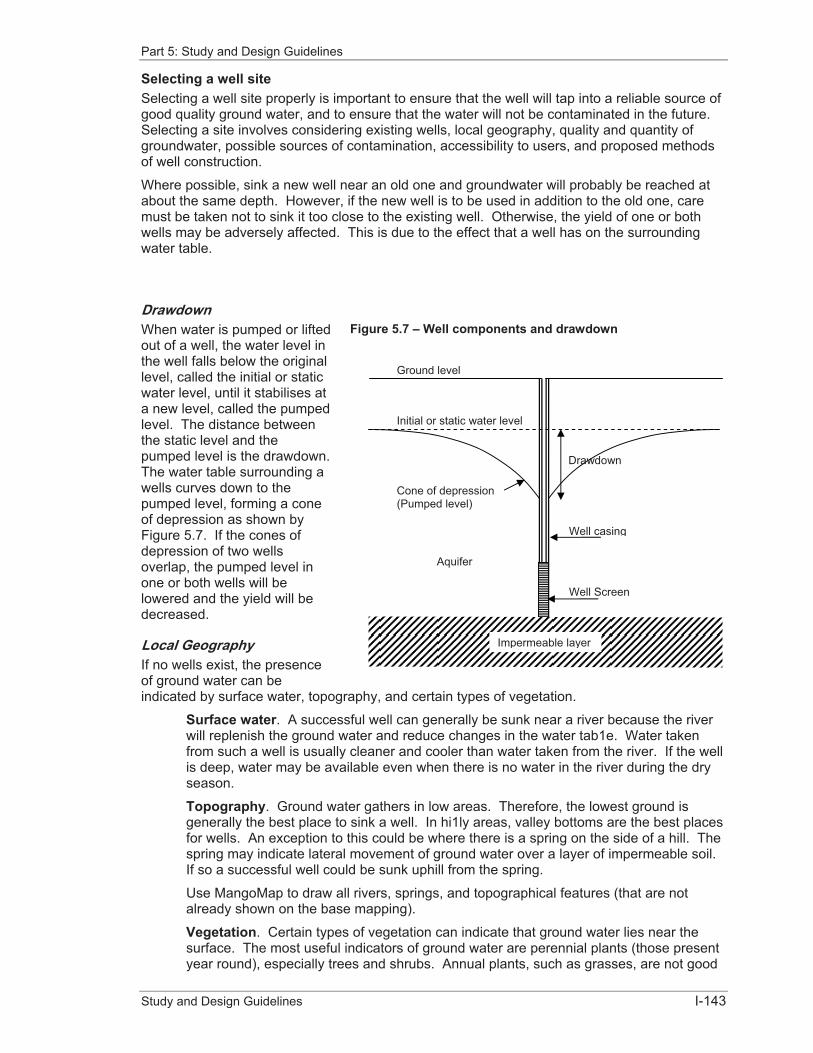
Part 5: Study and Design Guidelines
Study and Design Guidelines I-143
Selecting a well site Selecting a well site properly is important to ensure that the well will tap into a reliable source of good quality ground water, and to ensure that the water will not be contaminated in the future. Selecting a site involves considering existing wells, local geography, quality and quantity of groundwater, possible sources of contamination, accessibility to users, and proposed methods of well construction.
Where possible, sink a new well near an old one and groundwater will probably be reached at about the same depth. However, if the new well is to be used in addition to the old one, care must be taken not to sink it too close to the existing well. Otherwise, the yield of one or both wells may be adversely affected. This is due to the effect that a well has on the surrounding water table.
Drawdown When water is pumped or lifted out of a well, the water level in the well falls below the original level, called the initial or static water level, until it stabilises at a new level, called the pumped level. The distance between the static level and the pumped level is the drawdown. The water table surrounding a wells curves down to the pumped level, forming a cone of depression as shown by Figure 5.7. If the cones of depression of two wells overlap, the pumped level in one or both wells will be lowered and the yield will be decreased.
Local Geography If no wells exist, the presence of ground water can be indicated by surface water, topography, and certain types of vegetation.
Surface water. A successful well can generally be sunk near a river because the river will replenish the ground water and reduce changes in the water tab1e. Water taken from such a well is usually cleaner and cooler than water taken from the river. If the well is deep, water may be available even when there is no water in the river during the dry season.
Topography. Ground water gathers in low areas. Therefore, the lowest ground is generally the best place to sink a well. In hi1ly areas, valley bottoms are the best places for wells. An exception to this could be where there is a spring on the side of a hill. The spring may indicate lateral movement of ground water over a layer of impermeable soil. If so a successful well could be sunk uphill from the spring.
Use MangoMap to draw all rivers, springs, and topographical features (that are not already shown on the base mapping).
Vegetation. Certain types of vegetation can indicate that ground water lies near the surface. The most useful indicators of ground water are perennial plants (those present year round), especially trees and shrubs. Annual plants, such as grasses, are not good
Figure 5.7 – Well components and drawdown
Initial or static water level
Ground level
Drawdown
Cone of depression (Pumped level)
Aquifer
Impermeable layer
Well casing
Well Screen

Part 5: Study and Design Guidelines
Study and Design Guidelines I-144
indicators, because they come and go with the seasons. The dry season is probably the best time to survey vegetation for indications of ground water.
Quality of Ground Water Once ground water is located, its quality must be checked before constructing permanent wells. Of course, the best way to establish water quality is chemical and biological water quality tests, but you have to consider whether the extra time and cost is justified. As a minimum the water must be clean, clear, and good-tasting, and be free from disease causing organisms. If the ground water is contaminated, another source may have to be found. If physical, chemical and bacteriological water testing is possible then indicative standards are given in the Water Qualitysection which follows below.
Quantity of Ground Water The quantity of a groundwater source is nearly as important as its quality. Unfortunately, the only way to test the yield of an aquifer is to sink a we1l and pump it. You can, however, make a rough estimate of the yield by identifying the sediment and rock which compose the aquifer.
The two most significant elements of an aquifer are its porosity and permeability. Porosity governs the amount of water that an aquifer can contain. Permeability governs the amount of water that can be brought to the surface. For example, some aquifers may contain large quantities of water, but their rate of yield is too slow to suit the needs of the user. Porosity and permeability depend on a number of factors including particle size, arrangement and distribution.
Table 5.12 shows the estimated yields of aquifers composed of different types of sediment. The table should not be used for exact calculations but only for indications of yield. Table 5.12 - Estimated yields of aquifers Aquifer Estimated Yield (litres per minute) Sand and gravel 11,000; could be less based on pump and well design
Sand, gravel, and clay 1,900-3,800
Sand and clay 1,900
Fractured sandstone 1,900
Limestone 38-190; more if near stream, or if there are underground caverns
Granite or hard rock 38 or less
As a general guide during the dry season drilled wells should be able to sustain yields of at least 1,000 l/h for 8 h/day. For dug wells for a standing water depth at least 3 m should have a minimum yield of 10 l/minute, or 2.5 m of water and 15 l/minute, or 2.0 m of water and 20 l/minute.
If the quantity of ground water is insufficient, another or additional well sites or even alternative sources will have to be found.
Possible Sources of Contamination A well should not be dug in areas where the ground water is likely to be contaminated. A well site should be uphill and at least the safe distances listed in Table 5.13. Table 5.13 – Safe distance of well from sources of contamination
Safe distance Source of contamination 50 m Seepage pit or cesspool; 30 m Sub-surface absorption system; 30 m Pit latrine; 30 m Animal pens, sheds, or silos; 15 m Septic tank; 7 m Drain, ditch, or house foundation.
50 m Petro-chemical or agri-chemical store;
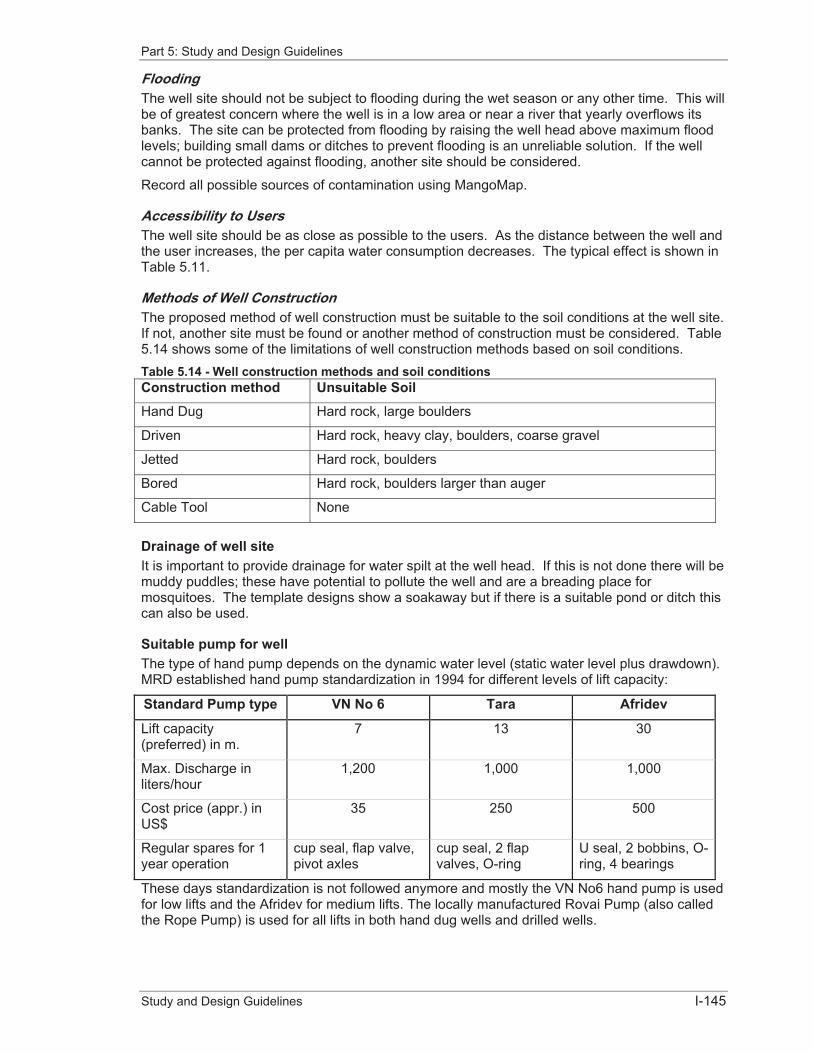
Part 5: Study and Design Guidelines
Study and Design Guidelines I-145
FloodingThe well site should not be subject to flooding during the wet season or any other time. This will be of greatest concern where the well is in a low area or near a river that yearly overflows its banks. The site can be protected from flooding by raising the well head above maximum flood levels; building small dams or ditches to prevent flooding is an unreliable solution. If the well cannot be protected against flooding, another site should be considered.
Record all possible sources of contamination using MangoMap.
Accessibility to Users The well site should be as close as possible to the users. As the distance between the well and the user increases, the per capita water consumption decreases. The typical effect is shown in Table 5.11.
Methods of Well Construction The proposed method of well construction must be suitable to the soil conditions at the well site. If not, another site must be found or another method of construction must be considered. Table 5.14 shows some of the limitations of well construction methods based on soil conditions. Table 5.14 - Well construction methods and soil conditions Construction method Unsuitable Soil Hand Dug Hard rock, large boulders
Driven Hard rock, heavy clay, boulders, coarse gravel
Jetted Hard rock, boulders
Bored Hard rock, boulders larger than auger
Cable Tool None
Drainage of well siteIt is important to provide drainage for water spilt at the well head. If this is not done there will be muddy puddles; these have potential to pollute the well and are a breading place for mosquitoes. The template designs show a soakaway but if there is a suitable pond or ditch this can also be used.
Suitable pump for well The type of hand pump depends on the dynamic water level (static water level plus drawdown). MRD established hand pump standardization in 1994 for different levels of lift capacity:
Standard Pump type VN No 6 Tara Afridev
Lift capacity (preferred) in m.
7 13 30
Max. Discharge in liters/hour
1,200 1,000 1,000
Cost price (appr.) in US$
35 250 500
Regular spares for 1 year operation
cup seal, flap valve, pivot axles
cup seal, 2 flap valves, O-ring
U seal, 2 bobbins, O-ring, 4 bearings
These days standardization is not followed anymore and mostly the VN No6 hand pump is used for low lifts and the Afridev for medium lifts. The locally manufactured Rovai Pump (also called the Rope Pump) is used for all lifts in both hand dug wells and drilled wells.

Part 5: Study and Design Guidelines
Study and Design Guidelines I-146
More advice on pump selection can be found in: “UNICEF – A Water Handbook19.”
For medium lift 30 to 50 m. UNICEF include Afridev amongst recommended pumps but generally in Cambodia they are not used at this depth. Such deep wells are not usually provided under the C/S Fund but if one is required it is advisable to seek specialist advice.
PondsThe questions for ponds are similar in concept to wells except that the pond will usually be shallower and will cover a large area. Information on the soils will decide the suitability of the ground as well as the stable side slopes. The questions ask where the water to fill the pond will come from and whether there are potential sources of contamination nearby. Table 5.15 – Recommend maximum slopes for dug water supply ponds Soils type Maximum stable slope (V:H) Clay group 1 : 1.25 Sandy group 1 : 1.5 Silty soils 1 : 1.5 Dispersive clays20 May require additional slope protection.
A pond in sandy soil will probably filled by shallow groundwater flow during the wet season but water will quickly drain away once the groundwater levels drop in the dry season. A pond in a clay soil will retain water much better but groundwater inflow will be small and to fill it will have to rely on direct rainfall or captured runoff from surrounding land. You should consider the possibility of low bunds and channels in situations where this will increase the capture of runoff.
Water quality The Royal Government of Cambodia has established a comprehensive policy on National Water Supply and Sanitation, covering both urban and rural water supplies. Based on this policy and to ensure access to safe drinking water to all people, it required the Drinking Water Quality Standard (DWS) for Cambodia21. These standards were developed by an inter-ministerial process initiated by Ministry of Industry, Mines and Energy and concerned ministries with support from the World Health Organization in 2004.
Drinking water should be clean and clear with pleasant taste and odor. The public will assess drinking water quality using these aesthetic indicators but actually the safety of water is determined by microbiological, physical, and chemical quality. It should be safe so that it does not contain suspended matter, harmful chemical substances, and disease-causing microorganisms. Microbiological quality is most important and is a priority for monitoring.
Tables
The associated templates drawings and quantity table can then be called up by the Project Generator. For some outputs there may be no Template design. In these cases a design and quantities will have to be provided.
All water supply systems should be tested for water quality parameters set out in Tables 1 through 4 prior to commissioning to ensure compliance with DWS. Small water supply systems (those serving less than 100 people or delivering less than 10 m3/day) should be tested for priority parameters set out in Table 5.20 Priority parameters in small water supplies
Table 5.16 Bacteriological quality for drinking water Parameter Maximum Value
a) Thermotolerant (Fecal) Coliforms or E. coli
0 per 100 mL
b) Total coliforms 0 per 100 mL
19 UNICEF. Towards Better Programming - A Water Handbook, Water, Environment and Sanitation
Technical Guidelines Series - No. 2, United Nations Children’s Fund, 1999. 20 Clays which dissolve in contact with water. 21 MRD, Drinking Water Quality Standards for Cambodia, January 2004

Part 5: Study and Design Guidelines
Study and Design Guidelines I-147
Table 5.17 Inorganic constituents of health significance in drinking water Parameter Maximum Value*
mg/L, (ppm) Arsenic 0.05 Barium 0.7 Cadmium 0.003 Chromium 0.05 Cyanide 0.07 Fluoride 1.5 Lead 0.01 Mercury 0.001 Nickel 0.02 Nitrate as NO3- 50 Nitrite as NO2- 3 Selenium 0.01 * For very low concentrations, laboratory results are reported in μg/L or ppb. Note the
conversion: 1 mg/L (ppm) = 1000 μg/L (ppb)
Table 5.18 Organic constituents of health significance to drinking water Parameter* Maximum Value**
µg/L (ppb) Polychlorinated biphenyls (PCBs) 0.5 Benzene 10 Disinfection-by-productTrihalomethanes 250 Pesticides2,4 D 30 Aldrin and Dieldrin 0.3 Carbofuran 10 Chlordane 0.2 DDT 20 Dichlorvos 1 Dimethoate 6 Endosulfan 30 Endrin 0.6 Glyphosate 10 Heptachlor 0.3 Hexaclorobenzene 1 Methyl parathion 0.3 Mevinphos 5 Monocrotophos 1 Paraquat 30 Parathion 10 Permethrin 20 * Routine monitoring for organic constituents (Table 3) is not required unless there is
a potential for contamination of water supplies. ** For very low concentration, laboratory results are reported in μg/L or ppb. Note the
conversion: 1 mg/L (ppm) = 1000 μg/L (ppb)
Table 5.19 Physical and chemical quality: aesthetic quality Parameter Maximum Value, mg/L Taste Acceptable Odor Acceptable Color 5 TCU Turbidity 5 NTU Residual chlorine 0.2-0.5 pH 6.5 – 8.5 (no unit) Aluminum 0.2 Ammonia 1.5

Part 5: Study and Design Guidelines
Study and Design Guidelines I-148
Chloride 250 Copper 1 Hardness* 300 Hydrogen Sulfide 0.05 Iron 0.3 Manganese 0.1 Sodium 200 Sulfate 250 Total dissolved solids** 800 Zinc 3 * Hardness is expressed as mg/L CaCO3** Conductivity (μS/cm) can also be measured and it is roughly equivalent to twice the
TDS value.
Table 5.20 Priority parameters in small water supplies Parameter* Maximum Value pH 6.5-8.5 Turbidity 5 NTU Arsenic 0.05 mg/L Iron 0.3 mg/L Total Dissolved Solids (TDS) 800 mg/L Thermotolerant Coliforms or E. coli 0 per 100 mL * Additional parameters such as conductivity can be monitored but these are the
minimum requirements.
5.5 Education Facilities: Group 104 Only limited design guidance is provided for education facilities. This is because education projects are predominantly building work. Brick schools are standard MoEYS designs with some minor modifications to comply with C/S Fund requirements and specifications. The Wooden school design is the same as used under the Seila Program, except for some minor changes to improve the building quality. Water supply and sanitation works are provided as outputs under the Water Supply (103) and Sanitation (110) groups. Ancillary works such as gates and fences may be provided according to the project requirements. Special education buildings may require specific designs.
Form T41 is used. The form is designed for a complete education facility project, it incorporates all of questionnaires related to education, but it allows only one output per form. Typically a school project could require several outputs in addition to the basic classrooms, e.g. furniture, latrines, rainwater tanks, a well, yard, fence, wall and gate. All school outputs can be prepared by using the same form -Form T41, yet there must be one form T41 for each output because one form can only provide one set of associated templates drawings and quantity table; add form T101 water supply and T31 sanitation for the outputs of latrines, rainwater tanks and wells.
Quantity of proposed outputs The proposed outputs you have selected need to be quantified in number or length before proceeding to complete the form.
Information about education requirements The questions provide information on the number of students, existing classrooms, availability of teachers and provision for community management. The answers should be considered for appropriateness of the project and its sustainability. The responsibility for operation and maintenance of Education Facilities is normally passed to the line agency, the Provincial Department of Education.

Part 5: Study and Design Guidelines
Study and Design Guidelines I-149
Physical characteristics of the site There are questions to establish whether the site floods, and whether this is seasonal deep water flooding, or due to slow drainage after heavy rainfall. Essentially if there is a flood problem the decision has to be made whether this can be dealt with by drainage ditches or other means so that a standard 0.5 m plinth classroom design can be used. If the problem of flooding cannot be controlled then higher floor levels will be needed, either 1.5 or 2.5 m plinths, 2.5 or 3.5 m piers.
There are a series of questions intended to confirm suitability of the site. These include whether it is free of UXO, status of the land title, boundary demarcation and whether the site is of sufficient size. The existing water supply and sanitation provisions should be determined because water supply and sanitation outputs may be needed.
Foundation soils Form T41 provides for ground investigation by trial pit and DCP, as many pits and tests as are needed.
Form T41 creates in advance the trial pit log; you enter the soil type and the depths at which the soil types change. The 20 percentile value for DCP needs to be calculated and filled into the form. You can use Applet T11 for the calculation.
Templates drawings are currently for 0.5 m plinth 3 classroom wooded schools and 5 classroom brick schools. However, Form T41 automatically calls-up the correct quantities within the project generator according to the number of classrooms and options chosen.
For a site specific output such as a fence the quantity will have to be measured.
For some outputs such as higher floor levels there may be no Template design. In these cases a design and quantities will have to be provided.
5.6 Health Facilities: Group 105 Only limited design guidance is provided for health facilities. This is because health projects are predominantly building work. Brick and wooden health post designs are MoH standard designs with some minor modifications to comply with C/S Fund requirements and specifications. Water supply and sanitation works are provided as outputs under the Water Supply (103) and Sanitation (110) groups. Ancillary works such as gates and fences may be provided according to the project requirements.
Form T51 is used. The form is designed for a complete health facility project; it incorporates all of questionnaires related to health facilities, but it allows only one output per form. Typically a health facility could require several outputs in addition to the basic building, e.g. latrines, rainwater tanks, a well, fence, wall and gate and access culvert. All of health facility outputs can be prepared by using the same form - Form T41, yet there must be one form T51 for each output because one form can only provide one set of associated templates drawings and quantity table; add form T101 water supply and T31 sanitation for the outputs of latrines, rainwater tanks and wells.
Quantity of proposed outputs The proposed outputs you have selected need to be quantified in number or length before proceeding to complete the form.
Information about health requirements The questions provide information on the population that will be served by the facility and the distance they will have to travel. If you do not know the distances use MangoMap to measures them between the facility site and village centres. There are also questions about availability of

Part 5: Study and Design Guidelines
Study and Design Guidelines I-150
trained staff and who will provide these staff. The answers should be considered for appropriateness of the project and its sustainability. The responsibility for operation and maintenance of Health Facilities is normally passed to the line agency, the Provincial Department of Health.
Physical characteristics of the site There are questions to establish whether the site floods, and whether this is seasonal deep water flooding, or due to slow drainage after heavy rainfall. Essentially if there is a flood problem the decision has to be made whether this can be dealt with by drainage ditches or other means.
There are a series of questions intended to confirm suitability of the site. These include whether it is free of UXO, the status of land title, boundary demarcation and whether the site is of sufficient size. The existing water supply and sanitation provision should be determined because water supply and sanitation outputs may be needed.
Foundation soils Form T51 provides for ground investigation by trial pit and DCP, as many pits and tests as are needed.
Form T51 creates in advance the trial pit log; you enter the soil type and the depths at which the soil types change. The 20 percentile value for DCP needs to be calculated and filled into the form. You can use Ms. Excel for the calculation.
Form T51 automatically calls-up the correct quantities within the project generator according to the outputs chosen.
For a site specific output such as a fence the quantity will have to be measured.
5.7 Market Construction: Group 106 No design guidance is provided for market construction.
5.8 Crop Storage and Processing: Group 107 No design guidance is provided for crop storage and processing.
5.9 Social Infrastructure: Group 108 No design guidance is provided for social infrastructure.
5.10 Energy: Group 109 No design guidance is provided for energy.
5.11 Sanitation: Group 110 Form T101 is used for sanitation projects.
The sanitation group includes:
� Latrines
� Waste water
� Solid waste management
� (Storm water) Drainage
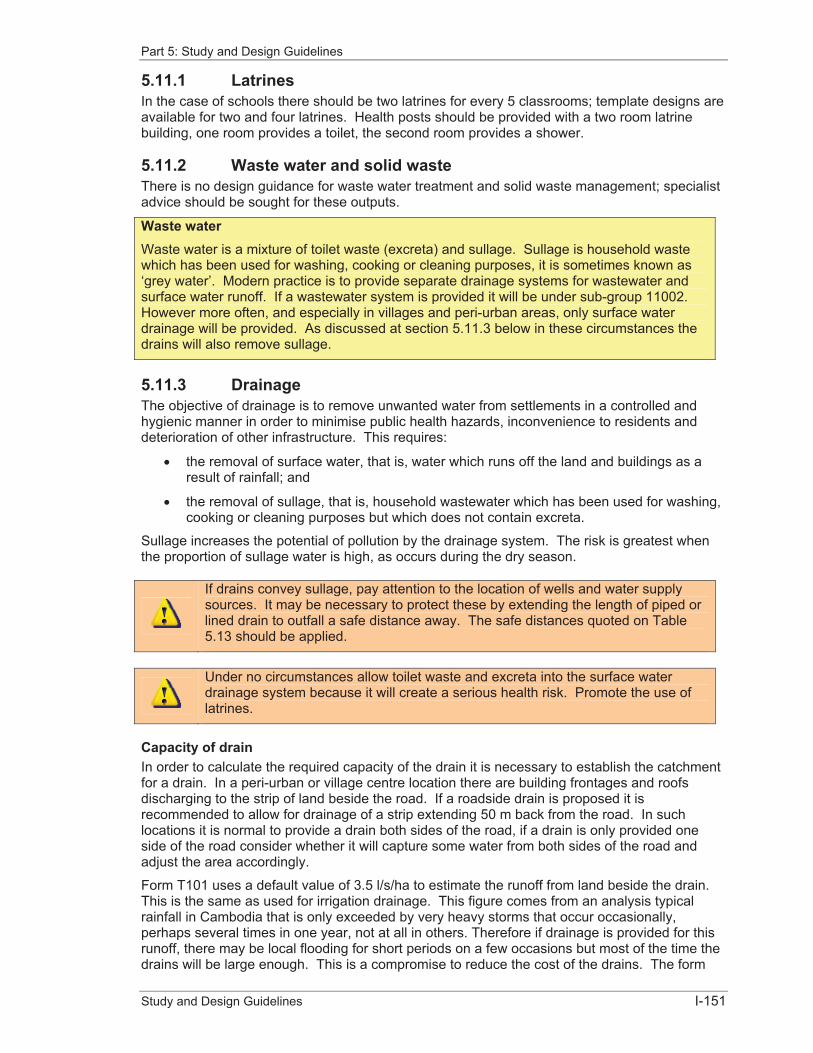
Part 5: Study and Design Guidelines
Study and Design Guidelines I-151
5.11.1 Latrines In the case of schools there should be two latrines for every 5 classrooms; template designs are available for two and four latrines. Health posts should be provided with a two room latrine building, one room provides a toilet, the second room provides a shower.
5.11.2 Waste water and solid waste There is no design guidance for waste water treatment and solid waste management; specialist advice should be sought for these outputs.
Waste water Waste water is a mixture of toilet waste (excreta) and sullage. Sullage is household waste which has been used for washing, cooking or cleaning purposes, it is sometimes known as ‘grey water’. Modern practice is to provide separate drainage systems for wastewater and surface water runoff. If a wastewater system is provided it will be under sub-group 11002. However more often, and especially in villages and peri-urban areas, only surface water drainage will be provided. As discussed at section 5.11.3 below in these circumstances the drains will also remove sullage.
5.11.3 Drainage The objective of drainage is to remove unwanted water from settlements in a controlled and hygienic manner in order to minimise public health hazards, inconvenience to residents and deterioration of other infrastructure. This requires:
� the removal of surface water, that is, water which runs off the land and buildings as a result of rainfall; and
� the removal of sullage, that is, household wastewater which has been used for washing, cooking or cleaning purposes but which does not contain excreta.
Sullage increases the potential of pollution by the drainage system. The risk is greatest when the proportion of sullage water is high, as occurs during the dry season.
If drains convey sullage, pay attention to the location of wells and water supply sources. It may be necessary to protect these by extending the length of piped or lined drain to outfall a safe distance away. The safe distances quoted on Table 5.13 should be applied.
Under no circumstances allow toilet waste and excreta into the surface water drainage system because it will create a serious health risk. Promote the use of latrines.
Capacity of drain In order to calculate the required capacity of the drain it is necessary to establish the catchment for a drain. In a peri-urban or village centre location there are building frontages and roofs discharging to the strip of land beside the road. If a roadside drain is proposed it is recommended to allow for drainage of a strip extending 50 m back from the road. In such locations it is normal to provide a drain both sides of the road, if a drain is only provided one side of the road consider whether it will capture some water from both sides of the road and adjust the area accordingly.
Form T101 uses a default value of 3.5 l/s/ha to estimate the runoff from land beside the drain. This is the same as used for irrigation drainage. This figure comes from an analysis typical rainfall in Cambodia that is only exceeded by very heavy storms that occur occasionally, perhaps several times in one year, not at all in others. Therefore if drainage is provided for this runoff, there may be local flooding for short periods on a few occasions but most of the time the drains will be large enough. This is a compromise to reduce the cost of the drains. The form

Part 5: Study and Design Guidelines
Study and Design Guidelines I-152
allows another value to be entered. The required capacity is then calculated manually and enter to the form.
Form T101 asks if the drain collects water from beyond the immediate area, e.g. a small area of paddy. If it does you are asked to describe how the drain is affected, e.g. you may find that the water from the paddy must be added to the runoff within the village. It is also necessary to enter the extra area of catchment. If the area is �1 km2 then the form will calculate the extra flow based on 3.5 l/s/ha (or whatever other flow rate you enter) and adds it to the runoff from beside the drain. If the area is >1.0 km2 then the form advises the flow is probably too large for the drain and should be directed to flow another way.
Hydraulic design of channel Different procedures apply for the hydraulic design of channels compared to pipes. The advice on pipes follows below.
The theory for design of channels is the same as irrigation canals and drains.
Form T101 calls-up Applet T101 Channel drain that will choose the channel size provided you answer a few questions. You then need to fill the results into the generator.
You have to enter the level of the bed at the upstream and downstream ends plus the length of the drain so that the Applet can calculate the gradient. You choose a bank slope, the Template for a concrete or brick drain has vertical sides. You select a bed width. You also chose a freeboard, 0.1 m is recommended as the minimum freeboard but you can choose a larger freeboard. You enter Manning’s n for channel roughness, the form lists recommended values for earth, concrete and masonry. You then need to enter the required capacity previously calculated manually and write into the form to the Appet T101 but you may enter another flow if you chose.
Applet T101 then prints the required depth of drain, the width between top of banks (which is the same as the bed width except for trapezoidal drains), and the flow velocity. If the recommended dimensions are not suitable then you can try changing the bed levels and the bed widths to see if this will improve the design. Finally, copy those results to the form T101.
Hydraulic design of pipe drain Pipe design is based on solution of the Colebrook-White formula. The full solution is too complex to provide rapid solution for design so ‘Universal’ design charts were developed by Ackers22 to permit direct solution. These are now in their 8th Edition in tabular form23.
The relevant results have to be taken from the charts to fill into Form T101.
The results used by Form T110 are show in Table 5.21 and Table 5.22 for concrete and plastics pipes respectively. The form allows you to choose between these two pipe materials. The difference is the pipe roughness (friction) expressed as the Colebrook-White coefficient k (see tables). Plastic pipes are smoother so have a marginally greater capacity.
At design capacity the pipes are intended to run full. For this condition the headwalls in the intermediate chambers must be submerged. Hence the hydraulic gradient is calculated assuming the water rises to 200 mm below ground level at the head of the drain and is the depth of the drain at the outfall. The applet then enters the table for this gradient and reads off the discharge and velocity for the chosen pipe size. If this does not match the required capacity chose a different pipe size, or alter the drain depth to change the gradient until you are satisfied the drain will be large enough.
22 Ackers P. Charts for Hydraulic Design of Channels and Pipes, Hydraulics Research Paper No2,
Hydraulics Research Station, Wallingford, Her Majesty’s Stationery Office, UK, First Edition, 1958. 23 Barr DIH. Tables for Hydraulic Design of Pipes, Sewers and Channels, Eighth Edition, Volume 1. HR
Wallingford, UK, March 2005.
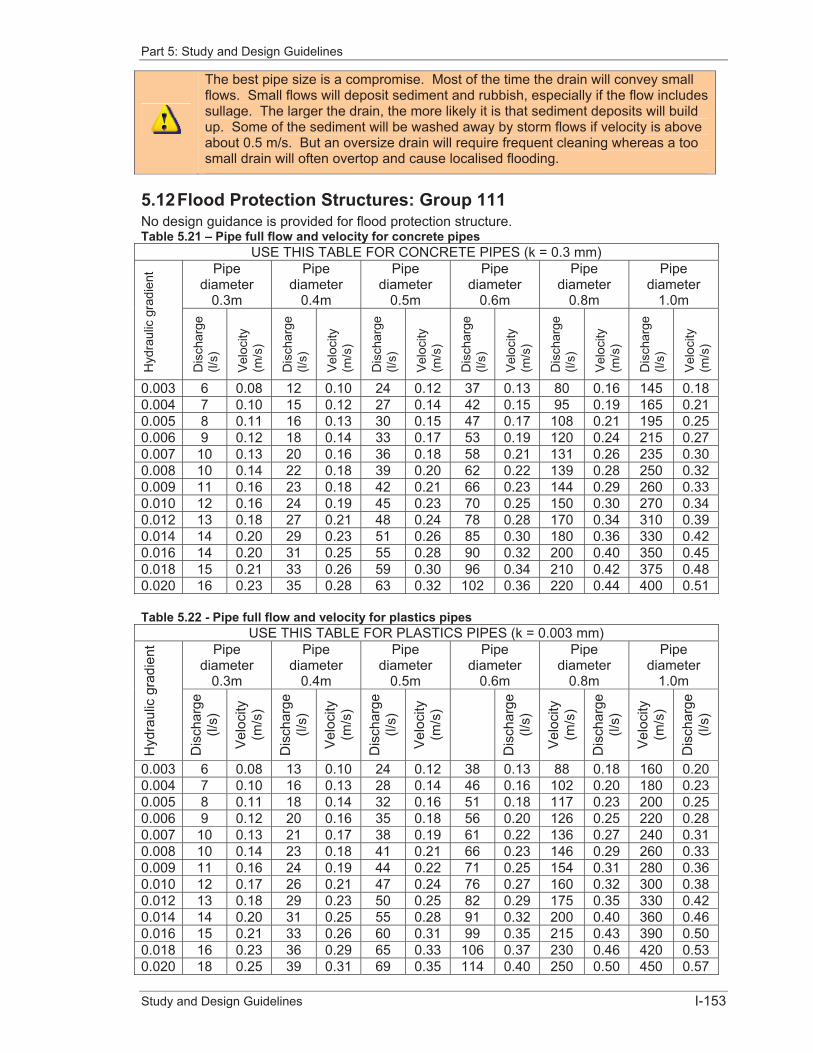
Part 5: Study and Design Guidelines
Study and Design Guidelines I-153
The best pipe size is a compromise. Most of the time the drain will convey small flows. Small flows will deposit sediment and rubbish, especially if the flow includes sullage. The larger the drain, the more likely it is that sediment deposits will build up. Some of the sediment will be washed away by storm flows if velocity is above about 0.5 m/s. But an oversize drain will require frequent cleaning whereas a too small drain will often overtop and cause localised flooding.
5.12 Flood Protection Structures: Group 111 No design guidance is provided for flood protection structure. Table 5.21 – Pipe full flow and velocity for concrete pipes
USE THIS TABLE FOR CONCRETE PIPES (k = 0.3 mm)
Hyd
raul
ic g
radi
ent Pipe
diameter0.3m
Pipediameter
0.4m
Pipediameter
0.5m
Pipediameter
0.6m
Pipediameter
0.8m
Pipediameter
1.0m
Dis
char
ge
(l/s)
Vel
ocity
(m
/s)
Dis
char
ge
(l/s)
Vel
ocity
(m
/s)
Dis
char
ge
(l/s)
Vel
ocity
(m
/s)
Dis
char
ge
(l/s)
Vel
ocity
(m
/s)
Dis
char
ge
(l/s)
Vel
ocity
(m
/s)
Dis
char
ge
(l/s)
Vel
ocity
(m
/s)
0.003 6 0.08 12 0.10 24 0.12 37 0.13 80 0.16 145 0.18 0.004 7 0.10 15 0.12 27 0.14 42 0.15 95 0.19 165 0.21 0.005 8 0.11 16 0.13 30 0.15 47 0.17 108 0.21 195 0.25 0.006 9 0.12 18 0.14 33 0.17 53 0.19 120 0.24 215 0.27 0.007 10 0.13 20 0.16 36 0.18 58 0.21 131 0.26 235 0.30 0.008 10 0.14 22 0.18 39 0.20 62 0.22 139 0.28 250 0.32 0.009 11 0.16 23 0.18 42 0.21 66 0.23 144 0.29 260 0.33 0.010 12 0.16 24 0.19 45 0.23 70 0.25 150 0.30 270 0.34 0.012 13 0.18 27 0.21 48 0.24 78 0.28 170 0.34 310 0.39 0.014 14 0.20 29 0.23 51 0.26 85 0.30 180 0.36 330 0.42 0.016 14 0.20 31 0.25 55 0.28 90 0.32 200 0.40 350 0.45 0.018 15 0.21 33 0.26 59 0.30 96 0.34 210 0.42 375 0.48 0.020 16 0.23 35 0.28 63 0.32 102 0.36 220 0.44 400 0.51
Table 5.22 - Pipe full flow and velocity for plastics pipes USE THIS TABLE FOR PLASTICS PIPES (k = 0.003 mm)
Hyd
raul
ic g
radi
ent Pipe
diameter0.3m
Pipediameter
0.4m
Pipediameter
0.5m
Pipediameter
0.6m
Pipediameter
0.8m
Pipediameter
1.0m
Dis
char
ge(l/
s)
Vel
ocity
(m/s
)
Dis
char
ge(l/
s)
Vel
ocity
(m/s
)
Dis
char
ge(l/
s)
Vel
ocity
(m/s
)
Dis
char
ge(l/
s)
Vel
ocity
(m/s
)
Dis
char
ge(l/
s)
Vel
ocity
(m/s
)
Dis
char
ge(l/
s)
0.003 6 0.08 13 0.10 24 0.12 38 0.13 88 0.18 160 0.20 0.004 7 0.10 16 0.13 28 0.14 46 0.16 102 0.20 180 0.23 0.005 8 0.11 18 0.14 32 0.16 51 0.18 117 0.23 200 0.25 0.006 9 0.12 20 0.16 35 0.18 56 0.20 126 0.25 220 0.28 0.007 10 0.13 21 0.17 38 0.19 61 0.22 136 0.27 240 0.31 0.008 10 0.14 23 0.18 41 0.21 66 0.23 146 0.29 260 0.33 0.009 11 0.16 24 0.19 44 0.22 71 0.25 154 0.31 280 0.36 0.010 12 0.17 26 0.21 47 0.24 76 0.27 160 0.32 300 0.38 0.012 13 0.18 29 0.23 50 0.25 82 0.29 175 0.35 330 0.42 0.014 14 0.20 31 0.25 55 0.28 91 0.32 200 0.40 360 0.46 0.016 15 0.21 33 0.26 60 0.31 99 0.35 215 0.43 390 0.50 0.018 16 0.23 36 0.29 65 0.33 106 0.37 230 0.46 420 0.53 0.020 18 0.25 39 0.31 69 0.35 114 0.40 250 0.50 450 0.57

I-154
ANNEX 1: TECHNICAL FORMS

Annex 1: Technical Forms
Study and Design Guidelines I-155
Technical Form T11 – Transport: Roads Form T11 Transport: Road
Province : District : S/C:
Name of project : Code of S/C :
Name of TSO : Date of form preparation :
1. Location: where is the earth road located within the Sangkat/Commune?
* Describe this location
2. Give the coordinates of GPS
If there are many road segments which have the same condition width and pavement, give the coordinates of start points and end points of each segment. One row is for one segment.
Start point Ending point X of GPS Y of GPS X of GPS Y of GPS
3. Type of road project: What kind of road work is required?
� New road construction
� Rehabilitate existing road, the same width and surface
� Improve and widen existing road, same surface
� Improve existing road, the same width upgraded surface
� Improve and widen existing road, upgrade surface.
4. Length of road: what is the length of the road (in kilometer)?
5. Road classification:
� District to district road, Tertiary Road, (T Road), “6.0 m”
� District to Sangkat/Commune, Sub-tertiary Road Type 1, ( ST1 road) “6.0 m”
� Commune to commune road, Sub-tertiary Road Type 2, (ST2 road), “5.0m”
� Commune to village road, Sub-tertiary Road Type 3, (ST3 road), “4.0m”
� Village to village road, Sub-tertiary Road Type 3, (ST3 road), “4.0m”
6. Structures: are there existing structures?
* If “yes” answer the following questions; if “no” skip to the next question.
� Yes
� No
7. List number, description and dimensions of existing structures.
8. What new structures are required (number of each)?
* fill a form T12 for each structure, number the structure in the table.
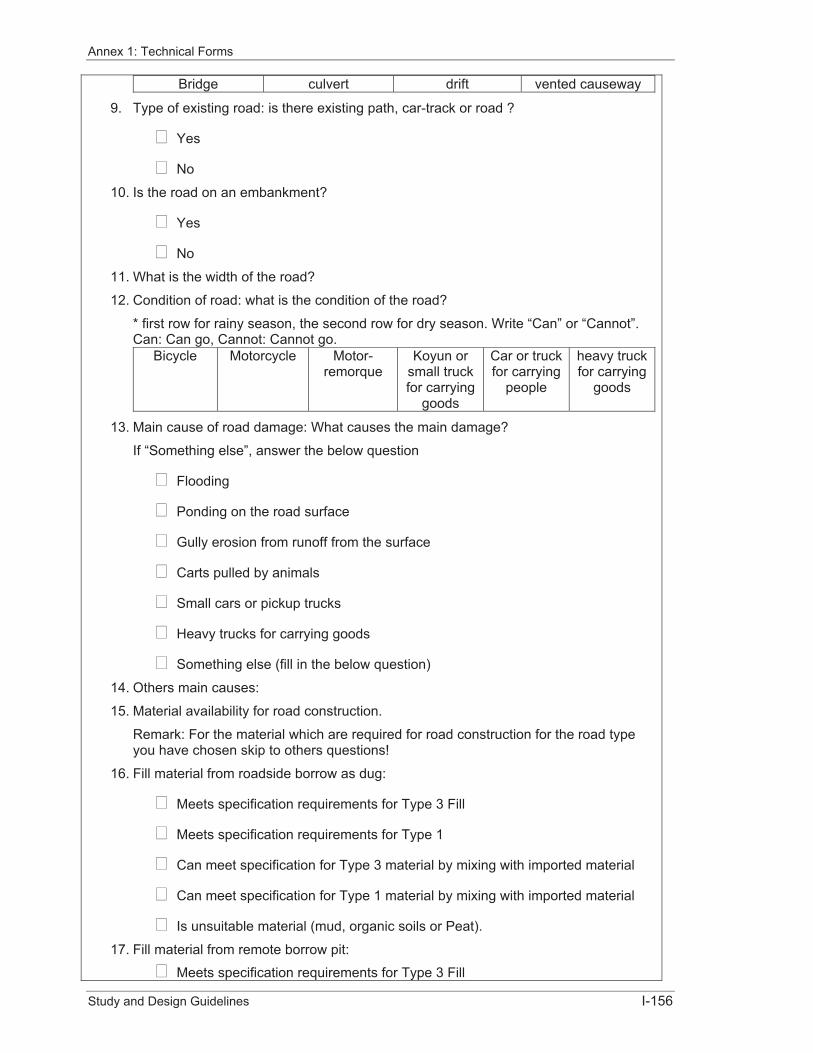
Annex 1: Technical Forms
Study and Design Guidelines I-156
Bridge culvert drift vented causeway
9. Type of existing road: is there existing path, car-track or road ?
� Yes
� No
10. Is the road on an embankment?
� Yes
� No
11. What is the width of the road?
12. Condition of road: what is the condition of the road?
* first row for rainy season, the second row for dry season. Write “Can” or “Cannot”. Can: Can go, Cannot: Cannot go.
Bicycle Motorcycle Motor-remorque
Koyun or small truck for carrying
goods
Car or truck for carrying
people
heavy truck for carrying
goods
13. Main cause of road damage: What causes the main damage?
If “Something else”, answer the below question
� Flooding
� Ponding on the road surface
� Gully erosion from runoff from the surface
� Carts pulled by animals
� Small cars or pickup trucks
� Heavy trucks for carrying goods
� Something else (fill in the below question)
14. Others main causes:
15. Material availability for road construction.
Remark: For the material which are required for road construction for the road type you have chosen skip to others questions!
16. Fill material from roadside borrow as dug:
� Meets specification requirements for Type 3 Fill
� Meets specification requirements for Type 1
� Can meet specification for Type 3 material by mixing with imported material
� Can meet specification for Type 1 material by mixing with imported material
� Is unsuitable material (mud, organic soils or Peat).
17. Fill material from remote borrow pit:
� Meets specification requirements for Type 3 Fill

Annex 1: Technical Forms
Study and Design Guidelines I-157
� Meets specification requirements for Type 1
18. Distance of borrow pit(s) from road (Km):
19. Source of sand:
� Borrow pit
� Stream bed
20. Distance from road (Km):
21. Source of gravel:
� Borrow pit
� Stream bed
22. Distance from road (Km):
23. Laterite
Put “good”, “medium” or “poor” in the box of quality. Source distance of transportation
(Km) quality
24. Type of stone from quarry
* It the source is not borrow pit, please choose the answer below
� Hard metamorphic rock (granite, basalt, etc)
� Limestone
� Sandstone
25. Type of stone for stream bed:
* If the source is not stream bed, please choose the answer below
� Hard metamorphic rock (granite, basalt, etc)
� Limestone
� Sandstone
26. Water supply for earth work Source distance from road (Km)
27. Road traffic: what are the proportion of the cars and trucks using the road?
*Write in percentage. One place to another in
commune Go from the commune to
a place outside the commune or vice versa
Go from one place outside the commune to
another outside the commune
28. the proportion of the cars and trucks using the road is:
* Put it into percentage.
Belong to people who live in the commune
Belong to people who live outside the commune
29. Foundation soils: what kind of soil the structure stand on?

Annex 1: Technical Forms
Study and Design Guidelines I-158
* if “other”, mention in the following question:
� Soil that is very easily eroded
� Normal clay
� Sandy soils
� Gravels
� Earth with big stones in it
� Other.
30. For others soil kinds.
31. Side slope: Fill slope Vertical Horizontal
32. Cut slope Vertical Horizontal
33. Choice of road: what is thickness of the pavement proposed?
� Surface (if applicable)
� Wearing course (if applicable)
� Base course (if applicable)
� Road base (if applicable)
� Sub base (if applicable)
34. Fill with the thickness of the road pavement choosing above: Road pavement thickness
35. Road maintenance: Does the commune have a Commune Road Sub-Committee?
� Yes
� No
36. Who is responsible for road maintenance?
* if “Other” mention your answer in the question below.
� Ministry of Rural Development
� Sangkat/Commune
� Others
37. Write the person who is responsible for road maintenance if you choose “other”
38. Remark:
You must upload “Applet” in which you entered your data to get the answers and the advices about road pavement. If you chose the road pavement that is not suitable less or more than recommendation from “Applet T11”, give your reason on Advice Tab.

Annex 1: Technical Forms
Study and Design Guidelines I-159
Technical Form T12 – Transport: Structures
Form T12 Transport : Road structure
Province : District : S/C:
Name of project : Code of S/C :
Name of TSO : Date of form preparation :
1. Location: where is the structure located within the Sangkat/Commune?
*Describe the location 2. Give the coordinates of the GPS.
X of GPS Y of GPS 3. Road Classification :
* Road classification: T, ST1, ST2, or ST3. *Road standard: A or B
Classification Road standard Width of pavement (m) 4. Scope of work: is the structure part of a road project to be carried out at the same
time or is the work for the structure only?
� A part of road project
� Structure only.
5. Is there an existing structure and if so what is its condition and description?
If “Yes”, answer only the questions about the existing structure, then go to question 13. If “ No” go directly to question 13.
� Yes
� No
6. Describe of existing pipe culvert:
* Material can be: Concrete, Clay, Plastic or steel. Headwalls can be: wood, masonry, mass concrete, Reinforced concrete, or none.
Number of pipe diameter (m) Pipe material Headwalls Carriageway width over
culvert
7. Describe the existing box culvert.
* Headwall can be: Wood, masonry, mass concrete, reinforced concrete or none. Road slab can be: on wall or integrated with wall.
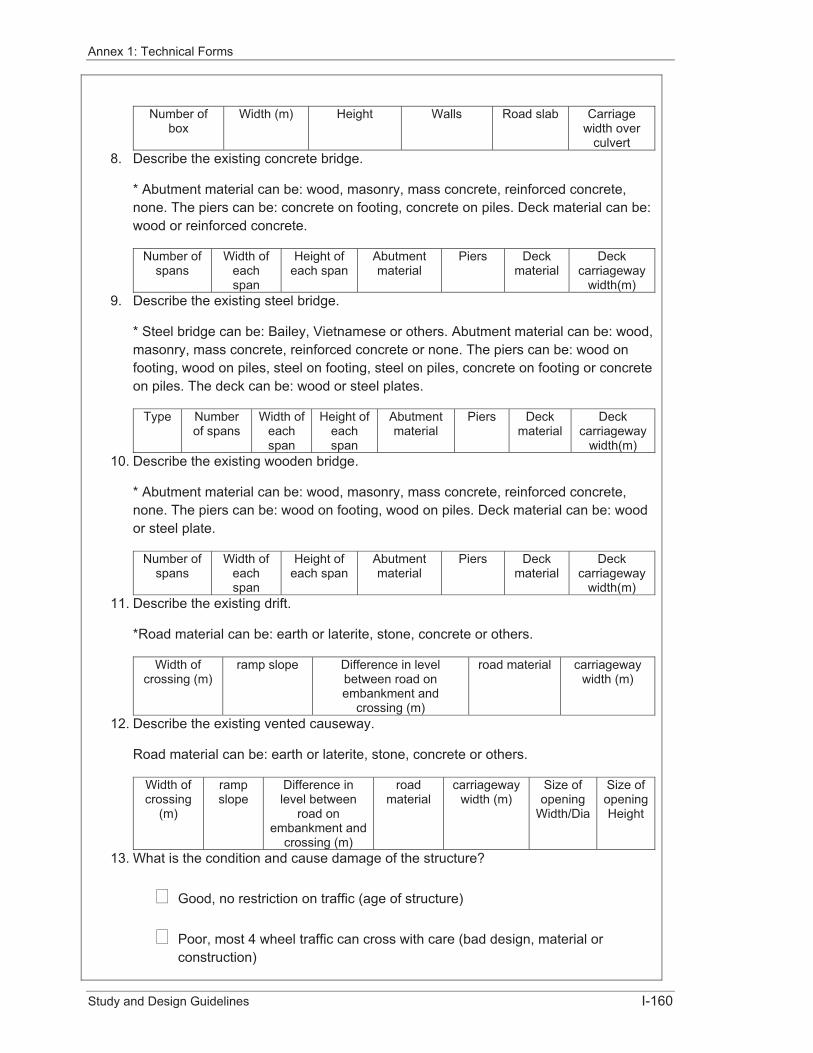
Annex 1: Technical Forms
Study and Design Guidelines I-160
Number of box
Width (m) Height Walls Road slab Carriage width over
culvert 8. Describe the existing concrete bridge.
* Abutment material can be: wood, masonry, mass concrete, reinforced concrete, none. The piers can be: concrete on footing, concrete on piles. Deck material can be: wood or reinforced concrete.
Number of spans
Width of eachspan
Height of each span
Abutmentmaterial
Piers Deck material
Deck carriageway
width(m)9. Describe the existing steel bridge.
* Steel bridge can be: Bailey, Vietnamese or others. Abutment material can be: wood, masonry, mass concrete, reinforced concrete or none. The piers can be: wood on footing, wood on piles, steel on footing, steel on piles, concrete on footing or concrete on piles. The deck can be: wood or steel plates.
Type Number of spans
Width of eachspan
Height of eachspan
Abutmentmaterial
Piers Deck material
Deck carriageway
width(m)10. Describe the existing wooden bridge.
* Abutment material can be: wood, masonry, mass concrete, reinforced concrete, none. The piers can be: wood on footing, wood on piles. Deck material can be: wood or steel plate.
Number of spans
Width of eachspan
Height of each span
Abutmentmaterial
Piers Deck material
Deck carriageway
width(m)11. Describe the existing drift.
*Road material can be: earth or laterite, stone, concrete or others.
Width of crossing (m)
ramp slope Difference in level between road on embankment and
crossing (m)
road material carriageway width (m)
12. Describe the existing vented causeway.
Road material can be: earth or laterite, stone, concrete or others.
Width of crossing
(m)
rampslope
Difference in level between
road on embankment and
crossing (m)
roadmaterial
carriageway width (m)
Size of opening
Width/Dia
Size of opening Height
13. What is the condition and cause damage of the structure?
� Good, no restriction on traffic (age of structure)
� Poor, most 4 wheel traffic can cross with care (bad design, material or construction)

Annex 1: Technical Forms
Study and Design Guidelines I-161
� Bad, impassable to 4 wheel traffic (not suitable for current traffic)
� Collapsed and useless (damage by water or flood)
14. Available construction material: Part 1
* For construction material, fill with “Need” below type of material, then fill the source and distance. If “No need”, fill nothing. Source of fill type 3: borrow pit. Source of sands: borrow pit or stream bed. Source of gravel: borrow pit or stream bed.
Type3 fill
source distance (km)
sand source of
sands
distance (km)
gravel source of
gravel
distance (km)
15. Part 2
* Source of stone: quarry or stream bed. Type of stone: hard metamorphic rocks (granite, basalt, etc).
Stone Source of stone
type of stone
distance (km)
watersupply for concrete
source distance (km)
16. Foundation soils: What kind of soil is the structure founded on ?
* if “others”, answers the following questions.
� Soil that is very easily eroded
� Normal clay
� Sandy soil
� Gravel
� Earth with big stone in it
� Others
17. Others, mention them.
18. Foundation strength of DCP (mm/blow) and location of each test.
* Location: stream bed road centre line, stream bed upstream, stream bed downstream, left bank abutment, right bank abutment or others.
DCP (mm/blow) location 19. what is the 20 percentile DCP?
20. Hydrology and required hydraulic capacity of structure: did you use “Applet” to calculate the design flow, velocity, type and size of structure?
* You can use “Applet T12” to determine the simple flow system, but for the

Annex 1: Technical Forms
Study and Design Guidelines I-162
complicated one, you have to find help from an engineer.
� Yes
� No
21. Maximum design flow (m3/s) from Applet or engineer is:
* If you use Applet, write down the answer from form T12, worksheet GTFM:C32.
22. Velocity (m/s) which downstream structure can withstand is
* if you use Applet, write down the answer from form T12, worksheet GTFM:C34
23. Remark:
Upload “Applet” in which you fill the data to get the design flow, suitable structures and the velocity above. If you don’t use Applet to get the recommended structure, give your suitable reasons and upload the related documents that you use to determine design flow and velocity.

Annex 1: Technical Forms
Study and Design Guidelines I-163
Technical Form T21 – Irrigation: Project Form T21 : Irrigation projet
Province : District : S/C:Name of project : Code of S/C : Name of TSO : Date of form preparation :
1. Location: where is the project located within the Sangkat/Commune? 2. Give the coordinate of GPS.
X of GPS Y of GPS 3. Project description: provide the description about the project including the proposed
components and size of command area. 4. Farmer water user community: is there a farmer user community to support the project?
* if you chose “No”, skip to question 7.
� Yes
� No5. How many farmers (families) are members of the Community? 6. Have the farmers discussed together and agreed how they will pay the operation and
maintenance costs of the project?
� Yes
� No7. Operation and maintenance responsibilities:
Who will be responsible to do the operation and maintenance? * if the scheme don’t need a pump, fill with “No need”.
Operate the pump (if the
scheme needs a pump)?
Open and close water gates?
Collectwater user
fees?
Organizemaintenance
work?
Solve disputes between
farmers about the water?
8. Irrigation system requirement: what is the irrigated area in hectares? * Remark: if the project will be a part of a big irrigation project, only describe the part that will be affected by the project.
Wet season dry season
9. What is the main type of crop that will be grown on the land? wet season dry season
10. How much of the land that has enough water every year already? Wet season number of families dry season number of families
11. How much of the land that has enough water some years? Wet season number of families dry season number of families
12. How much of the land never has enough water at present? Wet season number of families dry season number of families
13. Total size of land and total number of families. * Totalize the size of wet season irrigated area, the number of families, the size of dry

Annex 1: Technical Forms
Study and Design Guidelines I-164
season irrigated area, the number of families. Wet season number of families dry season number of families
14. Flooding: Do the fields flood for some days each year? If “Yes”, answer the following questions, if “No”, skip to question 18.
� Yes
� No15. How long are the fields flooded (days)? 16. What is the flood depth during these days (m)? 17. What is the flood path, does the water flow concentrate is some places, describe and
flow path(s) on map? 18. Existing irrigation system: is there and existing irrigation system?
If “Yes”, answer the following question. If “No” skip to question 28.
� Yes
� No19. When was the irrigation system built?
If ‘1980 to 2000’ or ‘After 2000’, answer the following questions. If not, skip one question below.
� French era
� Sihanouk era
� Khmer Rouge era
� 1980 to 2000
� After 2000. 20. Under what program or which donor paid for the project? 21. Does the system work?
� Working
� Working 50%
� Works a little
� Not working 22. What are the main components of the system and what is their condition?
� River intake
� Reservoir
� Dam
� Spillways
� Large water gates
� Canals
� Small water gates and culverts 23. What is the condition of the irrigation project?
Answer: Working, works a little, Not working or collapse for the main components of the

Annex 1: Technical Forms
Study and Design Guidelines I-165
system choosing above. Main components of the system condition
24. How many months is water available?
� < 1 month
� 1 to 2 months
� 3 to 4 months
� 5 months
� 6 months
� > 6 months 25. What do you judge as the main problem with the existing irrigation system? 26. How can a new irrigation project overcome these problems? 27. Do you have any other comments relevant to the proposed irrigation project? 28. Water resource: where will the water come from?
� River
� Reservoir
� Flood lake
� Canal29. What is the water depth existing river, reservoir, lake or canal each month of the year
and is the water stationary or flowing (include largest river flowing into or out of an existing reservoir)?
Month depth (m) flowing, not flowing 30. How will the water be delivered from the source to the distribution canals and fields?
� By pumping
� By gravity 31. What is the difference in between the lowest water level at the source and the level of
the fields (m)? * It is recommended to measure the difference in level with a survey instrument.
32. Irrigation water requirement: remark Use “Applet T21” to get “monthly water requirement for irrigation” and “gravity flow capacity per second”.
33. Works proposed for irrigation project: What are the main works items include size that will be repaired or newly constructed for the Irrigation Project? * For these following questions, answer only about situation and size of the structures chosen in this question.
� Reservoir
� Dam
� Spillways
� River weir or gate
� Head regulator
� Secondary canal
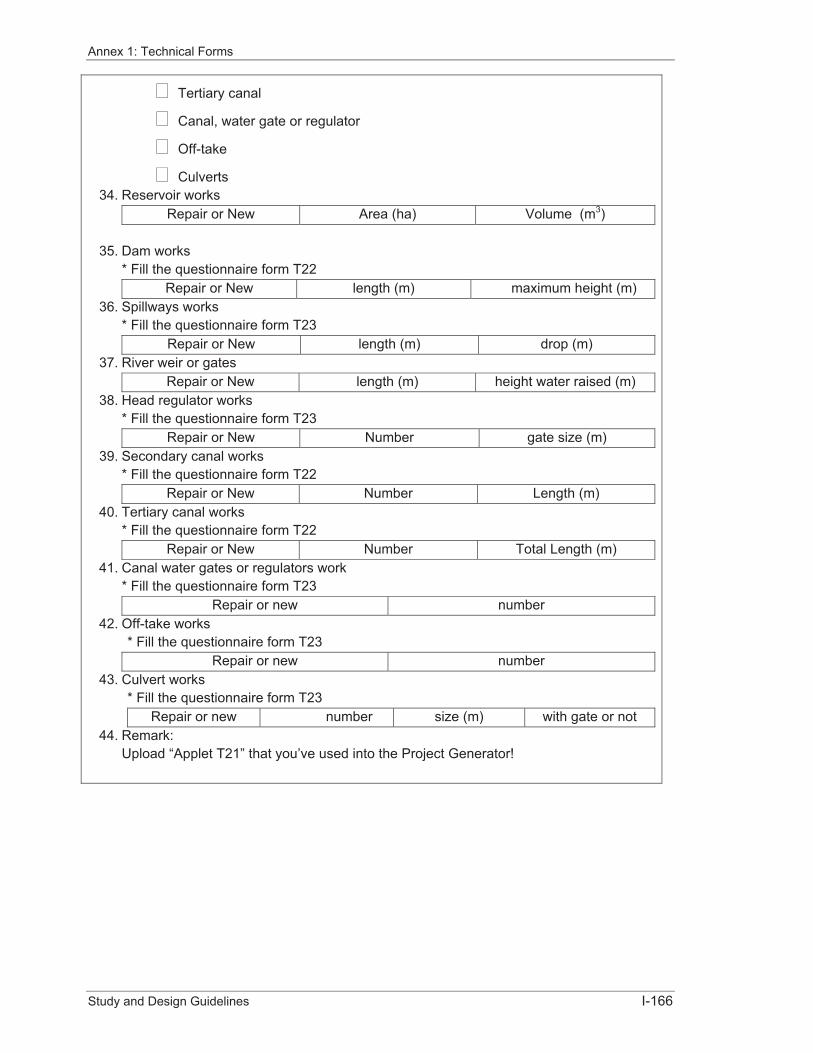
Annex 1: Technical Forms
Study and Design Guidelines I-166
� Tertiary canal
� Canal, water gate or regulator
� Off-take
� Culverts34. Reservoir works
Repair or New Area (ha) Volume (m3)
35. Dam works * Fill the questionnaire form T22
Repair or New length (m) maximum height (m) 36. Spillways works
* Fill the questionnaire form T23 Repair or New length (m) drop (m)
37. River weir or gates Repair or New length (m) height water raised (m)
38. Head regulator works * Fill the questionnaire form T23
Repair or New Number gate size (m) 39. Secondary canal works
* Fill the questionnaire form T22 Repair or New Number Length (m)
40. Tertiary canal works * Fill the questionnaire form T22
Repair or New Number Total Length (m) 41. Canal water gates or regulators work
* Fill the questionnaire form T23 Repair or new number
42. Off-take works * Fill the questionnaire form T23
Repair or new number 43. Culvert works
* Fill the questionnaire form T23 Repair or new number size (m) with gate or not
44. Remark: Upload “Applet T21” that you’ve used into the Project Generator! �

Annex 1: Technical Forms
Study and Design Guidelines I-167
Technical Form T22 – Irrigation: Earthwork Form T22 Irrigation earthworks Province : District : S/C:Name of project : Code of S/C : Name of TSO : Date of form preparation :
1. Location: where is the project located within the Sangkat/Commune? Location description:
2. Provide the coordinate of GPS. * First is the starting point, the flow row is the ending point
X of GPS Y of GPS 3. What type of earthwork is required?
� Build a new earthwork
� Improve the existing earthwork
� earthwork (e.g. raise or deepen, widen, add road surfacing)
� Repair a badly damage earthwork
� Periodic maintenance 4. Traffic use of earthwork: Is the earthwork used as a public road or for farm access?
If “Not used” skip to question 11.
� Public road
� Farm access
� Not used 5. Has the earthwork ever had Laterite or any other kind of improved surface in the
past?
� Yes
� No6. Is there any Laterite or any other kind of surface on the earthwork now?
� Yes
� No7. What is the largest vehicle that uses the earthwork?
� Passenger car
� People walking
� Motorcycle
� Motor-remorque
� Bicycle
� Animal cart
� Light vehicle/van
� Koyun
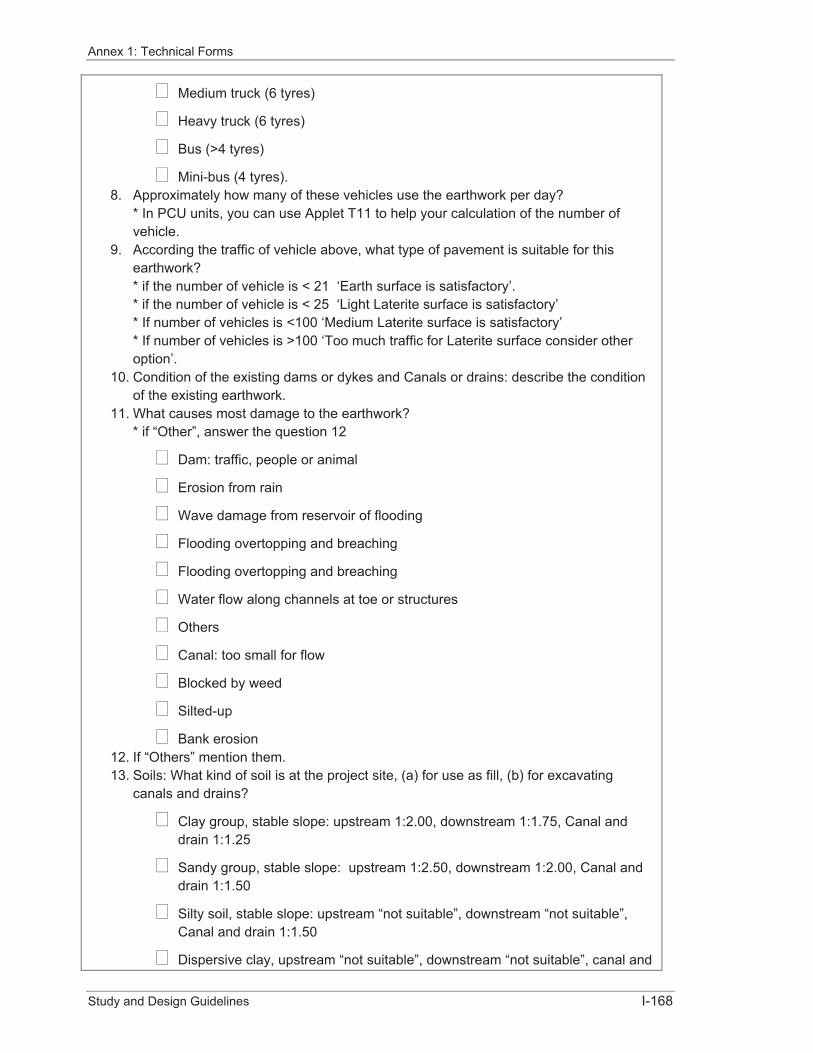
Annex 1: Technical Forms
Study and Design Guidelines I-168
� Medium truck (6 tyres)
� Heavy truck (6 tyres)
� Bus (>4 tyres)
� Mini-bus (4 tyres). 8. Approximately how many of these vehicles use the earthwork per day?
* In PCU units, you can use Applet T11 to help your calculation of the number of vehicle.
9. According the traffic of vehicle above, what type of pavement is suitable for this earthwork?* if the number of vehicle is < 21 ‘Earth surface is satisfactory’. * if the number of vehicle is < 25 ‘Light Laterite surface is satisfactory’ * If number of vehicles is <100 ‘Medium Laterite surface is satisfactory’ * If number of vehicles is >100 ‘Too much traffic for Laterite surface consider other option’.
10. Condition of the existing dams or dykes and Canals or drains: describe the condition of the existing earthwork.
11. What causes most damage to the earthwork? * if “Other”, answer the question 12
� Dam: traffic, people or animal
� Erosion from rain
� Wave damage from reservoir of flooding
� Flooding overtopping and breaching
� Flooding overtopping and breaching
� Water flow along channels at toe or structures
� Others
� Canal: too small for flow
� Blocked by weed
� Silted-up
� Bank erosion 12. If “Others” mention them. 13. Soils: What kind of soil is at the project site, (a) for use as fill, (b) for excavating
canals and drains?
� Clay group, stable slope: upstream 1:2.00, downstream 1:1.75, Canal and drain 1:1.25
� Sandy group, stable slope: upstream 1:2.50, downstream 1:2.00, Canal and drain 1:1.50
� Silty soil, stable slope: upstream “not suitable”, downstream “not suitable”, Canal and drain 1:1.50
� Dispersive clay, upstream “not suitable”, downstream “not suitable”, canal and

Annex 1: Technical Forms
Study and Design Guidelines I-169
drain : Line canal
� Organic soils, upstream “not suitable, downstream “not suitable”, canal and drain : Line canal.
14. Material for road construction: remark Skip the materias which are not chosen for road construction.
15. Fill material from borrow beside earth works.
� Meets the specification requirement for type 3 fill
� Exceeds specification for Type 3 Fill with high clay content 16. Fill material from remote borrow pit
* fill material can be 1. Meets the specification for type 3 fill, 2. Exceeds specification for type 3 fill with high clay content.Suitability, source (km).
Suitability source (km) 17. Sands
* Source: borrow pit, stream bed. Source distance (km)
18. Gravel * Source: borrow pit, stream bed
.Source distance (km) 19. Laterite
* Source: borrow pit, stream bed. Quality: Good, medium or poor. Source Quality distance (km)
20. Stone * Source: quarry, stream bed. Type: granite, basalt, limestone…
Source type distance (km) 21. Water supply for earthwork
Source distance (km) 22. Design of dam and dyke: What is reservoir full supply level at dam or flood levels at
dyke (m)? 23. What freeboard will be allowed (m)?
* You can get the values of freeboard from PIM. 24. Dam or dyke crests level (before any road surface is added), (m). 25. Will the dam or dyke be used as a road? 26. What is the crest width? 27. Will the crest be surfaced?
If “Others”, answer the following question.
� Not surfaced
� Laterite
� Others28. Others, mention them. 29. If laterite, what is the thickness of laterite (mm) ? 30. What will be the upstream slope (see advice in question 13)? 31. What will be the downstream slope (see advice in question 13)? 32. What slope protect will be provided to the upstream slope?
* If not “Rock riprap”, skip the question 34 to 36.
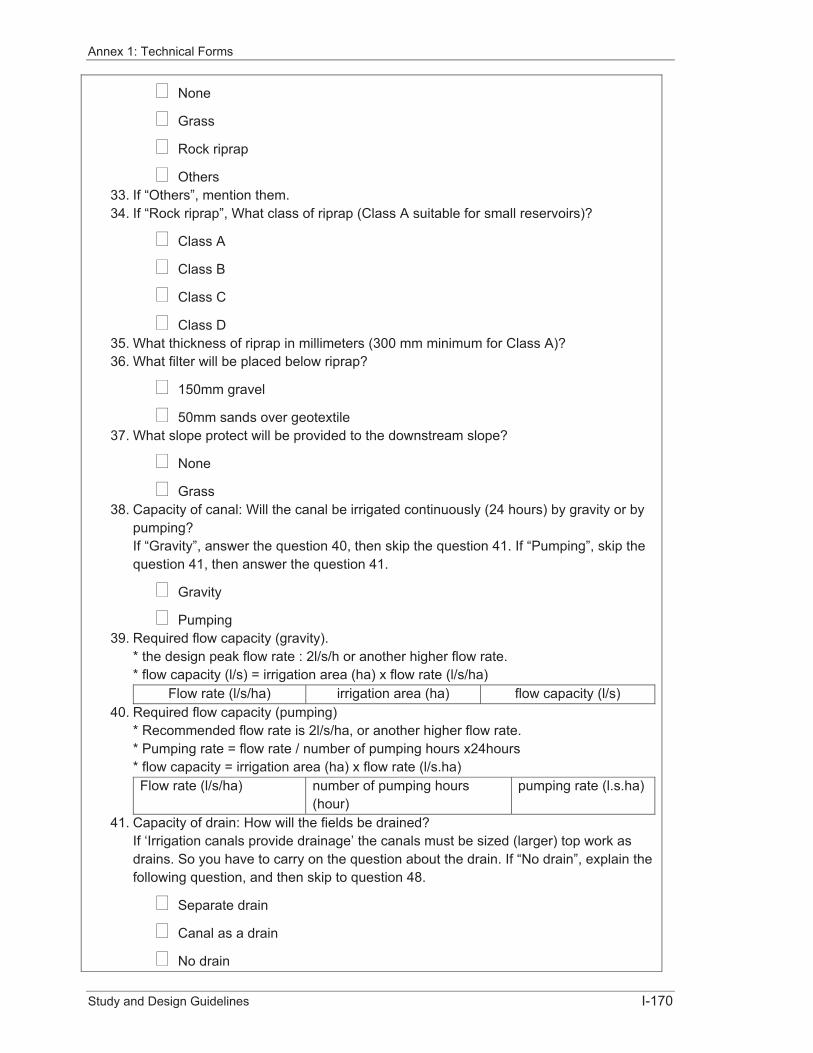
Annex 1: Technical Forms
Study and Design Guidelines I-170
� None
� Grass
� Rock riprap
� Others33. If “Others”, mention them. 34. If “Rock riprap”, What class of riprap (Class A suitable for small reservoirs)?
� Class A
� Class B
� Class C
� Class D 35. What thickness of riprap in millimeters (300 mm minimum for Class A)? 36. What filter will be placed below riprap?
� 150mm gravel
� 50mm sands over geotextile 37. What slope protect will be provided to the downstream slope?
� None
� Grass38. Capacity of canal: Will the canal be irrigated continuously (24 hours) by gravity or by
pumping?If “Gravity”, answer the question 40, then skip the question 41. If “Pumping”, skip the question 41, then answer the question 41.
� Gravity
� Pumping 39. Required flow capacity (gravity).
* the design peak flow rate : 2l/s/h or another higher flow rate. * flow capacity (l/s) = irrigation area (ha) x flow rate (l/s/ha)
Flow rate (l/s/ha) irrigation area (ha) flow capacity (l/s) 40. Required flow capacity (pumping)
* Recommended flow rate is 2l/s/ha, or another higher flow rate. * Pumping rate = flow rate / number of pumping hours x24hours * flow capacity = irrigation area (ha) x flow rate (l/s.ha) Flow rate (l/s/ha) number of pumping hours
(hour)pumping rate (l.s.ha)
41. Capacity of drain: How will the fields be drained? If ‘Irrigation canals provide drainage’ the canals must be sized (larger) top work as drains. So you have to carry on the question about the drain. If “No drain”, explain the following question, and then skip to question 48.
� Separate drain
� Canal as a drain
� No drain

Annex 1: Technical Forms
Study and Design Guidelines I-171
42. Explain how excess rainfall and flood water will be drained from the fields? 43. Drain capacity
* Recommended flow rate 3.5l/s/ha, or another higher flow rate. * Flow capacity (m3/s) = area (ha) x flow rate (m3/s/ha)
Drainage area (ha) flow rate (l/s/ha) flow capacity (m3/s)44. Will the drain collect water from catchments beyond the fields?
* E.g. a stream flows into the head of the drain from a small catchment or another irrigation system? If “Yes”, answer the following questions, if “No” skip to question 48.
� Yes
� No45. What is the catchment area in km2?
If the catchment < 1.00km2 , Add this area to the area of fields above and recalculate new field drainage flow rate. If the catchment > 1.00km2, use “Applet form T22, flow external catchment” or get help from engineer to calculate the total flow (with the flow in the catchment above).
46. The flow rate of external catchment (m3/s) is: Use “Applet T22 external catchment” then copy form column C32. If the flow system of the external catchment is too complicate, you have to discuss with the engineer to get the flow capacity of this catchment.
47. Total drain design flow (m3/s) is the flow from irrigated area + flow from external catchment.* Value of question 43 + value of question 46.
48. Hydraulic design of canal and drain: remark Use “Applet T22 Hydraulic design of canal and drain” to calculate the minimum water height, bottom width and design velocity.
49. Responsibility for operation and maintenance: is there a Farmer Water Use Comity (FWUC) or similar group of people who are responsible for operation and maintenance of the earthwork.
� Yes
� No50. Who will take to operate and maintain the earthwork ? 51. Remark
Upload all of “Applet T22” that you used into “Project generator” for engineer to examine.

Annex 1: Technical Forms
Study and Design Guidelines I-172
Technical Form T23 – Irrigation: Structure Form T23 Irrigation structure Province : District : S/C:Name of project : Code of S/C : Name of TSO : Date of form preparation :
1. Location: where is the structure located within the Sangkat/Commune ? 2. Provide the coordinates of GPS.
X of GPS Y of GPS 3. Fill type 3
Source: borrow pit Source distance from structure (km)
4. Sands Source: borrow pit or stream bed.
Source distance from structure (km) 5. Gravel
Source: borrow pit or stream bed. Remark: for concrete work, the gravel from stream bed is not permitted.
Source distance from structure (km) 6. Stone
Source: quarry or stream bed. Type of stone: Hard metamorphic rock (granite, basalt, etc), limestone and sandstone.
Source type of stone distance from structure (km)
7. Water supply for earthwork Source distance from structure (km)
8. Foundation soils: what kind of soils is the structure founded on? If “Others”, fill the questions following.
� Very easily eroded soil
� Normal clay
� Sandy soil
� Gravel
� Earth with big stone in it
� Others9. Other types of soils: mention them. 10. Foundation strength of DCP (mm/blow) and location of each test.
* Location: stream bed road centre line, stream bed up stream, stream bed downstream, left bank abutment, right bank abutment or others.
DCP (mm/blow) location 11. what is the 20 percentile DCP
* You can calculate this value with Applet T11 12. Crossing structure: is there an existing crossing structure ?
* if “Yes”, answer the following questions, if “Not”, go to “Flow capacity”
� Yes

Annex 1: Technical Forms
Study and Design Guidelines I-173
� No13. Road classification:
� District to district
� District to commune
� Commune to commune
� Commune to village
� Village to village
� Farm acces 14. What is the largest vehicle that uses the earthwork?
� Passenger car
� People walking
� Motorcycle
� Motor-remorque
� Bicycle
� Animal cart
� Light vehicle/van
� Koyun
� Medium truck (6 tyres)
� Heavy truck (6 tyres)
� Bus (>4 tyres)
� Mini-bus (4 tyres). 15. Flow capacity: what is the design flow capacity (can be from T22), (m3/s)?
* Calculated from canal capacity. You can skip this question for spillways or river intake. Generally, if the design structure is passed by the irrigation flow and drainage flow, you must design the structure the drainage flow, because its value is always higher.
16. What is the flow capacity at the structure (m3/s)? * Calculated from canal capacity. You can copy skip question for spillways or river intake. Generally, if the design structure is passed by the irrigation flow and drainage flow, you must design the structure the drainage flow, because its value is always higher.
17. Can this flow capacity be higher than design one? If “Can”, answer the following questions, if “Can not” skip them.
� Can
� Can not 18. Describe the circumstance and consequence for the structure also what provision will
be provided to survive an extreme flow? Using the design guidance spillways is sized for 1 in 50 year flow into the reservoir;

Annex 1: Technical Forms
Study and Design Guidelines I-174
the reservoir freeboard allows some of the flood to stay temporarily in the reservoir until it call all pass over the spillways. A concrete stilling basin and erosion protection will be provided downstream.
19. Did you use “Applet” to determine the design flow and length of structure? (Spillway and diversion weirs) * if you don’t design the spillway or river intake, skip them.
� Yes
� No20. Spillway and diversion weirs: is the structure for reservoir or river intake?
� Reservoir
� River intake 21. What is the design flow for spillway or river intake (m3/s) ?
* Copy from Applet T23, worksheet GTFM: C32. 22. What is the maximum safe water level at the upstream of structure? ( higher than this
level, it can be flooded, overtopped). * Copy from Applet T23, worksheet GTFP: C33.
23. What is the proposed weirs crest level? ( it is a full water level of a reservoir or river level intaking to the system). * Copy from Applet T23, worksheet GTFM:C34.
24. Required weirs length (m): * Copy from Applet T23, worksheet GTFM:C35.
25. Pumping capacity: provide the pumping capacity (m3/s).* Answer if there is a pumping, see the irrigation project form T22.
26. Responsibility for operation and maintenance: is there a Farmer Water User Comity (FWUC) or similar group of people who are willing to take responsibility to operate and maintain the structure?
� Yes
� No
27. Who will operate and maintain the irrigation structure? Commune council
28. Remark: Don’t forget to upload “Applet” that you used in your calculation.

Annex 1: Technical Forms
Study and Design Guidelines I-175
Technical Form T31 – Water Supply Form T31 Water supply Province : District : S/C:Name of project : Code of S/C : Name of TSO : Date of form preparation :
1. Location: where is the water supply located within the Sangkat/Commune?
2. Provide the coordinates of GPS. X of GPS Y of GPS
3. Number of proposed output: provide the number of proposed output? * Remark: Form T31 is only for one water supply output, it mean that, if you have many exactly the same output and same output data, you just make one output, answer just one technical form and provide the number of those output.
4. Purpose of water supply: for what purpose is the water supply used? If the “Village”, answer the question 5, if “School” or “Health center”, answer question 6.
� Village
� School
� Health centre 5. Information about number of users: how many people use the water supply? In which
village do they live? * Totalize the numbers above and write it down in the last row.
Name of village people in village number of family using the water supply
6. Number of supplier in school and health post * If you chose “School” in the answer above, write down only the number of rooms and number of students. If you choose “Health post” write down only the number of users in the health center.
Number of school rooms number of students or health post 7. Maintenance: Who will maintain the water supply? 8. Existing water supply: how many families use the existing water supply?
* if the existing water supply is for school, write down only “use for school”. 9. Have the families who will use the supply agreed to form a Water Supply Committee?
� Yes
� No10. Where does the domestic water used by these people come from now?
* Source: watercourse, natural pond, dug pond, rain water harvesting, spring, village well, household will, water-point piped. Totalize the number of users, and then write it down in the last row.
Source number of users distance to the centre of village (km)
11. Information about proposed facility: Who owns the land where the new facility will be constructed? * if the land is in private ownership, answer the question 12.
� Community
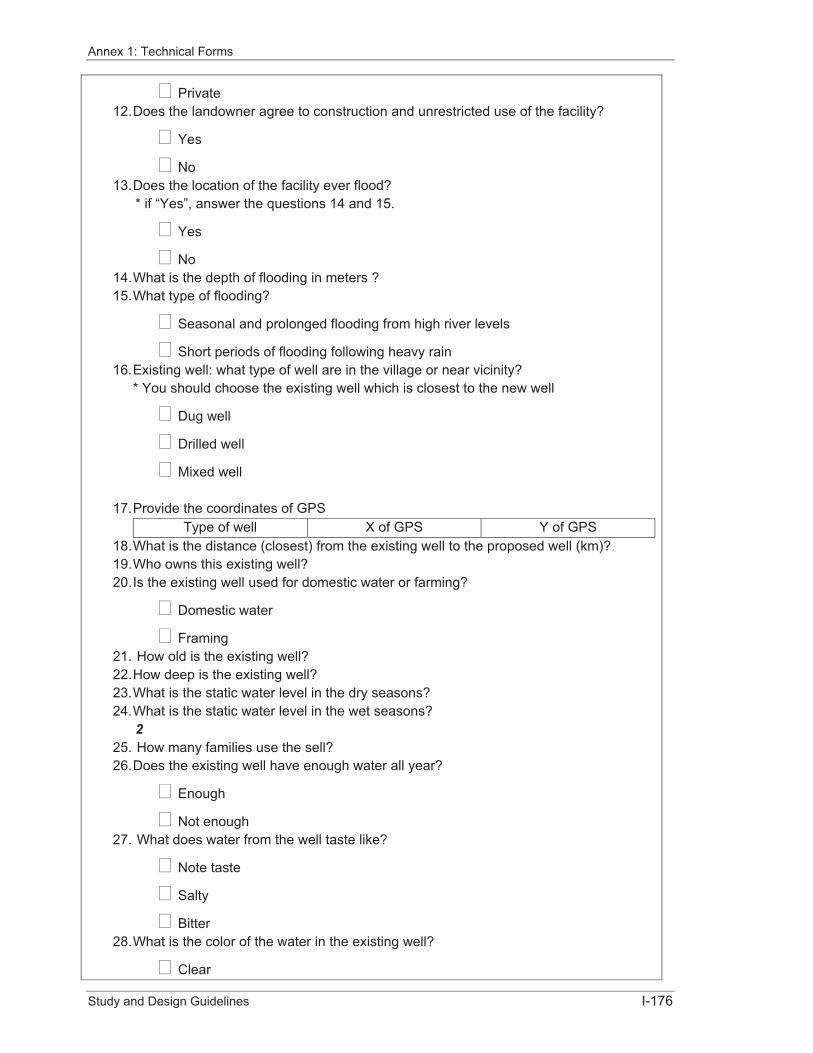
Annex 1: Technical Forms
Study and Design Guidelines I-176
� Private 12. Does the landowner agree to construction and unrestricted use of the facility?
� Yes
� No13. Does the location of the facility ever flood?
* if “Yes”, answer the questions 14 and 15.
� Yes
� No14. What is the depth of flooding in meters ? 15. What type of flooding?
� Seasonal and prolonged flooding from high river levels
� Short periods of flooding following heavy rain 16. Existing well: what type of well are in the village or near vicinity?
* You should choose the existing well which is closest to the new well
� Dug well
� Drilled well
� Mixed well
17. Provide the coordinates of GPS Type of well X of GPS Y of GPS
18. What is the distance (closest) from the existing well to the proposed well (km)? 19. Who owns this existing well? 20. Is the existing well used for domestic water or farming?
� Domestic water
� Framing21. How old is the existing well? 22. How deep is the existing well? 23. What is the static water level in the dry seasons? 24. What is the static water level in the wet seasons?
225. How many families use the sell? 26. Does the existing well have enough water all year?
� Enough
� Not enough 27. What does water from the well taste like?
� Note taste
� Salty
� Bitter28. What is the color of the water in the existing well?
� Clear

Annex 1: Technical Forms
Study and Design Guidelines I-177
� Gray
� Yellow
� Brown 29. Does it smell?
� Yes
� No30. Has the water from the existing well ever been tested for arsenic?
� Yes, ever
� No, never 31. What kind of soil or rock is the well sunk in?
From depth (m) to depth (m) kind of soil or rock
32. How do you know about the information on the soil or rock? 33. How are the other well ?
� No information on other wells
� To many well to list
� Other wells similar 34. Proposed well: name of proposed well 35. What kinds of soil or rock will the well sunk in?
From depth (m) to depth (m), kind of soil or rock. From depth (m) to depth (m) kind of soil or rock
36. How deep is the water bearing soil or rock (the aquifer)? 37. What is the depth of proposed well? 38. What is the static water level in the dry season (depth below ground in metres)? 39. What is the estimated dynamic water level in the dry season (drawn down by
pumping) (depth below ground in metres)? 40. How do you know the information on the proposed well? 41. Where will wastewater from the new well drain to?
If “Other”, answer the question 43.
� Soak away
� Watercourse
� Pond
� Other42. If “Other”, list your answers. 43. Is there anything close to the well that could cause contamination of the well?
* If “Other”, answer the question 45.
� None
� Latrine
� Animal pens
� Cmetery
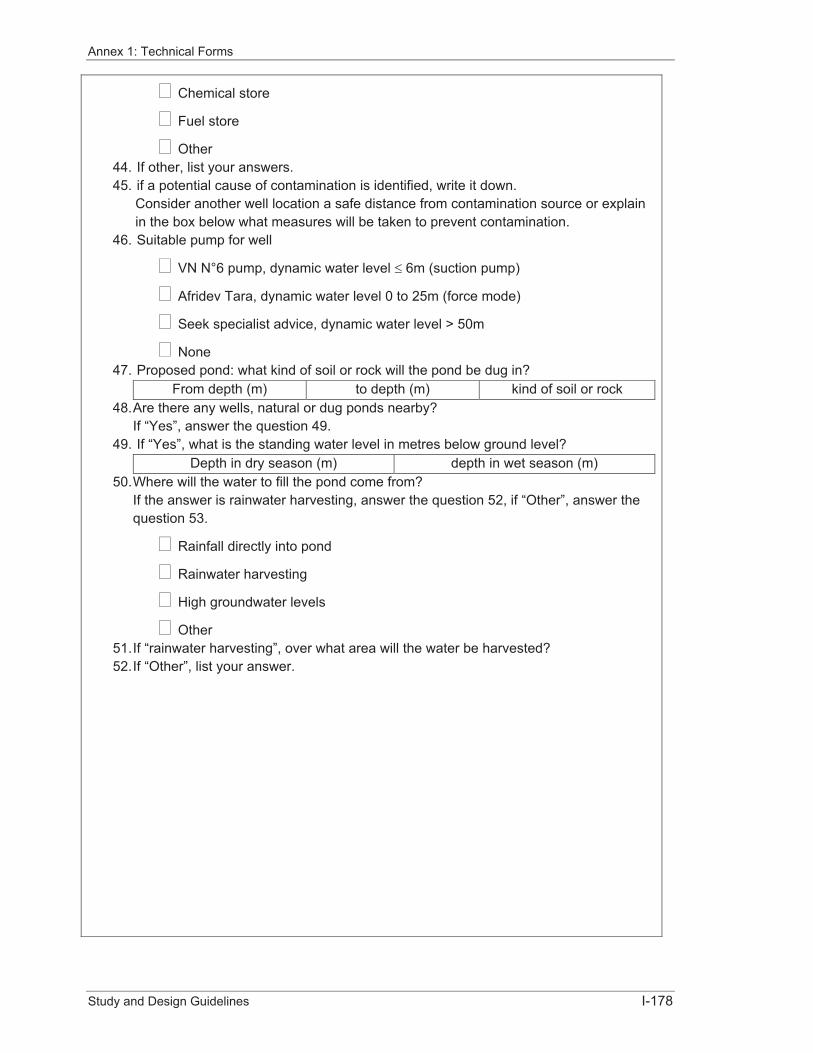
Annex 1: Technical Forms
Study and Design Guidelines I-178
� Chemical store
� Fuel store
� Other44. If other, list your answers. 45. if a potential cause of contamination is identified, write it down.
Consider another well location a safe distance from contamination source or explain in the box below what measures will be taken to prevent contamination.
46. Suitable pump for well
� VN N°6 pump, dynamic water level � 6m (suction pump)
� Afridev Tara, dynamic water level 0 to 25m (force mode)
� Seek specialist advice, dynamic water level > 50m
� None47. Proposed pond: what kind of soil or rock will the pond be dug in?
From depth (m) to depth (m) kind of soil or rock 48. Are there any wells, natural or dug ponds nearby?
If “Yes”, answer the question 49. 49. If “Yes”, what is the standing water level in metres below ground level?
Depth in dry season (m) depth in wet season (m) 50. Where will the water to fill the pond come from?
If the answer is rainwater harvesting, answer the question 52, if “Other”, answer the question 53.
� Rainfall directly into pond
� Rainwater harvesting
� High groundwater levels
� Other51. If “rainwater harvesting”, over what area will the water be harvested? 52. If “Other”, list your answer.

Annex 1: Technical Forms
Study and Design Guidelines I-179
Technical Form T41 – Education Facility Form T41 Education Province : District : S/C:Name of project : Code of S/C : Name of TSO : Date of form preparation :
1. Location: where is the education facility located within the Sangkat/Commune? Describe the location of education facility.
2. Provide the coordinates of GPS * Coordinate of school location
X of GPS Y of GPS 3. List the number and length of the proposed facility.
* Rooms of the new school, list the number of room. Furniture: list the number of set of chairs and tables. Primary school, training room, library, school dormitory, school yard, list the number of place. List the length of school wall and school fence in meters.
4. Information about education requirement: (about students) How many students will use the school and which village will they come from?
Name of village Number of children go to the school
distance from village to school in kilometers
5. Total number of children goes to the school. 6. About the number of classroom.
How many classrooms on the site now? 7. About the number of teachers
teachers provided by the education department
teachers will be hired for the school
Total number of teachers available
8. About the school management: is there a school parent’ committee?
� Yes
� No9. Physical characteristics of the site: does the site ever flood in the wet season?
* if “Ever”, answer the two following questions.
� Ever
� Never 10. What is the maximum depth of flooding in meters? 11. What type of flooding?
� Seasonal flooding and prolonged by the high river level
� Short periods of flooding following heavy rain 12. Is the site free of mines and UXO?
* if “Yes”, answer the following question.
� Yes
� No13. Does land title exist for the site?
* If “Yes”, answer the following questions.
� Yes
� No

Annex 1: Technical Forms
Study and Design Guidelines I-180
14. What stage is the documentation (district, province…)? 15. Is the site presently occupied?
* If “Yes”, answer the following questions
� Yes
� No16. Whom or what? (E.g. building, rice field and will compensation be
expected/demanded?)17. Is the site presently walled or fenced?
� Yes
� No18. Will land fill or embankments be needed to protect against flooding?
* If “Yes”, answer the question 19
� Yes
� No19. If “Yes”, describe it. 20. Is there enough space for students to play sports?
� Yes
� No21. Is there enough space to build more classrooms in the future?
� Yes
� No22. What is the water supply at the site?
* If “Pond” or “Pumping well”, answer the following question
� None
� Pond
� Pumping well
� Piped supply from off site 23. Write down the dry season water level below ground (m) 24. How many existing latrines at the sites? 25. Foundation soils: (for school building construction, school fence and walls)
What kind of soil will the school be constructed on? * Type of soil: gravel, silty sand, micaceous sand, lateritic sand, clayey sand, loams, organic clays, lateritic clays, dandy, silty or clayey peats.
Numberof trial pit
X of GPS
Y of GPS
Depth (m) Type of soil
group of soil
26. DCP test (mm/blow) DCP (mm/blow) X of GPS Y of GPS
27. 20 percentile of DCP (mm/blow)�
�

Annex 1: Technical Forms
Study and Design Guidelines I-181
Technical Form T51 – Health Form T51 Health
Province : District : S/C:Name of project : Code of S/C : Name of TSO : Date of form preparation :
1. Location: where is the health facility located within the Sangkat/Commune? Next to the commune centre, in Phsar Leu market
2. Provide the coordinates of GPS * First line is the starting point; last line is the ending point
X of GPS Y of GPS 3. List the number and length of output chosen.
* Fence in meter, and other output in number. 4. Information about health facility: how many people will use the health facility and
which villages will they come from? * Copy the total number of people from the Project Information Form.
5. How many trained staff will be provided by the health department? 6. How many staff will be hired for the health facility? 7. What is the total number of staff available?
* totalize both numbers above. 8. Physical characteristics of the site: does the site ever flood in the wet season?
* if “Ever”, answer the following questions.
� Ever
� Never 9. If “Ever”, what is the maximum depth of flooding in meters? 10. If “Ever”, what type of flooding?
� Seasonal and prolonged flooding from high river levels.
� Short periods of flooding following heavy rain. 11. Is the site free of mines and UXO?
� Yes
� No12. Does land title exist for the site? If yes, at what stage is the documentation (district,
province…)13. Is the site presently occupied? If yes, list them.
* e.g. building, rice field… will compensation be expected/demanded? 14. Is the site presently walled or fenced?
� Yes
� No15. Will land fill or embankments be needed to protect against flooding?
� Yes
� No16. What is the water supply at the site?
� None
� Pond

Annex 1: Technical Forms
Study and Design Guidelines I-182
� Pumping well
� Piped supply from off site 17. How many existing latrines at the site? 18. Foundation soils: what kind of soil will the health facility be constructed on?
* Kind of soil: gravel, silty sand, micaceous sand, lateritic sand, clayey sand, loams, clayey silts, organic silts, micaceous silts, sandy clays, silty clays, organic clays, sandy; silty or clayey peats.
Numberof trial pit
X of GPS
Y of GPS
Depth (m) Type of soil
group of soil
19. Foundation strength DCP Test (mm/blow). DCP (mm/blow) X of GPS Y of GPS
20. 20 percentile of DCP (mm/blow) ?
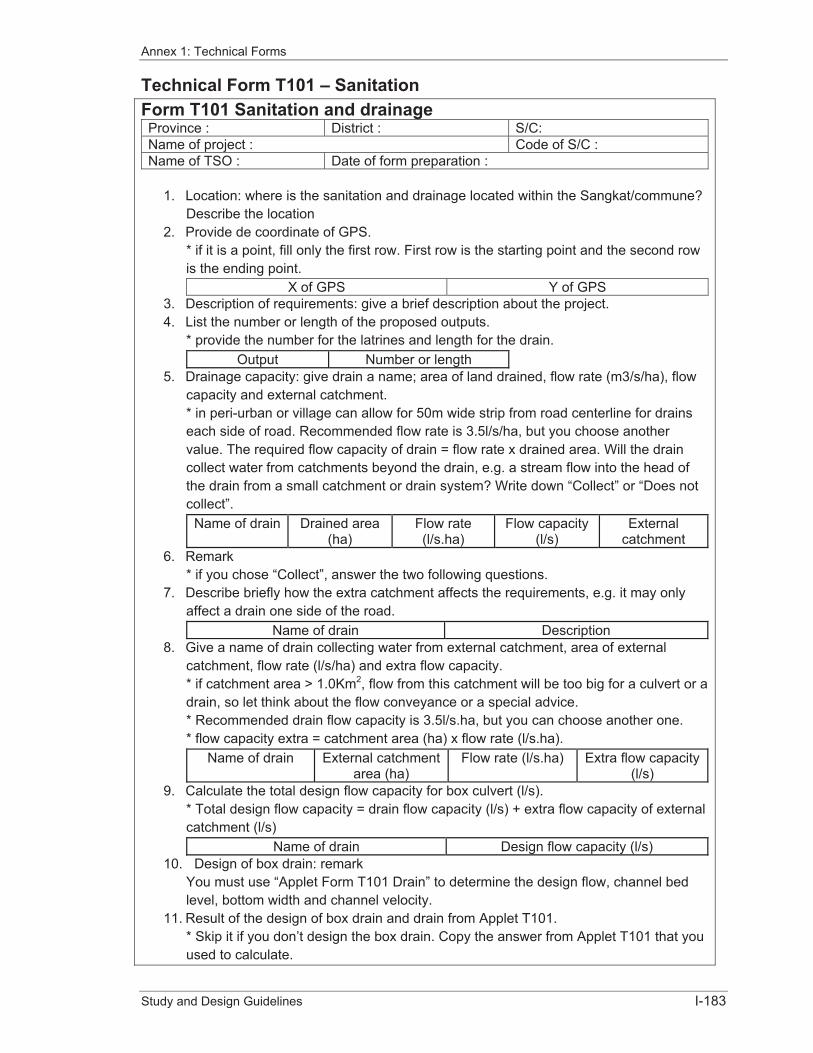
Annex 1: Technical Forms
Study and Design Guidelines I-183
Technical Form T101 – Sanitation Form T101 Sanitation and drainage Province : District : S/C:Name of project : Code of S/C : Name of TSO : Date of form preparation :
1. Location: where is the sanitation and drainage located within the Sangkat/commune? Describe the location
2. Provide de coordinate of GPS. * if it is a point, fill only the first row. First row is the starting point and the second row is the ending point.
X of GPS Y of GPS 3. Description of requirements: give a brief description about the project. 4. List the number or length of the proposed outputs.
* provide the number for the latrines and length for the drain. Output Number or length
5. Drainage capacity: give drain a name; area of land drained, flow rate (m3/s/ha), flow capacity and external catchment. * in peri-urban or village can allow for 50m wide strip from road centerline for drains each side of road. Recommended flow rate is 3.5l/s/ha, but you choose another value. The required flow capacity of drain = flow rate x drained area. Will the drain collect water from catchments beyond the drain, e.g. a stream flow into the head of the drain from a small catchment or drain system? Write down “Collect” or “Does not collect”.
Name of drain Drained area (ha)
Flow rate (l/s.ha)
Flow capacity (l/s)
Externalcatchment
6. Remark * if you chose “Collect”, answer the two following questions.
7. Describe briefly how the extra catchment affects the requirements, e.g. it may only affect a drain one side of the road.
Name of drain Description 8. Give a name of drain collecting water from external catchment, area of external
catchment, flow rate (l/s/ha) and extra flow capacity. * if catchment area > 1.0Km2, flow from this catchment will be too big for a culvert or a drain, so let think about the flow conveyance or a special advice. * Recommended drain flow capacity is 3.5l/s.ha, but you can choose another one. * flow capacity extra = catchment area (ha) x flow rate (l/s.ha).
Name of drain External catchment area (ha)
Flow rate (l/s.ha) Extra flow capacity (l/s)
9. Calculate the total design flow capacity for box culvert (l/s). * Total design flow capacity = drain flow capacity (l/s) + extra flow capacity of external catchment (l/s)
Name of drain Design flow capacity (l/s) 10. Design of box drain: remark
You must use “Applet Form T101 Drain” to determine the design flow, channel bed level, bottom width and channel velocity.
11. Result of the design of box drain and drain from Applet T101. * Skip it if you don’t design the box drain. Copy the answer from Applet T101 that you used to calculate.
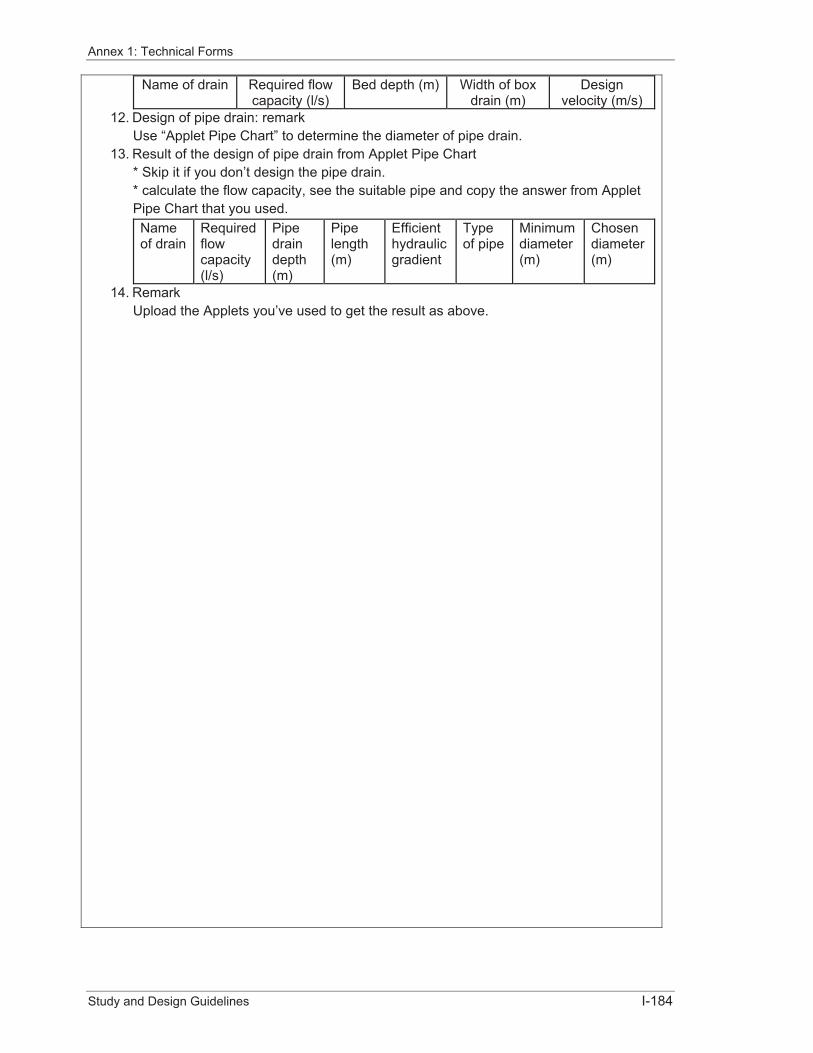
Annex 1: Technical Forms
Study and Design Guidelines I-184
Name of drain Required flow capacity (l/s)
Bed depth (m) Width of box drain (m)
Designvelocity (m/s)
12. Design of pipe drain: remark Use “Applet Pipe Chart” to determine the diameter of pipe drain.
13. Result of the design of pipe drain from Applet Pipe Chart * Skip it if you don’t design the pipe drain. * calculate the flow capacity, see the suitable pipe and copy the answer from Applet Pipe Chart that you used. Nameof drain
Requiredflowcapacity(l/s)
Pipedraindepth(m)
Pipelength(m)
Efficienthydraulicgradient
Typeof pipe
Minimum diameter(m)
Chosendiameter(m)
14. Remark Upload the Applets you’ve used to get the result as above.