Embed Size (px)
Citation preview
Copyright Jonathan Koomey 2007 1
A Reactor-Level Analysis ofBusbar Costs for U.S. Nuclear
Plants, 1970-2005Jonathan G. Koomey* and Nathan Hultman***Staff Scientist, Lawrence Berkeley National Laboratory
and Consulting Professor, Stanford University**Assistant Professor, Georgetown UniversityPresented by Koomey at DTE, in Detroit, MI
April 17, [email protected]://www.koomey.com
Copyright Jonathan Koomey 2007 2
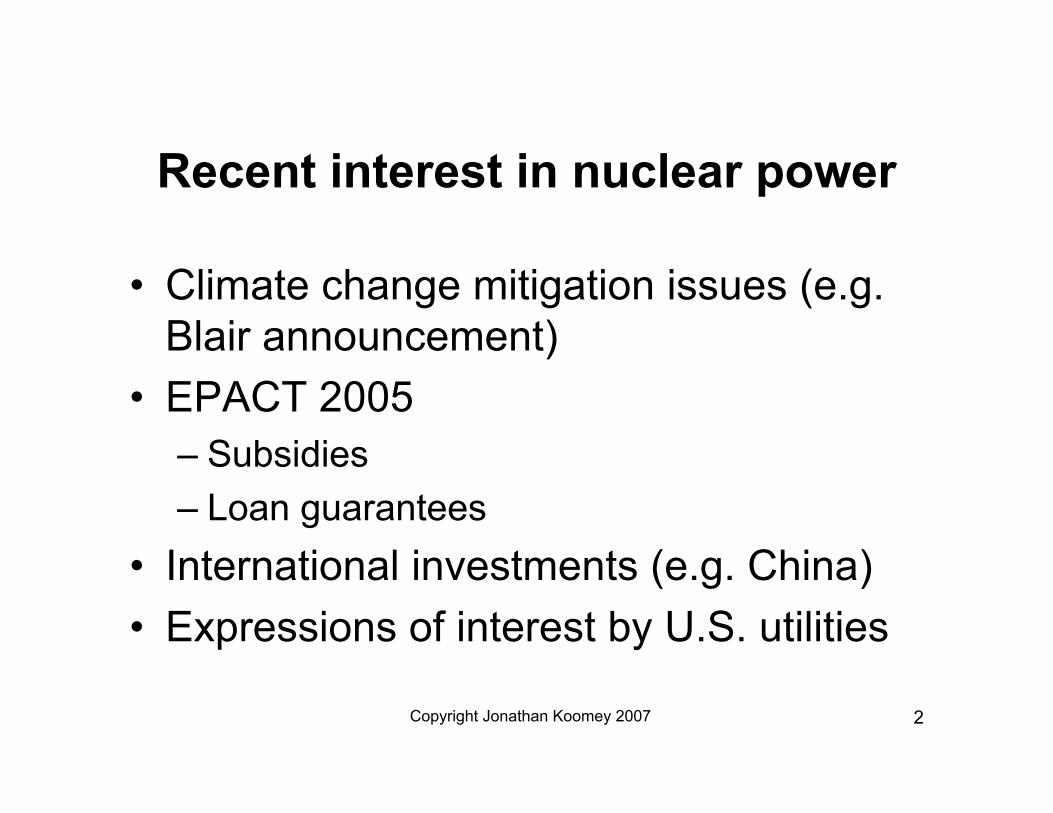
Recent interest in nuclear power
• Climate change mitigation issues (e.g.Blair announcement)
• EPACT 2005– Subsidies– Loan guarantees
• International investments (e.g. China)• Expressions of interest by U.S. utilities
Copyright Jonathan Koomey 2007 3
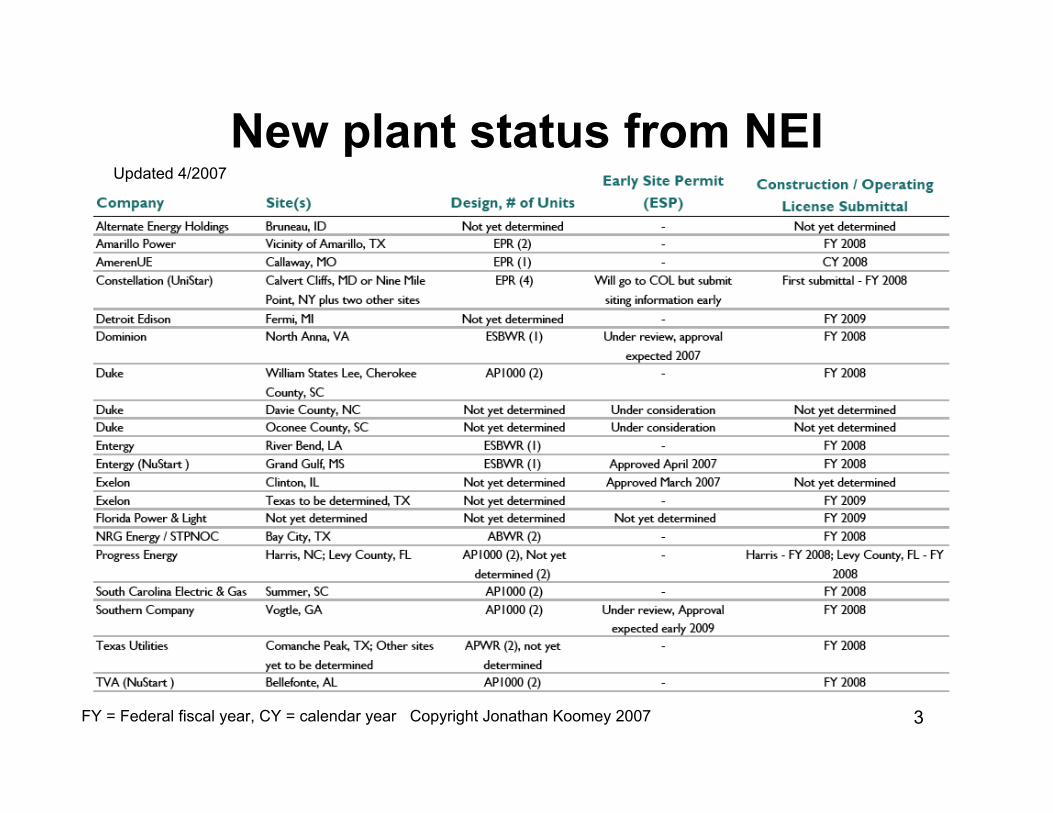
New plant status from NEIUpdated 4/2007
FY = Federal fiscal year, CY = calendar year

Copyright Jonathan Koomey 2007 4
Goals of this work
• Creating fair, accurate, and comparablehistorical cost estimates
• Explaining history using limiting cases andstatistics
• Comparing historical cost estimates to recentprojections of nuclear costs
• Characterizing mistakes to avoid if nuclearpower is to undergo a rebirth in the U.S.
Copyright Jonathan Koomey 2007 5
Status of work• Hultman, Nathan E., Jonathan Koomey, and Dan
Kammen. 2007. "What history can teach us about thefuture costs of nuclear power." Environmental Science &Technology. vol. 41, no. 7. April 1. pp. 2088-2093.
• Koomey, Jonathan, and Nate Hultman. 2007. "A reactor-level analysis of busbar costs for U.S. nuclear plants,1970-2005." Energy Policy (accepted, under revision).January.
• Hultman, Nathan E., and Jonathan G. Koomey. 2007."Energy technology costs and public support for R&D:Accounting for surprise by disentangling uncertainties."Submitted to Environmental Research Letters. April 15.

Copyright Jonathan Koomey 2007 6
The Generations of Nuclear Energy
Source: DOE Generation IV Project

Copyright Jonathan Koomey 2007 7
Status of new reactor designs
Source: Energy Information Administration, “New Reactor Designs”.http://www.eia.doe.gov/cneaf/nuclear/page/analysis/nucenviss2.html
Copyright Jonathan Koomey 2007 8
Previous studies• Komanoff• Rothwell• EIA (Hewlett)• Zimmerman• Navarro• Marshall• Many others
Copyright Jonathan Koomey 2007 9
Focus on direct costs• Capital costs• Construction duration• Interest• Capacity factors• Heat rates• O&M costs• Fuel costs• Incremental capital additions• Waste disposal• Decommissioning

Copyright Jonathan Koomey 2007 10
Some costs not included• Taxes (these are transfer payments)• Waste disposal costs beyond the 0.1
¢/kWh current fee (uncertainties onYucca Mountain)
• Externalities (e.g. accident risks beyondthose covered by insurance), routineradiation emissions (generally small)
• Subsidies

Copyright Jonathan Koomey 2007 11
Why levelized costs?
• ¢/kWh a common metric for comparingsupply and demand-side technologies
• Just analyzing capital costs ignoresother big effects (eg. ∆ capacity factors)
• Collapsing the time dimension can yielduseful insights
Copyright Jonathan Koomey 2007 12
Levelization method
• Calculate present value of some futureexpenditure or stream of expendituresusing the real discount rate (e.g.decommissioning 40 years hence)
• Annualize that present value using thecapital recovery factor over the reactorlifetime (generally 40 years) to get thelevelized cost
Copyright Jonathan Koomey 2007 13
Weaknesses of levelized costs
• Method depends somewhat on forecasts– less accurate for reactors completed most recently
• Method submerges discontinuous events– long periods of a reactor being off-line– rapid changes in O&M costs or capacity factors
• Levelized cost figures often are comparedinconsistently to other ¢/kWh numbers
Copyright Jonathan Koomey 2007 14
Methods• Calculate costs at the reactor level
– Discount rate = 6% real– Use reactor specific data when possible
• Capital costs• Construction duration• Capacity factors• O&M (needs improvement)• Decommissioning (split by PWR vs. BWR)
– Use averages when necessary• Fuel costs• Incremental capital additions (better if by reactor)• Waste disposal
Copyright Jonathan Koomey 2007 15
Key data sources
• Capital costs: Komanoff (except 4 reactors)• Construction duration: Komanoff• Interest: Avg US electric utility ROI 1971-2001• Capacity factors: Komanoff, IAEA• Heat rates: NEI• O&M (fixed and variable): NEI, EIA• Fuel: EIA• Incremental capital additions: EIA• Waste disposal: MIT• Decommissioning: OECD
Copyright Jonathan Koomey 2007 16
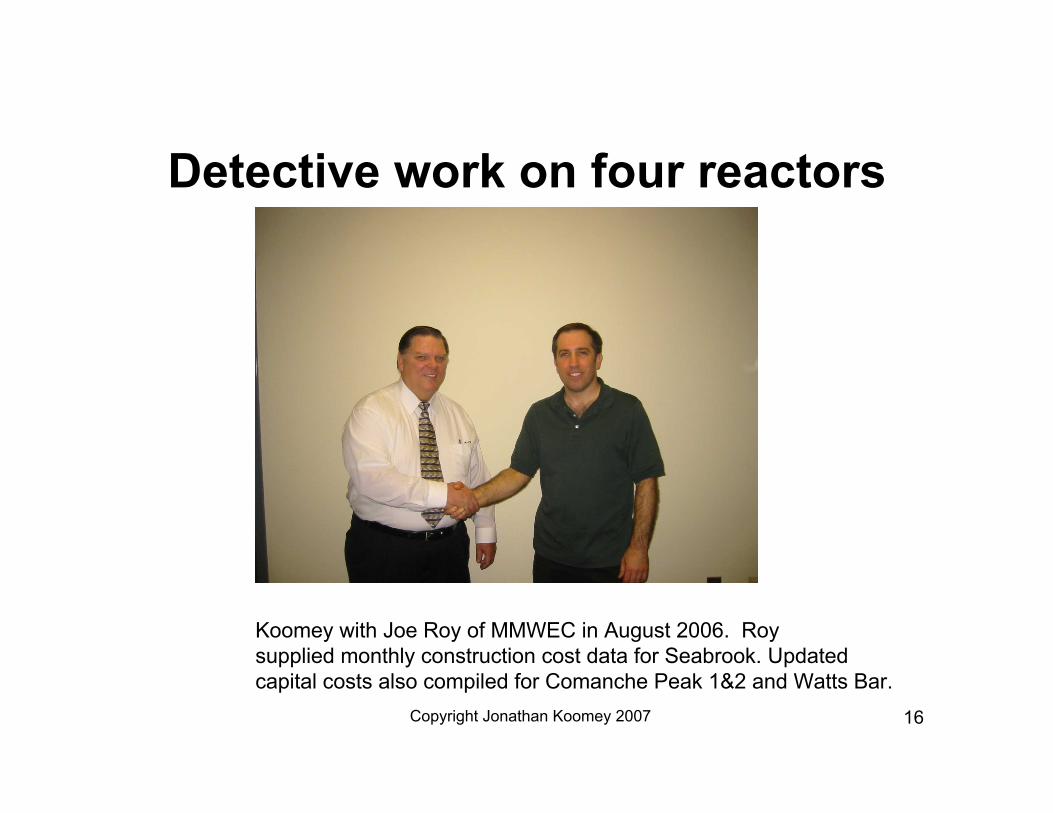
Detective work on four reactors
Koomey with Joe Roy of MMWEC in August 2006. Roysupplied monthly construction cost data for Seabrook. Updatedcapital costs also compiled for Comanche Peak 1&2 and Watts Bar.
Copyright Jonathan Koomey 2007 17
Results• Key components of total levelized costs
– Installed costs– Capacity factors– Total O&M costs– Construction duration– Capacity
• Total levelized busbar costs– Over time and rank ordered
• Comparison with current projections

Copyright Jonathan Koomey 2007 18
Large increases in installed capitalcosts for plants completed >1982Installed costs include 6%/yr real interest during construction

Copyright Jonathan Koomey 2007 19
Projected installed costs are at themid-to low end of historical costs
Copyright Jonathan Koomey 2007 20
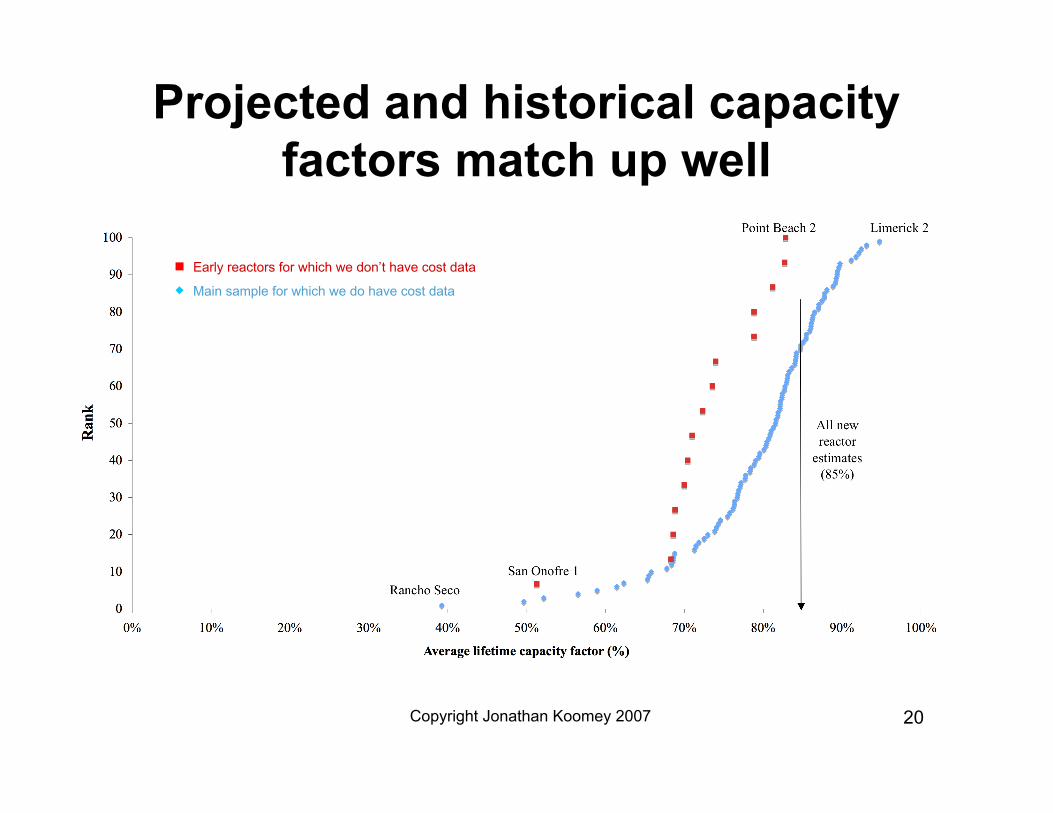
Projected and historical capacityfactors match up well
Early reactors for which we don’t have cost data
Main sample for which we do have cost data

Copyright Jonathan Koomey 2007 21
Operational improvements led tohigher capacity factors for all plants
Copyright Jonathan Koomey 2007 22
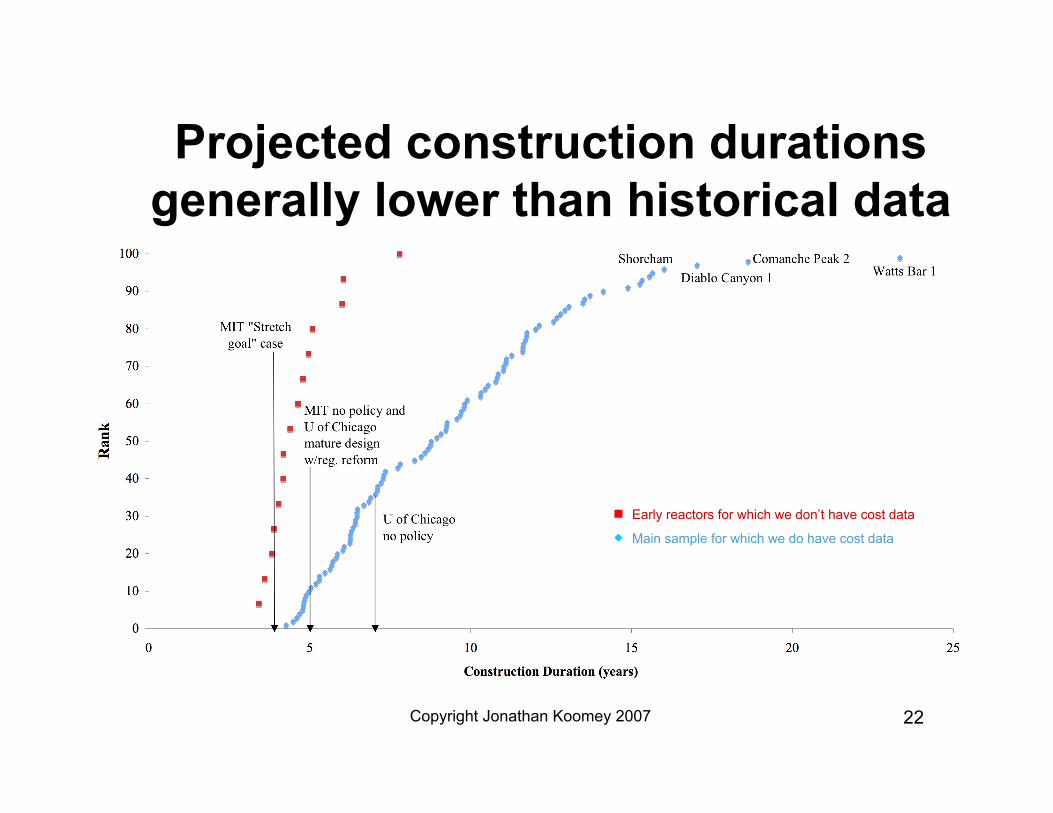
Projected construction durationsgenerally lower than historical data
Early reactors for which we don’t have cost data
Main sample for which we do have cost data
Copyright Jonathan Koomey 2007 23
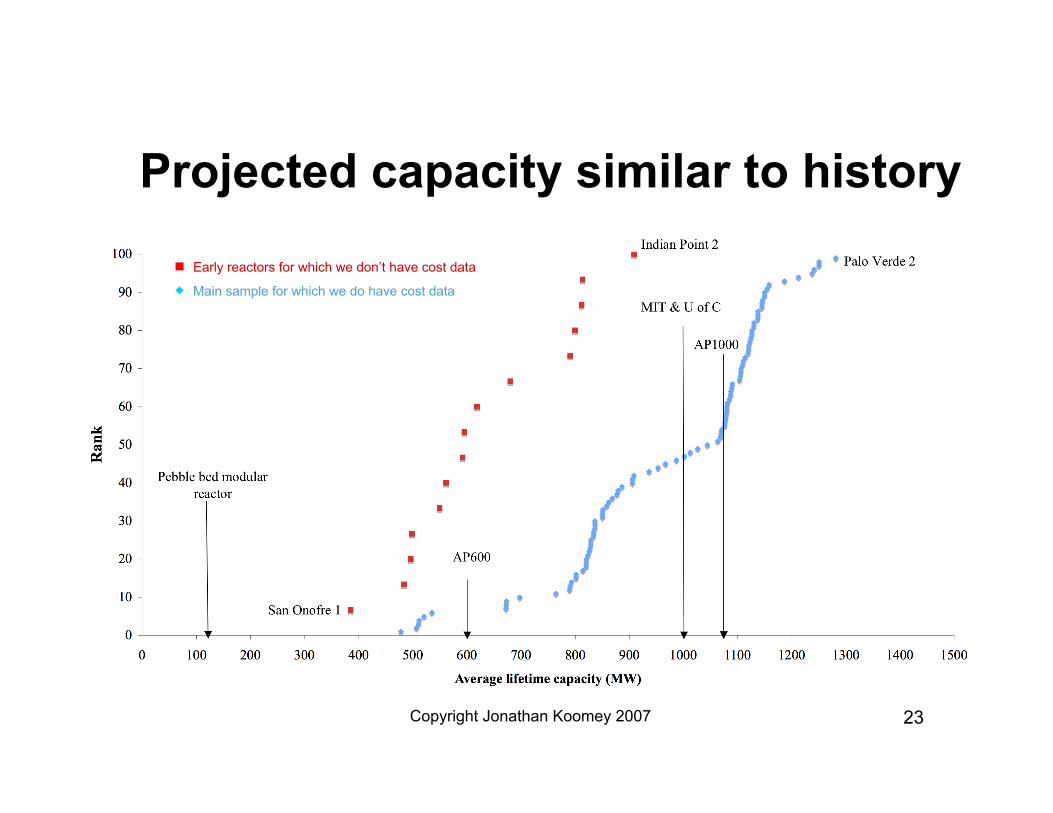
Projected capacity similar to history
Early reactors for which we don’t have cost data
Main sample for which we do have cost data

Copyright Jonathan Koomey 2007 24
Projected O&M costs generallylower than historical experience

Copyright Jonathan Koomey 2007 25
Total levelized costs by date offirst operation

Copyright Jonathan Koomey 2007 26
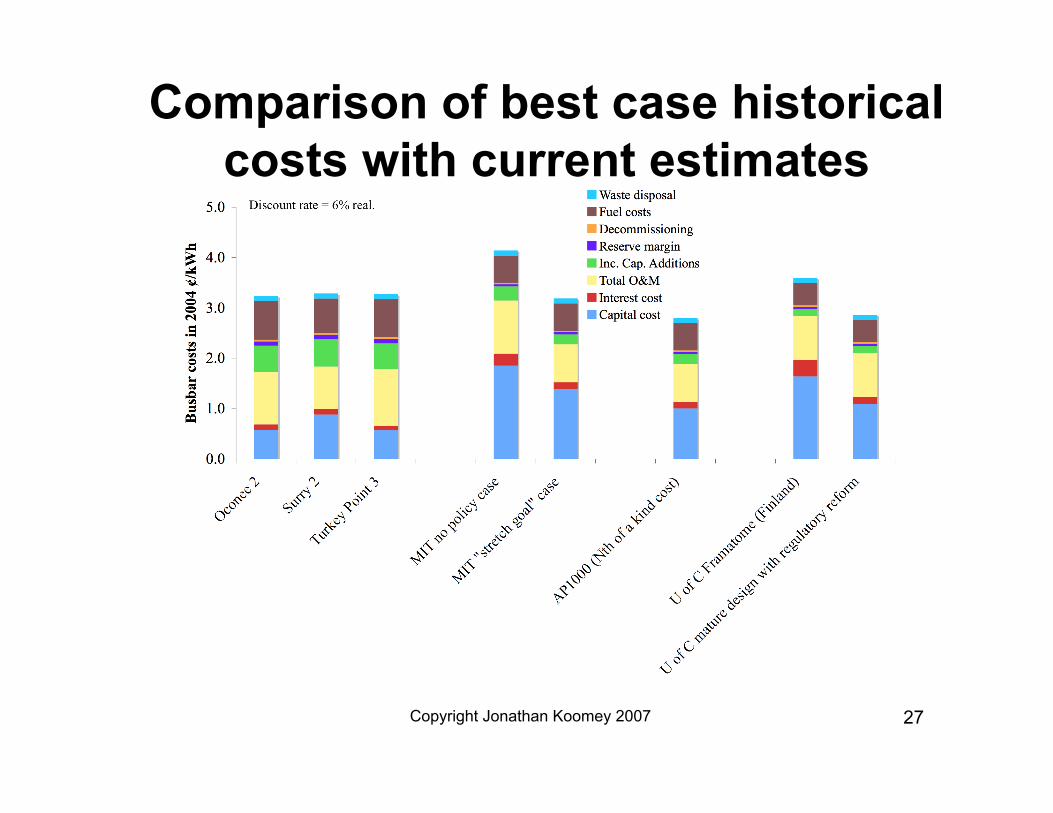
Projected busbar costs/kWh lowerthan most historical experience
Copyright Jonathan Koomey 2007 27
Comparison of best case historicalcosts with current estimates

Copyright Jonathan Koomey 2007 28
Implications for new reactors?• Advocates for new plants say “So what? New
plants are totally different from the old ones”– Need to prove this assertion by actually
building plants cheaply• Some lessons have already been learned
– Streamline licensing– Standardize designs– Operate plants more effectively
• IT for construction management and operationsmuch more sophisticated now
• International experience accumulating

Copyright Jonathan Koomey 2007 29
Opportunities for a nuclear revival• Interest driven by
– Tax credits/R&D– Need for reductions in
• Greenhouse gas reductions• Imported oil (need electric vehicles)
– International markets• Much improved
– Technology– Design– Management– Construction processes– Licensing
Copyright Jonathan Koomey 2007 30
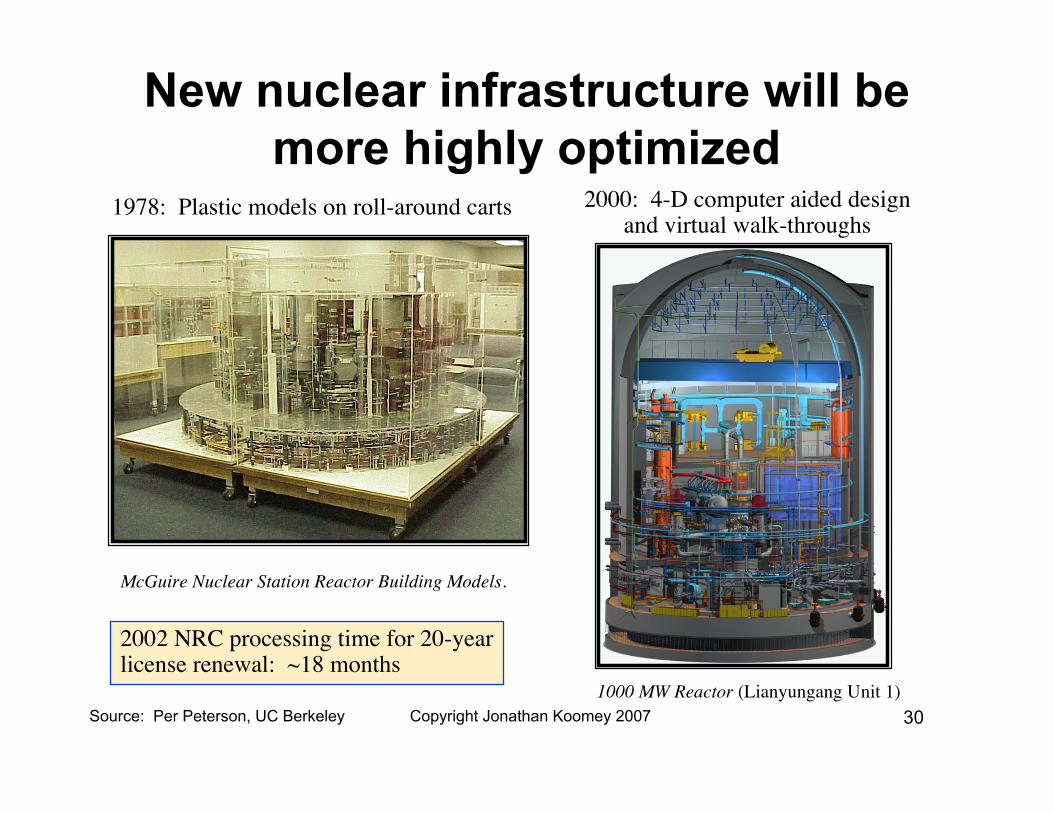
New nuclear infrastructure will bemore highly optimized
McGuire Nuclear Station Reactor Building Models.
1000 MW Reactor (Lianyungang Unit 1)
1978: Plastic models on roll-around carts 2000: 4-D computer aided designand virtual walk-throughs
2002 NRC processing time for 20-yearlicense renewal: ~18 months
Source: Per Peterson, UC Berkeley
Copyright Jonathan Koomey 2007 31
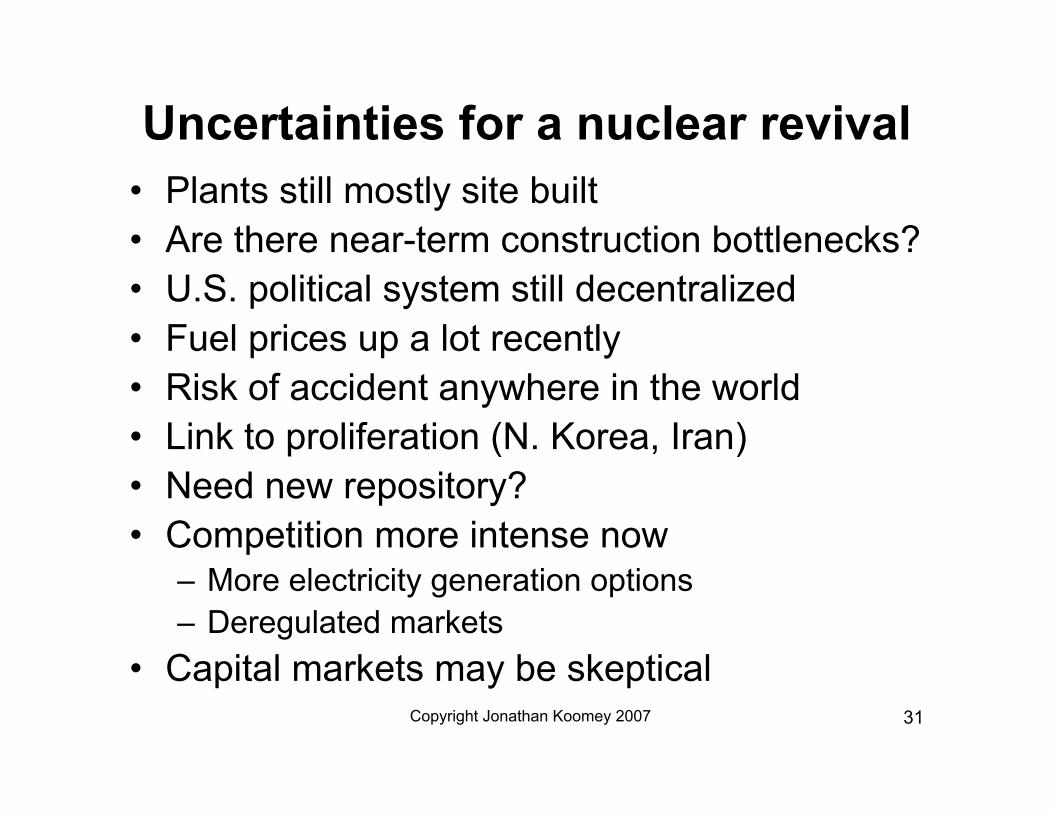
Uncertainties for a nuclear revival• Plants still mostly site built• Are there near-term construction bottlenecks?• U.S. political system still decentralized• Fuel prices up a lot recently• Risk of accident anywhere in the world• Link to proliferation (N. Korea, Iran)• Need new repository?• Competition more intense now
– More electricity generation options– Deregulated markets
• Capital markets may be skeptical

Copyright Jonathan Koomey 2007 32
Spot prices for Uranium Up!
$113/lb inearlyApril 2007

Copyright Jonathan Koomey 2007 33
Advice on evaluating projectedcosts for new reactors
• Compare apples to apples ($/kW)– Inflation adjustment– 1st of a kind vs. Nth of a kind– One vs. two reactors on a site– Full reactor costs vs. power block
• Beware of– Possible certification delays– Lack of specificity of possible bottlenecks– Lack of real world experience in construction
• Check modularization and parts counts• DTE: First mover or fast follower?
Copyright Jonathan Koomey 2007 34
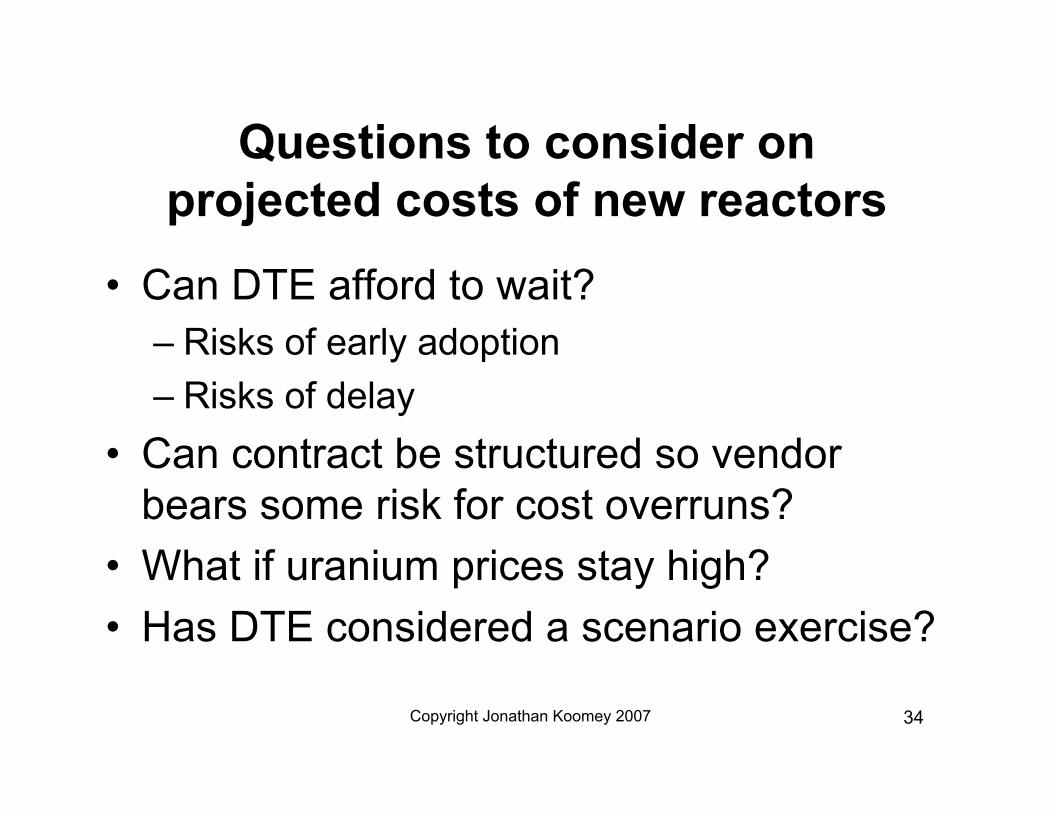
Questions to consider onprojected costs of new reactors
• Can DTE afford to wait?– Risks of early adoption– Risks of delay
• Can contract be structured so vendorbears some risk for cost overruns?
• What if uranium prices stay high?• Has DTE considered a scenario exercise?

Copyright Jonathan Koomey 2007 35
Comparing projected costs for othernew reactors (EPR, ABWR, ESBWR)
ESBWRABWR
ABWR

Copyright Jonathan Koomey 2007 36
Future work• Improved reactor by reactor O&M costs,
forced outage rates, and incremental capitaladditions (sources?)
• Statistical analysis and development oflimiting cases (e.g., pairing of examplereactors).
• Compare cost estimates for site-built andmass produced technologies– is more cost variability guaranteed for site-built
technologies?– How can cost variability be minimized?
• International comparisons

Copyright Jonathan Koomey 2007 37
Conclusions• Just examining capital costs gives an
incomplete picture of historical developments• Reactor size interacted with regulatory delays
and slowing electricity demand growth,affecting capital costs, financing costs, O&Mcosts (and perhaps capacity factors)
• Projected capital costs, O&M costs, andconstruction durations are low compared tohistorical experience (but may still be correct)

Copyright Jonathan Koomey 2007 38
Conclusions (continued)
• Larger, more sophisticated operatorshave been able to increase capacityfactors and reduce O&M costs
• Key uncertainty is whether theregulatory and technical changesimplemented thus far are enough toresult in real reductions in installedcosts and construction duration

Copyright Jonathan Koomey 2007 39
EXTRA SLIDES

Copyright Jonathan Koomey 2007 40
Another look at total busbar costs
PWR=Pressurized water reactor,BWR=Boiling water reactor. Cohortindicates one of eight predictive costcategories described by Rothwell :Category 1 denotes Westinghouse PWR< 700 MW; Category 2 = WestinghousePWR 700-1000 MW; Category 3 =Westinghouse PWR>1000 MW;Category 4 = Babcock & Wilcox PWR;Category 5 = Combustion EngineeringPWR; Category 6 = General ElectricBWR < 700 MW; Category 7 = GEBWR 700-1000 MW; Category 8 = GEBWR > 1000 MW. Levelized costs(which exclude subsidies andexternalities) are calculated using a realdiscount rate of 6% as described inonline supplemental material.

Copyright Jonathan Koomey 2007 41
Total levelized costs vs. capacity

Copyright Jonathan Koomey 2007 42
For plants started > 1968 (with oneexception), capacity was ≥ 800 MW
Early reactors for which we don’t have cost data
Main sample for which we do have cost data
Copyright Jonathan Koomey 2007 43
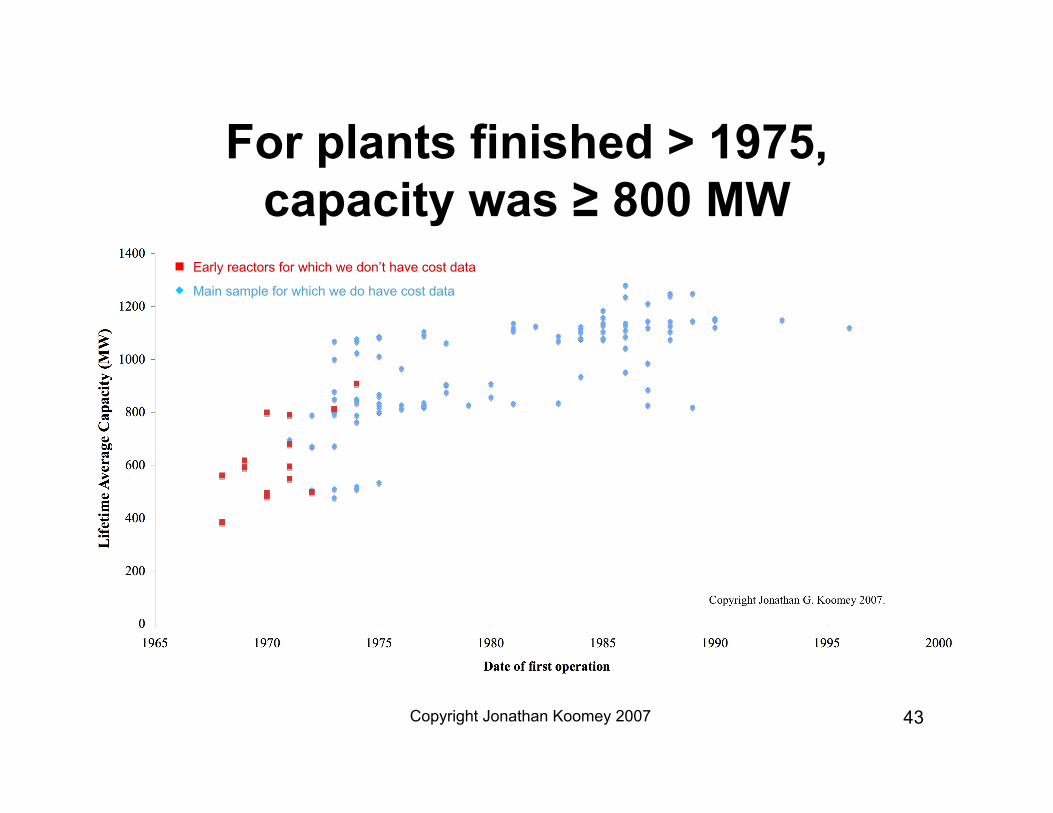
For plants finished > 1975,capacity was ≥ 800 MW
Early reactors for which we don’t have cost data
Main sample for which we do have cost data
Copyright Jonathan Koomey 2007 44
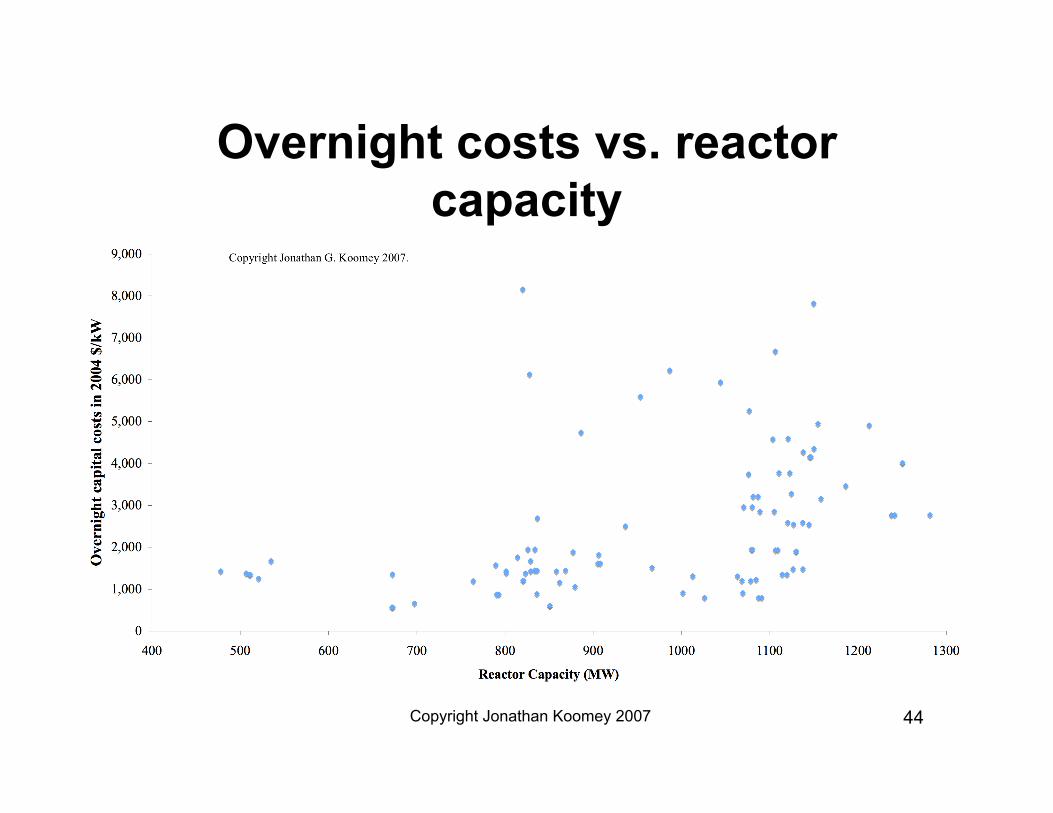
Overnight costs vs. reactorcapacity
Copyright Jonathan Koomey 2007 45
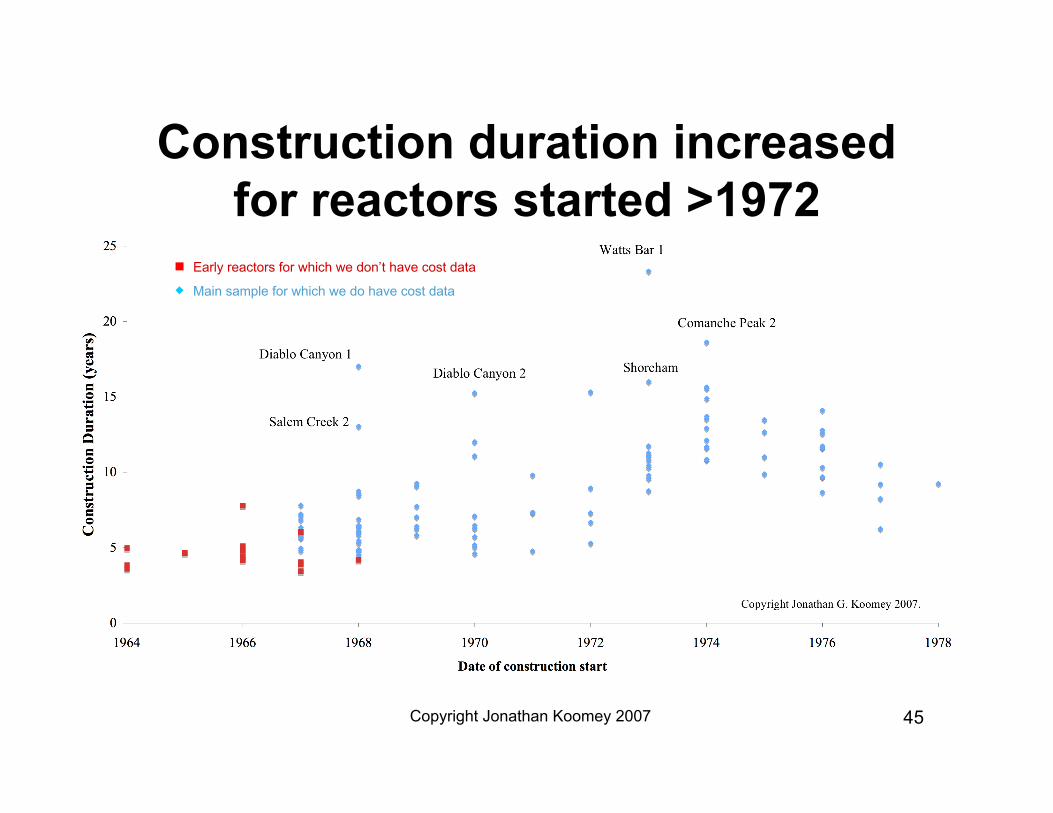
Construction duration increasedfor reactors started >1972
Early reactors for which we don’t have cost data
Main sample for which we do have cost data

Copyright Jonathan Koomey 2007 46
As reactor capacity became > 800 MW,construction duration varied more
Early reactors for which we don’t have cost data
Main sample for which we do have cost data

Copyright Jonathan Koomey 2007 47
U.S. average nuclear capacityfactors improved substantially after
1985

Copyright Jonathan Koomey 2007 48
Lifetime capacity factors have alsoimproved, partly due to retirements
Early reactors for which we don’t have cost data
Main sample for which we do have cost data
Copyright Jonathan Koomey 2007 49
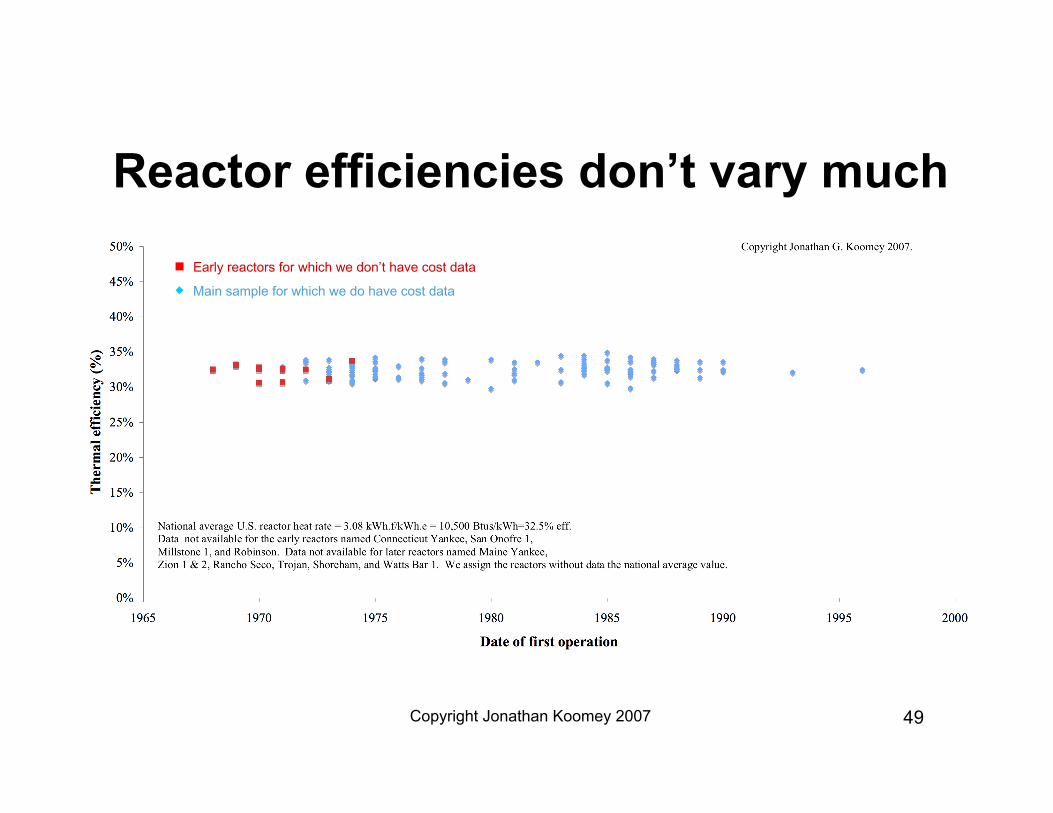
Reactor efficiencies don’t vary much
Early reactors for which we don’t have cost data
Main sample for which we do have cost data
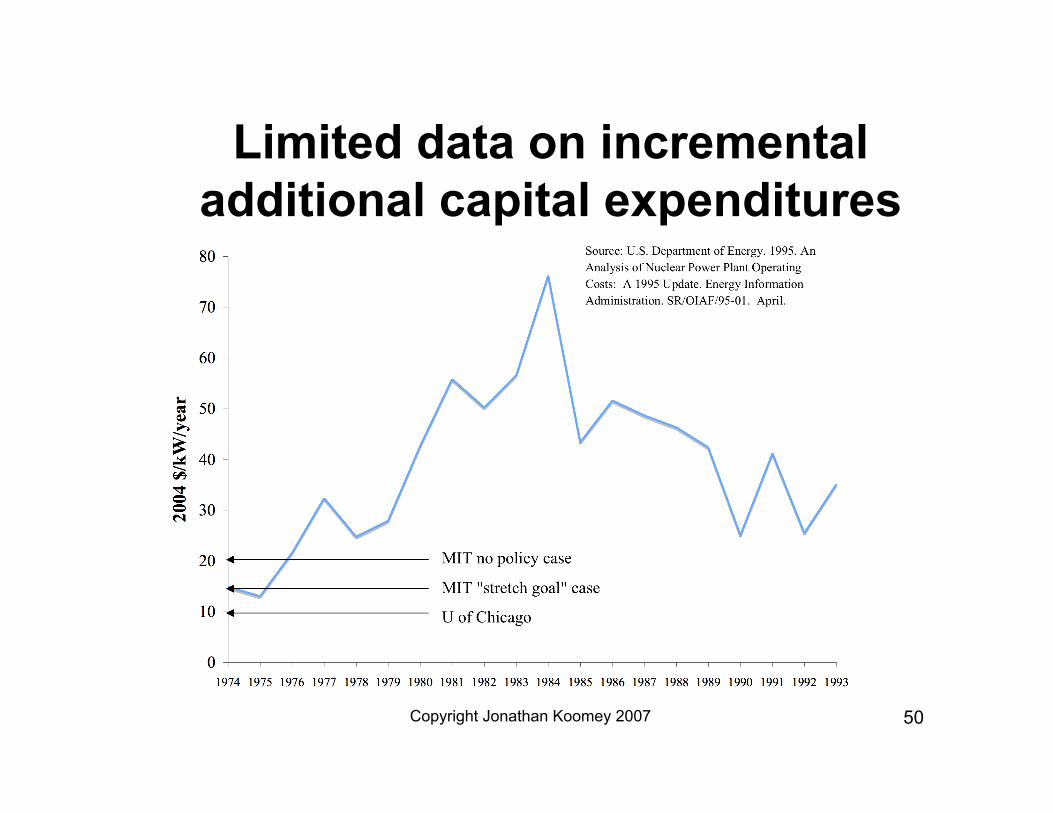
Copyright Jonathan Koomey 2007 50
Limited data on incrementaladditional capital expenditures

Copyright Jonathan Koomey 2007 51
Avg costs for O&M, fuel, and incrementalcapital additions vary over time
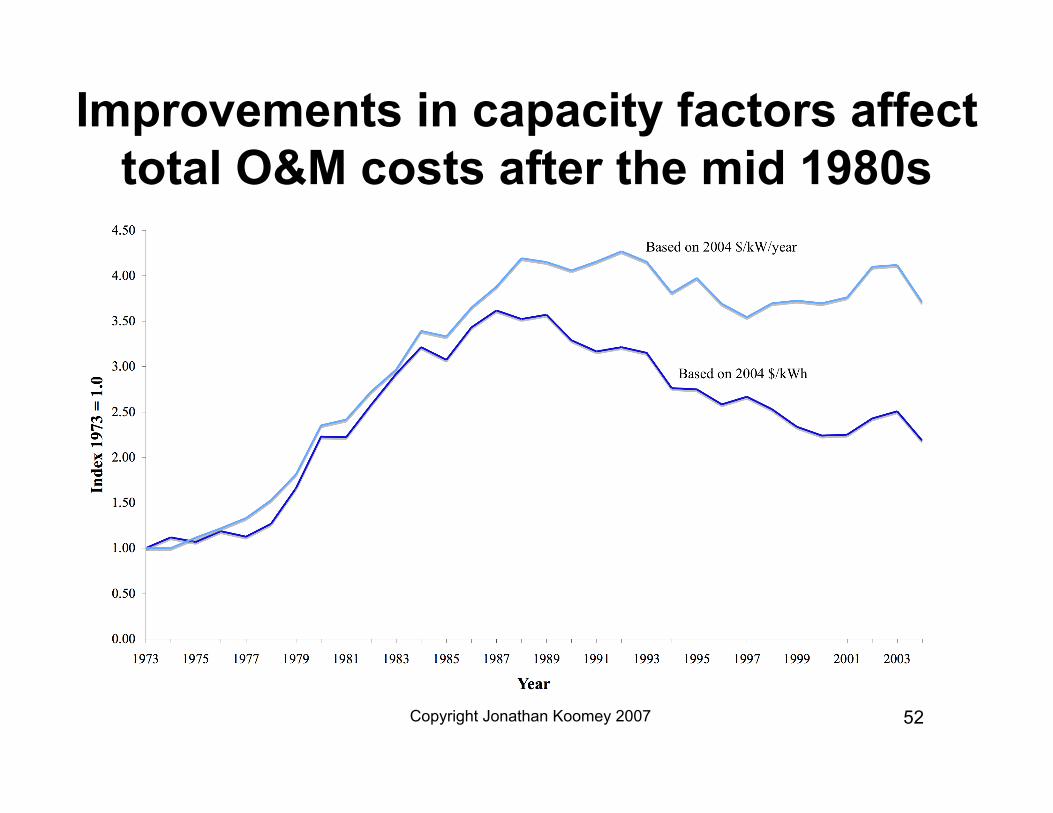
Copyright Jonathan Koomey 2007 52
Improvements in capacity factors affecttotal O&M costs after the mid 1980s

Copyright Jonathan Koomey 2007 53
Total O&M costs vary widely
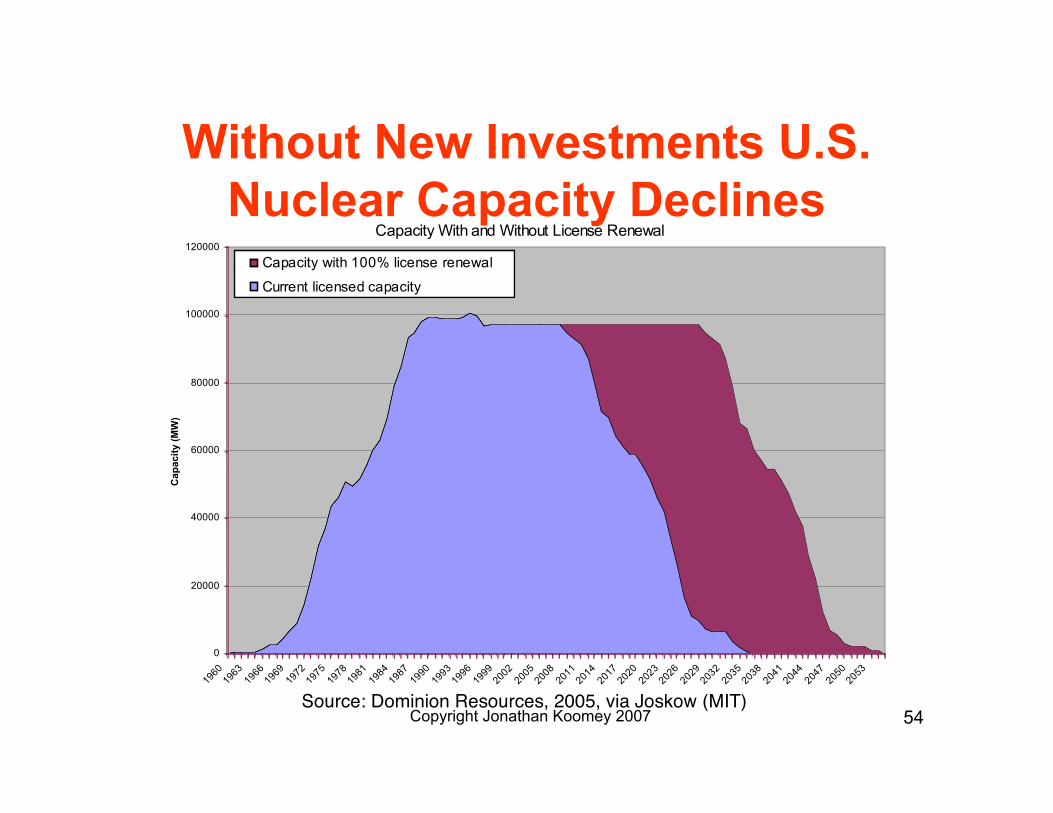
Copyright Jonathan Koomey 2007 54
Without New Investments U.S.Nuclear Capacity Declines
Capacity With and Without License Renewal
0
20000
40000
60000
80000
100000
120000
1960
1963
1966
1969
1972
1975
1978
1981
1984
1987
1990
1993
1996
1999
2002
2005
2008
2011
2014
2017
2020
2023
2026
2029
2032
2035
2038
2041
2044
2047
2050
2053
Cap
acit
y (
MW
)
Capacity with 100% license renewal
Current licensed capacity
Source: Dominion Resources, 2005, via Joskow (MIT)
Copyright Jonathan Koomey 2007 55
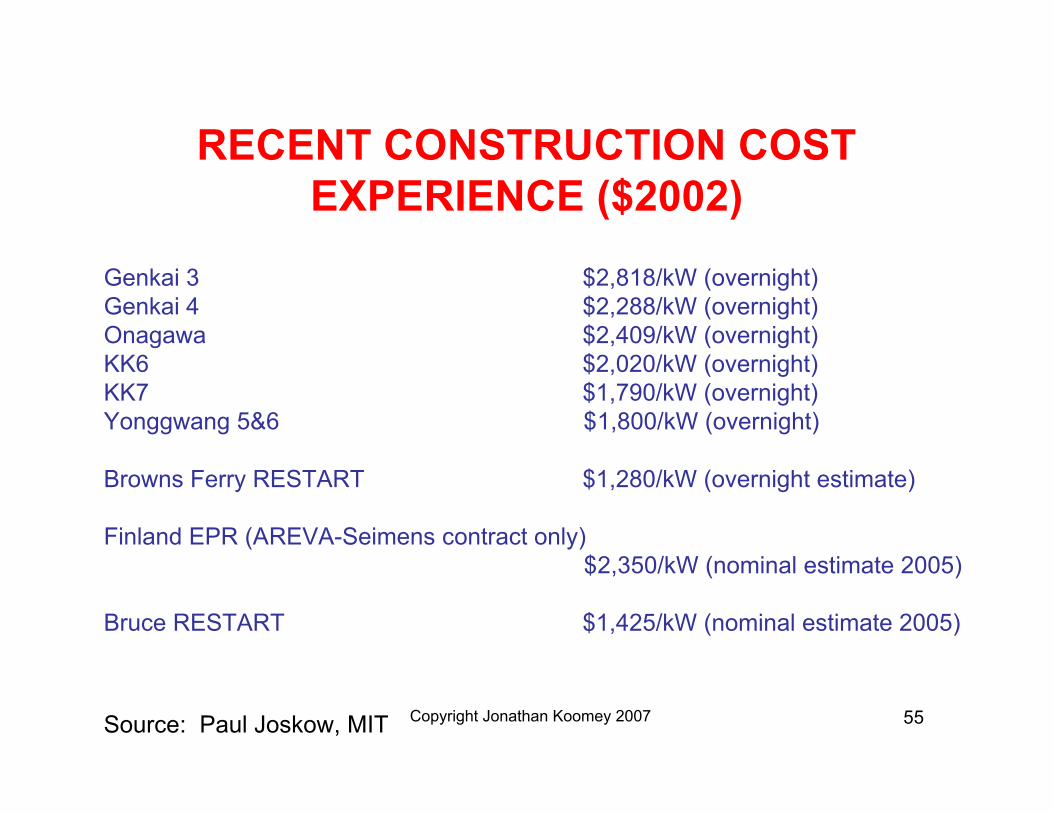
RECENT CONSTRUCTION COSTEXPERIENCE ($2002)
Genkai 3 $2,818/kW (overnight)Genkai 4 $2,288/kW (overnight)Onagawa $2,409/kW (overnight)KK6 $2,020/kW (overnight)KK7 $1,790/kW (overnight)Yonggwang 5&6 $1,800/kW (overnight)
Browns Ferry RESTART $1,280/kW (overnight estimate)
Finland EPR (AREVA-Seimens contract only)$2,350/kW (nominal estimate 2005)
Bruce RESTART $1,425/kW (nominal estimate 2005)
Source: Paul Joskow, MIT
Copyright Jonathan Koomey 2007 56
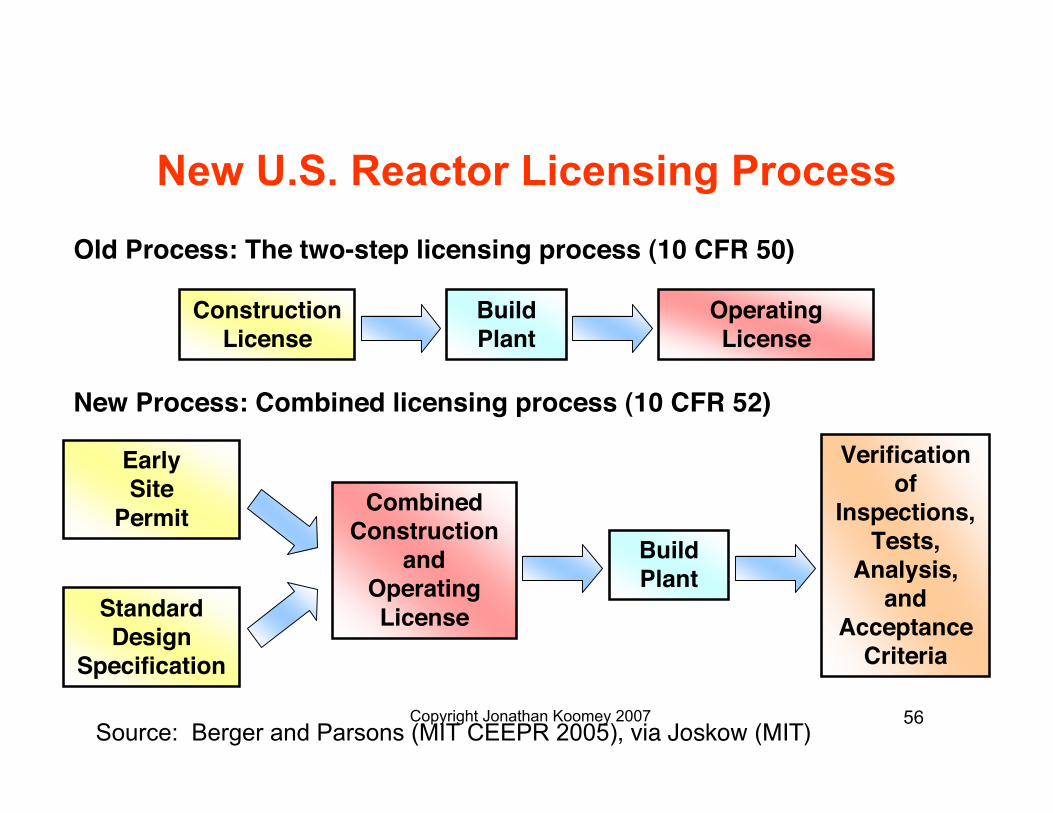
New U.S. Reactor Licensing Process
ConstructionLicense
BuildPlant
OperatingLicense
CombinedConstruction
andOperatingLicense
Verificationof
Inspections,Tests,
Analysis,and
AcceptanceCriteria
EarlySite
Permit
StandardDesign
Specification
BuildPlant
Old Process: The two-step licensing process (10 CFR 50)
New Process: Combined licensing process (10 CFR 52)
Source: Berger and Parsons (MIT CEEPR 2005), via Joskow (MIT)
Copyright Jonathan Koomey 2007 57
Energy Policy Act of 2005• Loan guarantees for up to 80% of project cost
– Valid for all GHG-free technologies– Higher leverage, lower debt cost reduces overall project cost
• Production tax credit of $18 per MWh for new nuclear capacitythrough 2021, subject to 2 limitations:– $125 million per 1,000-MW per year– 6,000-MW eligible, allocated among available capacity
• Insurance protection against delays during construction and untilcommercial operation caused by factors beyond private sector’scontrol– Coverage: $500 million apiece for first two plants, $250 million for
next four– Covered delays: NRC licensing delays, litigation delays
Source: Joskow (MIT)

Copyright Jonathan Koomey 2007 58
Energy Policy Act of 2005
• Renewal of the Price-Anderson Act of 1957– Liability protection extended until 2025
• Legislation updates tax treatment of nuclear decommissioningtrust funds to reflect competitive electricity markets– All decommissioning trust funds will qualify for tax
deductibility (not only those of regulated utilities)• Federal commitment on R&D portfolio ($2.95 billion authorized)• Creates Assistant Secretary for Nuclear Energy at DOE
Source: Berger and Parsons (CEEPR, 2005), via Joskow (MIT)