Embed Size (px)
Citation preview
This document consists of 11 printed pages and 1 blank page.
SPA FF/DT T76304/3© UCLES 2009 [Turn over
UNIVERSITY OF CAMBRIDGE INTERNATIONAL EXAMINATIONSInternational General Certificate of Secondary Education
READ THESE INSTRUCTIONS FIRST
Write your Centre number, candidate number and name on all work you hand in.Write in dark blue or black pen.You may use a pencil for any diagrams, graphs or rough working.Do not use staples, paper clips, highlighters, glue or correction fluid.DO NOT WRITE IN ANY BARCODES.
Answer all questions.
At the end of the examination, fasten all your work securely together.The number of marks is given in brackets [ ] at the end of each question or part question.
*6752477947*
PHYSICS 0625/06
Paper 6 Alternative to Practical May/June 2009
1 hour
Candidates answer on the Question Paper.No Additional Materials are required.
For Examiner’s Use
1
2
3
4
5
Total
www.XtremePapers.com
2
0625/06/M/J/09© UCLES 2009
ForExaminer’s
Use
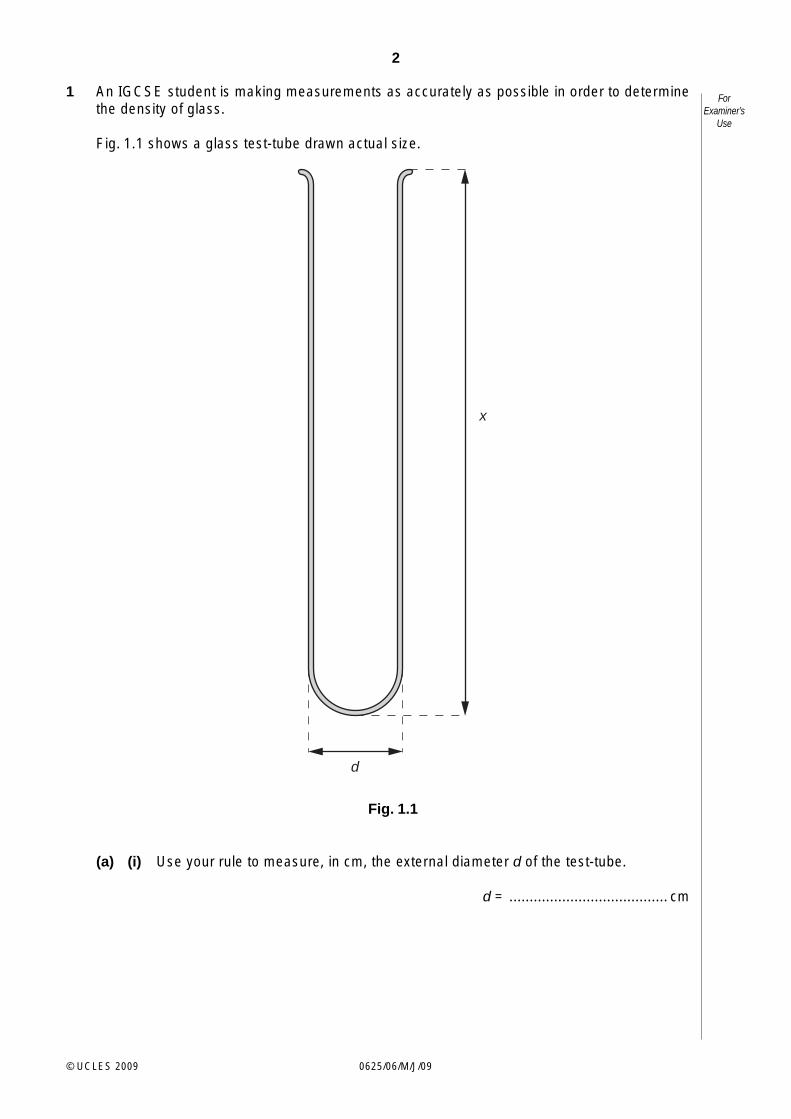
1 An IGCSE student is making measurements as accurately as possible in order to determine the density of glass.
Fig. 1.1 shows a glass test-tube drawn actual size.
d
x
Fig. 1.1
(a) (i) Use your rule to measure, in cm, the external diameter d of the test-tube.
d = ....................................... cm
3
0625/06/M/J/09© UCLES 2009 [Turn over
ForExaminer’s
Use
(ii) Use your rule to measure, in cm, the length x of the test-tube.
x = ............................................
(iii) Draw a labelled diagram to show how you would use two rectangular blocks of wood and your rule to measure the length x of the test-tube as accurately as possible.
[4]
(b) The mass m of the test-tube is 31.2 g.
(i) Calculate the external volume Ve of the test-tube using the equation
Ve = πd 2X
4 .
Ve = ............................................
4
0625/06/M/J/09© UCLES 2009
ForExaminer’s
Use
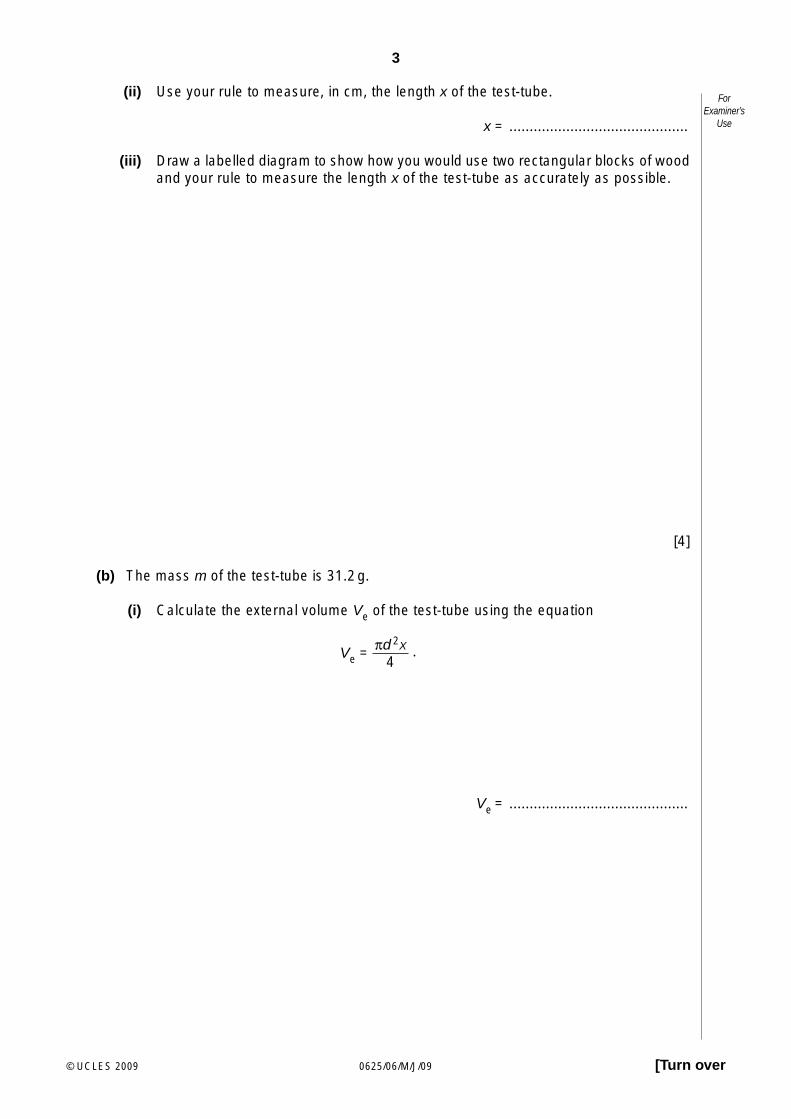
(ii) The student then fills the test-tube with water and pours the water into a measuring cylinder. Fig. 1.2 shows the measuring cylinder.
10
20
30
40
50
60
70
80
90
100
water
cm3
Fig. 1.2
Record the volume reading Vi from the measuring cylinder. This is the internal volume of the test-tube.
Vi = ............................................
(iii) Calculate the density ρ of the glass from which the test-tube is made using the equation
ρ =
m(Ve − Vi)
.
ρ = ....................................... [4]
[Total: 8]
5
0625/06/M/J/09 [Turn over
BLANK PAGE
6
0625/06/M/J/09© UCLES 2009
ForExaminer’s
Use
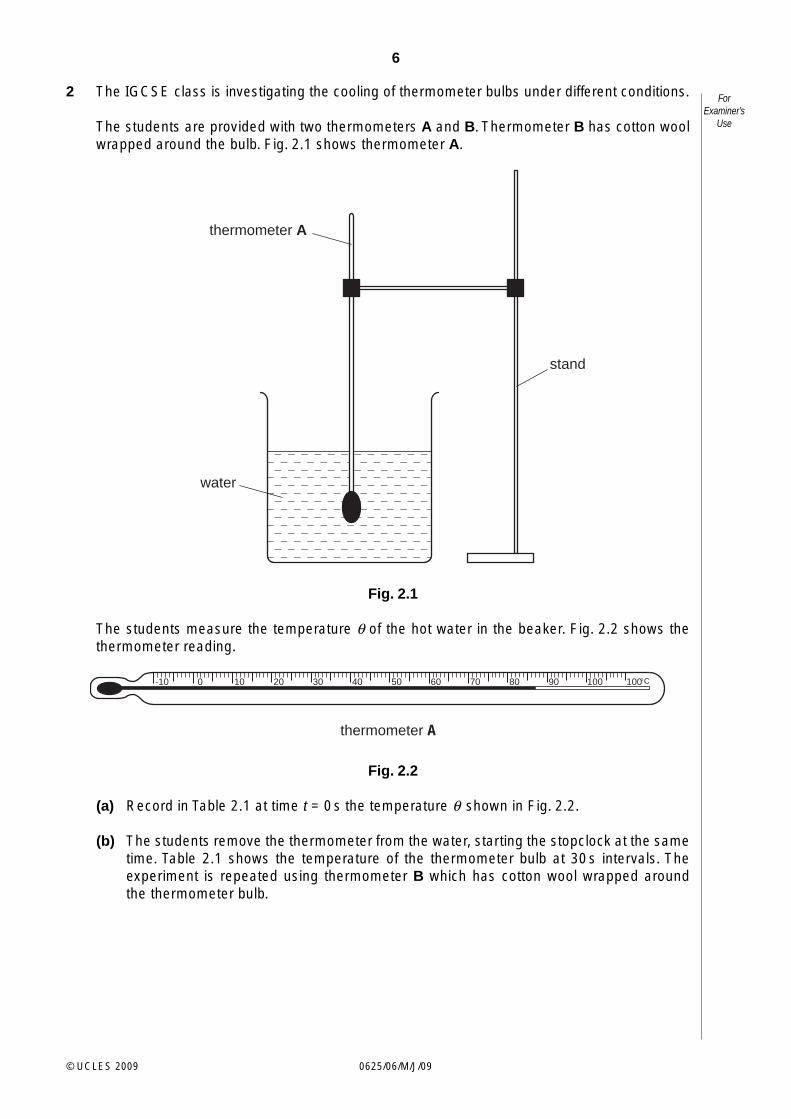
2 The IGCSE class is investigating the cooling of thermometer bulbs under different conditions.
The students are provided with two thermometers A and B. Thermometer B has cotton wool wrapped around the bulb. Fig. 2.1 shows thermometer A.
thermometer A
water
stand
Fig. 2.1
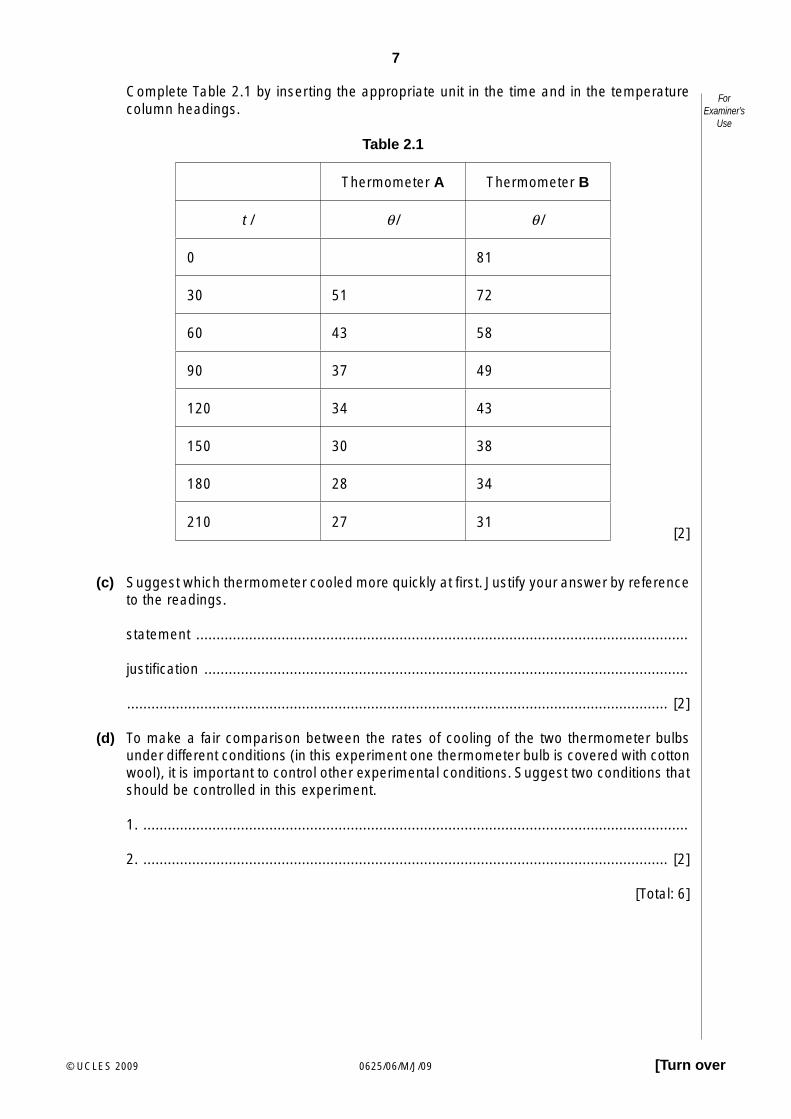
The students measure the temperature θ of the hot water in the beaker. Fig. 2.2 shows the thermometer reading.
thermometer A
-10 0 10 20 30 40 50 60 70 80 90 100 100°C
Fig. 2.2
(a) Record in Table 2.1 at time t = 0 s the temperature θ shown in Fig. 2.2.
(b) The students remove the thermometer from the water, starting the stopclock at the same time. Table 2.1 shows the temperature of the thermometer bulb at 30 s intervals. The experiment is repeated using thermometer B which has cotton wool wrapped around the thermometer bulb.
7
0625/06/M/J/09© UCLES 2009 [Turn over
ForExaminer’s
Use
Complete Table 2.1 by inserting the appropriate unit in the time and in the temperature column headings.
Table 2.1
Thermometer A Thermometer B
t / θ / θ /
0 81
30 51 72
60 43 58
90 37 49
120 34 43
150 30 38
180 28 34
210 27 31 [2]
(c) Suggest which thermometer cooled more quickly at first. Justify your answer by reference
to the readings.
statement .........................................................................................................................
justification .......................................................................................................................
..................................................................................................................................... [2]
(d) To make a fair comparison between the rates of cooling of the two thermometer bulbs under different conditions (in this experiment one thermometer bulb is covered with cotton wool), it is important to control other experimental conditions. Suggest two conditions that should be controlled in this experiment.
1. ......................................................................................................................................
2. ................................................................................................................................. [2]
[Total: 6]
8
0625/06/M/J/09© UCLES 2009
ForExaminer’s
Use
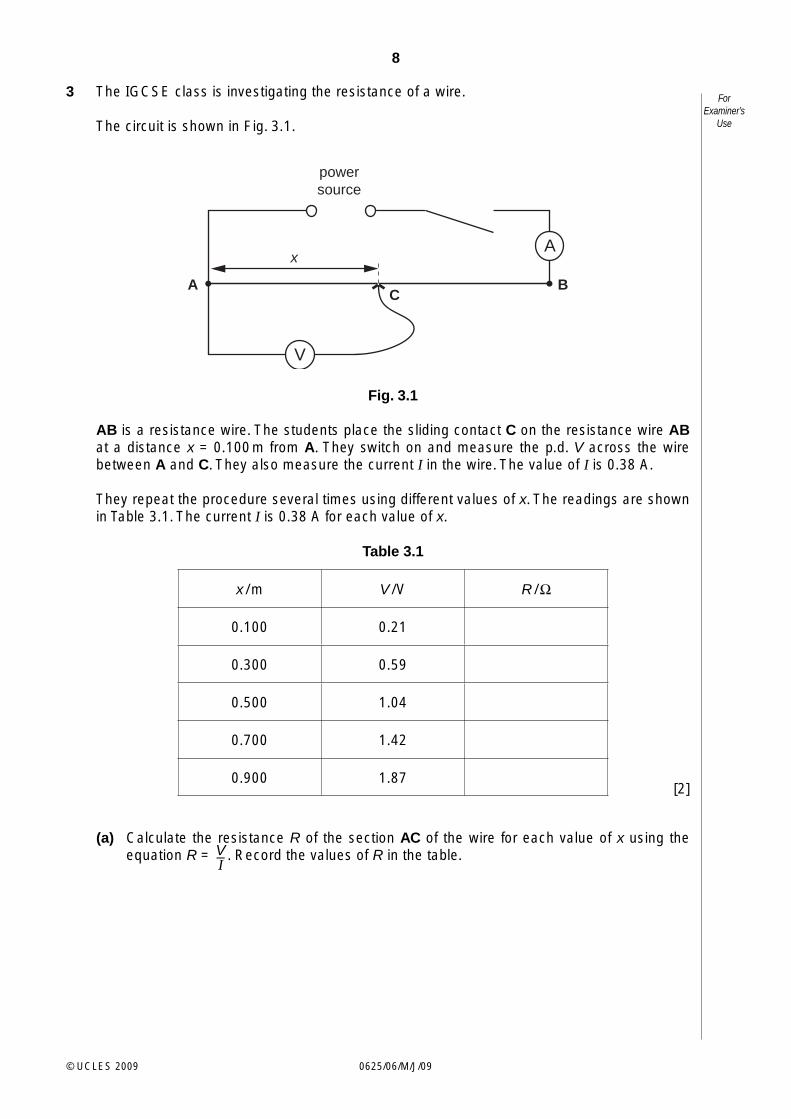
3 The IGCSE class is investigating the resistance of a wire.
The circuit is shown in Fig. 3.1.
powersource
A
x
CB
A
V
Fig. 3.1
AB is a resistance wire. The students place the sliding contact C on the resistance wire AB at a distance x = 0.100 m from A. They switch on and measure the p.d. V across the wire between A and C. They also measure the current I in the wire. The value of I is 0.38 A.
They repeat the procedure several times using different values of x. The readings are shown in Table 3.1. The current I is 0.38 A for each value of x.
Table 3.1
x / m V / V R / Ω
0.100 0.21
0.300 0.59
0.500 1.04
0.700 1.42
0.900 1.87
[2]
(a) Calculate the resistance R of the section AC of the wire for each value of x using the equation R = V–I
. Record the values of R in the table.
9
0625/06/M/J/09© UCLES 2009 [Turn over
ForExaminer’s
Use
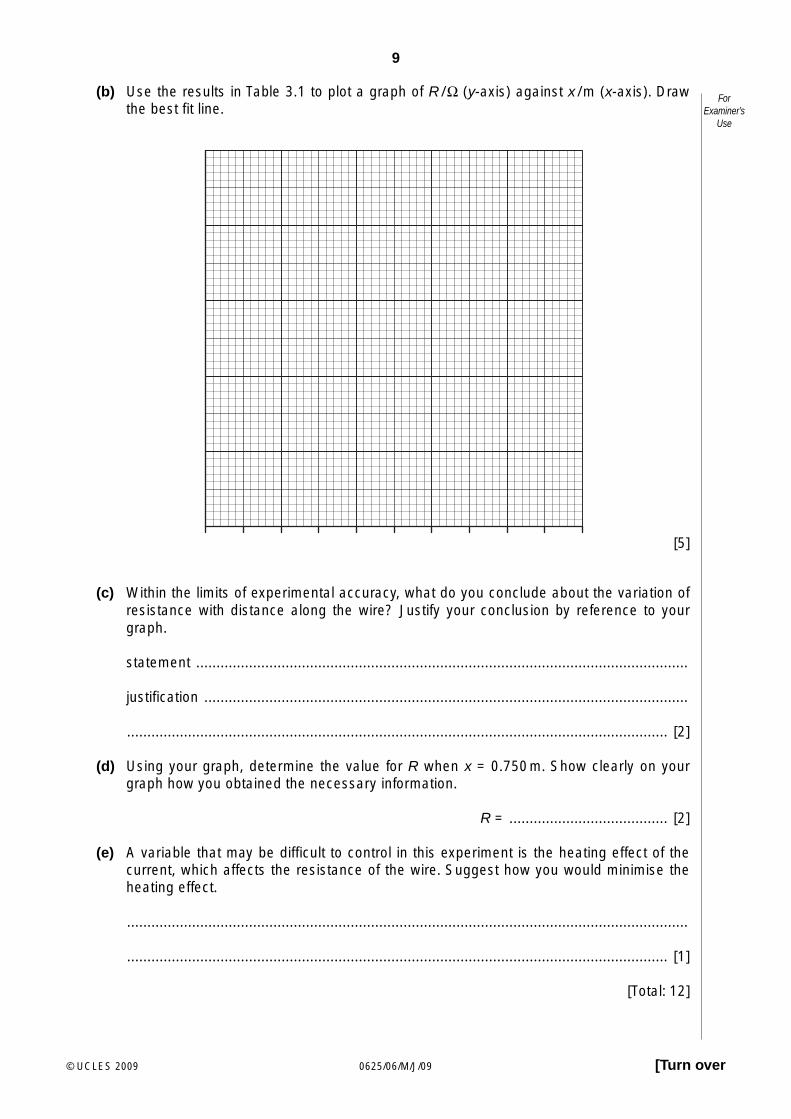
(b) Use the results in Table 3.1 to plot a graph of R / Ω (y-axis) against x / m (x-axis). Draw the best fit line.
[5]
(c) Within the limits of experimental accuracy, what do you conclude about the variation of resistance with distance along the wire? Justify your conclusion by reference to your graph.
statement .........................................................................................................................
justification .......................................................................................................................
..................................................................................................................................... [2]
(d) Using your graph, determine the value for R when x = 0.750 m. Show clearly on your graph how you obtained the necessary information.
R = ....................................... [2]
(e) A variable that may be difficult to control in this experiment is the heating effect of the current, which affects the resistance of the wire. Suggest how you would minimise the heating effect.
..........................................................................................................................................
..................................................................................................................................... [1]
[Total: 12]
10
0625/06/M/J/09© UCLES 2009
ForExaminer’s
Use
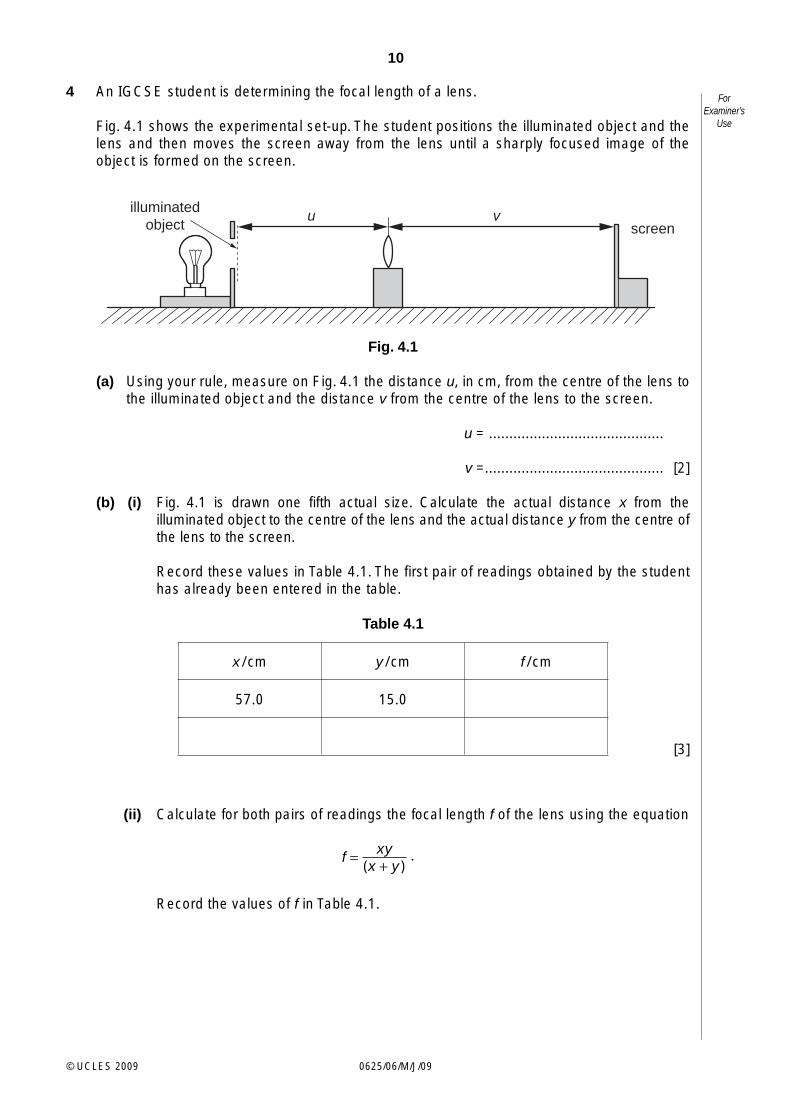
4 An IGCSE student is determining the focal length of a lens.
Fig. 4.1 shows the experimental set-up. The student positions the illuminated object and the lens and then moves the screen away from the lens until a sharply focused image of the object is formed on the screen.
illuminatedobject screen
u v
Fig. 4.1
(a) Using your rule, measure on Fig. 4.1 the distance u, in cm, from the centre of the lens to the illuminated object and the distance v from the centre of the lens to the screen.
u = ...........................................
v =............................................ [2]
(b) (i) Fig. 4.1 is drawn one fifth actual size. Calculate the actual distance x from the illuminated object to the centre of the lens and the actual distance y from the centre of the lens to the screen.
Record these values in Table 4.1. The first pair of readings obtained by the student has already been entered in the table.
Table 4.1
x / cm y / cm f / cm
57.0 15.0
[3]
(ii) Calculate for both pairs of readings the focal length f of the lens using the equation
f =
x y(x + y )
.
Record the values of f in Table 4.1.
11
0625/06/M/J/09© UCLES 2009 [Turn over
ForExaminer’s
Use
(c) Calculate the average value of the focal length.
average value for the focal length = ....................................... [2]
(d) State two precautions you would take in the laboratory in order to obtain reliable measurements.
1. ......................................................................................................................................
2. ................................................................................................................................. [2]
[Total: 9]
12
0625/06/M/J/09© UCLES 2009
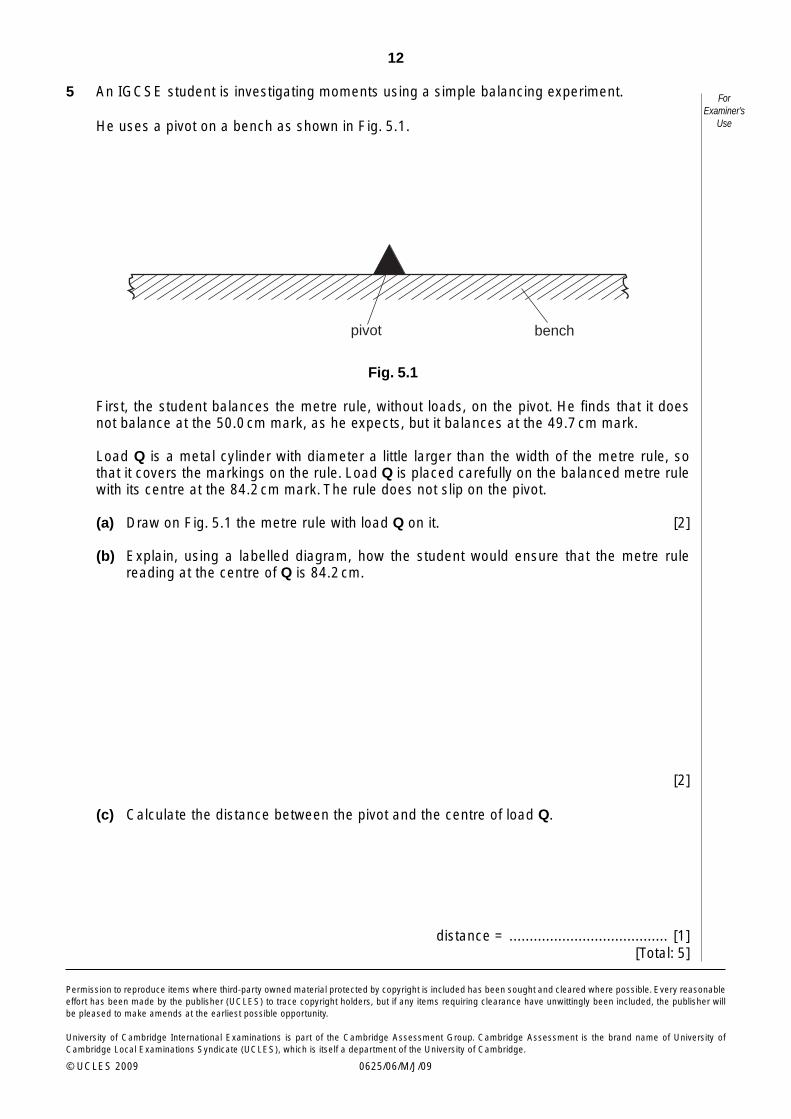
5 An IGCSE student is investigating moments using a simple balancing experiment.
He uses a pivot on a bench as shown in Fig. 5.1.
pivot bench
Fig. 5.1
First, the student balances the metre rule, without loads, on the pivot. He finds that it does not balance at the 50.0 cm mark, as he expects, but it balances at the 49.7 cm mark.
Load Q is a metal cylinder with diameter a little larger than the width of the metre rule, so that it covers the markings on the rule. Load Q is placed carefully on the balanced metre rule with its centre at the 84.2 cm mark. The rule does not slip on the pivot.
(a) Draw on Fig. 5.1 the metre rule with load Q on it. [2]
(b) Explain, using a labelled diagram, how the student would ensure that the metre rule reading at the centre of Q is 84.2 cm.
[2]
(c) Calculate the distance between the pivot and the centre of load Q.
distance = ....................................... [1] [Total: 5]
Permission to reproduce items where third-party owned material protected by copyright is included has been sought and cleared where possible. Every reasonable effort has been made by the publisher (UCLES) to trace copyright holders, but if any items requiring clearance have unwittingly been included, the publisher will be pleased to make amends at the earliest possible opportunity.
University of Cambridge International Examinations is part of the Cambridge Assessment Group. Cambridge Assessment is the brand name of University of Cambridge Local Examinations Syndicate (UCLES), which is itself a department of the University of Cambridge.
ForExaminer’s
Use