Embed Size (px)
Citation preview

SYSTEMATIC REVIEW
Training Load and Fatigue Marker Associations with Injuryand Illness: A Systematic Review of Longitudinal Studies
Christopher M. Jones1 • Peter C. Griffiths1 • Stephen D. Mellalieu2
� The Author(s) 2016. This article is published with open access at Springerlink.com
Abstract
Background Coaches, sport scientists, clinicians and
medical personnel face a constant challenge to prescribe
sufficient training load to produce training adaption while
minimising fatigue, performance inhibition and risk of
injury/illness.
Objective The aim of this review was to investigate the
relationship between injury and illness and longitudinal
training load and fatigue markers in sporting populations.
Methods Systematic searches of the Web of Science and
PubMed online databases to August 2015 were conducted
for articles reporting relationships between training
load/fatigue measures and injury/illness in athlete
populations.
Results From the initial 5943 articles identified, 2863
duplicates were removed, followed by a further 2833
articles from title and abstract selection. Manual searching
of the reference lists of the remaining 247 articles, together
with use of the Google Scholar ‘cited by’ tool, yielded 205
extra articles deemed worthy of assessment. Sixty-eight
studies were subsequently selected for inclusion in this
study, of which 45 investigated injury only, 17 investigated
illness only, and 6 investigated both injury and illness. This
systematic review highlighted a number of key findings,
including disparity within the literature regarding the use of
various terminologies such as training load, fatigue, injury
and illness. Athletes are at an increased risk of injury/ill-
ness at key stages in their training and competition,
including periods of training load intensification and peri-
ods of accumulated training loads.
Conclusions Further investigation of individual athlete
characteristics is required due to their impact on internal
training load and, therefore, susceptibility to injury/illness.
Key Points
Athletes training load and fatigue should be
monitored and modified appropriately during key
stages of training and competition, such as periods of
intensification of work training load, accumulated
training load and changes in acute training load,
otherwise there is a significant risk of injury.
Immunosuppression occurs following a rapid
increase in training load. Athletes who do not return
to baseline levels within the latency period
(7–21 days) are at higher risk of illness during this
period.
Individual characteristics such as fitness, body
composition, playing level, injury history and age
have a significant impact on internal training loads
placed on the athlete. Longitudinal management is
therefore recommended to reduce the risk of injury
and illness.& Christopher M. Jones
1 Research Centre in Applied Sports, Technology, Exercise and
Medicine, College of Engineering, Swansea University,
Fabian Way, Swansea SA1 8QQ, Wales, UK
2 Cardiff School of Sport, Cardiff Metropolitan University,
Cardiff, Wales, UK
123
Sports Med
DOI 10.1007/s40279-016-0619-5

1 Introduction
Previous research has demonstrated that training and
competition stress result in temporary decrements in
physical performance and significant levels of fatigue post-
competition [1–3]. These decrements are typically derived
from increased muscle damage [3, 4], impairment of the
immune system [1], imbalances in anabolic–catabolic
homeostasis [5], alteration in mood [6, 7] and reduction in
neuromuscular function (NMF) [2, 7, 8]. The resultant
fatigue from these variables can take up to 5 days to return
to baseline values post-competition [5], with sports that
have frequent competition (i.e. often weekly in team
sports) also inducing accumulative fatigue over time [9]. In
addition to the significant amounts of fatigue induced by
competition, many athletes experience fatigue as a result of
the work required to develop the wide variety of physical
qualities that contribute significantly to performance. For
example, in both team and individual sports, speed,
strength, power and endurance are required in addition to
technical and tactical skills [10]. To achieve optimal
development and performance, these physical qualities
must be trained and developed, which, irrespective of the
level of training loads used, may also induce further levels
of fatigue [10, 11].
1.1 Training Load, Fatigue, Injury and Illness
Definitions
Training load, fatigue, injury and illness have become
widely used terms within exercise science and sports such
as soccer and the various rugby codes; however, there has
been a lack of consistency regarding these definitions and
their use. When describing load/workload throughout this
paper, unless otherwise stated, load refers to training load
and is defined as the stress placed on the body by the
performed activity [12]. Training load comprises internal
and external workload, whereby internal training load
quantifies the physical loading experienced by an athlete
and external training load describes the quantification of
work external to the athlete [13]. Fatigue can be defined as
the decrease in the pre-match/baseline psychological and
physiological function of the athlete [14]. An accumulation
of fatigue can result in overtraining, which has a significant
negative impact on performance [15]. For example, the
investigation by Johnston et al. [16] regarding the physio-
logical responses to an intensified period of rugby league
competition over a 5-day period found that cumulative
fatigue appeared to compromise high-intensity running,
maximal accelerations and defensive performance in the
final game. This suggests that when athletes do not receive
adequate time to recover between training and competition,
fatigue will accumulate, compromise key aspects of per-
formance and result in an increased risk of injury and ill-
ness to the athlete [1, 15–17]. The definition of injury has
recently been realigned to the notion of impairment used by
the World Health Organization [18, 19]. As a result injury
can be categorised into three domains: clinical examination
reports, athlete self-reports and sports performance,
according to the Injury Definitions Concept Framework
(IDCF) [18, 19].
1.2 Monitoring Tools
Due to the highly complex nature of fatigue [9, 20], as well
as individualised responses to similar training loads
[21, 22], it is important to monitor global athlete fatigue
levels (i.e. mental, physical and emotional) in response to
prescribed training loads in order to minimise injury and
illness [23]. Given the link between training load and
injury incidence is now established, measures aimed at
controlling and reducing the risk factors for the develop-
ment of a sports injury are critical to primary, secondary
and tertiary injury prevention [149]. Monitoring tools are
used extensively in elite sport as valid indicators of
recovery status of the athlete [17] and to inform support
staff making decisions regarding the balance between
prescribing training and recovery/rest so that performance
is optimised and injury/illness minimised. Various aspects
of global training load and fatigue can be measured that
impact the day-to-day readiness of the athlete [17], with a
range of subjective and objective measures adopted to
monitor both load (e.g. training volume/duration/exposure,
number of skill repetitions, rating of perceived exertion
[RPE], session RPE [sRPE], global positioning systems
[GPS]) and fatigue (e.g. perceptual wellness scales, neu-
romuscular fatigue, biochemical markers, immunological
markers and sleep quantity/quality) [17].
1.3 The Relationship Between Training Load
and Fatigue Markers and Injury and Illness
The majority of training load/fatigue monitoring research
has focused on acute responses to measure recovery of
performance variables and the acceleration of this process
through the implementation of recovery modalities
[8, 24, 25]. In contrast, fewer attempts have been made to
monitor acute and/or cumulative load and fatigue variables
longitudinally to determine the association with injury/ill-
ness. Longitudinal monitoring refers to the investigation of
how change or accumulation in training load/fatigue is
associated with injury/illness over time. The use of long-
term monitoring allows for the measurement of training
load and fatigue variables to identify any injury/illness
trends in order to provide practitioners with objective data
C. M. Jones et al.
123

for planning training over multiple blocks, rather than
relying solely on anecdotal evidence, with the aim of
reducing overtraining and injury/illness [17, 26]. Any
subsequent reduction in injury and illness is likely to have a
significant impact on team performance due to the large
percentages of athletes from training squads (approxi-
mately 25 %) in team sports injured at any one time [27],
and the association between the number of injuries and
matches won [28, 29]. Although recent reviews have pro-
vided a summary of the methods available to monitor
athlete load and fatigue [17], the relationship between
training load in throwing-dominant sports [144], training
load and injury, illness and soreness [13], and the rela-
tionship between workloads, physical performance, injury
and illness in adolescent male football players [150], they
have not detailed or critiqued the specific relationship
between longitudinal training load, fatigue markers, and
subsequent injury and illness. Additionally, previous
reviews have adopted strict inclusion criteria, leading to
lower numbers of studies included for consideration.
1.4 Objectives
The objective of this study was to perform a systematic
review and evaluate the association between longitudinally
monitored training load, markers of fatigue, and injury/
illness in sporting populations. In doing so, this review
gives recommendations regarding appropriate variables to
measure training load, and suggestions for further studies
investigating longitudinal monitoring and fatigue markers
and their relationship with injury and illness.
2 Methods
2.1 Literature Search Methodology
A Cochrane Collaboration [30] review methodology (lit-
erature search, assessment of study quality, data collection
of study characteristics, analysis and interpretation of
results, and recommendations for practice and further
research) was used to identify relationships between long-
term training load, fatigue markers, injury and illness.
2.2 Search Parameters and Criteria
We searched the Web of Science and PubMed online
databases until August 2015 using combinations of the
following terms linked with the Boolean operators ‘AND’
and ‘OR’: ‘athlete’, ‘distance’, ‘fatigue’, ‘illness’, ‘in-
jury*’, ‘match’, ‘monitor*’, ‘monitoring’, ‘neuromuscular’,
‘performance’, ‘training’, and ‘wellness’. Articles were
first selected by title content, then abstract content, and
then by full article content. Manual searches were then
conducted from the reference lists of the remaining articles
that were selected for the ‘full article content’ stage, using
the Google Scholar ‘cited by’ tool and article reference
lists. Exclusion criteria included studies that were
(i) unavailable in English; (ii) review papers; (iii) purely
epidemiological; (iv) studying non-athlete, chronically sick
and/or already injured/ill populations; (v) study length
\2 weeks; and (vi) acute studies not investigating how
change or accumulation in load/fatigue associates with
injury/illness over time (Fig. 1 shows the flow of infor-
mation through the systematic review process). After an
initial 5943 articles were identified through online database
searching, 2863 were discarded due to duplication, 2558
were discarded due to title content, and 275 were discarded
due to abstract content. Subsequent manual searching
yielded 205 additional articles that were also assessed for
inclusion. Lastly, 384 articles were discarded upon
assessment of their full-text content, leaving 68 studies for
inclusion in the final review (injury, n = 45; illness,
n = 17; injury and illness, n = 6).
2.3 Assessment of Study Quality
As noted in previous systematic reviews [31], the usual
method of quality evaluation comprises tools such as the
Delphi [32] or PEDro (Physiotherapy Evidence Database)
[33] scales whose criteria are often not relevant for specific
review study types, including this current review article.
For example, similar to Hume et al. [31], 5 of the 11 PEDro
scale criteria were not included by any study in this review,
including concealed allocation, subject blinding, therapist
blinding, assessor blinding and intention-to-treat analysis.
Therefore, to reduce the risk of bias, and given the
unsuitability of scales such as Delphi and PEDro to assess
the literature in this review, two authors independently
evaluated each included article using a 9-item custom
methodological quality assessment scale with scores
ranging from 0 to 2 (total score out of 18). The nine items
included (1) study design (0 = retrospective,
1 = prospective cohort, 2 = experimental e.g. intervention
or case/control); (2) injury and/or illness inclusion
(1 = one of either, 2 = both); (3) injury/illness definition
(0 = not stated, 1 = no distinction between performance,
self-reported or clinical, 2 = clearly defining if injury was
sports performance, self-reported or clinical examination;
(4) sporting level (0 = less than sub-elite, 1 = sub-elite,
2 = elite); (5) fatigue and/or load inclusion (1 = one of
either, 2 = both); (6) number of fatigue and/or load vari-
ables (0 = 1, 1 = 2–3, 2 = more than 3); (7) statistics
used (0 = subjective/visual analysis or no direct compar-
ative analysis for fatigue/load and injury/illness associa-
tions; 1 = objective statistics for fatigue/load and injury/
Training Load and Fatigue Marker Associations with Injury and Illness
123

illness associations, 2 = objective statistics with: (i) ad-
justments for fatigue/load interactions, or (ii) quantification
of injury/illness prediction success); (8) study length
(0 = less than 6 weeks, 1 = 6 weeks to 1 year, 2 = more
than 1 year); and (9) fatigue and/or load monitoring fre-
quency (0 = less than monthly, 1 = weekly to monthly,
2 = more than weekly). Item 4 (sporting level) definitions
were as follows: less than sub-elite—unpaid novices or
recreational athletes, e.g. first-time runner [35] or amateur
rugby league player who trains once or twice a week and
plays weekly matches [36]; sub-elite—experienced athlete
who trains regularly with a performance focus, e.g. lower-
league soccer player who trains two to three times a week
[37]; elite–athletes competing and/or training at national or
international level. Item 6 (load/fatigue variables) refers to
the number of a particular kind of variable. For example,
three immunological markers and five perceptual wellness
factors included in a study would be registered as two
variables, not eight. A positive approach was taken
regarding items 6 and 9, i.e. the variable that scored the
greatest on the item scale was included as the final score.
For example, if one variable was monitored twice a week
and one was measured monthly, the final score for item 9
would be 2. The mean ± standard deviation (SD) study
quality score was 11 ± 2 (range 7–15).
2.4 Data Extraction and Analysis
For each article, the year of publication, quality score, sex,
sporting level, sample size, injury/illness definition and
type, fatigue/load variables, and a summary of findings
were extracted and are included in Tables 1, 2, 3 and 4.
Only the fatigue/load variables that were associated with
injury/illness in each study were included. As much data as
possible were included for the summary of findings;
however, if large amounts of data were reported in an
article then only significant/clear results were used. The
magnitude of effects were reported in the following
Fig. 1 Flow of information
through the systematic review
process
C. M. Jones et al.
123

Table 1 Summary of findings for studies investigating training load associations with injury
References Qualityscore/18
Study design,hierarchicallevel ofevidence
Sex/sport/level (n) Injurydefinitiona/type
Load measures Summary of findings
Andersonet al.[107]
12 Prospectivecohort, 2b
Female/basketball/elite (12)
Time-loss/all injury sRPE (training load,monotony and strain)
Pearson correlations with injury:training load, r = 0.10 (NS);strain, r = 0.68***; monotony,r = 0.67***
Arnasonet al. [40]
12 Prospectivecohort, 2b
Male/soccer/elite(306)
Time-loss/all injury Training exposure Injured group vs. non-injured,ORs: (p value) match exposure(min),[1 SD below mean 0.18(\0.001);[1 SD above mean0.61 (0.09); training exposure(min),[1 SD below mean 0.51(0.07);[1 SD above mean 0.34(0.01)
Bengsstonet al. [53]
12 Prospectivecohort, 2b
Male/soccer/elite(27 teams)
Time-loss/muscleand ligamentinjury
Days between matchesand number of matches
RRs,\4 days between matchesvs.[6 days recovery (p value):all injury, league 1.1 (0.045),Europa League 0.7 (0.064);muscle injury, league 1.3(\0.001), Europa League 0.5(0.055); ligament injury, othercup 1.8 (0.041); all competition,hamstring injury 1.3 (0.011),quadriceps injury 1.8 (0.006)
Linear regression, onematch/month change and injuryincidence/1000 h: same matchsequence, muscle injury 1.6(0.012); subsequent matchsequence, total injury 2.0 (0.056)
Brink et al.[71]
13 Prospectivecohort, 2b
Male/soccer/elite(53)
Combined/all injury Training and matchduration, and load(sRPE) [load, monotonyand strain]
Injured group vs. non-injured, ORs(p value): traumatic injury,physical stress, duration 1.14*,load 1.01*, monotony 2.59*,strain 1.01*
Overuse injury, physical stress,duration 1.1 (NS), load 1.0 (NS),monotony 0.8 (NS), strain 1.0(NS)
Brookset al. [27]
12 Prospectivecohort, 2b
Male/rugby union/elite (502)
Time-loss/all injury Training exposure Training injury: average numberand days lost per weeksignificantly higher when totalweekly training[9.1 hvs.\9.1 h
Match injury: average severity anddays lost per week significantlyhigher when total weeklytraining[9.1 h vs. 6.3–9.1 h
Buist et al.[35]
10 Prospectivecohort, 2b
Mixed/runners/novice (532)
Time-loss/all injury(running related)
Training exposure Graded (intervention) vs. standard(control) training programme:weekly increase in runningminutes ?13.2 % (NS); OR forinjury (95 % CI) 0.8 (0.6–1.3)[NS]
Carlinget al. [38]b
10 Prospectivecohort, 2b
Male/soccer/elite(1 team)
Time-loss/all injury Match distance/min (totaland[5.3 m/s)
Average m/min/match for eachseason and injury, Pearsoncorrelation (p value): totalm/min, severity, days r = 0.92(0.025), number of matchesr = 0.86 (0.06);[5.3 m/s m/min, muscle strain r = -0.91(0.03)
Training Load and Fatigue Marker Associations with Injury and Illness
123

Table 1 continued
References Qualityscore/18
Study design,hierarchicallevel ofevidence
Sex/sport/level (n) Injurydefinitiona/type
Load measures Summary of findings
Carlinget al. [62]
11 Prospectivecohort, 2b
Male/soccer/elite(19)
Time-loss/all injury Days between matches Congested match period vs. lesscongested match periods: injuryincidence ?0.5/1000 h (0.940),severity -5.9 (0.043)
Colby et al.[86]
12 Prospectivecohort, 2b
Male/AF/elite (46) Time-loss/intrinsic Training distance, velocityand acceleration (totaldistance, sprint distance,V1 distance, velocityload, RVC; GPS)
Injury risk, ORs (p value),preseason: cumulative load,3-week velocity load(6737–8046 vs.\6737 AU) 0.24(0.04); 3-week sprint distance(846–1453 vs.\ 864 m) 0.23(0.05); 3-week total distance(73,721–86,662 vs. 73,721 m)5.49 (0.01)
Absolute change (±), force load([556 vs. less than -13 AU)0.10 (0.05); RVC load (0.1–9.4vs.\ 0.10 AU) 0.04 (0.006)
Inseason: cumulative load, 3-weekforce load ([5397 vs.\4561AU) 2.53 (0.03); 4-week RVCload ([102 vs.\84 AU) 2.24(0.04); 2-week V1 distance(10,321–12,867 vs. 10,321 m)0.41 (0.01), ([12,867 vs. 10,321m) 0.28 (0.006); 2-week totaldistance (m). Absolute change(±), total distance (-549 to 6955vs. -549 m) 0.49 (0.04), ([6955vs. -549 m) 0.48 (0.08)
Cross et al.[73]
11 Prospectivecohort, 2b
Male/rugby union/elite (173)
Time-loss/all injury Training load (sRPE) Injury risk, OR (95 % CI) 1-week?1245 AU 1.7 (1.1–2.7), 1-weekchange ?1069 AU 1.6 (1.0–2.5);4-week load (all vs.\3684 AU),5932–8591 AU 0.6(0.2–1.4),[8651 AU 1.4(1.0–2.0)
Dellal et al.[63]
11 Prospectivecohort, 2b
Male/soccer/elite(16)
Time-loss/all injury Days between matches Injury incidence/1000 h,congested vs. non-congestedmatch periods: overall -1.2(NS), match ?24.7***, training-10***
Dennis et al.[56]
12 Prospectivecohort, 2b
Male/cricket (fastbowlers)/elite (90)
Time-loss/gradualonset
Training load (daysbetween matches andnumber of deliveries)
Injury rate, RRs (95 % CI) ballsbowled per week (vs. 123–188balls),\123 balls 1.4 (1.0–2.0),[188 balls 1.4 (0.9–1.6)
Days between bowling sessions(all vs. 3–3.99 days)\2 days 2.4(1.6–3.5); 2–2.99 days 1.4(0.9–2.2); 4–4.99 days 1.3(0.7–2.3);[5 days 1.8 (1.1–2.9)
Duckhamet al. [42]
7 Prospectivecohort, 2b
Female/running/mixed (70)
Combined/stressfracture
Training exposure Training exposure (h/week) innon-stress fracture group vs. caseone -3, case two ?7
Dvoraket al. [43]
8 Retrospectivecohort, 2b
Male/soccer/mixed(264)
Combined/all injury Training exposure Injured vs. uninjured players:games played previous season—?0.4 (NS); total training h/weekin previous preparation period?2.6*; total training h/week inprevious competition period?1.5*
C. M. Jones et al.
123

Table 1 continued
References Qualityscore/18
Study design,hierarchicallevel ofevidence
Sex/sport/level (n) Injurydefinitiona/type
Load measures Summary of findings
Ekstrandet al. [44]
11 Prospectivecohort, 2b
Male/soccer/elite(266)
Time-loss/all injury Training exposure World Cup vs. non-World-Cupplayers, mean difference:exposure (h/player), total?41***, training ?20 (NS),matches ?21***
Injury incidence (injuries/1000 h),total -1.6 (NS), training-2.3***, matches -3.6 (NS)
Funten et al.[45]
10 Prospectivecohort, 2b
Male/soccer/elite(188)
Time-loss/all injury Training exposure Mean difference, 2009–2010(3.5 week winter break) vs.2008–2009 season (6.5 weekwinter break) post-winter break:exposure (h), total -18.4(\0.001), training -16.7(\0.001), match -1.6 (0.15)
Injury RRs, 2009–2010 vs.2008–2009 (p value): all, kneeligament 1.9 (0.09); training,traumatic 1.5 (0.07), minimal 1.5(0.02), severe 1.8 (0.06), sprain/joint 1.8 (0.07), knee ligament3.1 (0.05); match, moderate 0.6(0.09)
Gabbett andDomrow[106]b
11 Prospectivecohort, 2b
Male/rugby league/recreational (68)
Combined/all injury sRPE (training and matchload)
Monthly load (sRPE) and injuryrate (per 1000 h) relationships,Pearson correlations (p value):training load r = 0.40 (0.28),match load r = 0.35 (0.44)
Significantly (p\ 0.05) lowertraining loads and higher matchloads corresponded with periodsof highest injury rates
Gabbettet al. [64]
13 Non-RCT, 2b Male/rugby league/elite (91)
Time-loss/non-contact soft tissuelower body
sRPE (training load) Training load [sRPE] (95 % CI)and injury prevalence (%), whenactual loads exceeded planned:preseason, 4341 (4082–4600)AU and 72 (63–81) %; earlycompetition, 2945 (2797–3094)AU and 75 (66–84) %; latecompetition, 3395 (3297–3493)AU and 57 (47–67) %
Training load range (sRPE) for50–80 % likelihood of injury:preseason 3000–5000 AU, latecompetition 1700–3000 AU
Accuracy of model for predictinginjury (95 % CI) sensitivity 87.1(80.5–91.7) %; specificity 98.8(98.1–99.2) %; likelihood ratiopositive 70.0 (45.1–108.8);likelihood ratio negative 0.1(0.1–0.2)
Gabbett[77]
9 Prospectivecohort, 2b
Male/rugbyleague/sub-elite(79)
Combined/all injury sRPE (training and matchload)
Injury incidence, Pearsoncorrelations: training injury,intensity (RPE) r = 0.83*;duration (min) r = 0.79*; load(sRPE) r = 0.86*
Match injury, intensity (RPE)r = 0.74*; duration (min)r = 0.86*; load (sRPE)r = 0.86*
Training Load and Fatigue Marker Associations with Injury and Illness
123

Table 1 continued
References Qualityscore/18
Study design,hierarchicallevel ofevidence
Sex/sport/level (n) Injurydefinitiona/type
Load measures Summary of findings
Gabbett[78]
11 Non-RCT, 2b Male/rugbyleague/sub-elite(220)
Sports performanceand time-loss/allinjury includingmechanism
sRPE (training load) Differences between 2001 and2002/2003 preseasons (p-values): training intensity (RPE),2003 vs. 2001 -0.3 2011***;training load (sRPE) vs. 2001,2002 season -65 AU***, 2003season -28 AU**
Injury incidence (injury/1000 h)vs. 2001, all injury 2002-62.3***, 2003 -78.3***,time-loss injury 2002-3.3**, 2003 -14.4**
Gabbett andDomrow[79]
11 Prospectivecohort, 2b
Male/rugbyleague/sub-elite(183)
Time-loss/all injury sRPE (training load) Individual level, one unit changein log of training load/week andinjury risk, OR (p value):preseason 2.12 (0.01); earlycompetition 2.85 (0.01); latecompetition 1.50 (0.04)
Group level, influence of one unitchange in training load/week(AU) on change in injuryincidence/1000 h (p value): pre-season ?0.35 (0.01); earlycompetition -0.08 (0.53); latecompetition ?0.02 (0.84)
Gabbett andJenkins[80]
14 Prospectivecohort, 2b
Male/rugby league/elite (79)
Combined/non-contact andcontact andactivity type
sRPE (training load) Relationships between total, fieldand strength training load(sRPE) and injury, Pearsoncorrelations: total injury, totalr = 0.82**; field r = 0.67*;strength r = 0.81**
Field injury, total r = 0.86**; fieldr = 0.68*; strength r = 0.87**;non-contact injury, totalr = 0.82**; field r = 0.65*;strength r = 0.82**
Contact injury, total r = 0.80**,field r = 0.63*, strengthr = 0.75**; strength injury, totalr = 0.59 (NS); field r = 0.43(NS); strength r = 0.63*
Gabbett andUllah [34]
11 Prospectivecohort, 2b
Male/rugby league/elite (34)
Sports performanceand time-loss/non-contact soft tissuelower body
Training distance (m forvarious velocitythresholds and m/min;GPS)
Relative risk of injury forthresholds of training load [m/session] (threshold load value):very low intensity ([542 m),time-loss injury 0.4*; lowintensity ([2342 m), time-lossinjury 0.5*; very high intensity([9 m), sports performanceinjury 2.7*; mild acceleration([186 m), sports performanceinjury 0.2**; moderateacceleration ([217 m), sportsperformance injury 0.3**, time-loss injury 0.4*; maximumacceleration ([143 m), sportsperformance injury 0.4*, time-loss injury 0.5*
C. M. Jones et al.
123

Table 1 continued
References Qualityscore/18
Study design,hierarchicallevel ofevidence
Sex/sport/level (n) Injurydefinitiona/type
Load measures Summary of findings
Gabbettet al. [64]
10 Prospectivecohort, 2b
Male/rugby league/elite (30)
Combined/collisioninjury
Number and intensity
(g experienced; GPSaccelerometer) ofcollisions and daysbetween matches
Number of training collisions andtraining collision injury rate bothsignificantly (p\ 0.05) higher in10-day recovery cycles betweenmatches than\10-day recoverycycles
Gabbettet al. [65]
11 Prospectivecohort, 2b
Male/rugby league/elite (51)
Time-loss/collisioninjury
Number of collisions(coded from videofootage) and daysbetween matches
Match collisions significantly(p\ 0.05) greater in wide-running position vs. all otherpositions, but significantly lowercollision injury rate; matchcollision injury rate/10,000collisions significantly(p\ 0.05) higher in 8-dayrecovery cycles betweenmatches than[/\8-day recoverycycles
Hagglundet al. [46]
10 Prospectivecohort, 2b
Male/soccer/sub-elite (26)
Time-loss/all injury Training and matchnumber and exposure
2001 vs. 1982 seasons for 15 bestplayers/team (p values): trainingsessions (player/year) ?76(\0.001); matches (player/year)-8 (\0.001); training exposure(h/player) ?97 (\0.001), matchexposure (h/player) -12(\0.001)
Injury incidence/1000 h, training?0.6 (0.63), matches ?5.3(0.45), slight -0.8 (0.53), minor?0.1 (0.86), moderate ?0.5(0.30), major -0.1 (0.65)
Hagglundet al. [47]
11 Prospectivecohort, 2b
Male/soccer/elite(188)
Time-loss/all injuryincludingmechanism
Training and matchnumber and exposure
Swedish vs. Danish 2001 springdomestic season (p values):training sessions (player/year)?34 (\0.001); matches (player/year) ?1 (0.52); trainingexposure (h/player) ?48(\0.001); match exposure(h/player) -1 (0.23)
Injury incidence, player/season,training -0.4 (0.001), matches-0.2 (0.29); 1000/h, training-5.8 (\0.01), matches -2.0(0.59), slight -3.1 (0.088),minor -1.5 (0.014), moderate-0.5 (0.15), major -1.1 (0.002)
Training Load and Fatigue Marker Associations with Injury and Illness
123

Table 1 continued
References Qualityscore/18
Study design,hierarchicallevel ofevidence
Sex/sport/level (n) Injurydefinitiona/type
Load measures Summary of findings
Hulin et al.[57]
13 Retrospectivecohort, 2b
Male/cricket (fastbowlers)/elite (28)
Time-loss/non-contact
sRPE (training load) andballs bowled/week
Relationship between increasedtraining load and injury risk, RRs(p value): external load (ballsbowled/week), acute (1-week),same week decreased injury(0.0001); chronic (4-weekaverage), same week decreasedinjury (0.002), subsequent weekdecreased injury (0.02)
Acute:chronic load ratio[100 %vs.\100 %, subsequent weekinjury, external load 2.1 (0.01);internal load 2.2 (0.009)
Acute:chronic load ratio, RRs(p values), external load 200 vs.50–99 % 3.3 (0.03),\49 % 2.9(0.04); internal load 200 vs.50–99 % 4.5 (0.009),\49 % 3.4(0.03)
Killen et al.[81]
11 Prospectivecohort, 2b
Male/rugby league/elite (36)
Combined/all injury sRPE (training load,monotony, strain)
Weekly load/fatigue–injuryrelationships, Pearsoncorrelations (p value): load(sRPE), r = 0.02 (0.94); strain,r = 0.09 (0.78); monotony,r = 0.32 (0.28)
Main et al.[50]
14 Prospectivecohort, 2b
Mixed/triathlon/sub-elite (30)
Combined/all injury Training exposure andsessions/week andperceived effort andintensity (1–5 scale)
Linear mixed model associationswith signs and symptoms ofinjury and illness: total numberof sessions/week***, swimsessions/week*, cycle sessions/week**, running sessions/week***
Mallo andDellal[55]
13 Prospectivecohort, 2b
Male/soccer/elite(35)
Time-loss/ligamentsprains andmuscle strains
Training heart rate,number of sessions andsession frequency
Ligament sprains higher in firsttwo training stages*; musclestrains higher in final trainingstage (p = 0.051)
Injury incidence relationships withstage training load, Pearsoncorrelation: heart rate r = 0.72*;training frequency r = -0.17(NS); number of sessionsr = -0.20 (NS)
Murrayet al. [66]
11 Prospectivecohort, 2b
Male/rugby league/elite (43)
Time-loss/all injury Days between matches Injury incidence/1000 h for short(5–6), medium (7–8) and long(9–10) days between matches:no differences for all injuriesbetween different cycles;significantly fewer buttock, thighand muscular injuries after shortcycles**; adjustable highestinjury incidence after shortcycles and hit-up forwards andoutside backs after long cycles**
Nielsenet al. [87]
11 Prospectivecohort, 2b
Mixed/running/novice (60)
Time-loss/all injury(running related)
Training distance (GPS) Mean differences (p value):injured increase in weeklytraining load vs. non-injured?9.5 % (0.07); increase intraining load week before injuryvs. all other weeks ?86 % (0.03)
C. M. Jones et al.
123

Table 1 continued
References Qualityscore/18
Study design,hierarchicallevel ofevidence
Sex/sport/level (n) Injurydefinitiona/type
Load measures Summary of findings
Orchardet al. [60]
12 Retrospectivecohort, 2b
Male/cricket (fastbowlers)/elite(129)
Time-loss/non-contact or gradualonset bowlinginjury
Training load (oversbowled)
5.4 (18.8 %) more oversbowled/match in players injuredin the next 28 days vs. non-injured
RRs (95 % CI) injury risk for[50overs bowled/match in thefollowing: 14 days 1.8 (1.0–3.3);21 days 1.8 (1.1–3.0); 28 days1.6 (1.0–2.6)
Orchardet al. [58]
12 Prospectivecohort, 2b
Male/cricket (fastbowlers)/elite(235)
Time-loss/non-contact or gradualonset bowlinginjury
Training load (oversbowled)
RRs (95 % CI) for injury: oversbowled in time period and injuryrisk for following 28 days:5 days[50 overs 1.5 (1.0–2.3),17 days[100 overs 1.8(0.9–3.5)
Orchardet al. [59]
12 Prospectivecohort, 2b
Male/cricket (fastbowlers)/elite(235)
Time-loss/non-contact or gradualonset bowlinginjury
Training load (oversbowled)
Tendon injury in 21 days, RRs(p value): match[50 overs 3.7(0.001), career[12,000 overs2.4 (0.000), previousseason[400 overs 2.0 (0.000), 3previous months[150 overs 0.3(0.000), career[3000 overs 0.2(0.000); bone-stress injury in28 days, 3 previousmonths[150 overs 2.1 (0.000);muscle injury in 28 days,previous season[400 overs 0.7(0.020); joint injury in 28 days,previous season[450 overs 2.0(0.015)
Owen et al.[67]
13 Prospectivecohort, 2b
Male/soccer/elite(23)
Time-loss/all injury Training heart rate (T-HIand T-VHI)
Injury and heart rate relationships(p value): Pearson correlations,T-HI, training r = 0.57 (0.005),match r = 0.09 (0.69), traumatic0.42 (0.04), severity 0.51 (0.01);T-VHI, training r = 0.57(0.005), match r = 0.19 (0.38),traumatic 0.44 (0.03), severity0.47 (0.02)
Forwards stepwise linearregression, T-HI and T-HVIr2 = 0.28 (0.014); OR (p value):T-HI, match injury 1.9 (0.02)
Less T-HI (p = 0.06) and T-VHI(p = 0.04) in the month beforean injury did not occur vs. aninjury occurring
Piggottet al. [68]
13 Prospectivecohort, 2b
Male/AF/elite (16) Time-loss/all injury sRPE (training load,monotony and strain),mins[80 %
Maximum heart rate,training distance (totaland[ 3.3 m/s; GPS)
Injury incidence relationships,Pearson correlations (p values):load (NS), monotony r = 0.25(NS), strain r = 0.07 (NS),distance r = -0.52 (0.05),distance[3.3 m/s (NS),time[80 % maximum heart rate(NS)
Percentage of injury explained byprevious spike: load, 40 %;strain, 40 %; monotony, 20 %
Putlur et al.[84]
13 Prospectivecohort, 2b
Female/soccer/sub-elite (14 plus 14recreationalcontrols)
Time-loss/all injury sRPE (training load,monotony and strain)
Mean training load, monotony andstrain and injury frequencygreater in soccer vs. controlgroup
Training Load and Fatigue Marker Associations with Injury and Illness
123

descending order of priority: (i) objective statistics such as
risk ratios or mean differences; and (ii) visual trends or
descriptive results of data with no statistical test. The
probability of effects in the summary findings were
reported in the following descending order of priority:
(i) exact p values; (ii) significance levels (e.g.
p\ 0.05, p\ 0.01); and (iii) 95 % confidence intervals
(CIs). To preserve table space, differences in group means
was reported rather than the raw values for each group
comparison e.g. ?15 rather than 25 versus 10. Although
three studies initially provided no direct statistics to assess
load/fatigue–injury associations [36, 38, 39], raw group
load/fatigue–injury data were analysed using Pearson cor-
relations. A priori level of evidence was evaluated using
the van Tulder et al. method [142]. Levels of evidence were
defined as strong (consistent findings among multiple high-
quality randomised controlled trials [RCTs]), moderate
(consistent findings among multiple low-quality RCTs and/
or non-RCTs, clinical controlled trials [CCTs], and or one
high-quality RCT), limited (one low-quality RCT and/or
Table 1 continued
References Qualityscore/18
Study design,hierarchicallevel ofevidence
Sex/sport/level (n) Injurydefinitiona/type
Load measures Summary of findings
Rogalskiet al. [85]
12 Prospectivecohort, 2b
Male/AF/elite (46) Time-loss/all injury sRPE (training and matchload)
Injury, ORs (p value): trainingload (sRPE), 1-week load allvs.\1250 AU, 1250–1750 AU1.95 (0.06), 1750–2250 AU 2.54(0.007),[2250 AU 3.38 (0.001);2-week load, all vs.\2000 AU,2000 to\3000 AU 2.93 (0.14),3000–4000 AU 4.03(0.05),[4000 AU 4.74 (0.03)
Previous to current week change,all vs. 250 AU, 250–750 AU1.34 (0.15); 750–1250 AU 0.89(0.68);[1250 AU 2.58 (0.002)
Saw et al.[61]
10 Prospectivecohort, 2b
Male/cricket/elite(28)
Combined/throwingassociated injuries
Training load (number ofthrows in training andmatches)
Mean differences (p value):injured vs. non-injured,throws/day?12.5 (0.06), throws/week ?49.7 (0.004); weekbefore injury vs. all other weeksprior to injury, throws/week?38.9 (0.0001), throwing days/week ?1.9 (0.04), rest days vs.throwing days -2.2 (0.0004)
vanMechelenet al. [51]
9 Prospectivecohort, 2b
Mixed/mixed/recreational (139)
Time-loss/all injury Training exposure Injury OR (95 % CI) for totalsporting time above median(4050 h) 6.9*
Veugelerset al. [70]
11 Prospectivecohort, 2b
Male/AF/elite (45) Time-loss/non-contact soft tissueinjury
RPE and sRPE (alltraining and fieldtraining load)
High vs. low training load (aboveand below median), ORs forinjury (p values): all training,sRPE, 1 week 0.20 (0.04), RPE,1 week 0.20 (0.04), 2 weeks0.23 (0.06)
Viljoenet al. [52]
9 Prospectivecohort, 2b
Male/rugby/elite(38)
Combined/all injury Training load (oversbowled)
In-season, training h/match, 3-yeardecrease; injury rates, 3-yeardecrease
Pre-season, training exposure,3-year decrease*; injury rate,3-year increase**
AF Australian Football, AU arbitrary units, CI confidence interval, g gravitational acceleration constant, GPS global positioning system, NS non-significant, OR odds ratio, RCT randomised controlled trial, RPE rate of perceived exertion, RR risk ratio, RVC relative velocity change, sRPE session rateof perceived exertion, T-HI time spent at high intensity, 85–89 % of maximum heart rate, T-VHI time spent at very high intensity, C90 % of maximumheart rate, V1 aerobic threshold speed, 2b ‘Individual cohort study’determined by the Oxford Centre of Evidence-Based Medicine [151]
* Indicates p significant to 0.05 level
** Indicates p significant to 0.01 level
*** Indicates p significant to 0.001 levela Combined refers to clinical, sports performance and self-reported injuries being included together in analyses, with no distinction between themb Statistics derived from the raw data provided
C. M. Jones et al.
123

CCT), conflicting (inconsistent findings among multiple
trial RCTs and/or CCTs) and no evidence from trials (no
RCTs or CCTs) [142]. The van Tulder et al. [142] method
is an accepted method of measuring the strength of evi-
dence [13, 142]. The Oxford Centre of Evidence-Based
Medicine Levels of Evidence [151] was utilised to deter-
mine the hierarchical level of evidence, whereby the
highest level of evidence pertained to a systematic review
of RCTs, and the lowest level of evidence pertained to
expert opinion without critical appraisal or based on
physiology, bench research or ‘first principles’ [13, 151].
The levels of evidence of each study are presented in
Tables 1, 2, 3 and 4.
2.5 Definitions of Key Terms
Training load, fatigue injury and illness have previously
been defined (see Sect. 1.1). Latency period is defined as
the period between training load and the onset of injury or
illness [13]. Finally, we used the term ‘exposure’ to refer to
time spent participating in a particular training/competition
activity.
3 Results
3.1 Retention of Studies
Overall, 68 studies were retained for inclusion in the final
review (Fig. 1), of which 45 (66 %) investigated injury
only, 17 (25 %) investigated illness only, and 6 (8 %)
investigated both injury and illness. In addition, 42 (61 %)
articles focused on load–injury/illness relationships, 11
(16 %) focused on fatigue–injury/illness relationships only,
and 15 (22 %) included both load and fatigue variables. In
the 57 studies that investigated load–injury/illness rela-
tionships, many different load measures were used,
including training exposure (n = 14, 24 %) [35, 40–52];
number of sessions/matches (n = 5, 8 %) [46, 47, 53–55],
number of skill repetitions [e.g. number of deliveries
bowled for cricketers] (n = 6, 10 %) [56–61]; days
between/frequency of matches (n = 8, 14 %) [53, 55,
56, 62–66]; heart rate (n = 4, 7 %) [48, 55, 67, 68]; RPE
(n = 2, 3 %) [69, 70]; sRPE (n = 21, 36 %)
[26, 36, 40, 54, 57, 68, 70–84]; number/intensity of colli-
sions (n = 2, 3 %) [64, 65]; distance [both self-reported
and GPS derived] (n = 6, 10 %) [34, 49, 68, 69, 85, 86];
velocity/acceleration GPS-derived measures (n = 2, 3 %)
[38, 85]; metabolic equivalents [MET] (n = 1, 1 %) [87];
the Baecke Physical Activity Questionnaire [88] (n = 1,
1 %) [89]; and a combined volume and intensity ranking
[1–5 scale] (n = 1, 1 %) [90]. A number of fatigue mea-
sures were also used in the 26 studies that investigated
fatigue–injury/illness relationships, including perceptual
wellness scales (n = 13, 50 %) [37, 39, 48–50, 75, 80, 81,
91–95]; sleep quantity/quality (n = 6, 23 %) [39, 48, 71,
80, 95, 96]; immunological markers (n = 12, 46 %)
[49, 54, 73, 82, 83, 87, 89, 90, 97–100]; and stress hormone
levels (n = 6, 23 %) [75, 81–83, 100, 101].
3.2 Definitions of Key Terms
Thirty-seven (54 %) studies defined injury/illness as
‘sports incapacity’ [102, 109 ] events (i.e. the injury/illness
caused time-loss from, or an alteration in, normal training
schedule), whereas 26 studies (38 %) did not distinguish
between what category the injury/illness orientated from,
and defined injury/illness by measures such as the ‘Wis-
consin Upper Respiratory Symptom Survey’ [104] for
upper respiratory illness (URI), or as any pain or disability
experienced by a player during a match or training session
[105] for injury. Only two studies did not clarify which
type of injury/illness definition was used [42, 74].
3.3 Statistical Analysis Methods
A range of statistical analysis methods were also used,
including Pearson correlations [68], mean differences in
load/fatigue between injured and non-injured groups [86], a
Cox proportional regression frailty model [34], logistic
regression with binomial distribution [26], linear regression
[78] and multinomial regression [71], with only one study
adjusting for interactions between load and fatigue mea-
sures [50]. Main et al. used linear mixed modelling to
assess the interactive associations between training expo-
sure and psychological stressors with signs and symptoms
of illness in 30 sub-elite triathletes [50]. In addition, only
two studies provided an indication of the success of load to
predict injury. Specifically, Gabbett [26] achieved this
using a sensitivity and specificity analysis, while Foster
[74] reported the percentage excursions beyond their
derived load thresholds that did not result in illness.
3.4 Sporting Populations
A number of different sporting populations were repre-
sented, from recreational to elite level; namely, American
Football (n = 1) [89]; Australian Football [AF] (n = 6)
[68, 70, 84, 85, 94, 96]; basketball (n = 2) [81, 106];
cricket [fast bowlers] (n = 5) [56–58, 60, 61]; futsal
(n = 1) [82]; soccer (n = 21) [37, 38, 40, 43–47, 53,
55, 62, 63, 67, 71, 75, 83, 92, 93, 95, 100, 101]; road
cycling (n = 1) [73]; rugby league (n = 13) [26, 34, 36,
39, 64–66, 76–80, 94]; rugby union (n = 5) [41, 52, 54, 72,
94]; running (n = 4) [35, 42, 69, 86]; swimming (n = 4)
[49, 74, 97, 98]; triathlon (n = 2) [48, 50]; wheelchair
Training Load and Fatigue Marker Associations with Injury and Illness
123

rugby (n = 1) [99]; and yacht racing (n = 1) [90]. Two
studies used a mix of various sports [51, 87]. The majority
of studies included only male participants (n = 52), with
11 studies including both males and females
[35, 49, 50, 74, 86, 87, 92, 93, 97–99] and three including
females only [42, 83, 106]. Three studies used intervention
[35, 48, 77] and case-control study designs [83, 89, 105],
with nine studies [38, 41, 45–47, 67, 75, 77, 82] investi-
gating injury/illness severity as opposed to injury/illness
incidence only.
4 Discussion
The aim of this systematic review was to investigate the
literature that has examined the longitudinal monitoring of
training load and fatigue data, and its relationship with
injury/illness in sporting populations. Although a number
of common findings were identified from the 68 studies, a
lack of consistency and conflicting views are clearly
apparent within the literature regarding the definition of
key terms, monitoring of the training load and injury and
illness, and monitoring of fatigue markers and their rela-
tionship to injury and illness.
4.1 Reporting of Terms
This review has identified conflicting levels of evidence for
several key terms and their subsequent measures used to
longitudinally monitor the athlete, including training load,
fatigue, injury and illness. The use of multiple definitions
within the literature to describe a singular term may lead to
confusion and misuse at both a conceptual and practical
level by leading to inadequate and inconsistent criteria for
defining samples, and subsequent difficulty in comparing
one study with another [77].
4.1.1 Training Load and Fatigue
Use of the terms training load and fatigue was found to
have the greatest misinterpretation within this review,
primarily the interchangeability of these terms within the
literature. For example, a recent study by Hulin et al. [57]
applying Bannister’s fitness–fatigue model [107] to train-
ing stress-balance (acute:chronic workload ratio) described
fatigue as the acute training load (weekly training load
total), and fitness as the chronic load (previous 4-weekly
total average). Even though this new method of monitoring
training load provided by Hulin et al. [57] has enabled a
greater understanding of the relationship between training
load and injury [108, 131], the application of fitness and
fatigue terminology to represent training workload has
added further confusion. This has resulted in several recent
studies readdressing this issue, whereby the fitness–fatigue
model (formerly training stress balance) has been replaced
by the term acute:chronic workload ratio for this very
reason [108, 131, 143, 145, 146, 148]. The key implication
for researchers and practitioners here is that when training
load and fatigue are used as terms they should be clearly
defined and described as separate entities.
4.1.2 Injury and Illness
Along with the 37 studies that used time-loss injury/illness
definitions, 26 studies have simply reported ‘injury’ or
‘illness’ when summarising key findings, without distin-
guishing between categories. Distinguishing between
which category of injury/illness is an important practical
consideration. For example, Brink et al. [71] noted differ-
ences between traumatic injury, overuse injury and illness
associations with training load, while Orchard et al. [59]
reported training load-related differences for joint, bone,
tendon and muscle injuries. Standardised reporting of
injury/illness incidence will further aid comparison
between studies, as well as generation of any subsequent
meta-analyses [111].
4.1.3 Exposure
Three terms were also used to describe the time spent
participating in a particular training/competition activity;
namely, duration [71], volume [41, 52] and exposure [44].
However, ‘volume’ was used as a term in only two studies
and, in Brooks et al. [41], it was included in the study title
and was used interchangeably with ‘exposure’ in the article
text. Several studies, such as Buist et al. [35] and Main
et al. [50], also used ‘exposure’ in the article text but did
not include it in their titles or keywords.
4.1.4 Perceptual Wellness
It should also be noted that the term ‘perceptual wellness
scales’ covers a range of inventories that attempt to assess
how individuals perceive particular physical and psycho-
logical states. The measures used in the studies included in
this review ranged from simple 1–5 Likert scale ques-
tionnaires for factors such as energy, sleep quality and
mood [80], to more detailed and longer multi-question
tools such as the Recovery-Stress Questionnaire for Ath-
letes (REST-Q) [39] or the Daily Analysis of Life
Demands for Athletes Questionnaire (DALDA) [81].
4.2 Training Load and Injury
Monitoring of training load accounted for 33 of 68 studies
in this review, with the majority from team sports (90 %),
C. M. Jones et al.
123

predominately soccer and rugby league, and the additional
10 % coming from three running studies [35, 42, 86] and
one with a mixed sporting group [51] (Table 1). For
internal training load, the most common measure was sRPE
(n = 21), with exposure the most frequent (n = 15) for
external load. The following section discusses the emerg-
ing moderate evidence for the relationship between training
load and key stages of training and competition, which
highlights where athletes were deemed to be more sus-
ceptible to increased risk of injury [26, 41, 44, 84, 85].
4.2.1 Periods of Training Load Intensification
Periods of training load intensification, such as preseason,
periods of increased competition, and injured players
returning to full training, were found to increase the risk of
injury. For example, athletes returning for preseason are at
significantly greater risk of injury, potentially from the
intensification in training workload and detraining effect
from the offseason [26, 84]. This may result in the athlete
being unable to tolerate the external/internal training load
placed on them. Gabbett [26] also reported that the likeli-
hood of non-contact soft tissue injury was 50–80 % (95 %
CI) in a rugby league preseason when weekly internal
training load (sRPE) was between 3000 and 5000 AU
compared with lower weekly training loads, and that
increased loads during preseason elevated injury rate at a
group level but not during the inseason [105]. Along with
high preseason training loads, periods of training and
match load intensification, such as periods of congested
scheduling, were also investigated in the literature
[7, 15, 16]. However, there was conflicting evidence from
the six studies investigating associations between shortened
recovery cycles and injury. Two studies found shortened
recovery to be related to increased injury [53, 63], one
study related to decreased injury [64], one study found
moderate recovery cycles to have the highest injury risk
[65], one study reported different findings depending on
injury type [66], and one study found no significant asso-
ciations [62].
4.2.2 Changes in Acute Training Load
Another facet of this review was how acute change in
training load (week to week) is associated with injury risk.
Piggot et al. [68] identified that if weekly internal training
load was increased by more than 10 %, this explained
40 % of injury in the subsequent 7 days. The other two
studies to assess acute changes in training load both found
a positive linear relationship between increased acute
internal training load (1245–1250 AU) relative to the pre-
vious week and injury rate in elite contact-sport athletes
[72, 84]. However, in contrast, the investigation by Buist
et al. [35] regarding injury incidence among novice runners
following a graded training programme (running minutes
increased 10.5 %/week) versus a control group (running
minutes increased 23.7 %/week) found no difference
between groups for running-related injury (RRI) rate (odds
ratio 0.8, 95 % CI 0.6–1.3), despite a greater increase in
acute weekly training minutes in the control group. This
finding is in agreement with the study by Nielsen et al. [86]
regarding the development of RRI in novice runners
(n = 60) during a 10-week prospective study. Those who
sustained an RRI showed an increase in weekly training
load of 31.6 %/week when compared with a 22.1 %/week
increase among healthy participants; however, this was
deemed non-significant (p = 0.07). This lack of increase in
injury with increased acute training load may be first
explained by the fact that only external load has been
measured, with all relationships that have been found
adopting internal training load measures. Second, novice
runners may be able to improve at a greater rate than
experienced athletes [113] and are therefore potentially
able to tolerate large relative increases in external training
load due to the absolute external and internal training load
level being low.
4.2.3 Accumulated Training Load
Another key stage of training and competition that was
highlighted was the effect of long-term accumulated
training load (chronic workload) on injury incidence. For
example, Ekstrand et al. [44] compared external load
(training/match exposures) and injury rates between elite
soccer players who participated in the international World
Cup after the domestic season (World-Cup players) and
non-World-Cup players. World-Cup players had greater
match exposure and total (training plus match) exposure
compared with non-World-Cup players during the domes-
tic season (46 vs. 33 matches). Ekstrand et al. [44] then
found that 32 % of this high-exposure group sustained a
drop in performance, with 29 % proceeding to sustain
injury during the World Cup. Moreover, 60 % of players
who had played more than one competition/week in the
10 weeks prior to the World Cup also sustained an injury.
aus der Funten et al. investigated the effect of a reduced
winter break (6.5 weeks down to 3.5 weeks) by comparing
training exposure and injury rates between the two seasons
immediately before and after the change in the length of
the winter break [45]. Even though the reduced winter
break showed athletes having lower training and match
exposures, injury rates were higher, particularly in training.
These studies suggest that how coaches and support staff
manage key stages of training and competition (e.g. the
periodization of starting players, the length of offseason/
midseason breaks) has significant implications regarding
Training Load and Fatigue Marker Associations with Injury and Illness
123

the maintenance of performance and reduction of injury. A
specific example is the management of training/competi-
tion load of team-sport athletes during the domestic season,
taking into account international and/or club competitions
towards the latter end of that season [112].
4.2.4 Training–Injury Prevention Paradox
The results of this study support recent publications on the
training–injury prevention paradox [103, 108, 131, 143,
145–148], whereby moderate relationships were identified
between training loads and injury, yet there was disparity
regarding the direction of findings (i.e. whether increased
training load was associated with decreased or increased
injury). For example, Brooks et al. [41] found that although
higher external acute training volumes (\6.3 h/week vs.
high[ 9.1 h/week) did not necessarily increase elite rugby
union match injury incidence, they were associated with
increased severity of all injuries, especially during the
latter part of the season and the second half of matches.
Linear increases in acute internal training load (1245 AU)
were associated with increased injury risk in a group of
elite rugby union players [72] but decreased injury risk in
28 elite cricketers [57]. As well as linear training load–
injury relationships, ‘U-shaped’ relationships (a phe-
nomenon described in other scientific fields [114, 115])
were evident in several studies. For example, Dennis et al.
[56] showed that bowling between 123 and 188 balls had
lower injury risk than bowling\123/[188 balls. This
U-shaped relationship may be due to low training loads
failing to provide sufficient stimulus for attaining ‘ac-
quired resistance’ to injury [56], and high training loads
fatiguing athletes to the point where musculoskeletal tis-
sue is less able to deal with the forces it encounters during
activity [116, 117]. As with negative and positive linear
training load–injury relationships, an inverted U-shaped
relationship pattern [118, 119] was also elicited. For
example, Arnason et al. [40] found moderate acute match
and training exposures to have higher injury rates when
compared with low and high exposures in elite soccer
players. Collision injury rates were also higher in mod-
erate-length recovery cycles (8 days) versus low
(\8 days) and high ([8 days) recovery cycles in 51 elite
rugby league players.
Another potential reason for the disparity between the
findings of the relationship between training load and injury,
such as the negative/positive linear and U/inverted-U pat-
terns, is that the majority of studies report the magnitude of
external load (e.g. distance or duration), but not the intensity.
Increased external intensity (e.g, velocity of running and
load lifted) and internal intensity (e.g. RPE and heart rate)
will increase the stress placed on the body and therefore
potentially increase injury risk [116, 120, 121]. For example,
both Owen et al. [67] and Mallo and Dellal [55] showed
increases in training intensity, measured via heart rate, to be
associated with increased injury. Gabbett and Ullah [34] also
found that when[9 m of sprinting ([7 m/s) per session was
performed in elite rugby league players, this resulted in a
2.7-fold greater relative risk of sports performance non-
contact, soft-tissue injury when compared with\9 m. In
contrast to distances at sprinting velocity, it was found that
sessions that had greater distances covered for very-low-
intensity (0–1 m/s) and low-intensity running velocities
(1–3 m/s) were associated with a reduced risk of time-loss
non-contact injury. Low training intensity, such as that
reported by Buist et al. [35] (i.e. ‘‘All were advised to run at
a comfortable pace at which they could converse without
losing breath’’), may also account for increases in external
training load of 23.7 %/week not being associated with
increased injury versus 10 %/week increases. These lower
intensities reported by Buist et al. and Gabbett et al. may
have provided a recovery stimulus [8, 122] or allowed
adaptation to occur without excessively fatiguing athletes so
as to increase injury risk [116, 120].
4.2.5 Other Measures of Training Load
In addition to acute training load, other variables such as
chronic load (previous 3- or 4-week total average load)
[57, 85], monotony (total week load/SD of daily load) [74],
strain (monotony 9 total week load) [74] and the acute:-
chronic workload ratio [57] may be more robust predictors
of injury as they objectively account for accumulation of,
and variability in, training load over time. As with acute
load, both U-shaped and inverted-U-shaped relationships
were present, along with positive and negative linear
relationships for cumulative load. For example, Hulin et al.
showed a linear protective effect for high chronic external
load (previous 4-week average) [57], whereas Orchard
et al. [58] showed higher 17-day external bowling loads
([100 overs) to increase injury risk 1.8-fold. Cross et al.
[72] have also noted a U-shaped relationship with 4-week
cumulative internal load, with an apparent increase in risk
associated with higher internal loads ([8651 AU). In
contrast, Colby et al. [85] found an inverted-U external
load–injury relationship using 3-weekly total running dis-
tance; between 73 and 87 km was associated with 5.5-fold
greater intrinsic (non-contact) injury risk in elite AF
players when compared with low (\73 km) and high
([87 km) distances. The difference in patterns highlighted
may be injury type-specific, as highlighted by Orchard
et al. [59] in their review of the effects of cumulated load in
235 elite cricket fast bowlers over the longest period of
study in the current literature (15 years). Previous 3-month
load was found to be protective for tendon injury but
injurious with respect to bone-stress injury. Increased
C. M. Jones et al.
123

Table 2 Summary of findings for studies investigating fatigue associations with injury
References Quality
score/
18
Study
design,
hierarchical
level of
evidence
Sex/sport/level (n) Injury
definitiona/type
Fatigue measures Summary of findings
Brink et al.
[71]
13 Prospective
cohort, 2b
Male/soccer/elite
(53)
Combined/all
injury
REST-Q Injured group vs. non-injured,
ORs (p value): traumatic
injury, psychological stress,
fitness/injury 1.3, overuse
injury, psychological stress,
fitness/injury 1.5
Dennis et al.
[97]
11 Prospective
cohort, 2b
Male/AF/elite (22) Time-loss/all
injury
Sleep exposure and
efficiency (actigraphy)
Injury week vs. two weeks
before injury, two-way
ANOVA (p value): sleep
duration (min) -23 (0.47);
sleep efficiency (%) -3
(0.56); sleep duration and
efficiency interaction (0.62)
Gabbett and
Domrow
[106]b
11 Prospective
cohort, 2b
Male/rugby league/
recreational (68)
Combined/all
injury
Anthropometry (sum of
skinfolds, height, body
mass), linear speed (40-m
acceleration), lower-body
power (vertical jump),
agility (L run), maximal
aerobic power
No clear trends for
anthropometry and fitness
measure changes with
injury rates
Ivarsson and
Johnson
[37]
9 Prospective
cohort, 2b
Male/soccer/sub-
elite (48)
Time-loss/all
injury
Hassles and Uplifts Scale Injured group greater daily
hassle pre-injury than non-
injured group (p = 0.085)
Ivarsson
et al. [93]
10 Prospective
cohort, 2b
Mixed/soccer/elite
(56)
Time-loss/all
injury
Hassles and Uplifts Scale Path analysis: daily hassle,
direct positive effect on
injury frequency***
Ivarsson
et al. [94]
10 Prospective
cohort, 2b
Mixed/soccer/elite
(101)
Time-loss/all
injury
Hassles and Uplifts Scale Change in hassle/uplift
prediction of injury
incidence, latent growth-
curve analysis: daily hassle
?0.33**; daily uplift -
1.87**
Killen et al.
[81]
11 Prospective
cohort, 2b
Male/rugby league/
elite (36)
Combined/all
injury
Perceptual wellness scores
(sleep, food, energy, mood
and stress; 1–10 scale)
Weekly fatigue–injury
relationships, Pearson
correlations (p value): total
perceptual wellness scores
r = 0.71 (0.08)
Kinchington
et al. [95]
10 Prospective
cohort, 2b
Male/AF, rugby
union and rugby
league/elite (182)
Time-loss/all
lower-limb
injury
Lower-Limb Comfort Index
(36-point questionnaire)
Relationships with Lower-
Limb Comfort Index and
injury, Pearson correlations:
poor comfort r = 0.88***;
usual comfort 0.69***; high
comfort 0.39***
Injury incidence/1000 h: poor
comfort 43.5; usual comfort
14.1; high comfort 2.3
Training Load and Fatigue Marker Associations with Injury and Illness
123
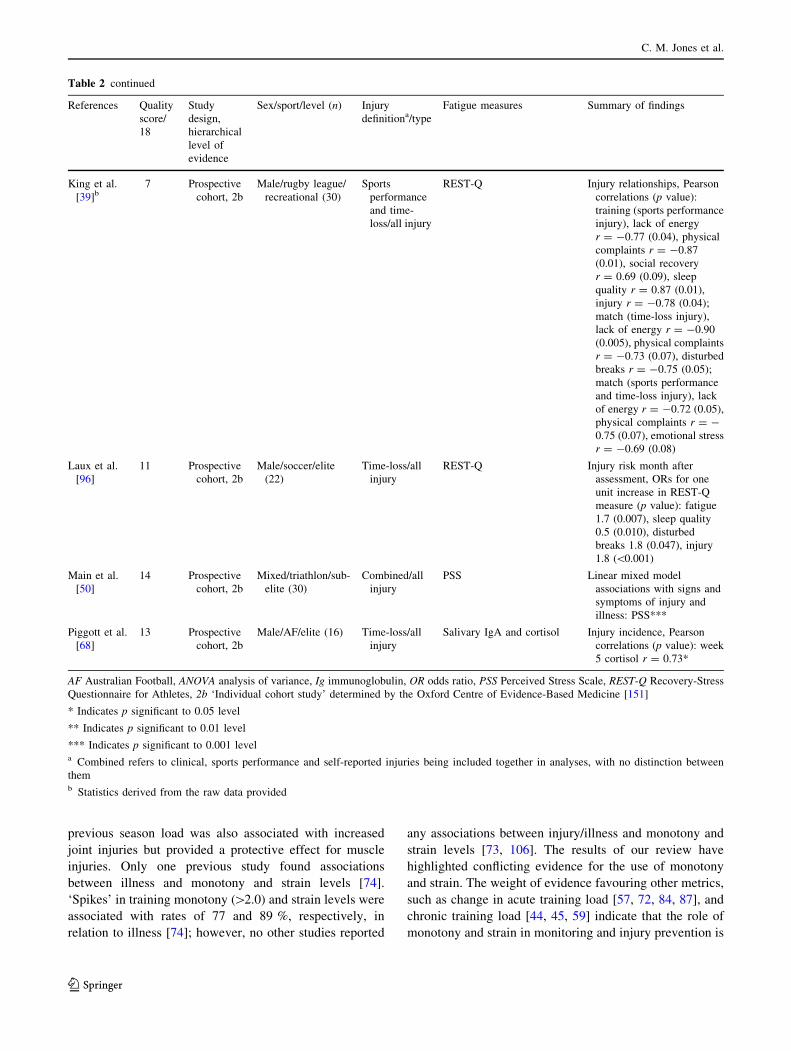
previous season load was also associated with increased
joint injuries but provided a protective effect for muscle
injuries. Only one previous study found associations
between illness and monotony and strain levels [74].
‘Spikes’ in training monotony ([2.0) and strain levels were
associated with rates of 77 and 89 %, respectively, in
relation to illness [74]; however, no other studies reported
any associations between injury/illness and monotony and
strain levels [73, 106]. The results of our review have
highlighted conflicting evidence for the use of monotony
and strain. The weight of evidence favouring other metrics,
such as change in acute training load [57, 72, 84, 87], and
chronic training load [44, 45, 59] indicate that the role of
monotony and strain in monitoring and injury prevention is
Table 2 continued
References Quality
score/
18
Study
design,
hierarchical
level of
evidence
Sex/sport/level (n) Injury
definitiona/type
Fatigue measures Summary of findings
King et al.
[39]b7 Prospective
cohort, 2b
Male/rugby league/
recreational (30)
Sports
performance
and time-
loss/all injury
REST-Q Injury relationships, Pearson
correlations (p value):
training (sports performance
injury), lack of energy
r = -0.77 (0.04), physical
complaints r = -0.87
(0.01), social recovery
r = 0.69 (0.09), sleep
quality r = 0.87 (0.01),
injury r = -0.78 (0.04);
match (time-loss injury),
lack of energy r = -0.90
(0.005), physical complaints
r = -0.73 (0.07), disturbed
breaks r = -0.75 (0.05);
match (sports performance
and time-loss injury), lack
of energy r = -0.72 (0.05),
physical complaints r = -
0.75 (0.07), emotional stress
r = -0.69 (0.08)
Laux et al.
[96]
11 Prospective
cohort, 2b
Male/soccer/elite
(22)
Time-loss/all
injury
REST-Q Injury risk month after
assessment, ORs for one
unit increase in REST-Q
measure (p value): fatigue
1.7 (0.007), sleep quality
0.5 (0.010), disturbed
breaks 1.8 (0.047), injury
1.8 (\0.001)
Main et al.
[50]
14 Prospective
cohort, 2b
Mixed/triathlon/sub-
elite (30)
Combined/all
injury
PSS Linear mixed model
associations with signs and
symptoms of injury and
illness: PSS***
Piggott et al.
[68]
13 Prospective
cohort, 2b
Male/AF/elite (16) Time-loss/all
injury
Salivary IgA and cortisol Injury incidence, Pearson
correlations (p value): week
5 cortisol r = 0.73*
AF Australian Football, ANOVA analysis of variance, Ig immunoglobulin, OR odds ratio, PSS Perceived Stress Scale, REST-Q Recovery-Stress
Questionnaire for Athletes, 2b ‘Individual cohort study’ determined by the Oxford Centre of Evidence-Based Medicine [151]
* Indicates p significant to 0.05 level
** Indicates p significant to 0.01 level
*** Indicates p significant to 0.001 levela Combined refers to clinical, sports performance and self-reported injuries being included together in analyses, with no distinction between
themb Statistics derived from the raw data provided
C. M. Jones et al.
123

Table 3 Summary of findings for studies investigating training load associations with illness
References Quality
score/
18
Study
design,
hierarchical
level of
evidence
Sex/sport/level (n) Illness
definitiona/type
Load measures Summary of findings
Anderson
et al.
[107]
12 Prospective
cohort, 2b
Female/basketball/
elite (12)
Time-loss/all
illness
sRPE (training load,
monotony and strain)
Pearson correlations with
illness: training load, r = 0.10
(NS)
Brink et al.
[71]
13 Prospective
cohort, 2b
Male/soccer/elite
(53)
Time-loss/all
illness
Training and match
duration and load [sRPE]
(load, monotony and
strain)
Injured group vs. non-injured,
ORs for illness (p value):
physical stress, duration 1.12
(NS), load 1.00 (NS),
monotony 2.52 (NS), strain
1.00 (NS)
Cunniffe
et al. [54]
10 Prospective
cohort, 2b
Male/rugby union/
elite (31)
Combined/URI sRPE (training load) and
game number
Visual trend for reduced game
time and increase training load
to precede clusters of URIs
Fahlman
and
Engels
[90]
10 Prospective
cohort, 2b
Male/AmF/elite (75
plus 25 non-
sporting controls)
Combined/
URTI
Baecke Physical Activity
Questionnaire
Football players vs. controls
(p value): time points 2, 3, 6
and 7, higher URTI %*; all
study, physical activity
questionnaire, work ?1 (0.78),
sport ?2 (0.001), leisure -1
(0.64), total ?2.6 (0.003)
Ferrari
et al. [74]
11 Prospective
cohort, 2b
Male/road
cycling/sub-elite
(8 plus male
college athlete
controls)
Combined/URI sRPE (training load,
monotony and strain)
Training strain relationships,
Pearson correlations
(p values): WURSS score,
preparatory phase r = 0.72
(0.03), second competitive
phase r = 0.70 (0.05); total
URTI symptoms r = 0.73
(0.04)
Foster [75] 11 Prospective
cohort, 2b
Mixed/swimming/
mixed (25)
Unknown/all
illness
sRPE (training load,
monotony and strain)
Percentage of illness explained
by spike in individual training
load thresholds: load 84 %,
monotony 77 %, strain 89 %
Percentage of excursions above
individual thresholds that did
not result in illness: load
55 %; monotony 52 %; strain
59 %
Freitas
et al. [76]
11 Prospective
cohort, 2b
Male/soccer/elite
(11)
Combined/URI sRPE (training load) Higher training load in overload
vs. taper phase when URI
incidence was higher
Fricker
et al. [69]
9 Prospective
cohort, 2b
Male/running/elite
(20)
Combined/all
illness
Training load
(distance 9 RPE; self-
reported)
Mean training differences
between week and month pre-
illness and whole study
average (p value): mileage
(km), week -4 (0.65), month
?7 (0.73); intensity (RPE),
week 0.0 (0.87), month 0.0
(0.90); load (RPE�km), week
-5 (0.82), month 32 (0.54);
number of illnesses, Pearson
correlations: weekly mileage,
intensity and load r\ 0.1
Gleeson
et al. [88]
8 Prospective
cohort, 2b
Mixed/mixed
(endurance-
based)/mixed (80)
Combined/all
illness
MET h/week Mean difference, ill vs. illness-
free athletes (p value): training
load (h/week) ?2.3 (0.05)
Training Load and Fatigue Marker Associations with Injury and Illness
123

Table 3 continued
References Quality
score/
18
Study
design,
hierarchical
level of
evidence
Sex/sport/level (n) Illness
definitiona/type
Load measures Summary of findings
Hausswirth
et al. [48]
11 Prospective
cohort, 2b
Male/triathlon/sub-
elite (27)
Combined/
URTI
Training exposure and heart
rate
Frequency of total infection
cases: functional overreaching
group 67 %; acute fatigue
group 22 %; control group
11 %
Mackinnon
and
Hooper
[49]
10 Prospective
cohort, 2b
Mixed/swimming/
elite (24)
Combined/
URTI
Self-reported training
distance (swimming) and
exposure (land-based)
Mean differences, URTI
frequency, overtrained = 1/8
(12.5 %), well trained = 9/16
(56 %)
Main et al.
[50]
14 Prospective
cohort, 2b
Mixed/triathlon/sub-
elite (30)
Combined/all
illness
Training exposure and
sessions/week and
perceived effort and
intensity (1–5 scale)
Linear mixed model
associations with signs and
symptoms of injury and
illness: total number of
sessions/week***, swim
sessions/week*, cycle
sessions/week**, running
sessions/week***
Moreira
et al. [82]
9 Prospective
cohort, 2b
Male/basketball/
elite (15)
Combined/
URTI
sRPE (training load) Mean differences: training load
(sRPE) greater in week 2 vs.
week 4*; number of URTIs
higher in week 2 vs. weeks 1
and 4*
Moreira
et al. [83]
11 Prospective
cohort, 2b
Male/futsal/elite
(12)
Combined/
URTI
sRPE (training load) Mean differences: training load
(sRPE) greater in weeks 1 and
2 vs. weeks 3 and 4*; URTI
severity greater in weeks 1 and
2 vs. week 4*
URTI severity in week 4,
Pearson correlation (p value):
training load r = 0.87*
Mortatti
et al.
[102]
11 Prospective
cohort, 2b
Male/soccer/elite
(14)
Combined/
URTI
Match RPE Mean differences: match RPE
greater in matches 4, 5, 6 and
7 vs. match 1*; URTI
incidence greater before match
2 and 6 vs. match 1*
Neville
et al. [91]
12 Prospective
cohort, 2b
Male/yacht racing/
elite (38)
Time-loss/URI Combined exposure and
intensity ranking (1–5
scale)
URI incidence, Pearson
correlations: training exposure
(sailing and training load)
r = 0.002 (NS)
Piggott
et al. [68]
(2008)
13 Prospective
cohort, 2b
Male/AF/elite (16) Time-loss/all
illness
sRPE (training load,
monotony and strain),
mins[80 % Maximum
heart rate, training
distance (total
and[3.3 m/s; GPS)
Illness incidence relationships,
Pearson correlations
(p values): load (NS),
monotony r = 0.12 (NS),
strain r = 0.12 (NS), distance
(NS), total distance[3.3 m/s
(NS), time[80 % maximum
heart rate (NS)
Percentage of illness explained
by previous spike: load, 42 %;
strain, 25 %; monotony, 33 %
C. M. Jones et al.
123

not currently supported by the literature. A potential
improvement on using acute and chronic load in isolation
to predict injury is the acute:chronic workload ratio mea-
sure as it takes into account both acute and cumulative
workload by expressing acute load relative to the cumu-
lative load to which athletes are accustomed [57, 107]. The
only study to use the acute:chronic workload ratio in this
current review found that an acute:chronic ratio of 2.0,
when compared with 0.5–0.99 for internal and external
training load, was associated with 3.3- to 4.5-fold increased
risk of non-contact injury in elite cricket fast bowlers [57].
4.3 Fatigue Markers and Injury
Only nine studies investigated fatigue–injury relationships,
seven of which used perceptual wellness scales
[37, 39, 80, 92–95]. Three studies used the Hassles and
Uplifts Scale (HUS) [123] and showed greater daily hassles
to be associated with increased injury in soccer players
[37, 92, 93]. Findings from Kinchington et al. [94] support
the notion that increased perceptual fatigue is related to
increased injury as ‘poor’ scores on the Lower-Limb
Comfort Index (LLCI) [124] (i.e. an increase in perceptual
fatigue) were related to increased lower-limb injury
(r = 0.88; p\ 0.001) in elite contact-sport athletes. Laux
et al. [95] further support the positive perceptual fatigue–
injury relationship in their findings, which reported that
increased fatigue and disturbed breaks, as well as decreased
sleep-quality ratings, were related to increased injury. In
contrast, Killen et al. [80] found increased perceptual
fatigue (measured via worse ratings of perceptual sleep,
food, energy, mood, and stress) was associated with
decreased training injury during an elite rugby league
preseason (r = 0.71; p = 0.08). Similarly, King et al. [39]
showed increased perceptual fatigue (measured via various
REST-Q factors) was associated with decreased sports
performance training injuries and time-loss match injuries.
These unexpected findings may be due to the fact that when
players perceive themselves to be less fatigued they may
train/play at higher intensities, increasing injury likelihood
[80]. Of the seven studies mentioned above, six used per-
ceptual wellness scales that take approximately 1–4 min to
complete. Shorter wellness scales, such as the 1–10 ratings
used by Killen et al. [80], that have\1 min completion
time may be easier to implement [125]; therefore, there is
great practical significance in their association with injury.
However, the differences in the levels of evidence for
validation between psychometric tools and ‘bespoke’
Table 3 continued
References Quality
score/
18
Study
design,
hierarchical
level of
evidence
Sex/sport/level (n) Illness
definitiona/type
Load measures Summary of findings
Putlur et al.
[84]
13 Prospective
cohort, 2b
Female/soccer/sub-
elite (14 plus 14
recreational
controls)
Time-loss/all
illness
sRPE (training load,
monotony and strain)
Mean training load, monotony
and strain and illness
frequency greater in soccer vs.
control group; percentage of
illness explained by previous
spike in measure: increased
training load 55 %, increased
monotony and strain 64 %
Veugelers
et al. [70]
11 Prospective
cohort, 2b
Male/AF/elite (45) Time-loss/all
illness
RPE and sRPE (all training
and field training load)
High vs. low training load
(above and below median),
ORs for illness (p values): all
training, sRPE, 1 week 0.30
(0.07); field training, sRPE,
1 week 0.30 (0.07), 2 weeks
0.13 (0.05), RPE, 1 week 0.18
(0.03)
AF Australian Football, AmF American football, GPS global positioning system, MET metabolic equivalent, NS non-significant, OR odds ratio,
RPE rate of perceived exertion, sRPE session rate of perceived exertion, URI upper respiratory illness, URTI upper respiratory tract infection,
WURSS Wisconsin Upper Respiratory Symptoms Scale, 2b ‘Individual cohort study’determined by the Oxford Centre of Evidence-Based
Medicine [151]
* Indicates p significant to 0.05 level
** Indicates p significant to 0.01 level
*** Indicates p significant to 0.001 levela Combined refers to clinical, sports performance and self-reported injuries being included together in analyses, with no distinction between
them
Training Load and Fatigue Marker Associations with Injury and Illness
123
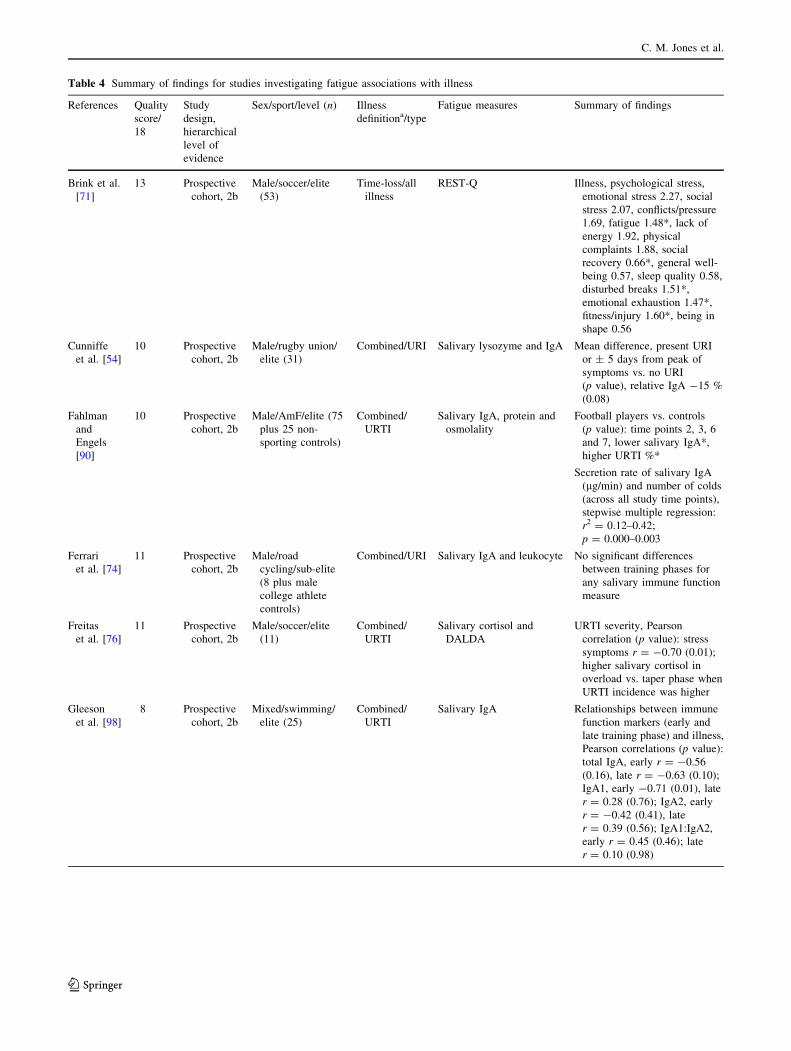
Table 4 Summary of findings for studies investigating fatigue associations with illness
References Quality
score/
18
Study
design,
hierarchical
level of
evidence
Sex/sport/level (n) Illness
definitiona/type
Fatigue measures Summary of findings
Brink et al.
[71]
13 Prospective
cohort, 2b
Male/soccer/elite
(53)
Time-loss/all
illness
REST-Q Illness, psychological stress,
emotional stress 2.27, social
stress 2.07, conflicts/pressure
1.69, fatigue 1.48*, lack of
energy 1.92, physical
complaints 1.88, social
recovery 0.66*, general well-
being 0.57, sleep quality 0.58,
disturbed breaks 1.51*,
emotional exhaustion 1.47*,
fitness/injury 1.60*, being in
shape 0.56
Cunniffe
et al. [54]
10 Prospective
cohort, 2b
Male/rugby union/
elite (31)
Combined/URI Salivary lysozyme and IgA Mean difference, present URI
or ± 5 days from peak of
symptoms vs. no URI
(p value), relative IgA -15 %
(0.08)
Fahlman
and
Engels
[90]
10 Prospective
cohort, 2b
Male/AmF/elite (75
plus 25 non-
sporting controls)
Combined/
URTI
Salivary IgA, protein and
osmolality
Football players vs. controls
(p value): time points 2, 3, 6
and 7, lower salivary IgA*,
higher URTI %*
Secretion rate of salivary IgA
(lg/min) and number of colds
(across all study time points),
stepwise multiple regression:
r2 = 0.12–0.42;
p = 0.000–0.003
Ferrari
et al. [74]
11 Prospective
cohort, 2b
Male/road
cycling/sub-elite
(8 plus male
college athlete
controls)
Combined/URI Salivary IgA and leukocyte No significant differences
between training phases for
any salivary immune function
measure
Freitas
et al. [76]
11 Prospective
cohort, 2b
Male/soccer/elite
(11)
Combined/
URTI
Salivary cortisol and
DALDA
URTI severity, Pearson
correlation (p value): stress
symptoms r = -0.70 (0.01);
higher salivary cortisol in
overload vs. taper phase when
URTI incidence was higher
Gleeson
et al. [98]
8 Prospective
cohort, 2b
Mixed/swimming/
elite (25)
Combined/
URTI
Salivary IgA Relationships between immune
function markers (early and
late training phase) and illness,
Pearson correlations (p value):
total IgA, early r = -0.56
(0.16), late r = -0.63 (0.10);
IgA1, early -0.71 (0.01), late
r = 0.28 (0.76); IgA2, early
r = -0.42 (0.41), late
r = 0.39 (0.56); IgA1:IgA2,
early r = 0.45 (0.46); late
r = 0.10 (0.98)
C. M. Jones et al.
123

Table 4 continued
References Quality
score/
18
Study
design,
hierarchical
level of
evidence
Sex/sport/level (n) Illness
definitiona/type
Fatigue measures Summary of findings
Gleeson
et al. [99]
9 Prospective
cohort, 2b
Mixed/swimming/
elite (25)
Combined/
URTI
Salivary and serum IgA/G/
M and albumin, whole
blood natural killer cell
analysis
Median differences, infected vs.
non-infected (p value): NK cell
count (9109 cells/L) ?0.06
(0.14); pre-exercise, salivary
IgA (mg/L) ?27.5 (0.36),
salivary IgM (mg/L) ?1.2
(0.21), salivary IgG (mg/L)
?3.1 (0.69), salivary albumin
(mg/L) ?6.4 (0.95); post-
exercise, salivary IgA (mg/L)
?12.0 (0.26), salivary IgM
(mg/L) ?0.3 (0.97), salivary
IgG (mg/L) -0.4 (0.64),
salivary albumin (mg/L) ?8.3
(0.69)
Gleeson
et al. [88]
8 Prospective
cohort, 2b
Mixed/mixed
(endurance-
based)/mixed (80)
Combined/all
illness
Blood cell counts,
lymphocyte subsets,
antigen-stimulated
cytokine production,
plasma immunoglobulins,
salivary IgA
Mean difference, ill vs. illness-
free athletes (p value): saliva
flow rate (mL/min) -0.18
(0.004); salivary IgA secretion
rate (mg/min) -31.0 (0.02);
IgM (g/L) ?0.45 (0.03); IL-2
production (pg/mL) ?113
(0.06); IL-4 production (pg/
mL) ?3.9 (0.02); IL-6
production (pg/mL) ?62
(0.09); IL-10 production (pg/
mL) ?4.4 (0.008); IFN-cproduction (pg/mL) ?14
(0.06)
Hausswirth
et al. [48]
11 Prospective
cohort, 2b
Male/triathlon/sub-
elite (27)
Combined/
URTI
POMS, sleep duration and
efficiency (actigraphy)
Frequency of total infection
cases: functional overreaching
group 67 %; acute fatigue
group 22 %; control group
11 %
Leicht et al.
[100]
9 Prospective
cohort, 2b
Mixed/wheelchair
rugby/elite (14)
Combined/
URS
Salivary IgA Median difference in IgA
secretion rate: illness vs. no
illness
(p = 0.19); illness within
2 weeks of sampling vs. no
illness (NS)
Mackinnon
and
Hooper
[49]
10 Prospective
cohort, 2b
Mixed/swimming/
elite (24)
Combined/
URTI
Perceptual wellness
(fatigue, stress, sleep
disturbance, muscle
soreness; 1–7 scale),
plasma glutamine
Mean differences, overtrained
vs. well-trained athletes
(p value): perceptual wellness
ratings, increased fatigue
(0.02), decreased sleep quality
(0.05), increased stress (0.04);
plasma glutamine, time 2 -
23 %*, time 3 -26 % (NS);
URTI frequency,
overtrained = 1/8 (12.5 %),
well trained = 9/16 (56 %)
Main et al.
[50]
14 Prospective
cohort, 2b
Mixed/triathlon/sub-
elite (30)
Combined/all
illness
PSS Linear mixed model associations
with signs and symptoms of
injury and illness: PSS***
Training Load and Fatigue Marker Associations with Injury and Illness
123
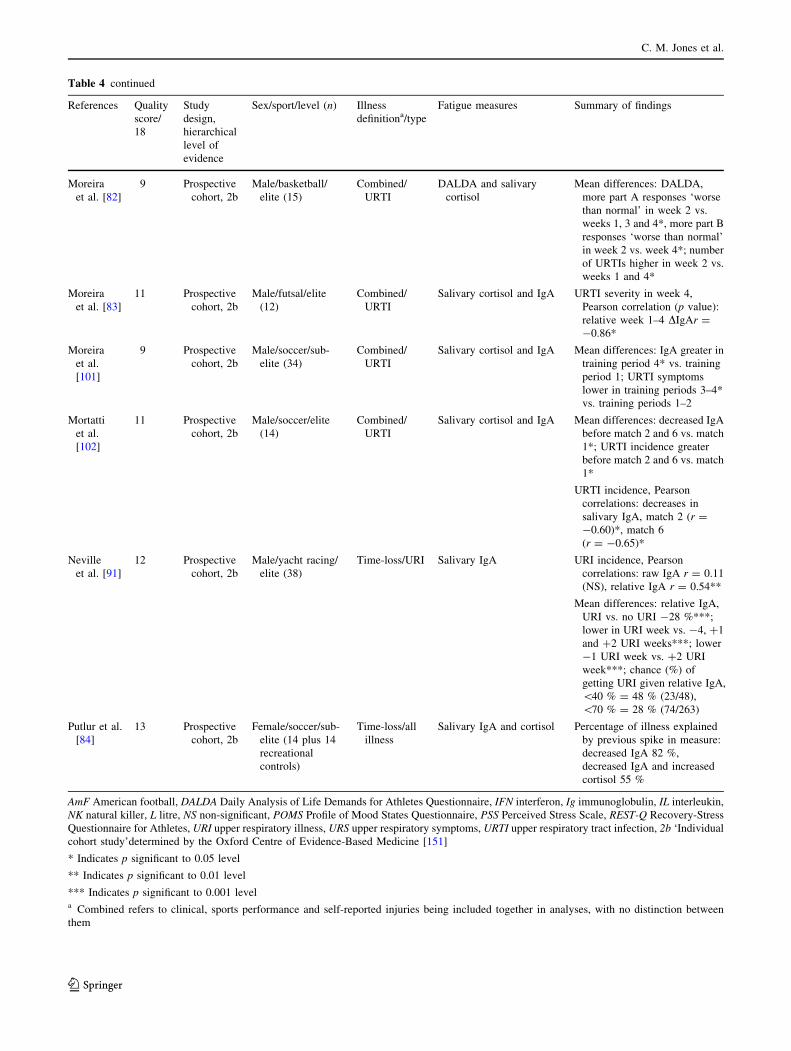
Table 4 continued
References Quality
score/
18
Study
design,
hierarchical
level of
evidence
Sex/sport/level (n) Illness
definitiona/type
Fatigue measures Summary of findings
Moreira
et al. [82]
9 Prospective
cohort, 2b
Male/basketball/
elite (15)
Combined/
URTI
DALDA and salivary
cortisol
Mean differences: DALDA,
more part A responses ‘worse
than normal’ in week 2 vs.
weeks 1, 3 and 4*, more part B
responses ‘worse than normal’
in week 2 vs. week 4*; number
of URTIs higher in week 2 vs.
weeks 1 and 4*
Moreira
et al. [83]
11 Prospective
cohort, 2b
Male/futsal/elite
(12)
Combined/
URTI
Salivary cortisol and IgA URTI severity in week 4,
Pearson correlation (p value):
relative week 1–4 DIgAr =-0.86*
Moreira
et al.
[101]
9 Prospective
cohort, 2b
Male/soccer/sub-
elite (34)
Combined/
URTI
Salivary cortisol and IgA Mean differences: IgA greater in
training period 4* vs. training
period 1; URTI symptoms
lower in training periods 3–4*
vs. training periods 1–2
Mortatti
et al.
[102]
11 Prospective
cohort, 2b
Male/soccer/elite
(14)
Combined/
URTI
Salivary cortisol and IgA Mean differences: decreased IgA
before match 2 and 6 vs. match
1*; URTI incidence greater
before match 2 and 6 vs. match
1*
URTI incidence, Pearson
correlations: decreases in
salivary IgA, match 2 (r =
-0.60)*, match 6
(r = -0.65)*
Neville
et al. [91]
12 Prospective
cohort, 2b
Male/yacht racing/
elite (38)
Time-loss/URI Salivary IgA URI incidence, Pearson
correlations: raw IgA r = 0.11
(NS), relative IgA r = 0.54**
Mean differences: relative IgA,
URI vs. no URI -28 %***;
lower in URI week vs. -4, ?1
and ?2 URI weeks***; lower
-1 URI week vs. ?2 URI
week***; chance (%) of
getting URI given relative IgA,
\40 % = 48 % (23/48),
\70 % = 28 % (74/263)
Putlur et al.
[84]
13 Prospective
cohort, 2b
Female/soccer/sub-
elite (14 plus 14
recreational
controls)
Time-loss/all
illness
Salivary IgA and cortisol Percentage of illness explained
by previous spike in measure:
decreased IgA 82 %,
decreased IgA and increased
cortisol 55 %
AmF American football, DALDA Daily Analysis of Life Demands for Athletes Questionnaire, IFN interferon, Ig immunoglobulin, IL interleukin,
NK natural killer, L litre, NS non-significant, POMS Profile of Mood States Questionnaire, PSS Perceived Stress Scale, REST-Q Recovery-Stress
Questionnaire for Athletes, URI upper respiratory illness, URS upper respiratory symptoms, URTI upper respiratory tract infection, 2b ‘Individual
cohort study’determined by the Oxford Centre of Evidence-Based Medicine [151]
* Indicates p significant to 0.05 level
** Indicates p significant to 0.01 level
*** Indicates p significant to 0.001 levela Combined refers to clinical, sports performance and self-reported injuries being included together in analyses, with no distinction between
them
C. M. Jones et al.
123

wellness questionnaires are important factors when con-
sidering their use in an applied setting. The benefits of
using REST-Q compared with shorter wellness scale
questionnaires reflect the fact that REST-Q has undergone
extensive tests of rigor, whereas the latter are not as well-
validated [39, 139]. Examination of subjective fatigue
markers also indicates that current self-report measures
fare better than their commonly used objective counterparts
[139]. In particular, subjective well-being typically wors-
ened with an acute increase in training load and chronic
training load, whereas subjective well-being demonstrated
improvement when acute training load decreased [139].
Sleep is a vital part of the body’s recovery process
[126, 127], therefore it was surprising that only four studies
investigated its relationship with injury [39, 80, 95, 96].
Three studies assessed sleep–injury relationships via sleep-
quality ratings [39, 80, 95], with only Dennis et al. [96]
investigating objective measures of sleep quality and
quantity in relation to injury. No significant differences in
sleep duration and efficiency were reported between the
week of injury and 2 weeks prior to injury.
4.4 Individual Characteristics and Injury
An important finding from this review is that the individual
characteristics of the athlete [36, 128] will significantly
impact the internal load and stress placed on the body and
thus the athlete’s susceptibility to injury. For example, an
athlete’s aerobic fitness level will impact the internal
workload they place on themselves. A recent study in AF
players reported that for every 1 s slower on the 2-km time-
trial performance, there was an increase in sRPE of 0.2.
Therefore, the better the time trial performance of the
individual, the easier the sessions of the same distances
were rated [129]. Furthermore, older athletes or athletes
with a previous injury are at a significantly greater risk of
injury than other members of their population
[27, 40, 84, 112, 130]. A potential reason for this finding is
that it is likely older players have experienced a greater
number of injuries across the course of their careers than
the less experienced younger players [131]. Other indi-
vidual characteristics, such as body composition, have a
significant impact on injury. Zwerver et al. [128] reported a
higher risk of RRI among persons with a body mass index
(BMI) above 25 kg/m2, which is in agreement with Buist
et al., who reported higher BMI scores in injured runners
versus non-injured runners (BMI 27.6 vs. 24.8 kg/m2;
p = 0.03) [35]. In addition, decreases in aerobic power and
muscular power, as well as increases in skinfold thickness
towards the end of the playing season, have been reported
alongside increased match injury rates in recreational
rugby league players [36]. Collectively, these findings
suggest that the load/fatigue–injury associations described
in this review are significantly influenced by the individual
characteristics of the athlete, such as strength, fitness, body
composition, playing level, age and injury history, as they
determine the amount of internal workload and stress
placed on the body and therefore the subsequent reduction
or increase in the risk of injury [27, 35, 36, 40, 84,
112, 128–130].
4.5 Training Load and Illness
Monitoring of training load and illness accounted for 17 of
68 studies in this review, with the majority measuring
salivary immunoglobulin (Ig) A (s-IgA) and/or cortisol
(n = 13) as a marker of immune function. The following
section discusses the relationship between monitoring
training load and key phases identified with increasing the
susceptibility of the athlete to illness.
4.5.1 Intensification of Training Load and Illness
Internal training load, measured via sRPE, explained
between 77 and 89 % of illness prevalence over a period of
6 months to 3 years in a mixed-ability group of swimmers
[74]. Piggott et al. [68] identified that if weekly internal
training load was increased by more than 10 %, this
explained 40 % of illness and injury in the subsequent
7 days. This could be associated with elevated psycho-
logical stressors from increased internal training load and
factors that were significantly associated with signs and
symptoms of injury and illness [50]. Cunniffe et al. [54]
reported that periods of increased training intensity and
reduced game activity just prior to competition resulted in
peaks in upper respiratory tract infection (URTI) in elite
rugby union players. Despite the consensus that intensified
periods in load or reduced game/training activity increased
URTI, there was a contradiction in the literature as to
whether increases in external load and markers of immune
function were associated with the risk of illness
[69, 97–99]. For example, Fricker et al. [69] found no
significant differences in mean weekly and monthly run-
ning distances in elite male distance runners who self-re-
ported illness versus those who did not. With the exception
of Fricker et al. [69] and Veugelers et al. [70], the majority
of studies that have found no association between load and
illness have used mixed ability or disability populations,
only measured external load, and used self-reported illness.
Therefore, as the individual responses to load will vary
dramatically with athlete training level, this may impact on
illness rates. Furthermore, having athletes self-report ill-
nesses rather than being diagnosed by a team doctor, and
self-reporting load rather than having it measured objec-
tively in terms of external load, may have a significant
impact on the results (depending on the individual’s
Training Load and Fatigue Marker Associations with Injury and Illness
123

perception of what illness is and the potential for over- or
underreporting of the amount of training exposure).
4.6 Fatigue and Illness
Mackinnon and Hooper [49] found the incidence of URTI
to be lower in athletes who reported increased perceptual
fatigue via the 1–7 wellness rating scales (sleep quality,
stress and feelings of fatigue). This study concurs with
Killen et al. [80] who found lower injury rates in rugby
league athletes who reported increased perceptual fatigue
via perceptual wellness scales of 1–10. This is further
supported by Veugelers et al. [70] who found that increased
perceptual fatigue in their elite AF high internal training
load group caused a protective effect against non-contact
injury and illness when compared with the low internal
training load group. This reduced injury/illness could be
possibly due to greater fatigue resulting in a reduction in
intensity, as a result of the physiological and psychological
stress placed on the body. Another possibility is that the
high internal training load group adapted to the load and
were therefore able to tolerate higher internal load at a
reduced risk of injury/illness. Finally, the lower training
load associated with illness may be due to the fact that
athletes could have had their training load modified as a
result of being ill earlier in the week.
4.6.1 Markers of Immune Function and Illness
A primary finding was the association between s-IgA
reduction and increased salivary cortisol due to periods of
greater training intensities or reduced game/training
activity (preseason, deload weeks), resulting in significant
increases in URTI [54, 81, 83, 87, 90, 98, 101]. For
example, rugby players who sustained a URTI, when
compared with players who did not, had a reduction in
s-IgA by 15 % [54]. However, there was contradiction
within the literature on whether reduction in s-IgA was
linked with URTI as Ferrari et al. [73] found no significant
association between training load phase, s-IgA and sus-
tained URTI in sub-elite male road cyclists. This is in
agreement with Leicht et al. [99] who found secretion rate
had no significant relationship with s-IgA responses and
subsequent occurrence of upper respiratory symptoms in
elite wheelchair rugby athletes.
4.7 The Latent Period of Illness
A key phase identified with illness was the latency period,
which can be defined as the time interval between a
stimulus and a reaction [13]. At the onset of a stimulus,
such as a spike in training load, reductions can occur in
s-IgA or the elevation of salivary cortisol levels for an
extended period of 7–21 days. Failure of these markers to
return to baseline values during this time period was
associated with a 50 % increased risk of URTI
[68, 90, 100], which would explain why the majority of
illnesses reported in this review occurred during or after
week 4 of intensified training [81, 83, 90, 100, 101].
Athletes who do not recover from the initial spike in
training load experience an extended period of suppres-
sion of immune function, placing the athlete at a signif-
icant risk of illness. This finding has implications for
practitioners; first, to avoid unplanned spikes in training
load and, second, to adjust training loads when an athlete
is immunosuppressed to allow the markers of immune
system to return to baseline values.
4.8 Limitations
Of the 68 studies included in this review, 39 were only
highlighted from the search criteria, with an additional 29
included from searching references of the identified stud-
ies, which could have led to the risk of studies not being
included. Furthermore, during the manuscript review pro-
cess, a number of key studies and reviews were published
that would have satisfied the inclusion criteria and provided
the most up-to-date research [13, 131, 144, 146, 148]. For
example, several papers readdressed terminology issues in
relation to use of the training stress balance measure, and
defined it as the acute:chronic workload ratio
[108, 143, 145, 146, 148].
4.9 Directions for Future Research
4.9.1 Definition of Load, Fatigue, Injury and Soreness
Even with the relatively small amount of research under-
taken regarding longitudinal monitoring, the research
detailed in this review clearly highlights that relationships
exist between longitudinally monitored training load and
fatigue variables and injury or illness. Further research is
now required to establish a common language for load,
fatigue, injury and illness, as well as exploring these rela-
tionships within more specialised populations, and with a
wider range of load, fatigue, injury and illness measures.
4.9.2 Training Load and Fatigue Interactions
A clear gap identified in the literature from the current
review is the lack of assessment of load–fatigue interac-
tions in association with injury/illness, as the fatigue state
of an individual will essentially define the load they can
tolerate before injury/illness risk increases [121, 132]. For
example, a case study on a female masters track and field
athlete found that, despite no increase in load, signs of
C. M. Jones et al.
123

overreaching increased significantly due to external psy-
chological stress [133]. Therefore, further study is needed
combining both load and fatigue in analyses, as per the
study by Main et al. [50].
4.9.3 Monitoring of Neuromuscular Function
The lack of monitoring of NMF variables in respect to
injury and illness (n = 0 of the 68 studies included within
this review) was highly surprising given the strong theo-
retical rationale for its association with injury risk
[120, 134] and its common use in the recovery and acute
monitoring literature [7, 135, 136] in light of its strong
association with performance variables such as speed
[137]. Future research should investigate the relationship
between NMF variables and training load, and their con-
sequent associations between injury and illness; however,
there is currently no high-level evidence to support its use
in monitoring as mechanism-based reasoning represents the
lowest form of evidence [151].
4.9.4 Perceptual Wellness
Of the 13 studies that used perceptual wellness measures,
11 adopted inventories that take approximately 1–4 min to
complete. In a busy elite athlete environment or, con-
versely, a recreational/sub-elite environment where
resources are stretched, inventories of such length may be
impractical to implement [125]. Shorter wellness scales,
such as the 1–10 rating scales used by Killen et al. [80] and
the 1–7 rating scales used by MacKinnon and Hooper [49],
that have\1 min completion time may be easier to
implement [125]. Consequently, more investigation is
needed using shortened perceptual wellness scales as there
is great practical significance in their association with
injury; however, these should undergo suitable tests of their
validation in order to ensure they are able to detect the
intended domains and constructs in a rigorous manner.
4.9.5 Latent Period of Injury
This review highlighted a lack of studies reporting the
latency period of injury. Future studies evaluating the
relationship between training load and time frame of injury
response will provide information that allows practitioners
to adjust training loads during the injury time frame as an
injury prevention measure [149].
4.9.6 Injury and Illness
Monitoring of load–fatigue and injury and illness
accounted for only 6 of the 68 studies in this review.
Although studies investigating both injury and illness
accounted for\10 % of the research in this review, the
majority (five of six) were above the average quality
score (13 vs. 11) (Table 3). Future research should
therefore look to measure both injury and illness, not
only because of the higher quality scores accorded to
studies that did so in this review but also because of the
different relationships they will highlight between load
and fatigue markers and subsequent injury risk and
performance outcomes [29, 110, 138].
4.9.7 Monitoring of Female Athletes
This review has highlighted a lack of studies with female
athletes (13 of 68 studies). Further research is essential
to understand how the hormonal fluctuations during
various stages of the menstrual cycle may influence
tolerance to training load, and the subsequent effects on
markers of immune function and fatigue markers. This
will provide valuable information on load and fatigue
and inform the periodization of female athletes to help
reduce the risk of injury/illness during periods of greater
susceptibility.
4.9.8 Monitoring of Adolescent Athletes
Although this review has highlighted a lack of studies in
adolescents, a recent review found that the relationship
between workload, physical performance, injury and illness
in adolescent male football players was non-linear and that
the individual response to a given workload is highly
variable [150]. Further investigation into the effects of
maturation and training loads, and their relationship
between performance, injury and illness, would be
invaluable for practitioners working with pediatric athletes.
4.9.9 Session Rate of Perceived Exertion
The widespread use of sRPE as a measure of internal
training load is most likely due to its relative ease of
implementation compared with other internal load mea-
sures, such as heart rate or external load measures from
GPS systems [17]. Indeed, a recent review has highlighted
that current self-report measures fare better than their
commonly used objective counterparts [139]. To advance
the use of self-reported measures, splitting sRPE into
internal respiratory and muscular load is also warranted to
observe how such discrepancies affect injury/illness
[140, 141]. The injury/illness mechanisms will differ
between these two systems and such differential measure-
ment of internal load will allow more specified information
for prevention and recovery [140].
Training Load and Fatigue Marker Associations with Injury and Illness
123

4.9.10 Severity of Injury
Only a small number of studies in this review investigated
the severity of injury [38, 41, 45–47, 67, 77] and illness
[75, 82], with only two studies quantifying the contact ele-
ments of training/competition [64, 65]. Given contact inju-
ries are often more severe than non-contact injuries [41], and
the amount of time lost from training/competition is one of
the major negative impacts of injury/illness, more studies are
needed detailing load/fatigue–injury/illness severity and the
contact aspects of training/competition. Information on
injury/illness severity relationships will allow coaches and
support staff to make even more informed decisions about
the risk of going beyond thresholds of load/fatigue, such that
they may accept an increased risk of sports performance or
low-severity injuries, but not accept increases in the risk of
more severe injuries.
5 Conclusions
This paper provides a comprehensive review of the litera-
ture that has reported the monitoring of longitudinal
training load and fatigue and its relationship with injury
and illness. The current findings highlight disparity in the
terms used to define training load, fatigue, injury and ill-
ness, as well as a lack of investigation of fatigue and
training load interactions. Key stages of training and
competition where the athlete is at an increased risk of
injury/illness risk were identified. These included periods
of training load intensification, accumulation of training
load and acute change in load. Modifying training load
during these periods may help reduce the potential for
injury and illness. Measures such as acute change in
training load, cumulative training load, monotony, strain
and acute:chronic workload ratio may better predict injury/
illness than simply the use of acute training load. Acute
change in training load showed a clear positive relationship
with injury, with other load/fatigue measures producing
mixed associations, particularly acute and cumulative
training load. The measure most clearly associated with
illness was s-IgA, while relationships for acute training
load, monotony, strain and perceptual wellness were
mixed. The prescription of training load intensity and
individual characteristics (e.g. fitness, body composition,
playing level, injury history and age) may account for the
mixed findings reported as they impact the internal training
load placed on the athlete’s body and, therefore, suscepti-
bility to injury/illness.
Compliance with Ethical Standards
Funding No sources of funding were used to assist in the preparation
of this article.
Conflict of interest Christopher Jones, Peter Griffiths, and Stephen
Mellalieu declare they have no conflicts of interest relevant to the
content of this systematic review.
Open Access This article is distributed under the terms of the
Creative Commons Attribution 4.0 International License (http://
creativecommons.org/licenses/by/4.0/), which permits unrestricted
use, distribution, and reproduction in any medium, provided you give
appropriate credit to the original author(s) and the source, provide a
link to the Creative Commons license, and indicate if changes were
made.
References
1. Cunniffe B, Hore AJ, Whitcombe DM, et al. Time course of
changes in immuneoendocrine markers following an interna-
tional rugby game. Eur J Appl Physiol. 2010;108(1):113–22.
2. McLellan CP, Lovell DI, Gass GC. Markers of postmatch fati-
gue in professional rugby league players. J Strength Cond Res.
2011;25(4):1030–9.
3. Takarada Y. Evaluation of muscle damage after a rugby match
with special reference to tackle plays. Br J Sports Med.
2003;37(5):416–9.
4. McLellan CP, Lovell DI, Gass GC. Biochemical and endocrine
responses to impact and collision during elite rugby league
match play. J Strength Cond Res. 2011;25(6):1553–62.
5. McLellan CP, Lovell DI, Gass GC. Creatine kinase and endo-
crine responses of elite players pre, during, and post rugby
league match play. J Strength Cond Res. 2010;24(11):2908–19.
6. Cunniffe B, Proctor W, Baker JS, et al. An evaluation of the
physiological demands of elite rugby union using global posi-
tioning system tracking software. J Strength Cond Res.
2009;23(4):1195–203.
7. West DJ, Finn CV, Cunningham DJ, et al. Neuromuscular
function, hormonal, and mood responses to a professional rugby
union match. J Strength Cond Res. 2014;28(1):194–200.
8. Gill ND, Beaven C, Cook C. Effectiveness of post-match
recovery strategies in rugby players. Br J Sports Med.
2006;40(3):260–3.
9. Chiu LZ, Barnes JL. The fitness-fatigue model revisited:
implications for planning short-and long-term training. Strength
Cond J. 2003;25(6):42–51.
10. Gamble P. Physical preparation for elite-level rugby union
football. Strength Cond J. 2004;26(4):10–23.
11. Gamble P. Periodization of training for team sports athletes.
Strength Cond J. 2006;28(5):56–66.
12. Impellizzeri FM, Rampinini E, Marcora SM. Physiological
assessment of aerobic training in soccer. J Sports Sci.
2005;23(6):583–92.
13. Drew MK, Finch CF. The relationship between training load and
injury, illness and soreness: a systematic and literature review.
Sports Med. 2016;46(6):861–83.
14. Allen DG, Lamb GD, Westerblad H. Skeletal muscle fatigue:
cellular mechanisms. Physiol Rev. 2008;88(1):287–332.
15. Meeusen R, Duclos M, Foster C, et al. Prevention, diagnosis,
and treatment of the overtraining syndrome: joint consensus
statement of the European College of Sport Science and the
American College of Sports Medicine. Med Sci Sports Exerc.
2013;45(1):186–205.
16. Johnston RD, Gabbett TJ, Jenkins DG. Influence of an intensi-
fied competition on fatigue and match performance in junior
rugby league players. J Sci Med Sport. 2013;16(5):460–5.
17. Halson SL. Monitoring training load to understand fatigue in
athletes. Sports Med. 2014;44(2):S139–47.
C. M. Jones et al.
123

18. Timpka T, Jacobsson J, Bickenbach J, et al. What is a sports
injury? Sports Med. 2014;44(4):423–8.
19. Timpka T, Jacobsson J, Ekberg J, et al. Meta-narrative analysis
of sports injury reporting practices based on the Injury Defini-
tions Concept Framework (IDCF): a review of consensus
statements and epidemiological studies in athletics (track and
field). J Sci Med Sport. 2015;18(6):643–50.
20. Noakes TD. Fatigue is a brain-derived emotion that regulates the
exercise behavior to ensure the protection of whole body
homeostasis. Front Physiol. 2012;3:82.
21. Mann TN, Lamberts RP, Lambert MI. High responders and low
responders: Factors associated with individual variation in
response to standardized training. Sports Med. 2014;44(8):
1113–24.
22. McLean BD, Petrucelli C, Coyle EF. Maximal power output and
perceptual fatigue responses during a Division I female colle-
giate soccer season. J Strength Cond Res. 2012;26(12):3189–96.
23. Williams S, Trewartha G, Kemp S, et al. A meta-analysis of
injuries in senior men’s professional rugby union. Sports Med.
2013;43(10):1043–55.
24. Dupont G, McCall A, Prieur F, et al. Faster oxygen uptake
kinetics during recovery is related to better repeated sprinting
ability. Eur J Appl Physiol. 2010;110(3):627–34.
25. Taylor T, West DJ, Howatson G, et al. The impact of neuro-
muscular electrical stimulation on recovery after intensive,
muscle damaging, maximal speed training in professional team
sports players. J Sci Med Sport. 2015;18(3):328–32.
26. Gabbett TJ. The development and application of an injury pre-
diction model for noncontact, soft-tissue injuries in elite colli-
sion sport athletes. J Strength Cond Res. 2010;24(10):2593–603.
27. Brooks JH, Fuller C, Kemp S, et al. Epidemiology of injuries in
english professional rugby union: part 1 match injuries. Br J
Sports Med. 2005;39(10):757–66.
28. Podlog L, Buhler CF, Pollack H, et al. Time trends for injuries
and illness, and their relation to performance in the National
Basketball Association. J Sci Med Sport. 2015;18(3):278–82.
29. Raysmith BP, Drew MK. Performance success or failure is
influenced by weeks lost to injury and illness in elite Australian
Track and Field athletes: a 5-year prospective study. J Sci Med
Sport. 2016 (Epub 7 Jan 2016).30. Higgins JP, Green S. Cochrane handbook for systematic reviews
of interventions. Chichester: The Cochrane Library; 2006.
31. Hume PA, Lorimer A, Griffiths PC, et al. Recreational snow-
sports injury risk factors and countermeasures: a meta-analysis
review and Haddon matrix evaluation. Sports Med. 2015;45:
1175–90.
32. Bizzini M, Childs JD, Piva SR, et al. Systematic review of the
quality of randomized controlled trials for patellofemoral pain
syndrome. J Orthop Sports Phys Ther. 2003;33(1):4–20.
33. Maher CG, Sherrington C, Herbert RD, et al. Reliability of the
PEDro scale for rating quality of randomized controlled trials.
Phys Ther. 2003;83(8):713–21.
34. Gabbett TJ, Ullah S. Relationship between running loads and
soft-tissue injury in elite team sport athletes. J Strength Cond
Res. 2012;26(4):953–60.
35. Buist I, Bredeweg SW, Van Mechelen W, et al. No effect of a
graded training program on the number of running-related
injuries in novice runners a randomized controlled trial. Am J
Sports Med. 2008;36(1):33–9.
36. Gabbett TJ. Changes in physiological and anthropometric
characteristics of rugby league players during a competitive
season. J Strength Cond Res. 2005;19(2):400–8.
37. Ivarsson A, Johnson U. Psychological factors as predictors of
injuries among senior soccer players: a prospective study.
J Sports Sci Med. 2010;9(2):347.
38. Carling C, Le Gall F, McCall A, et al. Squad management,
injury and match performance in a professional soccer team over
a championship-winning season. Eur J Sports Sci. 2015;15(7):
573–81.
39. King D, Clark T, Kellmann M. Changes in stress and recovery
as a result of participating in a premier rugby league represen-
tative competition. Int J Sports Sci Coach. 2010;5(2):223–37.
40. Arnason A, Sigurdsson SB, Gudmundsson A, et al. Risk factors
for injuries in football. Am J Sports Med. 2004;32(1 Suppl):5S–
16S.
41. Brooks JH, Fuller CW, Kemp SP, et al. An assessment of
training volume in professional rugby union and its impact on
the incidence, severity, and nature of match and training inju-
ries. J Sports Sci. 2008;26(8):863–73.
42. Duckham RL, Brooke-Wavell K, Summers GD, et al. Stress
fracture injury in female endurance athletes in the United
Kingdom: a 12-month prospective study. Scand J Med Sci
Sports. 2015;25(6):854–9.
43. Dvorak J, Junge A, Chomiak J, et al. Risk factor analysis for
injuries in football players possibilities for a prevention pro-
gram. Am J Sports Med. 2000;28(5):S69–74.
44. Ekstrand J, Walden M, Hagglund M. A congested football cal-
endar and the wellbeing of players: correlation between match
exposure of European footballers before the World Cup 2002
and their injuries and performances during that World Cup. Br J
Sports Med. 2004;38(4):493–7.
45. aus der Funten K, Faude O, Lensch J, et al. Injury characteristics
in the German professional male soccer leagues after a short-
ened winter break. J Athl Train. 2014;49(6):786–93.
46. Hagglund M, Walden M, Ekstrand J. Exposure and injury risk in
Swedish elite football: a comparison between seasons 1982 and
2001. Scand J Med Sci Sports. 2003;13(6):364–70.
47. Hagglund M, Walden M, Ekstrand J. Injury incidence and dis-
tribution in elite football: a prospective study of the Danish and
the Swedish top divisions. Scand J Med Sci Sports.
2005;15(1):21–8.
48. Hausswirth C, Louis J, Aubry A, et al. Evidence of disturbed
sleep and increased illness in overreached endurance athletes.
Med Sci Sports Exerc. 2014;46(5):1036–45.
49. Mackinnon LT, Hooper S. Plasma glutamine and upper respi-
ratory tract infection during intensified training in swimmers.
Med Sci Sports Exerc. 1996;28(3):285–90.
50. Main L, Landers G, Grove J, et al. Training patterns and neg-
ative health outcomes in triathlon: longitudinal observations
across a full competitive season. J Sports Med Phys Fit.
2010;50(4):475–85.
51. van Mechelen W, Twisk J, Molendijk A, et al. Subject-related
risk factors for sports injuries: a 1-yr prospective study in young
adults. Med Sci Sports Exerc. 1996;28(9):1171–9.
52. Viljoen W, Saunders CJ, Hechter GD, et al. Training volume
and injury incidence in a professional rugby union team. S Afr J
Sports Med. 2009;21(3):97–101.
53. Bengtsson H, Ekstrand J, Hagglund M. Muscle injury rates in
professional football increase with fixture congestion: an
11-year follow-up of the UEFA Champions League injury study.
Br J Sports Med. 2013;47(12):743–7.
54. Cunniffe B, Griffiths H, Proctor W, et al. Mucosal immunity and
illness incidence in elite rugby union players across a season.
Med Sci Sports Exerc. 2011;43(3):388–97.
55. Mallo J, Dellal A. Injury risk in professional football players
with special reference to the playing position and training
periodization. J Sports Med Phys Fit. 2012;52(6):631–8.
56. Dennis R, Farhart R, Goumas C, et al. Bowling workload and
the risk of injury in elite cricket fast bowlers. J Sci Med Sport.
2003;6(3):359–67.
Training Load and Fatigue Marker Associations with Injury and Illness
123

57. Hulin BT, Gabbett TJ, Blanch P, et al. Spikes in acute workload
are associated with increased injury risk in elite cricket fast
bowlers. Br J Sports Med. 2014;48(8):708–12.
58. Orchard JW, Blanch P, Paoloni J, et al. Fast bowling match
workloads over 5–26 days and risk of injury in the following
month. J Sci Med Sport. 2015;18(1):26–30.
59. Orchard JW, Blanch P, Paoloni J, et al. Cricket fast bowling
workload patterns as risk factors for tendon, muscle, bone and
joint injuries. Br J Sports Med. 2015;49(16):1064–8.
60. Orchard JW, James T, Portus M, et al. Fast bowlers in cricket
demonstrate up to 3-to 4-week delay between high workloads
and increased risk of injury. Am J Sports Med. 2009;37(6):
1186–92.
61. Saw R, Dennis RJ, Bentley D, et al. Throwing workload and
injury risk in elite cricketers. Br J Sports Med. 2011;45:805–8.
62. Carling C, Le Gall F, Dupont G. Are physical performance and
injury risk in a professional soccer team in match-play affected
ower a prolonged period of fixture congestion? Int J Sports Med.
2012;33(1):36–42.
63. Dellal A, Lago-Penas C, Rey E, et al. The effects of a congested
fixture period on physical performance, technical activity and
injury rate during matches in a professional soccer team. Br J
Sports Med. 2015;49(6):390–4.
64. Gabbett TJ, Jenkins D, Abernethy B. Physical collisions and
injury during professional rugby league skills training. J Sci
Med Sport. 2010;13(6):578–83.
65. Gabbett TJ, Jenkins DG, Abernethy B. Physical collisions and
injury in professional rugby league match-play. J Sci Med Sport.
2011;14(3):210–5.
66. Murray NB, Gabbett TJ, Chamari K. Effect of different
between-match recovery times on the activity profiles and injury
rates of national rugby league players. J Strength Cond Res.
2014;28(12):3476–83.
67. Owen AL, Forsyth JJ, del Wong P, et al. Heart rate-based
training intensity and its impact on injury incidence among elite-
level professional soccer players. J Strength Cond Res.
2015;29(6):1705–12.
68. Piggott B, Newton M, McGuigan M. The relationship between
training load and incidence of injury and illness over a pre-
season at an Australian football league club. J Austr Strength
Cond Res. 2008;17(3):4–17.
69. Fricker PA, Pyne DB, Saunders PU, et al. Influence of training
loads on patterns of illness in elite distance runners. Clin J
Sports Med. 2005;15(4):246–52.
70. Veugelers KR, Young WB, Fahrner B, et al. Different methods
of training load quantification and their relationship to injury
and illness in elite Australian football. J Sci Med Sport.
2016;19(1):24–8.
71. Brink M, Visscher C, Arends S, et al. Monitoring stress and
recovery: New insights for the prevention of injuries and illnesses
in elite youth soccer players. Br J Sports Med. 2010;44:809–15.
72. Cross MJ, WIlliams S, Trewartha G, et al. The influence of in-
season training loads on injury risk in professional rugby union.
Int J Sports Physiol Perform. 2016;11(3):350–5.
73. Ferrari HG, Gobatto CA, Manchado-Gobatto FB. Training load,
immune system, upper respiratory symptoms and performance
in well-trained cyclists throughout a competitive season. Biol
Sport. 2013;30(4):289.
74. Foster C. Monitoring training in athletes with reference to over-
training syndrome. Med Sci Sports Exerc. 1998;30(7):1164–8.
75. Freitas CG, Aoki MS, Franciscon CA, et al. Psychophysiologi-
cal responses to overloading and tapering phases in elite young
soccer players. Pediatr Exerc Sci. 2014;26(2):195–202.
76. Gabbett TJ. Influence of training and match intensity on injuries
in rugby league. J Sports Sci. 2004;22(5):409–17.
77. Gabbett TJ. Reductions in pre-season training loads reduce
training injury rates in rugby league players. Br J Sports Med.
2004;38(6):743–9.
78. Gabbett TJ, Domrow N. Relationships between training load,
injury, and fitness in sub-elite collision sport athletes. J Sports
Sci. 2007;25(13):1507–19.
79. Gabbett TJ, Jenkins DG. Relationship between training load and
injury in professional rugby league players. J Sci Med Sport.
2011;14(3):204–9.
80. Killen NM, Gabbett TJ, Jenkins DG. Training loads and inci-
dence of injury during the preseason in professional rugby lea-
gue players. J Strength Cond Res. 2010;24(8):2079–84.
81. Moreira A, Arsati F, de Oliveira Lima-Arsati YB, et al. Moni-
toring stress tolerance and occurrences of upper respiratory ill-
ness in basketball players by means of psychometric tools and
salivary biomarkers. Stress Health. 2011;27(3):166–72.
82. Moreira A, de Moura NR, Coutts A, et al. Monitoring internal
training load and mucosal immune responses in futsal athletes.
J Strength Cond Res. 2013;27(5):1253–9.
83. Putlur P, Foster C, Miskowski JA, et al. Alteration of immune
function in women collegiate soccer players and college stu-
dents. J Sports Sci Med. 2004;3(4):234.
84. Rogalski B, Dawson B, Heasman J, et al. Training and game
loads and injury risk in elite Australian footballers. J Sci Med
Sport. 2013;16(6):499–503.
85. Colby M, Dawson B, Heasman J, et al. Accelerometer and GPS-
derived running loads and injury risk in elite Australian foot-
ballers. J Strength Cond Res. 2014;28(8):2244–52.
86. Nielsen RO, Cederholm P, Buist I, et al. Can GPS be used to
detect deleterious progression in training volume among run-
ners? J Strength Cond Res. 2013;27(6):1471–8.
87. Gleeson M, Bishop N, Oliveira M, et al. Respiratory infection
risk in athletes: Association with antigen-stimulated IL-10 pro-
duction and salivary IgA secretion. Scand J Med Sci Sports.
2012;22(3):410–7.
88. Baecke J, Burema J, Frijters J. A short questionnaire for the
measurement of habitual physical activity in epidemiological
studies. Am J Clin Nutr. 1982;36(5):936–42.
89. Fahlman MM, Engels H-J. Mucosal IgA and URTI in American
college football players: a year longitudinal study. Med Sci
Sports Exerc. 2005;37(3):374–80.
90. Neville V, Gleeson M, Folland JP. Salivary IgA as a risk factor
for upper respiratory infections in elite professional athletes.
Med Sci Sports Exerc. 2008;40(7):1228–36.
91. Brink M, Visscher C, Coutts A, et al. Changes in perceived
stress and recovery in overreached young elite soccer players.
Scand J Med Sci Sports. 2012;22(2):285–92.
92. Ivarsson A, Johnson U, Podlog L. Psychological predictors of
injury occurrence: a prospective investigation of professional
Swedish soccer players. J Sport Rehabil. 2013;22(1):19–26.
93. Ivarsson A, Johnson U, Lindwall M, et al. Psychosocial stress as
a predictor of injury in elite junior soccer: a latent growth curve
analysis. J Sci Med Sport. 2014;17(4):366–70.
94. Kinchington M, Ball K, Naughton G. Monitoring of lower limb
comfort and injury in elite football. J Sports Sci Med.
2010;9(4):652.
95. Laux P, Krumm B, Diers M, et al. Recovery-stress balance and
injury risk in professional football players: a prospective study.
J Sports Sci. 2015;33(20):2140–8.
96. Dennis J, Dawson B, Heasman J, et al. Sleep patterns and injury
occurrence in elite Australian footballers. J Sci Med Sport.
2015;19(2):113–6.
97. Gleeson M, Hall ST, McDonald WA, et al. Salivary IgA sub-
classes and infection risk in elite swimmers. Immunol Cell Biol.
1999;77(4):351–5.
C. M. Jones et al.
123

98. Gleeson M, McDonald W, Pyne D, et al. Immune status and
respiratory illness for elite swimmers during a 12-week training
cycle. Int J Sports Med. 2000;21(4):302–7.
99. Leicht C, Bishop N, Paulson TA, et al. Salivary immunoglobulin
A and upper respiratory symptoms during 5 months of training
in elite tetraplegic athletes. Int J Sports Physiol Perform.
2012;7:210–7.
100. Moreira A, Mortatti AL, Arruda AF, et al. Salivary IgA response
and upper respiratory tract infection symptoms during a 21-week
competitive season in young soccer players. J Strength Cond
Res. 2014;28(2):467–73.
101. Mortatti AL, Moreira A, Aoki MS, et al. Effect of competition
on salivary cortisol, immunoglobulin A, and upper respiratory
tract infections in elite young soccer players. J Strength Cond
Res. 2012;26(5):1396–401.
102. Fuller CW, Molloy MG, Bagate C, et al. Consensus statement on
injury definitions and data collection procedures for studies of
injuries in rugby union. Br J Sports Med. 2007;41(5):328–31.
103. Gabbett TJ, Ullah S, Finch CF. Identifying risk factors for
contact injury in professional rugby league players: application
of a frailty model for recurrent injury. J Sci Med Sport.
2012;15(6):496–504.
104. Barrett B, Brown R, Mundt M, et al. The Wisconsin Upper
Respiratory Symptom Survey is responsive, reliable and valid.
J Clin Epidemiol. 2005;58(6):609–17.
105. Gabbett TJ, Domrow N. Risk factors for injury in subelite rugby
league players. Am J Sports Med. 2005;33(3):428–34.
106. Anderson L, Triplett-Mcbride T, Foster C, et al. Impact of
training patterns on incidence of illness and injury during a
women’s collegiate basketball season. J Strength Cond Res.
2003;17(4):734–8.
107. Banister E, Calvert T, Savage M, et al. A systems model of
training for athletic performance. Aust J Sports Med.
1975;7(3):57–61.
108. Blanch P, Gabbett TJ. Has the athlete trained enough to return to
play safely? The acute: chronic workload ratio permits clinicians
to quantify a player’s risk of subsequent injury. Br J Sports Med.
2016;50(80):471–5.
109. Orchard J, Hoskins W. For debate: Consensus injury definitions
in team sports should focus on missed playing time. Clin J
Sports Med. 2007;17(3):192–6.
110. Finch CF, Cook J. Categorising sports injuries in epidemiolog-
ical studies: the subsequent injury categorisation (SIC) model to
address multiple, recurrent and exacerbation of injuries. Br J
Sports Med. 2014;48(17):1276–80.
111. Balazs L, George C, Brelin C, et al. Variation in injury incidence
rate reporting: the case for standardization between American
and non-American researchers. Curr Orthop Pract.
2015;26(4):395–402.
112. Ekstrand J, Hagglund M, Walden M. Epidemiology of muscle
injuries in professional football (soccer). Am J Sports Med.
2011;39(6):1226–32.
113. Hakkinen K. Neuromuscular adaptation during strength training,
aging, detraining, and immobilization. Crit Rev Phys Rehabil
Med. 1994;63:161–98.
114. Frijters P, Beatton T. The mystery of the U-shaped relationship
between happiness and age. J Econ Behav Org.
2012;82(2):525–42.
115. Shaper AG, Wannamethee G, Walker M. Alcohol and mortality
in British men: explaining the U-shaped curve. Lancet.
1988;332(8623):1267–73.
116. Mair SD, Seaber AV, Glisson RR, et al. The role of fatigue in
susceptibility to acute muscle strain injury. Am J Sports Med.
1996;24(2):137–43.
117. Miura K, Ishibashi Y, Tsuda E, et al. The effect of local and general
fatigue on knee proprioception. Arthroscopy. 2004;20(4):414–8.
118. Cools R, D’Esposito M. Inverted-U–shaped dopamine actions
on human working memory and cognitive control. Biol Psy-
chiatry. 2011;69(12):e113–25.
119. Sturman MC. Searching for the inverted U-shaped relationship
between time and performance: meta-analyses of the experi-
ence/performance, tenure/performance, and age/performance
relationships. J Manage. 2003;29(5):609–40.
120. Alentorn-Geli E, Myer GD, Silvers HJ, et al. Prevention of non-
contact anterior cruciate ligament injuries in soccer players. Part
1: mechanisms of injury and underlying risk factors. Knee Surg
Sports Traumatol Arthrosc. 2009;17(7):705–29.
121. Bahr R, Krosshaug T. Understanding injury mechanisms: a key
component of preventing injuries in sport. Br J Sports Med.
2005;39(6):324–9.
122. Reilly T, Ekblom B. The use of recovery methods post-exercise.
J Sports Sci. 2005;23(6):619–27.
123. de Longis A, Folkman S, Lazarus RS. The impact of daily stress
on health and mood: psychological and social resources as
mediators. J Pers Soc Psychol. 1988;54(3):486.
124. Kinchington M, Ball K, Naughton G. Reliability of an instru-
ment to determine lower limb comfort in professional football.
Open Access J Sports Med. 2010;1:77–85.
125. Shearer DA, Kilduff LP, Finn C, et al. Measuring recovery in
elite rugby players: the brief assessment of mood, endocrine
changes, and power. Res Q Exerc Sport. 2015;86(4):379–86.
126. Halson SL. Sleep in elite athletes and nutritional interventions to
enhance sleep. Sports Med. 2014;44(1):13–23.
127. Nedelec M, Halson S, Abaidia A-E, et al. Stress, sleep and
recovery in elite soccer: a critical review of the literature. Sports
Med. 2015;45(10):1387–400.
128. Zwerver J, Bredeweg SW, van den Akker-Scheek I. Prevalence
of jumper’s knee among nonelite athletes from different sports:
a cross-sectional survey. Am J Sports Med. 2011;39(9):1984–8.
129. Gallo T, Cormack S, Gabbett T, et al. Characteristics impacting
on session rating of perceived exertion training load in Aus-
tralian footballers. J Sports Sci. 2015;33(5):467–75.
130. Orchard J, Seward H. Epidemiology of injuries in the Australian
Football League, seasons 1997–2000. Br J Sports Med.
2002;36(1):39–44.
131. Gabbett TJ. The training-injury prevention paradox: should
athletes be training smarter and harder? Br J Sports Med.
2016;50(5):273–80.
132. Andersen MB, Williams JM. A model of stress and athletic
injury: prediction and prevention. J Sport Exerc Psychol.
1988;10(3):294–306.
133. Piacentini MF, Meeusen R. An online training-monitoring sys-
tem to prevent nonfunctional overreaching. Int J Sports Physiol
Perform. 2015;10(4):524–7.
134. Nicol C, Avela J, Komi PV. The stretch-shortening cycle. Sports
Med. 2006;36(11):977–99.
135. Gathercole R, Sporer B, Stellingwerff T. Countermovement
jump performance with increased training loads in elite female
rugby athletes. Int J Sports Med. 2015;36(9):722–8.
136. McLellan CP, Lovell DI. Neuromuscular responses to impact
and collision during elite rugby league match play. J Strength
Cond Res. 2012;26(5):1431–40.
137. Markstrom JL, Olsson CJ. Countermovement jump peak force
relative to body weight and jump height as predictors for sprint
running performances: (in) homogeneity of track and field ath-
letes? J Strength Cond Res. 2013;27(4):944–53.
138. Finch CF, Cook J, Gabbe BJ, et al. A new way of categorising
recurrent, repeat and multiple sports injuries for injury incidence
studies-the subsequent injury categorisation (SIC) model. Aus-
tralas Epidemiologist. 2015;22(1):22–5.
139. Saw AE, Main LC, Gastin PB. Monitoring the athlete training
response: subjective self-reported measures trump commonly
Training Load and Fatigue Marker Associations with Injury and Illness
123

used objective measures: a systematic review. Br J Sports Med.
2016;50(5):281–91.
140. Los Arcos A, Martınez-Santos R, Yanci J, et al. Negative
associations between perceived training load, volume and
changes in physical fitness in professional soccer players.
J Sports Sci Med. 2015;14(2):394.
141. Los Arcos A, Yanci J, Mendiguchia J, et al. Rating of muscular
and respiratory perceived exertion in professional soccer play-
ers. J Strength Cond Res. 2014;28(11):3280–8.
142. Van Tulder M, Furlan A, Bombardier C, et al. Updated method
guidelines for systematic reviews in Cochrane Collaboration
Back Review Group. Spine. 2003;28(12):1290–9.
143. Gabbett TJ, Hulin BT, Blanch P, et al. High training workloads
alone do not cause sports injuries: how you get there is the real
issue. Br J Sports Med. 2016;50(8):444–5.
144. Black GM, Gabbett TJ, Cole MH, et al. Monitoring workload in
throwing-dominant sports: a systematic review. Sports Med.
2016. doi:10.1007/s40279-016-0529-6 (Epub 12 Apr 2016).145. Hulin BT, Gabbett TJ, Lawson DW, et al. The actute: chronic
workload ratio predicts injury: high chronic workload may
decrease injury risk in elite rugby league players. Br J Sports
Med. 2016;50(4):231–6.
146. Hulin BT, Gabbett TJ, Caputi P, et al. Low chronic workload
and the acute: chronic workload ratio are more predictive of
injury than between-match recovery time: a two-season
prospective cohort study in elite rugby league players. Br J
Sports Med. 2016;50(16):1008–12.
147. Gabbett TJ, Kennelly S, Sheehan J, et al. If overuse injury is a
‘training load error’, should undertraining be viewed the same
way? Br J Sports Med. 2016;50(17):1017–8.
148. Nassis GP, Gabbett TJ. Is workload associated with injuries and
performance in elite football? A call for action. Br J Sports Med.
2016. doi:10.1136/bjsports-2016-095988 (Epub 3 Mar 2016).149. Drew MK, Cook J, Finch CF.Sports-related workload and injury
risk: simply knowing the risks will not prevent injuries. Br J
Sports Med. 2016. doi:10.1136/bjsports-2015-095871 (Epub 10May 2016).
150. GabbettTJ,WhyteDG,HartwigTB, et al. The relationshipbetween
workloads, physical performance, injury and illness in adolescent
male football players. Sports Med. 2014;44(7):989–1003.
151. Phillips B, Ball C, Sackett D, et al. Oxford Centre for Evidence-
Based Medicine Levels of Evidence. CEBM Levels of Evidence
(March 2009). Available at: http://www.cebm.net/oxford-centre-
evidence-based-medicine-levels-evidence-march-2009/. Acces-
sed 28 June 2016.
C. M. Jones et al.
123