Embed Size (px)
Citation preview

© 2015 Hamano et al. This work is published by Dove Medical Press Limited, and licensed under Creative Commons Attribution – Non Commercial (unported, v3.0) License. The full terms of the License are available at http://creativecommons.org/licenses/by-nc/3.0/. Non-commercial uses of the work are permitted without any further
permission from Dove Medical Press Limited, provided the work is properly attributed. Permissions beyond the scope of the License are administered by Dove Medical Press Limited. Information on how to request permission may be found at: http://www.dovepress.com/permissions.php
Open Access Journal of Sports Medicine 2015:6 191–199
Open Access Journal of Sports Medicine Dovepress
submit your manuscript | www.dovepress.com
Dovepress 191
O r i g i n A l r e S e A r c h
open access to scientific and medical research
Open Access Full Text Article
http://dx.doi.org/10.2147/OAJSM.S82295
relationship between performance test and body composition/physical strength characteristic in sprint canoe and kayak paddlers
Saki hamano1
eisuke Ochi2
Yosuke Tsuchiya3
erina Muramatsu4
Kazuhiro Suzukawa5
Shoji igawa1
1Department of Sports nutrition, nippon Sport Science University, Yokohama, Kanagawa, 2graduate School of education, Okayama University, Okayama, 3laboratory of health and Sports Sciences, Meiji gakuin University, Yokohama, Kanagawa, 4Department of natural Sciences, nippon Sport Science University, Setagaya, Tokyo, 5laboratory of Preventive Medicine and Public health, nippon Sport Science University, Setagaya, Tokyo, Japan
correspondence: eisuke Ochi graduate School of education, Okayama University, 3-1-1, Tsushimanaka, Kita, Okayama 700-8530, Japan Tel +81 86 251 7750 Fax +81 86 251 7750 email [email protected]
Objective: Canoe sprint is divided into canoe and kayak. The difference between the two
competitions is in physical performance. The aim of the present study was to compare and
investigate the relationship between physical characteristics and fitness between the two canoe
sprint competitors.
Methods: Subjects were 11 canoe paddlers (C) and 12 kayak paddlers (K). They underwent
anthropometric characteristics, body composition and fitness tests, and 120 s all-out tests using
a canoe and kayak ergometer. The unpaired t-test was used to test for significant differences
between disciplines, while Pearson’s correlation coefficient was used to examine the association
between each measurement item and the performance test.
Results: The age, height, body mass, body mass index, and total body fat were, C: 20.6±0.9
yr, 172.8±5.2 cm, 70.8±7.8 kg, 23.7±1.9, 14.4%±3.5%; and K: 19.7±1.2 yr, 172.8±5.3 cm,
69.5±7.8 kg, 23.2±2.1, 12.1%±3.6%, respectively. No significant differences were seen in any
of the items for physical characteristics or fitness between C and K. A correlation analysis of
performance tests and each measurement item revealed a positive correlation with low-speed
isokinetic knee extension and flexion strength for C only (extension: r=0.761; flexion: r=0.784;
P,0.01). In addition, performance tests were positively correlated with the circumference of
arm (upper arm: r=0.876; forearm: r=0.820; P,0.01) and lower limb (thigh: r=0.781; calf:
r=0.753; P,0.01) in C and with height (r=0.549, P,0.05), arm span (r=0.639, P,0.05), and
leg length (r=0.621, P,0.01) in K.
Conclusion: We suggest that the factors correlating with the performance test differ depending
on the competitions.
Keywords: canoe sprint, kayak, body composition, isokinetic strength, morphology
IntroductionCanoe sprint is an Olympic sport that is divided into two disciplines: canoe (C), in
which the athlete paddles on one side while kneeling on one knee, and kayak (K), in
which the athlete paddles on both the left and the right side in a sitting position. It is
a sport in which athletes compete to finish a linear course (1,000, 500, 200 m) setup
in standing water without flow, the fastest. In a review, it has been shown that medi-
cal and surgical problems such as hydrocution and hypothermia in canoe and kayak
paddlers have been identified.1
Athletes are trying to adapt their anthropometric characteristics, body composi-
tion, and fitness specifically to this sport by continuing long-term training.2 Robinson
et al3 showed that the anthropometric characteristics of the athlete has a large impact
on competitiveness in canoe sprint. Furthermore, Ackland et al4 reported that elite
canoe sprinters have better developed upper bodies, smaller buttocks, and greater lean

Open Access Journal of Sports Medicine 2015:6submit your manuscript | www.dovepress.com
Dovepress
Dovepress
192
hamano et al
body mass than athletes from other disciplines and ordinary
adults. In terms of fitness, kayak paddlers have both high
aerobic and anaerobic capacities and have been shown to
lift the same maximum weight as judoists and rugby players
in bench press and bench pull.5 These reports suggest that
Olympic medalists and athletes competing in international
competitions have a specific physique, particularly in these
sports. However, few reports have investigated the isokinetic
muscle strength in canoe and kayak paddlers.
As stated earlier, canoe sprint is divided into a disci-
pline using canoes and a discipline using kayaks. These two
competitions greatly differ in terms of the paddles used and
the movement pattern. The speed of the boat also differs
between the two groups. A previous study reported that the
abdominal and scapular skinfold thicknesses of kayak pad-
dlers were lesser than those of canoes paddlers.6 Other sports
to date have described how body composition and fitness
differ depending on the specialist discipline and the posi-
tion. In a study that investigated differences in the physical
characteristics of ordinary male university students and those
who participated in competitive swimming, handball, soc-
cer, rugby, athletics (long-distance running, sprint, jumping
events, and throwing), judo (lightweight, middleweight, and
heavyweight), and gymnastics, anthropometric characteris-
tics and body composition were found to differ depending
on the specialist discipline.7 A report investigating the body
composition and fitness of collegiate American Football
players found that body fat was the highest in linebackers,
followed by middle linebackers and backs, in that order. They
also found that backs had greater running capacity than other
positions.8 Tsuchiya et al9 measured isokinetic knee extension
and flexion force in male lacrosse players and reported that
midfielders have significantly higher isokinetic knee flexion
strength at high speeds than do attackers. While other reports
have elucidated the association between isokinetic strength
and performance in sports such as athletics and soccer,10,11
no studies have investigated differences in anthropometric
characteristics and fitness between canoe and kayak paddlers.
It is important to elucidate the anthropometric characteristics,
body composition, and fitness of canoe and kayak paddlers
when planning training programs and discovering talented
athletes.
Previous studies have revealed that kayak paddlers primar-
ily develop muscle mass in the muscle groups of the upper
body, including the upper limbs and the trunk.12–14 In addition,
a study that investigated the correlation between 200 m sprint
time and anthropometric characteristics in kayak paddlers
demonstrated significant correlations between 200 m sprint
time and upper arm, forearm, and chest circumference.15 The
canoe paddlers could be expected to have stronger correlations
between the performance and the anthropometries of the lower
limbs and muscle strength because they need to perform larger
torque while kneeling on one knee, while kayak paddlers exert
force in a sitting position. However, no study has investigated
the correlation between performance and the anthropometric
characteristics and muscle strength of both canoe and kayak
paddlers. Therefore, it is needed to clarify the associations
between these factors such as anthropometric characteristics,
body composition, and fitness affecting the performance in
canoe and kayak paddlers.
In this study, we, therefore, had two aims. First, we com-
pared the anthropometric characteristics, body composition,
and fitness between canoe and kayak paddlers. Second, we
investigated how the performance test is associated with
anthropometric characteristics, body composition, and fit-
ness in canoe and kayak paddlers. We hypothesized that
kayak paddlers have lesser trunk fat than canoe paddlers, and
canoe paddlers have higher leg strength than kayak paddlers.
In addition, we also hypothesized that leg strength related
to postural maintenance in canoe is significantly correlated
with performance.
Materials and methodsSubjectsSubjects were 11 male canoe paddlers (C; 20.6±0.9 yr) and
12 male kayak paddlers (K; 19.7±1.2 yr) in university (total
23 individuals). The career of canoe paddlers was 6.5±1.4 yr
and that of kayak paddlers was 6.0±2.4 yr. Each subject has
trained on water 3–4 h/day, 3 times a week, and trained by
a canoe ergometer 3–4 h/day, 3 times a week. Two subjects
of this study had attended an international competition and
12 subjects had attended a national competition. All subjects
gave their written informed consent after being given suf-
ficient explanation of the study objectives and content and
precautions. This study was approved by the Ethics Com-
mittee for Nippon Sports Science University (approval no
014-H24). All measurements of this study were conducted
in July 2014.
Anthropometric characteristicsAnthropometric characteristics was carried out by measuring
the length in 15 locations (height, arm span, sitting height, arm
length, forearm length, hand length, thigh length, calf length,
and foot height) and girth in 8 locations (neck, chest, waist,
hip, arm, forearm, thigh, and calf girth) by a tape measure.16
We also calculated the length of the upper limbs as the sum of
the length of the arm, forearm, and hand; and the length of the
lower limbs as the sum of the length of the thigh, calf, and foot.
Open Access Journal of Sports Medicine 2015:6 submit your manuscript | www.dovepress.com
Dovepress
Dovepress
193
Morphological and physiological characteristics of sprint paddlers
The mean value was used as the representative data of bilat-
eral regions. A statistician conducted all the measurements.
In addition, body mass index (BMI) was calculated as body
weight divided by the square of height (kg/m2).
Body compositionDual-energy X-ray absorptiometric (DEXA) scans (Lunar
DPX-L, GE Healthcare, Buckinghamshire, UK) were used
to measure the body composition. DEXA scanning involved
measuring posture in the supine position after subjects
removed all metal objects that they were wearing. After mea-
surements were obtained, systemic scan data were divided
into four regions: the head, the upper limbs, the lower limbs,
and the trunk. The body fat ratio, fat mass, lean body mass,
bone mineral content (BMC), and bone mineral density were
found for each region, excluding the head.17
Physical fitness testMaximum oxygen uptakeMaximum oxygen uptake (Vo
2 max) was measured by an
incremental test with a treadmill using a respiratory instru-
ment for measuring metabolism (AE-100i, Minato Medical
Science Co Ltd., Tokyo, Japan). Measurements were initi-
ated from 8 km/h at an inclination of 1% and then increased
by 2 km/h every 3 min. After four stages, the gradient was
increased by 1% every minute and this was continued until
the subjects reached exhaustion.18 Heart rate was measured
simultaneously during exercise, and the heart rate on going
all out was designated the maximum heart rate. Blood
lactate was analyzed using a blood lactate test meter (Lac-
tate Pro2 LT-1730, Arkray, Kyoto, Japan), for which a trace
amount of blood was collected from the fingertip directly,
immediately after exercise.
grip strength, back strength, sit and reach, sit-upHand grip strength was measured twice, alternating between
the right and left hands, using an analog dynamometer (Takei
Kiki Kogyo, Niigata, Japan). The average of the best recorded
measurements for each hand was used as the representative
value. Back muscle strength was measured twice using a
digital back muscle strength meter (Takei Kiki Kogyo), and
the best recorded measurement was used as the representa-
tive value. For sit and reach, subjects were seated on the floor
with knees fully extended and ankles in neutral dorsiflexion
against the box. The subjects were instructed to place one
hand on top of the other and slowly reach forward as far as
possible while keeping the knees extended. The hands were
kept aligned evenly as the subject reached forward along
the surface of the box. Each subject practiced the movement
twice, and on the third repetition, the sit and reach test score
(in centimeters) was recorded as the final position of the fin-
gertips on the ruler. For sit-ups, the subjects adopted a supine
position on a mat with both hands slightly clenched and arms
crossed in front of the chest, and they performed as many
sit-ups as possible in 30 s, with an assistant stabilizing both
the knees of each test subject at an angle of 90°.
Abalakov test, squat jump, and one repetition maximumA jump meter (Takei Kiki Kogyo) was used for the Abalakov
test (ABA) and squat jump (SJ). For ABA, each subject
jumped with swinging the arms back behind the body imme-
diately after squatting down until the knees were bent at 90°.
For SJ, joint angle of knee was 90° as the starting position,
hands of each subject kept with waist and jumped without
arm swing. ABA and SJ measurements were made in 1 cm
units, and the highest value of two attempts was used as the
representative value. One repetition maximum (1RM) was
measured after warming up. Each subject chose a weight that
was achievable, then after a rest of at least several minutes,
increased the weight (2.5 kg at a time) and tried again. Each
subject measured subsequent weights until they could only
repeat one full and correct lift of that weight.19
Wingate testThe Wingate test involved subjects pedaling a bicycle ergom-
eter (PowerMax VIII, Combi, Taito-ku, Tokyo Japan) for a
maximum of 30 s at a load of 7.5% of their body weight.9
The rotational speed was recorded every 5 s, and the peak
and mean power were calculated.
Isokinetic strength of knee extensor and flexor musclesIsokinetic knee extension (ext) and flexion (flex) strength
were measured using an isokinetic dynamometer (Biodex
system 3, Biodex, Shirley, NY, USA). Peak torque was cal-
culated by measuring the left and right legs of the subjects
at low speed (60°/s), medium speed (180°/s), and high speed
(300°/s) while in a sitting position.9 The obtained values were
shown as the relative value per kilogram of body weight.
Performance testThe performance test involved exercising all out for
120 s on a canoe and kayak ergometer (Dansprint, Hvidovre,
Denmark). The ergometer was an air resistance one in which
the pulling weight changes according to the temperature and
humidity. We, therefore, standardized the pulling weight by
calibrating the ergometer before all tests (drag resistance

Open Access Journal of Sports Medicine 2015:6submit your manuscript | www.dovepress.com
Dovepress
Dovepress
194
hamano et al
Table 1 comparisons of absolute size characteristics in canoe and kayak paddlers
Canoe Kayak P
n 11 12 nsAge (yr) 20.6±0.9 19.7±1.2 nscareer (yr) 6.5±1.4 6.1±2.3 nsheight (cm) 172.8±5.2 172.8±5.3 nsBody mass (kg) 70.8±7.8 69.5±7.8 nsBMi 23.7±1.9 23.2±2.1 nsAnthropometric characteristicsSegment length Arm span (cm) 177.9±7.2 177.4±8.0 ns Sitting height (cm) 92.5±3.6 92.9±2.3 ns Upper limba (cm) 78.3±2.8 78.0±3.2 ns lower limbb (cm) 89.5±3.8 89.2±3.3 nsgirth neck (cm) 37.3±1.8 36.6±1.8 ns chest (cm) 94.6±6.3 93.9±5.7 ns Waist (cm) 78.9±4.4 78.6±5.2 ns hip (cm) 92.3±4.0 91.9±3.9 ns Arm (cm) 31.5±2.5 30.5±2.5 ns Forearm (cm) 26.7±2.0 27.5±1.7 ns Thigh (cm) 54.7±2.8 53.2±3.3 ns calf (cm) 36.4±1.9 36.6±1.7 nsBody compositionBody fat Arms (%) 9.1±2.7 8.2±2.8 ns legs (%) 15.6±3.7 13.1±3.9 ns Trunk (%) 14.8±3.7 12.8±3.9 ns Total body (%) 14.4±3.5 12.1±3.6 nsFat mass Arms (kg) 0.4±0.1 0.3±0.1 ns legs (kg) 2.0±0.6 1.6±0.6 ns Trunk (kg) 2.5±0.8 2.1±0.8 ns Total body (kg) 10.3±3.1 8.7±3.0 nslean Arms (kg) 3.4±0.5 3.4±0.6 ns legs (kg) 9.9±1.0 9.8±1.2 ns Trunk (kg) 13.4±1.5 13.5±1.3 ns Total body (kg) 57.2±5.5 57.6±5.8 nsBMc Arms (g/cm) 0.2±0.03 0.2±0.03 ns legs (g/cm) 0.6±0.07 0.6±0.06 ns Trunk (g/cm) 0.6±0.09 0.6±0.07 ns Total body (g/cm) 3.1±0.4 3.2±0.3 nsBMD Total body (g/cm2) 1.227±0.082 1.278±0.067 ns
Notes: Mean ± SD. aThe upper limb is the sum of the upper arm and the forearm and hand; bthe lower limb is the sum of the thigh and the lower thigh and foot.Abbreviations: ns, not significant; BMC, bone mineral content; BMD, bone mineral density; BMi, body mass index; SD, standard deviation.
coefficient, 32).20 During the test, the stroke distance, stroke
rate, and power exerted per stroke were fed into a personal
computer. We also calculated the peak and average power
exerted over 120 s. After performing sufficient warm-up,
the subjects were instructed to row at full force for 120 s
while the elapsed time and power exerted were monitored.
Configurations of the ergometer and stroke rate were left
to the subjects. The average power exerted was used as the
performance index. We also analyzed blood lactate using a
trace amount of blood collected from the fingertip directly
after the completion of exercise.
Statistical analysisThe measurement results of each item are shown as the mean ±
standard deviation. An unpaired t-test was used to compare
the differences in the mean value of each measurement item
between canoe and kayak. In addition, Pearson’s correlation
coefficient was used to examine the association between each
parameter and the performance test. The level of significance
was set at less than 5% for both. The magnitude of correlation
was shown based on Cohen’s criteria: trivial (r#0.1), small
(0.1,r#0.3), moderate (0.3,r#0.5), large (0.5,r#0.7),
very large (0.7,r#0.9), and nearly perfect (r.0.9).21 Excel
of Windows 2010 was used for all statistical analyses.
Resultscomparisons of physical characteristics and fitness in canoe and kayak paddlersTables 1 and 2 show the results of anthropometric character-
istics and body composition of canoe and kayak paddlers. No
significant differences were seen between canoe and kayak for
age (C: 20.6±0.9 yr; K: 19.7±1.2 yr), sports career (C: 6.5±1.4
yr; K: 6.1±2.3 yr), height (C: 172.8±5.2 cm; K: 172.8±5.3
cm), body mass (C: 70.8±7.8 kg; K: 69.5±7.8 kg), BMI (C:
23.7±1.9; K: 23.2±2.1), and all anthropometric characteristics
and body composition items. Similarly, no significant differ-
ences in the results of the fitness test was seen between canoe
and kayak with respect to all the parameters.
comparisons of performance test in canoe and kayak paddlersTable 3 shows the results of the performance test in canoe
and kayak paddlers. Compared with canoe paddlers, kayak
paddlers had a significantly higher stroke rate (C: 62.0±3.9
times/min; K: 113.7±9.1 times/min; P,0.001), peak exerted
power (C: 183.1±47.6 W; K: 364.7 ± 54.9 W; P,0.001), and
average exerted power (C: 120.5±27.0 W; K: 201.8±26.4 W;
P,0.001), but significantly shorter stroke distance (C:
3.2±0.2 m/times; K: 2.1±0.1 m/times; P,0.001). Moreover,
no significant difference was seen in blood lactate immedi-
ately after the completion of exercise (C: 11.1±3.3 mmol/L;
K: 13.2±2.0 mmol/L; P,0.001).

Open Access Journal of Sports Medicine 2015:6 submit your manuscript | www.dovepress.com
Dovepress
Dovepress
195
Morphological and physiological characteristics of sprint paddlers
Table 2 comparisons of physical characteristics in canoe and kayak paddlers
Canoe Kayak P
Fitness testgrip strength (kg) 50.0±11.5 50.6±7.9 nsBack strength (kg) 146.9±29.4 151.5±23.4 nsSit-up (times) 34.8±6.2 33.8±8.0 nsSit and reach (cm) 49.2±6.9 51.6±7.9 nsAbalakov test (cm) 55.5±5.0 56.0±7.3 nsSquat jump (cm) 42.3±4.2 44.2±5.1 nsMaximum oxygen uptakeV.o2 max
l/min 3.83±0.3 3.81±0.3 nsml/kg/min 54.3±4.3 55.6±3.7 nsBlood lactate (mmol/l) 13.4±4.3 13.0±3.3 nshrmax (bpm) 192.0±5.6 189.3±7.4 nsWingate testPave (W) 649.9±86.4 640.3±82.9 nsPpeak (W) 861.2±121.7 841.1±134.5 nsPave (W/kg) 9.2±0.6 9.3±0.7 nsPpeak (W/kg) 12.2±1.0 12.2±1.0 ns1RMBack squat (kg) 104.5±17.6 97.0±21.2 nsBench press (kg) 90.8±21.7 83.8±18.6 nsIsokinetic of knee strength60°/s extension (n ⋅ m) 195.3±30.8 193.6±26.0 ns
Flexion (n ⋅ m) 109.1±20.2 103.8±17.8 ns
extension (n ⋅ m/kg) 2.8±0.3 2.8±0.4 ns
Flexion (n ⋅ m/kg) 1.5±0.2 1.5±0.2 ns
180°/s extension (n ⋅ m) 125.4±26.0 128.3±17.3 ns
Flexion (n ⋅ m) 87.2±22.5 85.7±13.4 ns
extension (n ⋅ m/kg) 1.8±0.2 1.9±0.3 ns
Flexion (n ⋅ m/kg) 1.2±0.2 1.2±0.2 ns
300°/s extension (n ⋅ m) 98.0±19.9 100.3±14.6 ns
Flexion (n ⋅ m) 75.4±20.1 72.0±11.3 ns
extension (n ⋅ m/kg) 1.4±0.2 1.5±0.2 ns
Flexion (n ⋅ m/kg) 1.1±0.2 1.0±0.1 ns
Abbreviations: ns, not significant; Vo2 max, maximum oxygen uptake; hrmax, maximum heart rate; Pavg, Wingate test average power; Ppeak, Wingate test peak power; 1rM, one-repetition maximum.
Table 3 comparisons of performance test in canoe and kayak paddlers
Canoe Kayak P
Stroke distance (m/times) 3.2±0.2 2.1±0.1 ***Stroke rate (times/min) 62.0±3.9 113.7±9.1 ***Pave (W) 183.1±47.6 346.7±54.9 ***Ppeak (W) 120.5±27.0 201.8±26.4 ***Blood lactate (mmol/l) 11.1±3.3 13.2±2.0 ns
Notes: Mean ± SD; ***P,0.001.Abbreviations: ns, not significant; Pavg, Wingate test average power; Ppeak, Wingate test peak power; SD, standard deviation.
Table 4 Correlation coefficients between performance test and absolute size characteristics of canoe and kayak paddlers
Canoe Kayak
Age (yr) -0.313 -0.266career (yr) -0.015 0.036
height (cm) 0.549 0.639*Body mass (kg) 0.878** 0.825**BMi 0.803** 0.625*Anthropometric characteristicsSegment length (cm) Arm span 0.533 0.705* Sitting height 0.545 0.540 Upper limb 0.778** 0.726** lower limb 0.395 0.621**girth (cm) neck 0.649* 0.567 chest 0.928** 0.826** Waist 0.801** 0.743** hip 0.768** 0.752** Arm 0.876** 0.714 Forearm 0.820** 0.452 Thigh 0.781** 0.569 calf 0.753** 0.905**Body compositionBody fat (%) Arms 0.121 0.397 legs 0.233 0.253 Trunk 0.333 0.288 Total body 0.269 0.280Fat mass (kg) Arms 0.445 0.594* legs 0.395 0.518 Trunk 0.598 0.429 Total body 0.500 0.515lean (kg) Arms 0.900** 0.895** legs 0.767** 0.845** Trunk 0.869** 0.640* Total body 0.913** 0.824**BMc (kg) Arms 0.854** 0.798** legs 0.819** 0.540 Trunk 0.772** 0.397 Total body 0.783** 0.520BMD (g/cm2) Total body 0.368 -0.232
Notes: **P,0.01; *P,0.05.Abbreviations: BMi, body mass index; BMc, bone mineral content; BMD, bone mineral density.
relationship between physical characteristics and performance testTable 4 shows the correlation coefficients between perfor-
mance test and absolute size characteristics of canoe and
kayak paddlers. In canoe paddlers, performance test was
Open Access Journal of Sports Medicine 2015:6submit your manuscript | www.dovepress.com
Dovepress
Dovepress
196
hamano et al
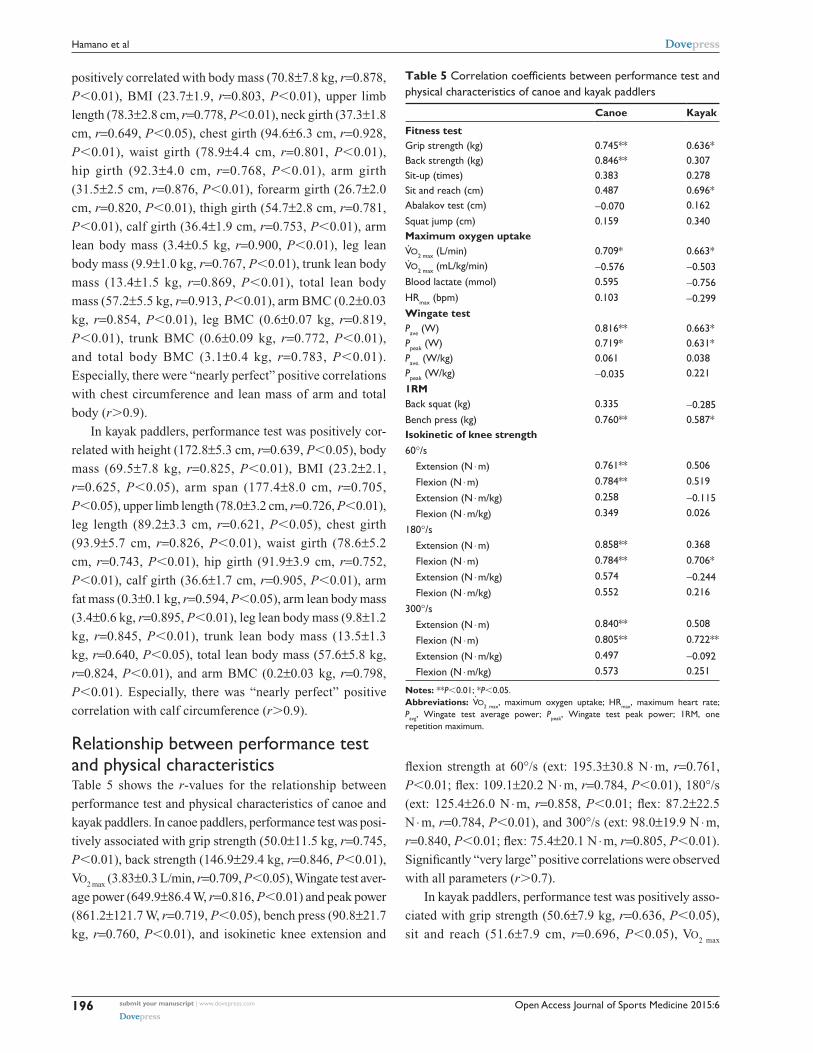
Table 5 Correlation coefficients between performance test and physical characteristics of canoe and kayak paddlers
Canoe Kayak
Fitness testgrip strength (kg) 0.745** 0.636*Back strength (kg) 0.846** 0.307Sit-up (times) 0.383 0.278Sit and reach (cm) 0.487 0.696*Abalakov test (cm) -0.070 0.162Squat jump (cm) 0.159 0.340Maximum oxygen uptakeV.o2 max (l/min) 0.709* 0.663*
V.o2 max (ml/kg/min) -0.576 -0.503
Blood lactate (mmol) 0.595 -0.756hrmax (bpm) 0.103 -0.299Wingate testPave (W) 0.816** 0.663*Ppeak (W) 0.719* 0.631*Pave. (W/kg) 0.061 0.038Ppeak (W/kg) -0.035 0.2211RMBack squat (kg) 0.335 -0.285Bench press (kg) 0.760** 0.587*Isokinetic of knee strength60°/s extension (n ⋅ m) 0.761** 0.506
Flexion (n ⋅ m) 0.784** 0.519
extension (n ⋅ m/kg) 0.258 -0.115 Flexion (n ⋅ m/kg) 0.349 0.026
180°/s extension (n ⋅ m) 0.858** 0.368
Flexion (n ⋅ m) 0.784** 0.706*
extension (n ⋅ m/kg) 0.574 -0.244 Flexion (n ⋅ m/kg) 0.552 0.216
300°/s extension (n ⋅ m) 0.840** 0.508
Flexion (n ⋅ m) 0.805** 0.722**
extension (n ⋅ m/kg) 0.497 -0.092 Flexion (n ⋅ m/kg) 0.573 0.251
Notes: **P,0.01; *P,0.05.Abbreviations: V
.o2 max, maximum oxygen uptake; hrmax, maximum heart rate;
Pavg, Wingate test average power; Ppeak, Wingate test peak power; 1rM, one repetition maximum.
positively correlated with body mass (70.8±7.8 kg, r=0.878,
P,0.01), BMI (23.7±1.9, r=0.803, P,0.01), upper limb
length (78.3±2.8 cm, r=0.778, P,0.01), neck girth (37.3±1.8
cm, r=0.649, P,0.05), chest girth (94.6±6.3 cm, r=0.928,
P,0.01), waist girth (78.9±4.4 cm, r=0.801, P,0.01),
hip girth (92.3±4.0 cm, r=0.768, P,0.01), arm girth
(31.5±2.5 cm, r=0.876, P,0.01), forearm girth (26.7±2.0
cm, r=0.820, P,0.01), thigh girth (54.7±2.8 cm, r=0.781,
P,0.01), calf girth (36.4±1.9 cm, r=0.753, P,0.01), arm
lean body mass (3.4±0.5 kg, r=0.900, P,0.01), leg lean
body mass (9.9±1.0 kg, r=0.767, P,0.01), trunk lean body
mass (13.4±1.5 kg, r=0.869, P,0.01), total lean body
mass (57.2±5.5 kg, r=0.913, P,0.01), arm BMC (0.2±0.03
kg, r=0.854, P,0.01), leg BMC (0.6±0.07 kg, r=0.819,
P,0.01), trunk BMC (0.6±0.09 kg, r=0.772, P,0.01),
and total body BMC (3.1±0.4 kg, r=0.783, P,0.01).
Especially, there were “nearly perfect” positive correlations
with chest circumference and lean mass of arm and total
body (r.0.9).
In kayak paddlers, performance test was positively cor-
related with height (172.8±5.3 cm, r=0.639, P,0.05), body
mass (69.5±7.8 kg, r=0.825, P,0.01), BMI (23.2±2.1,
r=0.625, P,0.05), arm span (177.4±8.0 cm, r=0.705,
P,0.05), upper limb length (78.0±3.2 cm, r=0.726, P,0.01),
leg length (89.2±3.3 cm, r=0.621, P,0.05), chest girth
(93.9±5.7 cm, r=0.826, P,0.01), waist girth (78.6±5.2
cm, r=0.743, P,0.01), hip girth (91.9±3.9 cm, r=0.752,
P,0.01), calf girth (36.6±1.7 cm, r=0.905, P,0.01), arm
fat mass (0.3±0.1 kg, r=0.594, P,0.05), arm lean body mass
(3.4±0.6 kg, r=0.895, P,0.01), leg lean body mass (9.8±1.2
kg, r=0.845, P,0.01), trunk lean body mass (13.5±1.3
kg, r=0.640, P,0.05), total lean body mass (57.6±5.8 kg,
r=0.824, P,0.01), and arm BMC (0.2±0.03 kg, r=0.798,
P,0.01). Especially, there was “nearly perfect” positive
correlation with calf circumference (r.0.9).
relationship between performance test and physical characteristicsTable 5 shows the r-values for the relationship between
performance test and physical characteristics of canoe and
kayak paddlers. In canoe paddlers, performance test was posi-
tively associated with grip strength (50.0±11.5 kg, r=0.745,
P,0.01), back strength (146.9±29.4 kg, r=0.846, P,0.01),
Vo2 max
(3.83±0.3 L/min, r=0.709, P,0.05), Wingate test aver-
age power (649.9±86.4 W, r=0.816, P,0.01) and peak power
(861.2±121.7 W, r=0.719, P,0.05), bench press (90.8±21.7
kg, r=0.760, P,0.01), and isokinetic knee extension and
flexion strength at 60°/s (ext: 195.3±30.8 N ⋅ m, r=0.761,
P,0.01; flex: 109.1±20.2 N ⋅ m, r=0.784, P,0.01), 180°/s
(ext: 125.4±26.0 N ⋅ m, r=0.858, P,0.01; flex: 87.2±22.5
N ⋅ m, r=0.784, P,0.01), and 300°/s (ext: 98.0±19.9 N ⋅ m,
r=0.840, P,0.01; flex: 75.4±20.1 N ⋅ m, r=0.805, P,0.01).
Significantly “very large” positive correlations were observed
with all parameters (r.0.7).
In kayak paddlers, performance test was positively asso-
ciated with grip strength (50.6±7.9 kg, r=0.636, P,0.05),
sit and reach (51.6±7.9 cm, r=0.696, P,0.05), Vo2 max

Open Access Journal of Sports Medicine 2015:6 submit your manuscript | www.dovepress.com
Dovepress
Dovepress
197
Morphological and physiological characteristics of sprint paddlers
(3.83±0.3 L/min, r=0.663, P,0.05), Wingate test average
power (640.3±82.9 W, r=0.663, P,0.05) and peak power
(841.1±134.5 W, r=0.631, P,0.05), bench press (83.8±18.6
kg, r=0.587, P,0.05), and isokinetic knee flexion strength
at 180°/s (85.7±13.4 N ⋅ m, r=0.706, P,0.05) and 300°/s
(72.0±11.3 N ⋅ m, r=0.722, P,0.01). Furthermore, cor-
relations with absolute values alone were seen for Vo2 max
,
Wingate test average and peak power, and isokinetic knee
extension and flexion strength in both canoe and kayak
paddlers. Kayak paddlers showed a “very large” positive
correlation with isokinetic knee flexion strength at 180°/s
and 300°/s (r.0.7).
DiscussionSince the pattern of movement in canoe sprint dif-
fers apparently between canoe and kayak, the physical
characteristics and fitness may also vary between the
competitions. In the present study, we investigated the
association between performance test on an ergometer
and physical characteristics and fitness in university canoe
sprinters. Our results did not reveal significant differences
in any of the measurement items for anthropometric char-
acteristics, body composition, and fitness (Tables 1 and 2).
On the other hand, the relationship between performance
test and each measurement item according to the disci-
pline showed that isokinetic knee extension and flexion
strength at a low speed was important in canoe paddlers.
Moreover, arm and calf girth were found to be important
in canoe paddlers, while height, arm span, and leg length
were important in kayak paddlers.
comparisons of physical characteristics and fitness in canoe and kayak paddlersAccording to previous studies, elite canoe sprinters in Japan
tend to have a height of 171.2±5.5 cm and a body mass of
71.8±8.2 kg22 in the case of canoe paddlers, and a height of
172.3±4.6 cm and a body mass of 70.9±7.1 kg23 in the case
of kayak paddlers, which are similar to the physical char-
acteristics of the athletes in the present study. In terms of
fitness, our values for grip strength, sit up, bench press, and
Vo2 max
were almost the same as those in previous studies.5,12
The collegiate canoe sprinters in the present study, therefore,
had same physiques and fitness. We showed no significant
difference between disciplines in any of the anthropometric
characteristics, body composition, or fitness parameters in the
present study. This was likely due to the fact that both canoe
and kayak paddlers were from the same team and shared
the same training program, which made the effect of weight
training greater than that of training on water.
relationship between performance test and measurement itemsA study that investigated the correlation of body composition
and power output by a cycle ergometer showed that the power
output in the high body fat group was lesser than that in the
low body fat group.24 Regarding handball players, it reported
that body fat has a negative effect on power output.25 In our
study, although no significantly correlation was observed
with performance test and body fat, physical performance
was positively correlated with the physical characteristics of
body mass, upper limb length, chest girth, waist girth, hip
girth, calf girth, arm lean body mass, leg lean body mass,
trunk lean body mass, total lean body mass, and arm BMC in
both canoe and kayak paddlers. Moreover, in canoe paddlers,
the performance test was positively correlated with the physi-
cal characteristics of neck girth, arm girth, forearm girth,
thigh girth, and BMC (arms, trunk, and total body), while in
kayak paddlers, positive correlations were seen with height,
arm span, leg length, and arm fat mass (Table 4). Top level
athletes, such as Olympic and World Championship medal-
ists, have a mean height of 184.3±5.8 cm and a body mass of
85.2±6.2 kg,4 which are clearly greater than those of Japanese
athletes, including those in our study. Moreover, top-level
athletes throughout the world are reported to have less body
fat and more lean body mass.26 We also saw a relationship
between performance test and body and muscle mass in the
present study, which is considered important to increasing
the lean body mass in order to improve the performance in
canoe sprint.
In addition, we found that performance test was positively
correlated with grip strength, Vo2 max
, the Wingate test (aver-
age and peak power), bench press, and isokinetic knee flexion
strength (180°/s, 300°/s ) in both canoe and kayak paddlers
(Table 5). The paddling motion in kayak mainly involves arm
and trunk muscles, and it is necessary to activate the bilateral
extensors and flexors of the hips and knees to simultaneously
twist the body. Moreover, because the stroke rate is higher
with kayak than it is with canoe, force needs to be exerted
at a high speed. On the other hand, the upper body is greatly
anteverted when the paddle enters the water during canoe
paddling. At this time, the legs also work to extend and
flex the knee joint. Furthermore, after the paddle enters the
water, paddling is achieved by lifting the upper body while
twisting the back, trunk muscles, and hip joints. Compared

Open Access Journal of Sports Medicine 2015:6submit your manuscript | www.dovepress.com
Dovepress
Dovepress
198
hamano et al
with kayak, the stroke rate of canoe is slower, although each
stroke distance is greater. Therefore, a greater amount of
force needs to be exerted per stroke. The performance test
was positively correlated with back strength, isokinetic knee
extension (60°/s, 180°/s, 300°/s ) and flexion strength (60°/s)
in canoe paddlers, and with sit and reach in kayak paddlers
(Table 5). The results of the present study likely reflect the
characteristics of the paddling motion of both competitions.
Our findings suggested that back strength and force exerted
by the legs at a slow speed are particularly important in canoe
paddlers as compared with kayak paddlers.
The present study had the following three limitations.
First, the canoe and kayak ergometer used in the present study
was useful in evaluating performance.20 However, it does
not reflect balance and technical factors on the water. It will
therefore be necessary to investigate the association between
actual race time and physical and fitness characteristics. In
particular, it has been reported that gaining speed in the early
stage of the race and preventing a reduction in speed in the
final stage is important in order to improve performance on
the water.27 It is therefore necessary to investigate the speed
at the start, middle, and end of the race in detail. It has also
been reported that anaerobic power in the upper limbs is
important in kayak.13 To further elucidate the characteristics
of each discipline, anaerobic capacity of isokinetic muscle
strength of the upper limbs (elbow, shoulder, and wrist
joints) and of arm cranking using the upper limbs and so
forth may need to be measured. Second, the sample size was
small. Further study with a bigger sample size is needed to
investigate how the factors affect the performance in canoe
and kayak paddlers, using multiple regression analyses. The
final limitation is the repeatability of measurements. The per-
formance tests and anthropometric tests were performed by
well-trained investigators in this study. Although we believe
that measurement bias could be suppressed, we could not
exclude the possibility of it. Further study may be required
for repeated measurements and evaluations using precision
mechanical equipment such as ultrasound or magnetic reso-
nance imaging.
ConclusionThe present study compared the relationship between perfor-
mance test and physical and fitness characteristics in canoe
and kayak, which are both disciplines in canoe sprint. We
observed no differences in physical and fitness characteristics
between the two disciplines. However, our findings suggested
that factors associated with performance differ according to
the competition. Therefore, we conclude that it is necessary
to implement a different training program depending on the
type of canoe sprint. The findings of this study will be useful
data to consider while planning the training programs and
discovering talented athletes.
DisclosureThe authors report no conflicts of interest in this work.
References 1. Shephard RJ. Science and medicine of canoeing and kayaking. Sports
Med. 1987;4(1):19–33. 2. Naka T, Han I, Ohno M. Right and left segmental body composition in
female basketball players and swimmers. Bull Nippon Sport Sci Univ. 2008;38(1):1–8. Japanese.
3. Robinson MG, Holt LE, Pelham TW. The technology of sprint racing canoe and kayak hull and paddle designs. Int Sports J. 2002;6:68–85.
4. Ackland TR, Ong KB, Kerr DA, Ridge B. Morphological character-istics of Olympic sprint canoe and kayak paddlers. J Sci Med Sport. 2003;6(3):285–294.
5. Nakagaki K, Yoshihisa T, Umemura Y, Nabekura Y. Characteristics of physical ability in Japanese flat-water kayak paddlers. J Train Sci Exerc Sport. 2006;18(3):229–239. Japanese.
6. Misigoj-Duraković M, Heimer S. Characteristics of the morphological and functional status of kayakers and canoeists. J Sports Med Phys Fitness. 1992;32(1):45–50.
7. Tanaka N, Tsujita J, Hori S, Senga Y, Otsuki T, Yamazaki T. Studies on physique and body shape of athletes with special reference to differ-ences in physique among athletes of various kinds of sports. Jpn Soc Phys Fitness Sport Med. 1997;26:114–123. Japanese.
8. Enoki T, Nakagawa M, Imai Y. Relationship between body composition and physical strength characteristics in collegiate American football players. Bull Osaka Kyoiku Univ. 2013;61(2):47–53. Japanese.
9. Tsuchiya Y, Ochi E, Sakuraba K, Kikuchi N, Hwang I. Isokinetic strength and anaerobic/intermittent capacity of Japanese lacrosse players. Isokinetic Exerc Sci. 2013;21(1):77–82.
10. Watanabe N, Enomoto Y, Ohyama BK, Miyashita K, Ogata M, Katsuta S. Relationships between movement as well as joint torque during sprint running and isokinetic maximal strength. Jpn J Phys Educ Health Sport Sci. 2003;48:405–419. Japanese.
11. Miyamori T, Yoshimura M, Ayabe M, Miyahara Y, Aoba Y, Suzuki S. Characteristics of physical abilities of college soccer players accord-ing to their usual playing position – relationships of the distance and speed of movements during a game with physiologic characteristics. Rigakuryoho Kagaku. 2008;23(2):189–195.
12. Hashimoto A, Nakamura N, Takai Y, Masayoshi Y. Relationship between morphological characteristic/power output and performance of time in university sprint kayak paddlers. J Sport Train Sci. 2011;12:1–8. Japanese.
13. Isaka T, Takahashi K. Aerobic and anaerobic power and muscle thick-ness of varsity kayak paddlers. Jpn Soc Phys Fitness Sport Med. 1998; 47:295–304. Japanese.
14. Scott LM, Larry EH. The flatwater kayak stroke. NSCA J. 1985;7(5): 4–11.
15. van Someren KA, Palmer GS. Prediction of 200-m sprint kayaking performance. Can J Appl Physiol. 2003;28(4):505–517.
16. Marfell-Jones M. Kinanthropometric Assessment. Guidelines for Athlete Assessment in New Zealand Sport. Wellington, New Zealand: Sport Science New Zealand; 1991.
17. Muramatsu E, Otoki K, Igawa S. Assessment of body composition by segmental bioelectrical impedance method in Japanese college athletes – focus on the different characteristic of sports. NSSU J Sport Sci. 2012;1:28–25. Japanese.
18. Yamaji K. Athlete’s VO2max
, Science of the Maximal Oxygen Intake. 2nd ed. Yasubayashi Study; 2001. Japanese.

Open Access Journal of Sports Medicine
Publish your work in this journal
Submit your manuscript here: http://www.dovepress.com/open-access-journal-of-sports-medicine-journal
Open Access Journal of Sports Medicine is an international, peer-reviewed, open access journal publishing original research, reports, reviews and commentaries on all areas of sports medicine. The manuscript management system is completely online and includes a very quick and fair peer-review system.
Visit http://www.dovepress.com/testimonials.php to read real quotes from published authors.
Open Access Journal of Sports Medicine 2015:6 submit your manuscript | www.dovepress.com
Dovepress
Dovepress
Dovepress
199
Morphological and physiological characteristics of sprint paddlers
19. Thomas RB, Roger WE. Essentials of Strength Training and Conditioning. 3rd ed. Champaign, IL: Human Kinetics; 2008.
20. Nakagaki K, Yoshioka T, Nabekura Y. Development of a simplified method for assessment of metabolic capacity and characteristics of sprint kayak paddlers using the critical power model. J Train Sci Exerc Sport. 2010;22(2):111–123.
21. Cohen J. Statistical Power Analysis for the Behavioral Sciences. 2nd ed. Hillsdale, NJ: Lawrence Erlbaum Associates; 1988.
22. Fujinaka T, Yamamoto M. Investigation of the measurement and evalu-ation of aerobic and anaerobic capacity for canoe paddlers – using the canoe ergometer developed newly. J Sports Train Sci. 2005;6:14–23. Japanese.
23. Nakagaki K, Yoshioka T, Nabekura Y, Relationship between flat-water kayak performance and energy supply capacity. Jpn J Phys Fitness Sports Med. 2007;56:115–124. Japanese.
24. Nikolaidis PT. Body mass index and body fat per cent are associated with decreased power output in soccer players. Cent Eur J Med. 2014; 7(6):783–789.
25. Nikolaidis PT, Ingebrigtsen J. The effect of excess body mass on physical fitness in adolescent and adult male handball players. Indian J Physiol Pharmacol. 2013;57(4):369–379.
26. Sitkowski D. Some indices distinguishing Olympic or world champion-ship medallists in sprint kayaking. Biol Sport. 2002;19(2):133–147.
27. Ikeda T, Shibuya K, Ohiwa N, Matsuo A. The reality of the race per-formance for Japanese top kayakers, and the aims of the race strategy for the 2008 Beijing Olympic. Jpn J Elite Sports Support. 2009;2. Japanese.