Embed Size (px)
Citation preview
Kentucky Thoroughbred Farm Managers’ Club
May 25, 2016
2
Mt.Carmel Farm
3
NTRA TodayAdvocacy – Integrity - Leadership
4
Fritz Widaman
www.NTRA.com

5
6
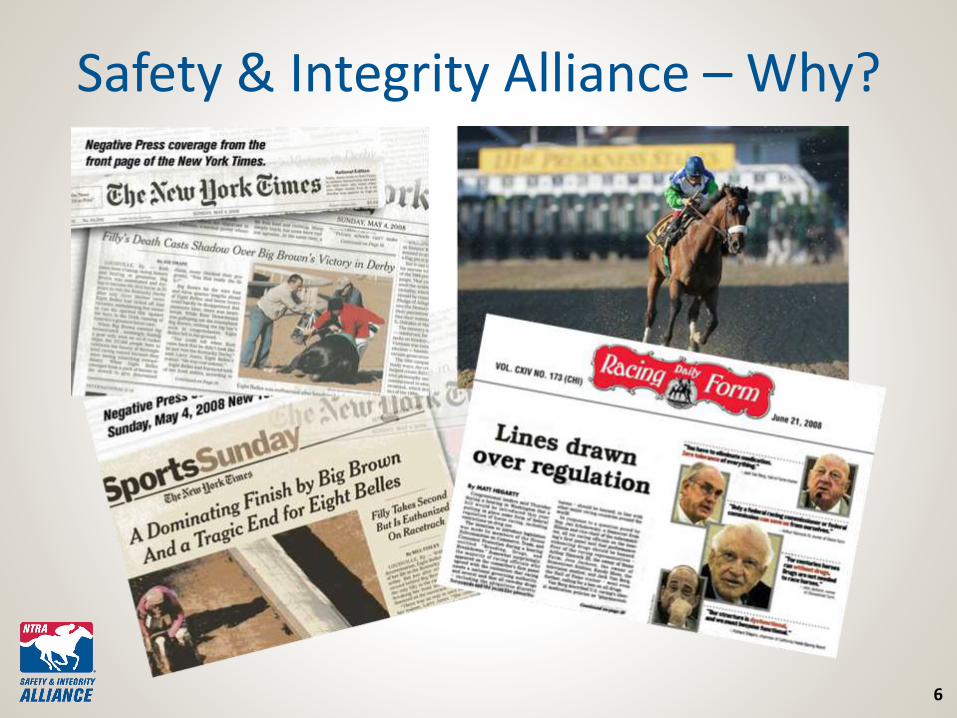
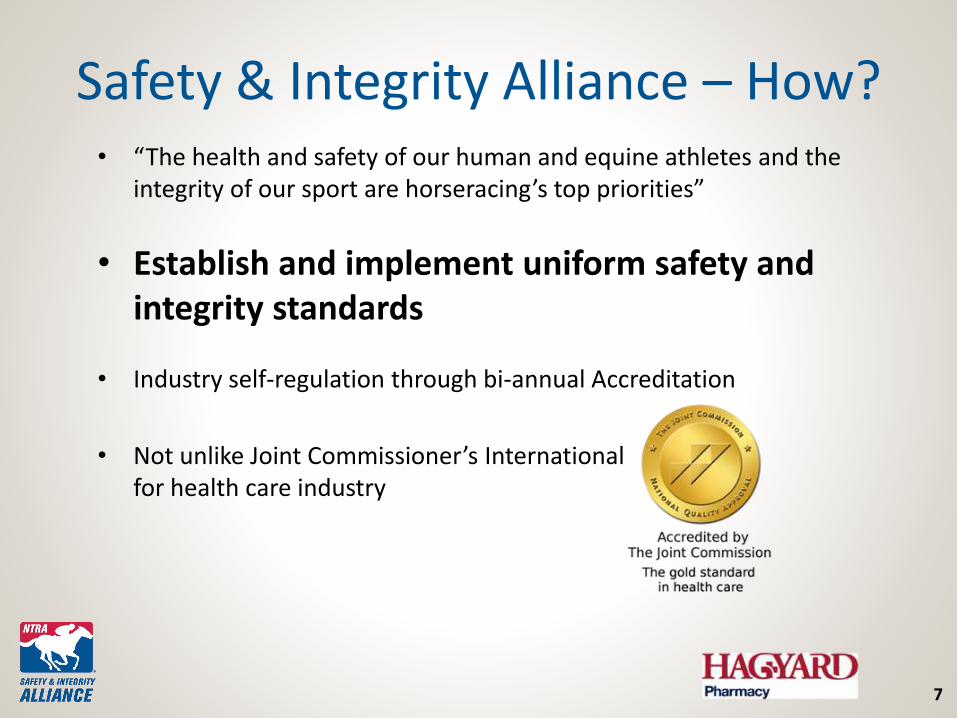
Safety & Integrity Alliance – Why?
7
• “The health and safety of our human and equine athletes and the integrity of our sport are horseracing’s top priorities”
• Establish and implement uniform safety and integrity standards
• Industry self-regulation through bi-annual Accreditation
• Not unlike Joint Commissioner’s International for health care industry
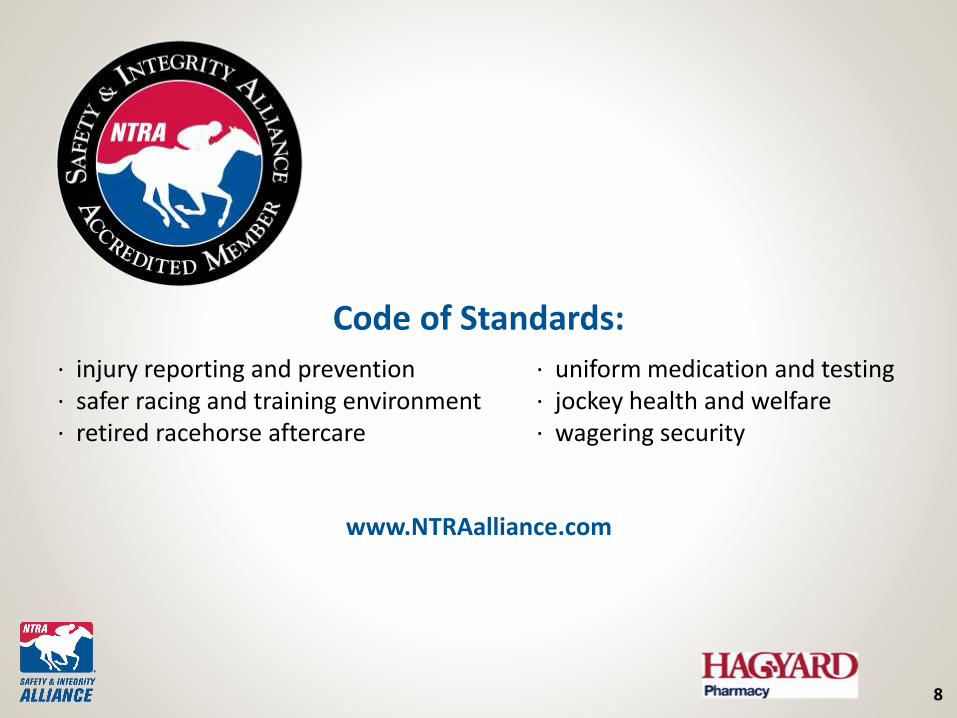
Safety & Integrity Alliance – How?
8
Code of Standards:
· injury reporting and prevention · uniform medication and testing· safer racing and training environment · jockey health and welfare· retired racehorse aftercare · wagering security
www.NTRAalliance.com
9
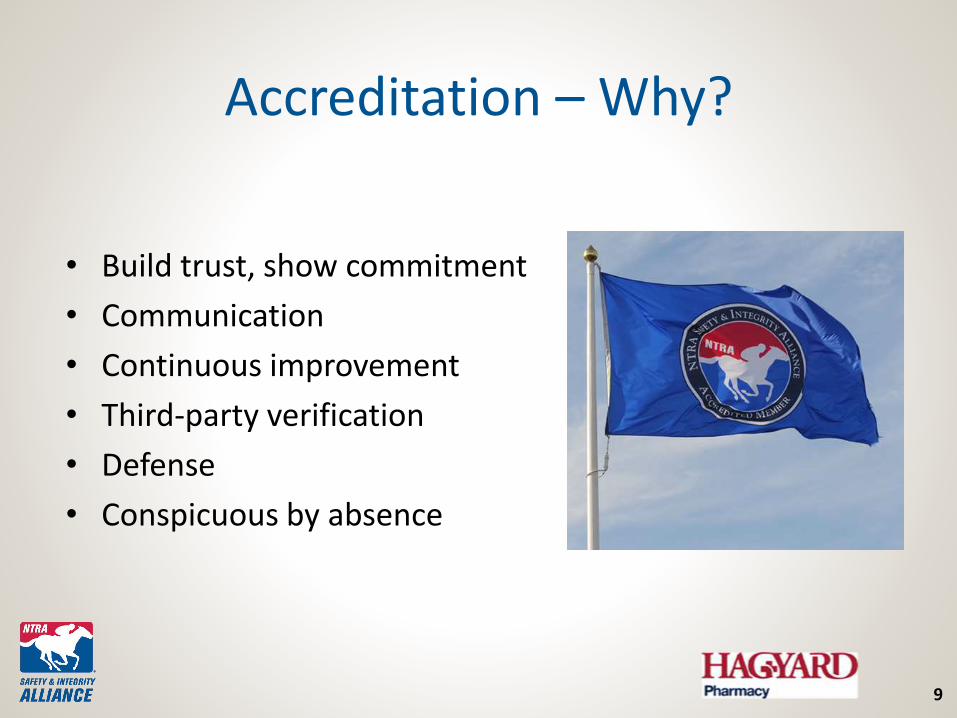
Accreditation – Why?
• Build trust, show commitment
• Communication
• Continuous improvement
• Third-party verification
• Defense
• Conspicuous by absence
10
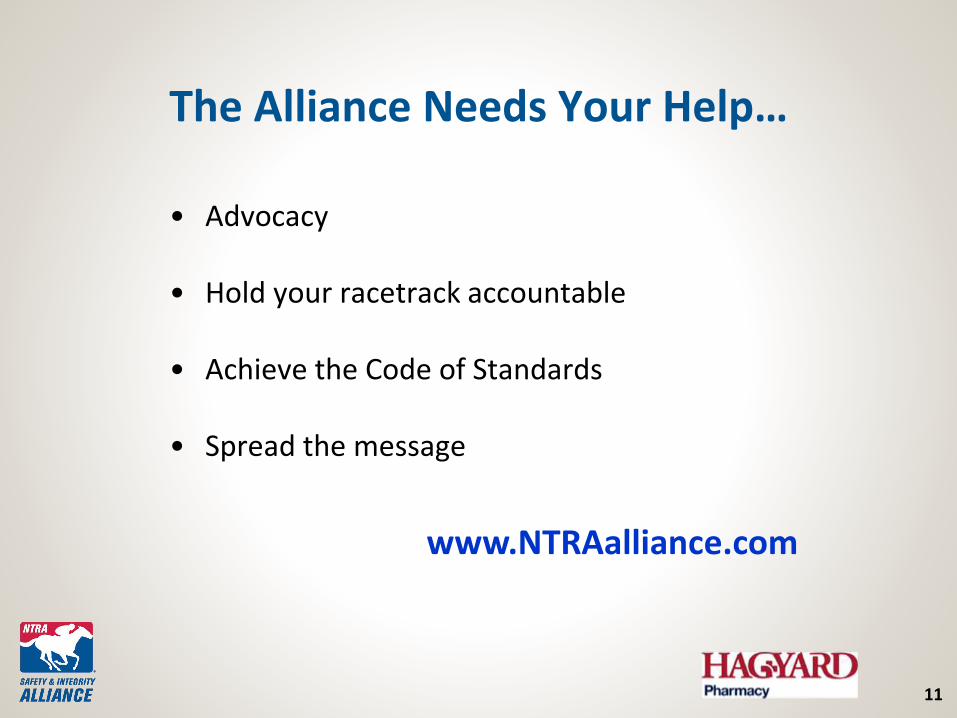
11
• Advocacy
• Hold your racetrack accountable
• Achieve the Code of Standards
• Spread the message
www.NTRAalliance.com
The Alliance Needs Your Help…
12
December 22, 2015

13
Equi-nomics
14
15
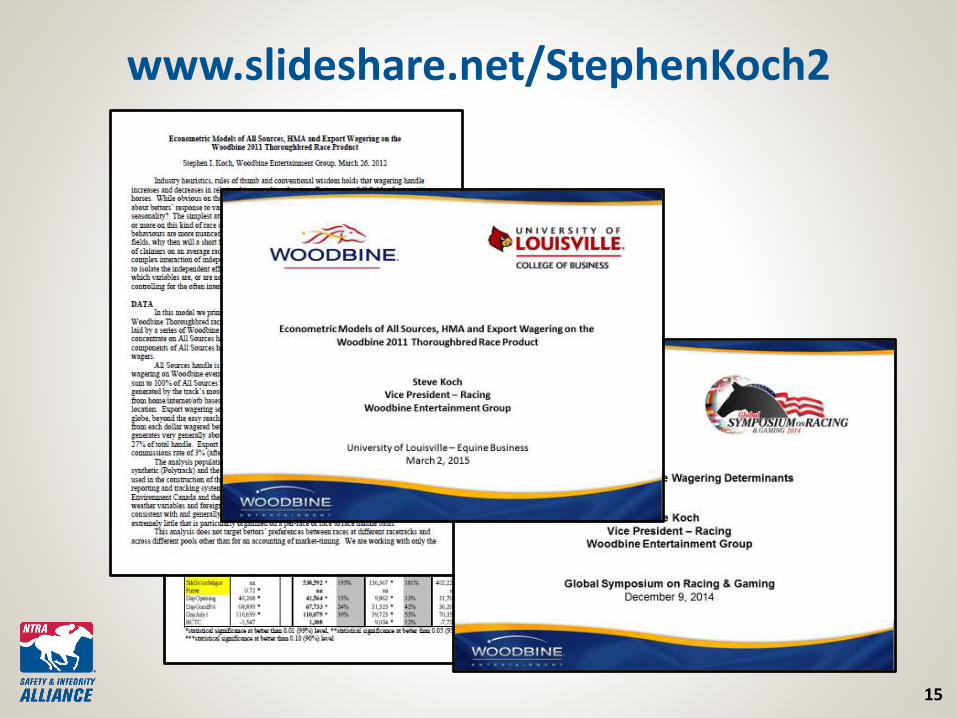
www.slideshare.net/StephenKoch2
16
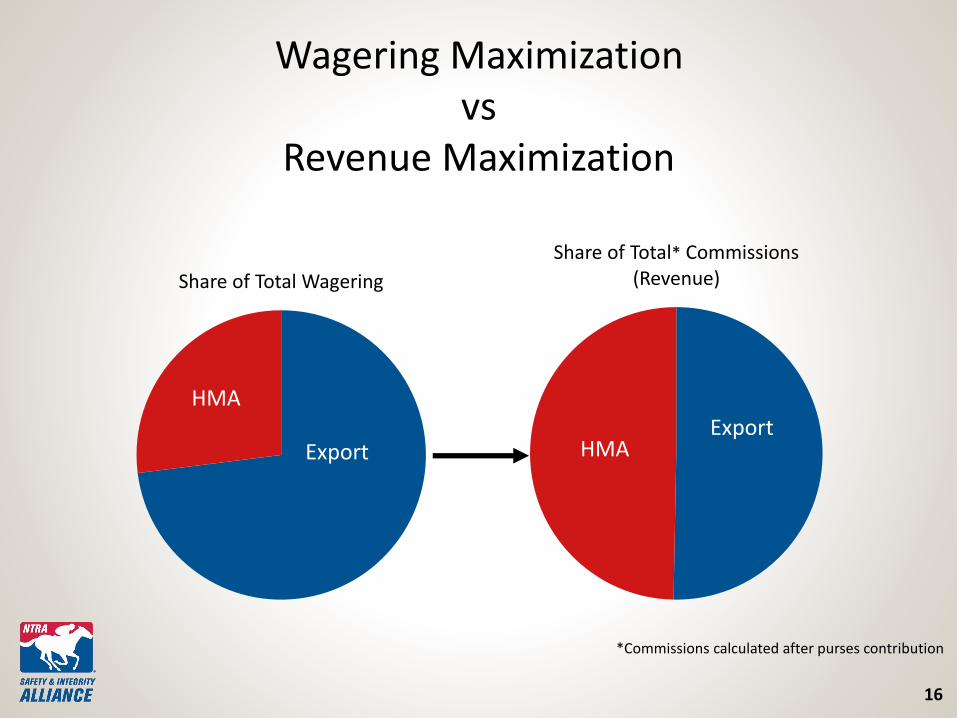
Wagering Maximizationvs
Revenue Maximization
*Commissions calculated after purses contribution
Share of Total* Commissions(Revenue)Share of Total Wagering
HMA
HMAExportExport
17
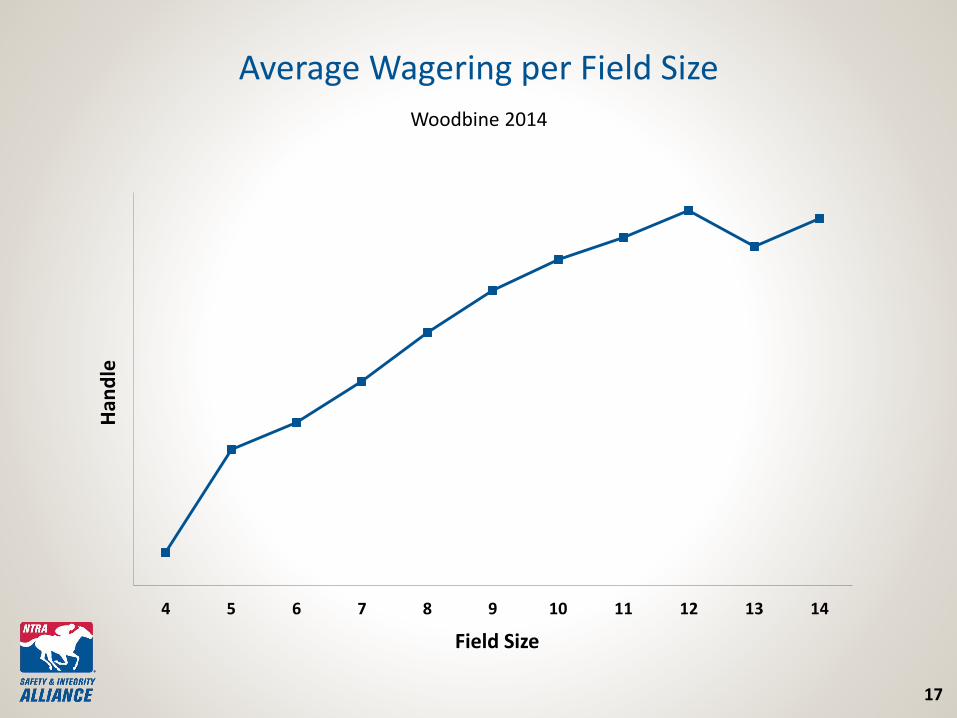
Average Wagering per Field Size
Woodbine 2014
4 5 6 7 8 9 10 11 12 13 14
Han
dle
Field Size
18
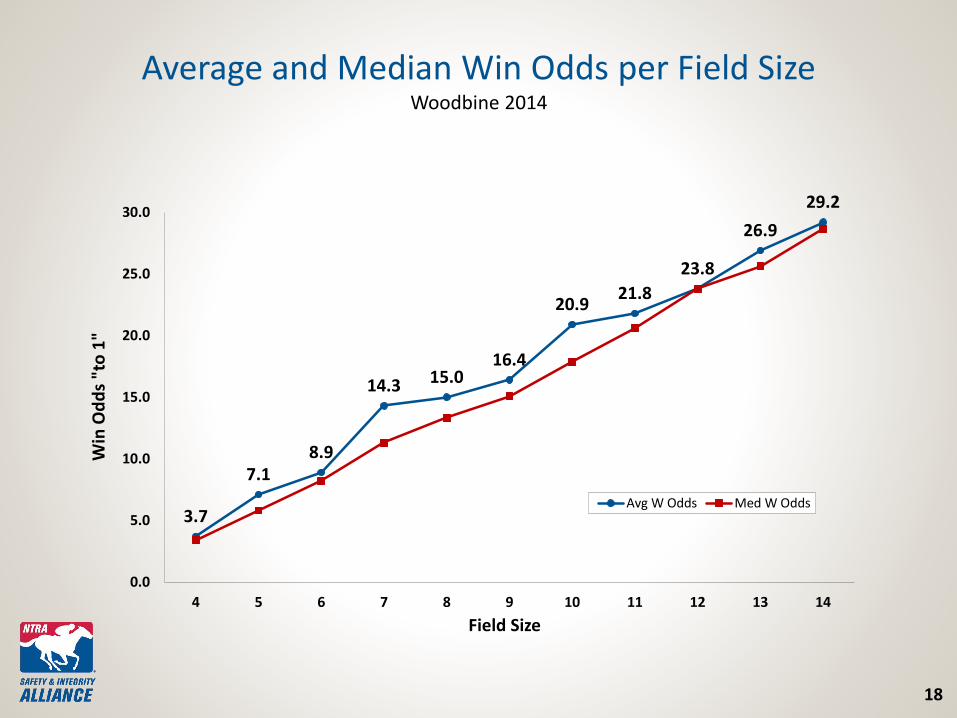
Average and Median Win Odds per Field Size Woodbine 2014
3.7
7.18.9
14.3 15.016.4
20.921.8
23.8
26.9
29.2
0.0
5.0
10.0
15.0
20.0
25.0
30.0
4 5 6 7 8 9 10 11 12 13 14
Win
Od
ds
"to
1"
Field Size
Avg W Odds Med W Odds
19
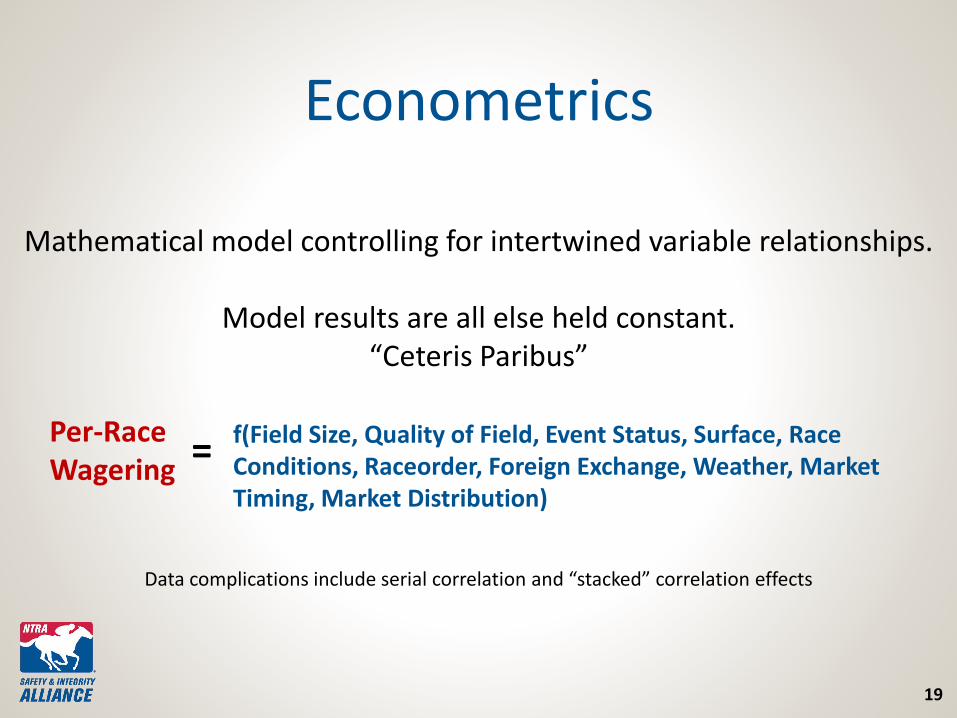
Econometrics
Mathematical model controlling for intertwined variable relationships.
Model results are all else held constant.“Ceteris Paribus”
Data complications include serial correlation and “stacked” correlation effects
Per-Race Wagering
f(Field Size, Quality of Field, Event Status, Surface, Race Conditions, Raceorder, Foreign Exchange, Weather, Market Timing, Market Distribution)
=
20
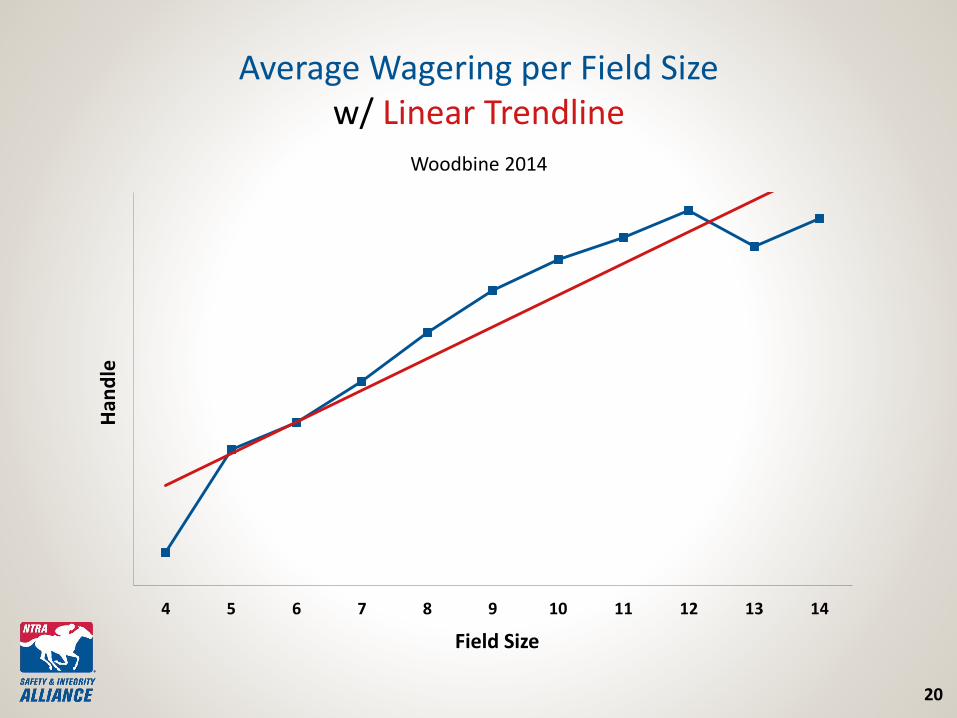
Average Wagering per Field Size w/ Linear Trendline
Woodbine 2014
4 5 6 7 8 9 10 11 12 13 14
Han
dle
Field Size
21
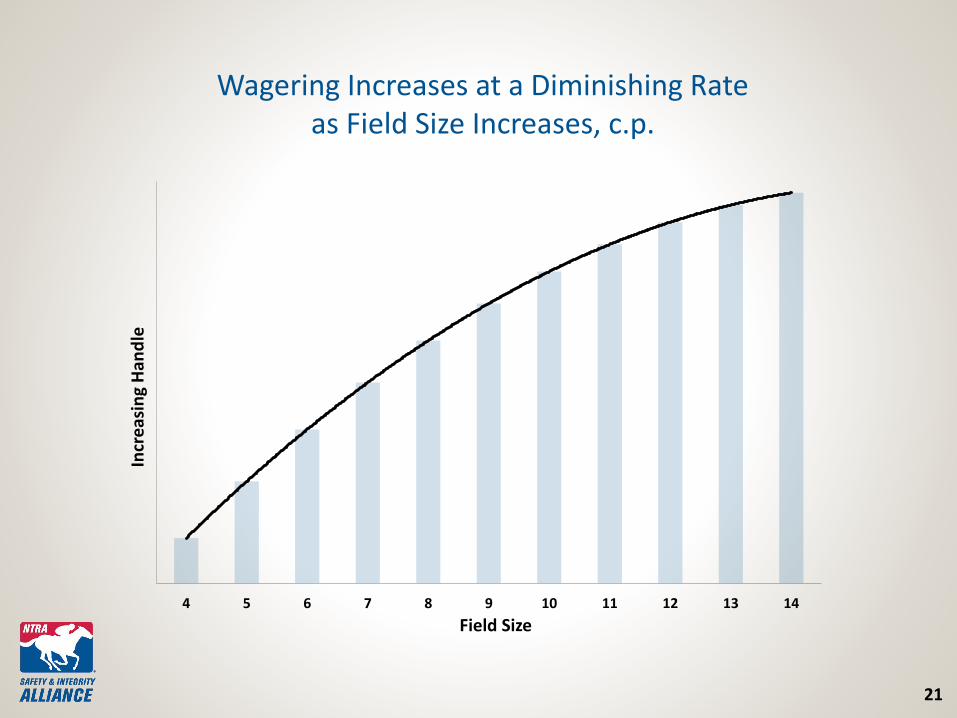
Wagering Increases at a Diminishing Rate as Field Size Increases, c.p.
4 5 6 7 8 9 10 11 12 13 14
Incr
eas
ing
Han
dle
Field Size
22
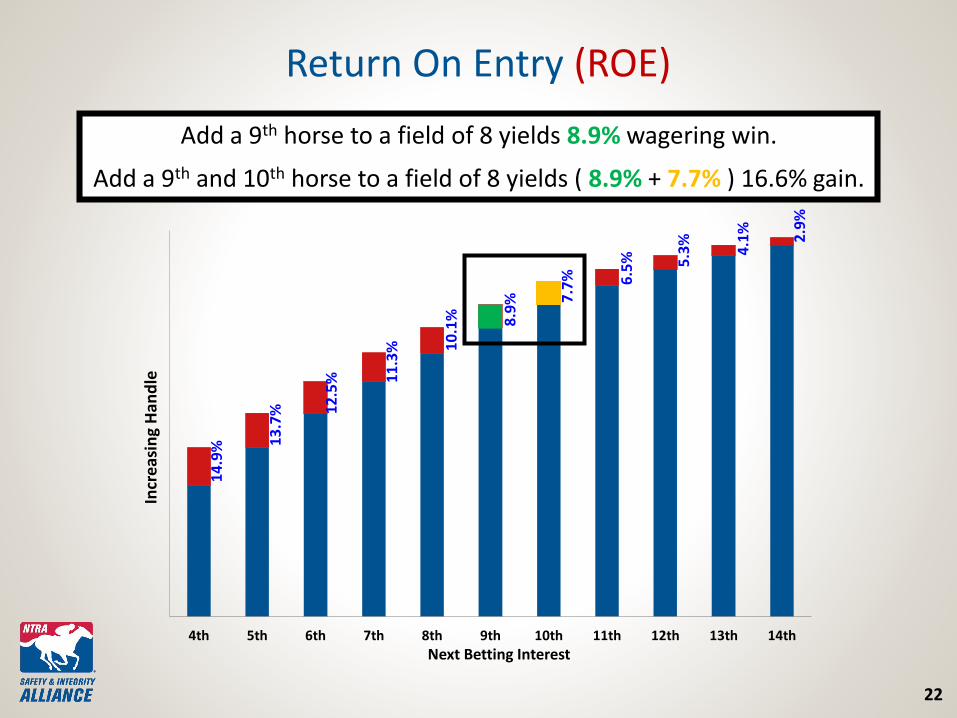
Return On Entry (ROE)
Add a 9th horse to a field of 8 yields 8.9% wagering win.
Add a 9th and 10th horse to a field of 8 yields ( 8.9% + 7.7% ) 16.6% gain.
14
.9% 1
3.7
% 12
.5% 1
1.3
% 10
.1% 8.9
% 7.7
% 6.5
% 5.3
%
4.1
%
2.9
%
4th 5th 6th 7th 8th 9th 10th 11th 12th 13th 14th
Incr
eas
ing
Han
dle
Next Betting Interest
23
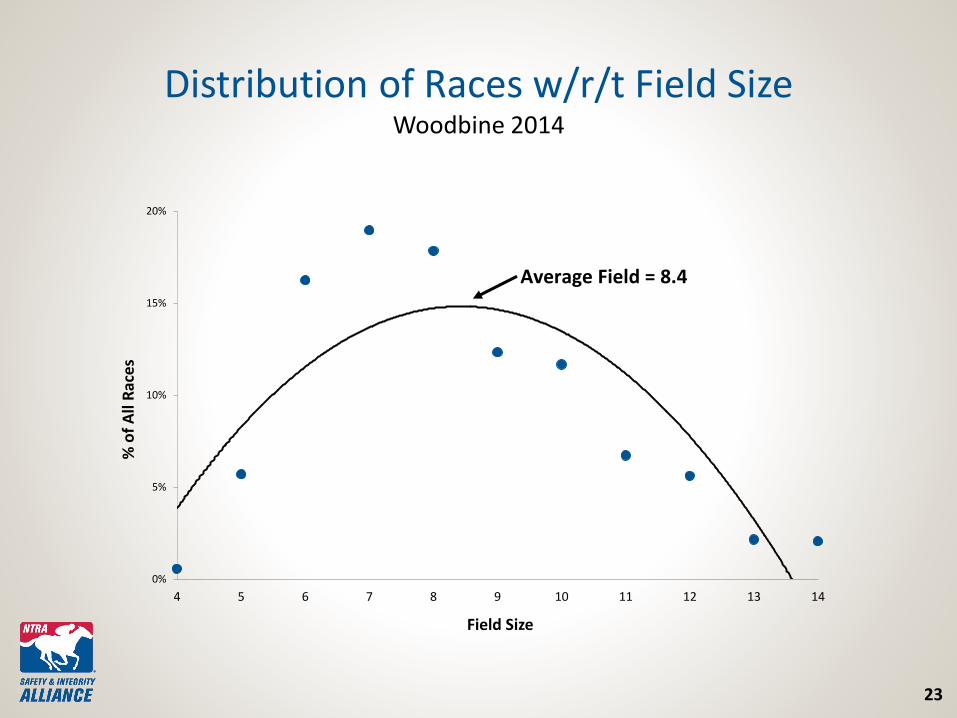
Distribution of Races w/r/t Field SizeWoodbine 2014
0%
5%
10%
15%
20%
4 5 6 7 8 9 10 11 12 13 14
% o
f A
ll R
ace
s
Field Size
Average Field = 8.4
0%
5%
10%
15%
20%
4 5 6 7 8 9 10 11 12 13 14
% o
f A
ll R
ace
s
Field Size
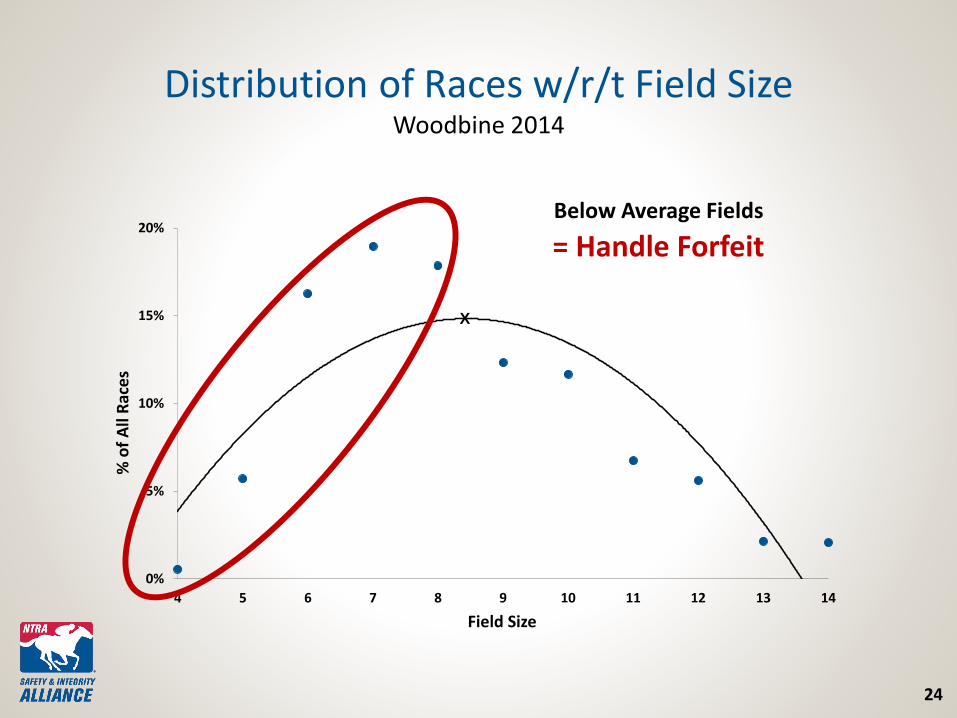
24
Distribution of Races w/r/t Field SizeWoodbine 2014
X
Below Average Fields
= Handle Forfeit
25
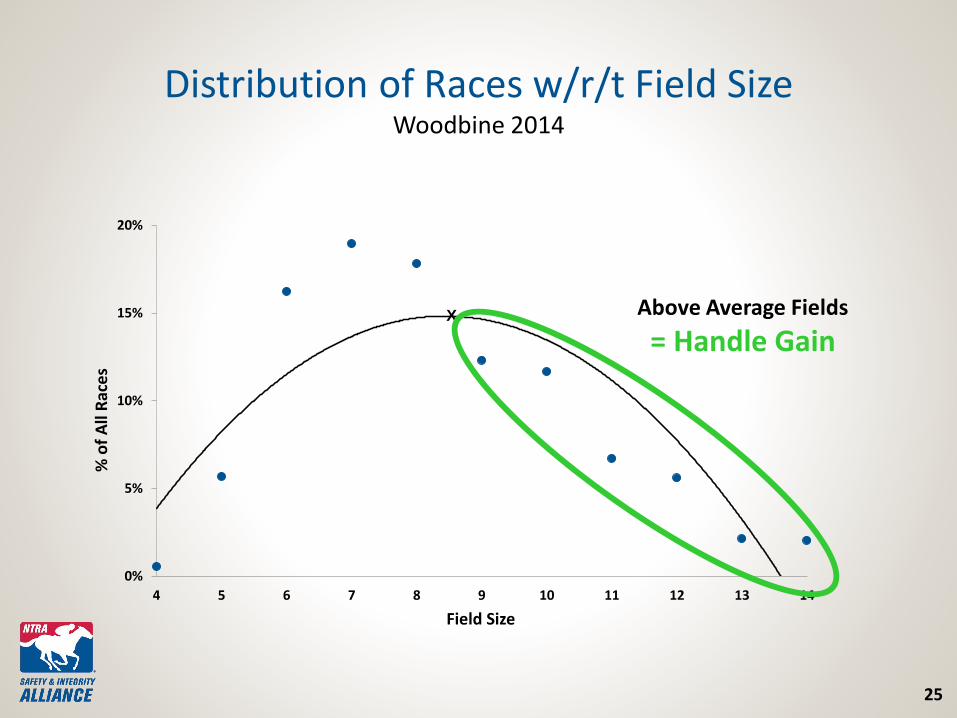
Distribution of Races w/r/t Field SizeWoodbine 2014
0%
5%
10%
15%
20%
4 5 6 7 8 9 10 11 12 13 14
% o
f A
ll R
ace
s
Field Size
X Above Average Fields
= Handle Gain
26
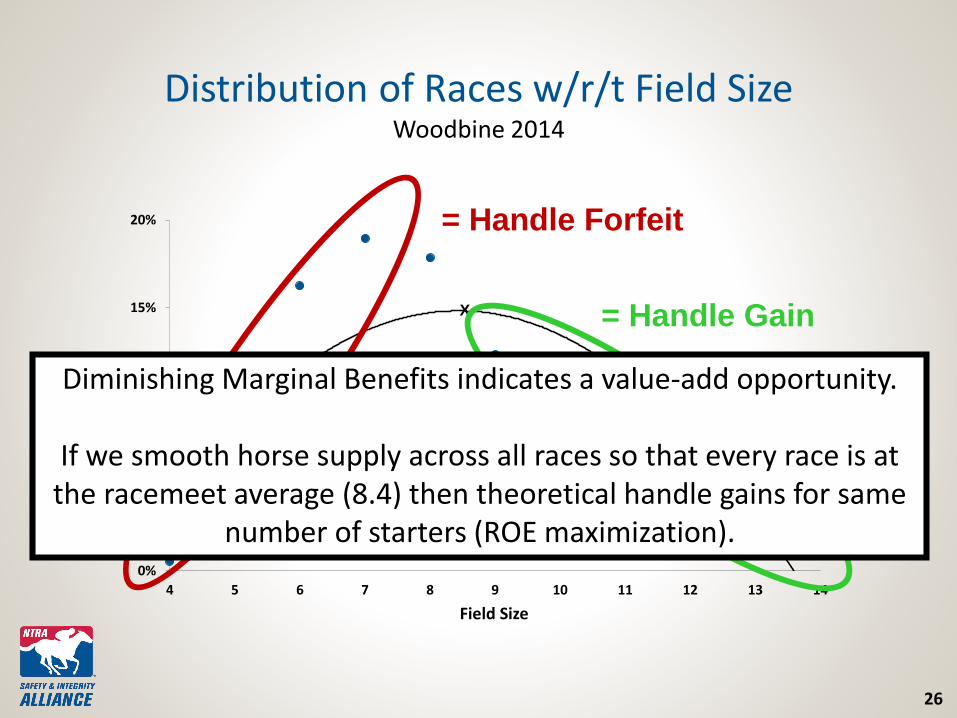
Distribution of Races w/r/t Field SizeWoodbine 2014
0%
5%
10%
15%
20%
4 5 6 7 8 9 10 11 12 13 14
% o
f A
ll R
ace
s
Field Size
X
= Handle Forfeit
= Handle Gain
Diminishing Marginal Benefits indicates a value-add opportunity.
If we smooth horse supply across all races so that every race is at the racemeet average (8.4) then theoretical handle gains for same
number of starters (ROE maximization).
27
But Field Size Isn’t Everything…
The customers reward us for Quality racing
• Purse levels can proxy for Woodbine Overnight race conditions
• Each $10k move up the purse scale brings 2.6% handle growth, c.p.
• Combine 2.6% wagering elasticity of race quality with the Diminishing Returns to Field Size…
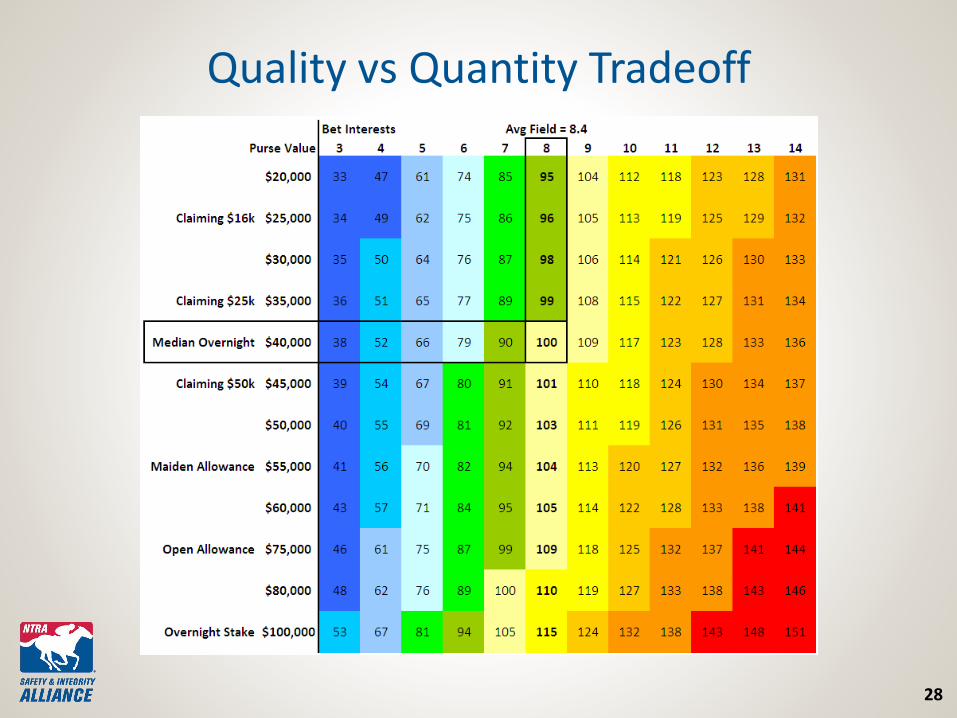
28
Quality vs Quantity Tradeoff
29
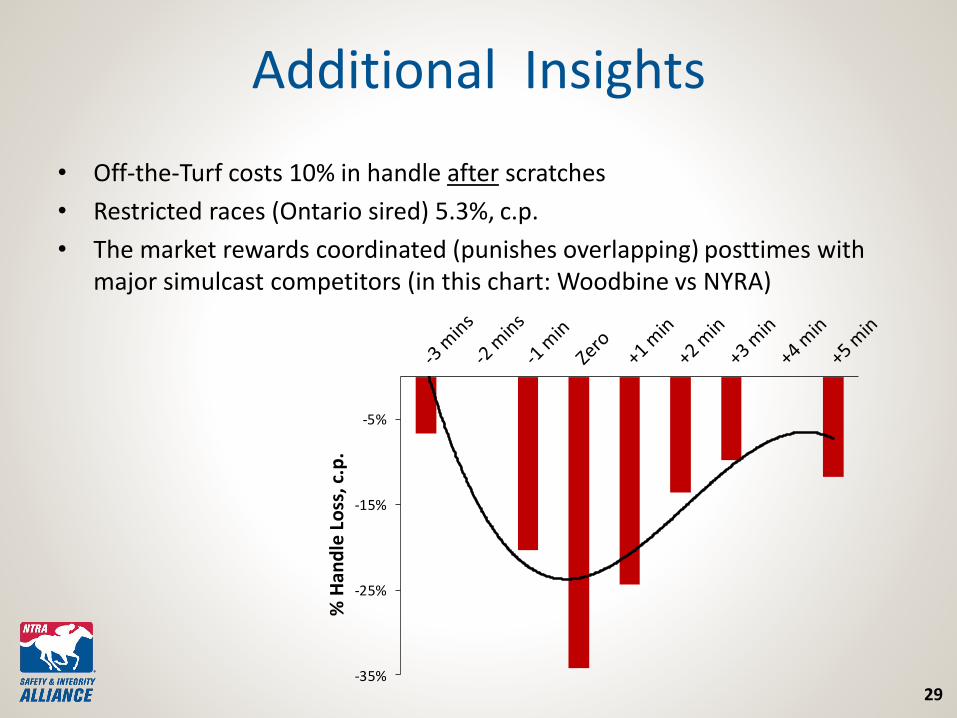
Additional Insights
• Off-the-Turf costs 10% in handle after scratches
• Restricted races (Ontario sired) 5.3%, c.p.
• The market rewards coordinated (punishes overlapping) posttimes with major simulcast competitors (in this chart: Woodbine vs NYRA)
-35%
-25%
-15%
-5%
% H
and
le L
oss
, c.p
.
30
Reduce the cost of losing
• Overnight purse distributions– Can the median horse competing 6 times/year break even on training bill?
– But don’t confuse with purchase payback
• Race condition variety, aka “Fishing”• 32 Surface/Distance X 3 Age X 2 Sex X 60 Conditions = 11,520 combinations
• Bonus restricted horses into open races– Restricted races = Ontario Sired, New York bred/sired, Louisiana
bred, Indiana bred/sired…
3131
Restricted Race Conditions
• Restricted races reduce wagering 5% c.p. at Woodbine
Gain 5% ROE per restricted entry converted into competitive OPEN race entry
*Neibergs, J.S. and R. Thalheimer. “An Economic Analysis of the Effectiveness of Thoroughbred Breeder/Owner Incentive Policies.” Journal of Agricultural and Applied Economics. 31,3(December 1999):581-592.
32
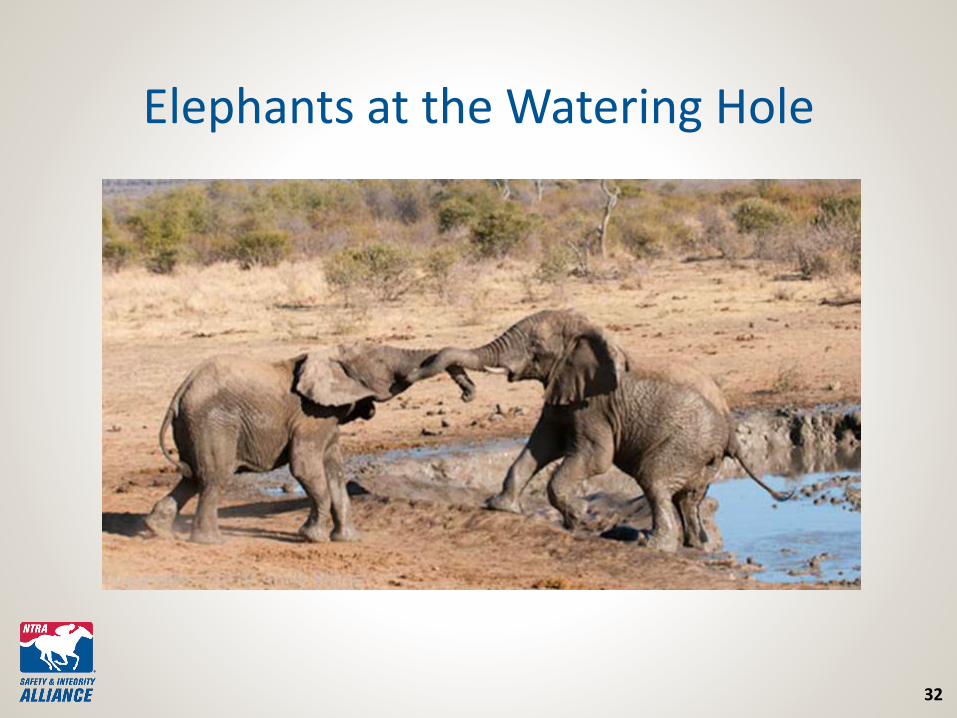
Elephants at the Watering Hole

33
www.NTRAalliance.comwww.slideshare.net/StephenKoch2