Embed Size (px)
Citation preview

Using Cameras for Wildlife Research, Management, and Education in Jefferson
County Open Space Parks
Tim Sandsmark, AdministratorLookout Mountain Nature Center, Jefferson County Open SpaceSpecial thanks to Bryan Posthumus, Natural Resource Specialist, Jeffco Open Space
Benefits of Camera SurveysBenefits of Camera Surveys
►Medium to large mammalsMedium to large mammals►Rare or secretive speciesRare or secretive species►24 hour surveillance24 hour surveillance►Survey areas with difficult access.Survey areas with difficult access.►Low cost- 1 digital camera~1 week Low cost- 1 digital camera~1 week
seasonal payseasonal pay

Appropriate UsesAppropriate Uses
►Monitors Activity►Limits to Population Studies►Game Trails►Movement Corridors►Seasonal, Spatial, Temporal Use►Bait Sites


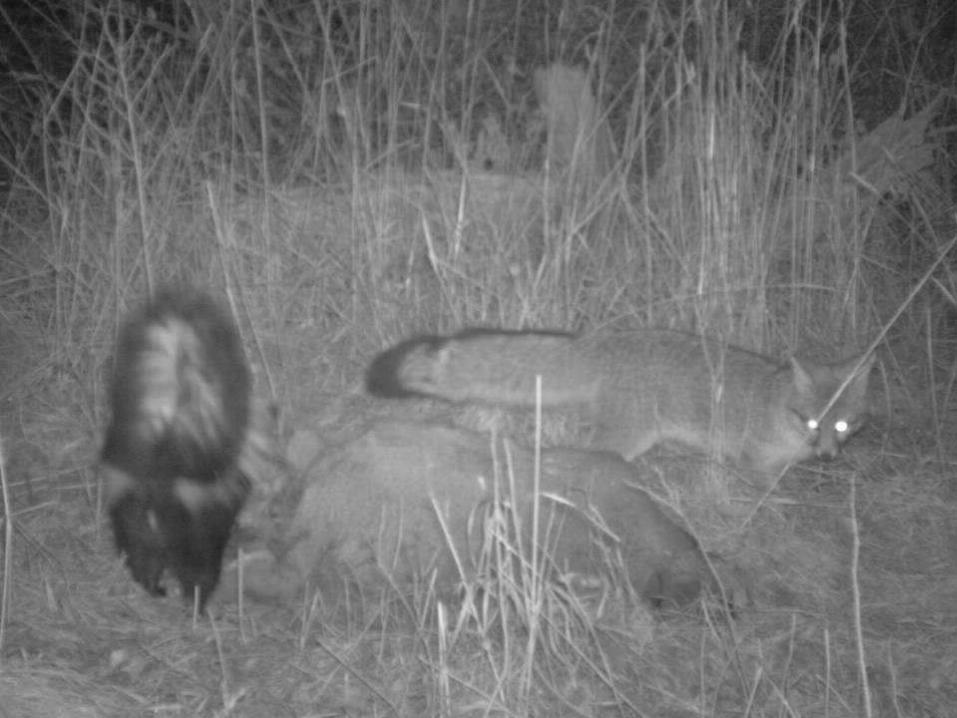


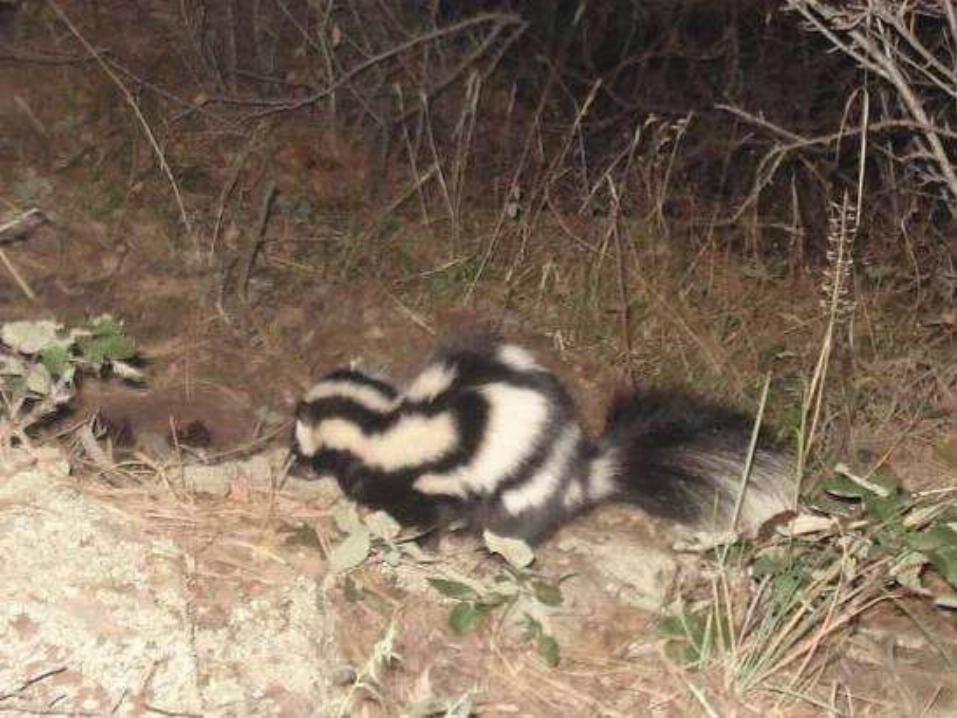
Be a Stinker! Get Respect!

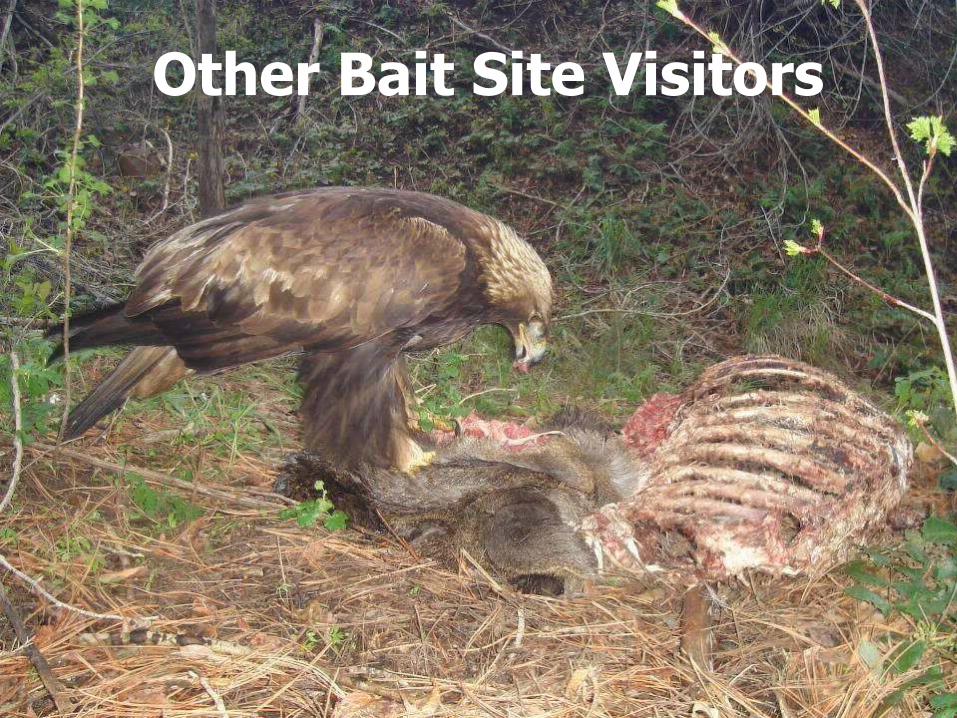
Other Bait Site Visitors


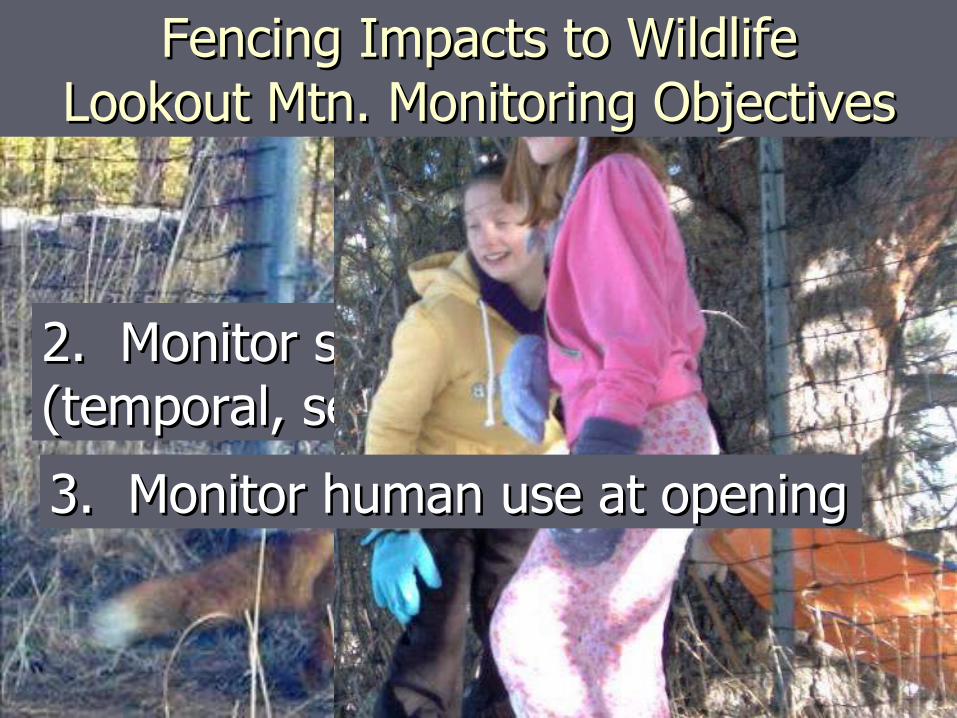
1. Monitor wildlife use 1. Monitor wildlife use pre/post openingpre/post opening2. Monitor species movement 2. Monitor species movement (temporal, seasonal, spatial)(temporal, seasonal, spatial)
3. Monitor human use at opening3. Monitor human use at opening
Fencing Impacts to WildlifeFencing Impacts to WildlifeLookout Mtn. Monitoring ObjectivesLookout Mtn. Monitoring Objectives
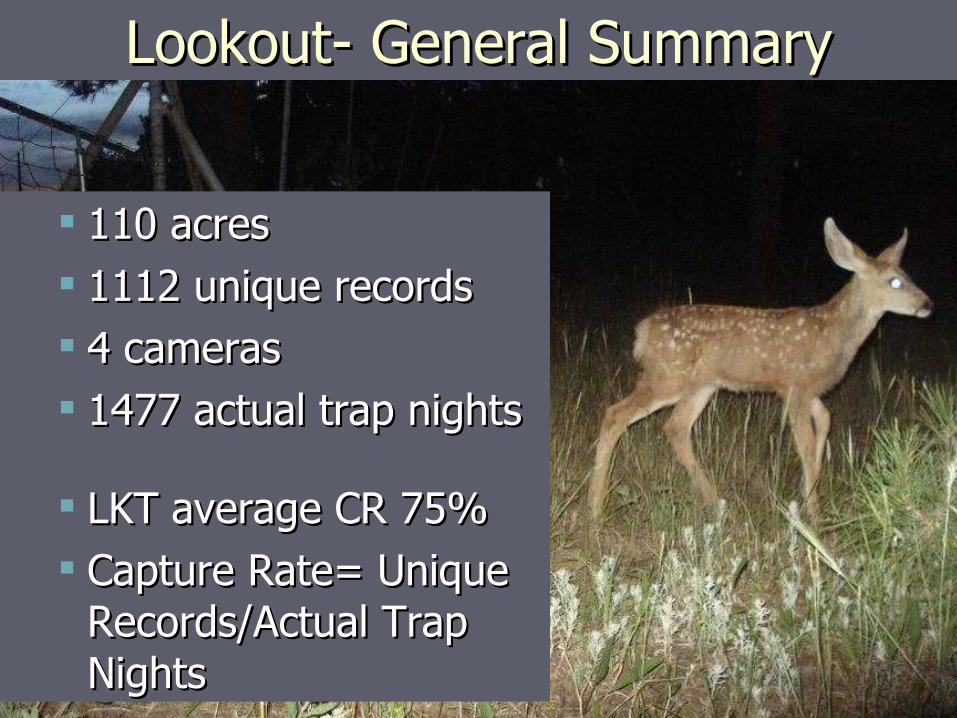
Lookout- General SummaryLookout- General Summary
110 acres110 acres 1112 unique records1112 unique records 4 cameras4 cameras 1477 actual trap nights1477 actual trap nights
LKT average CR 75%LKT average CR 75% Capture Rate= Unique Capture Rate= Unique
Records/Actual Trap Records/Actual Trap NightsNights
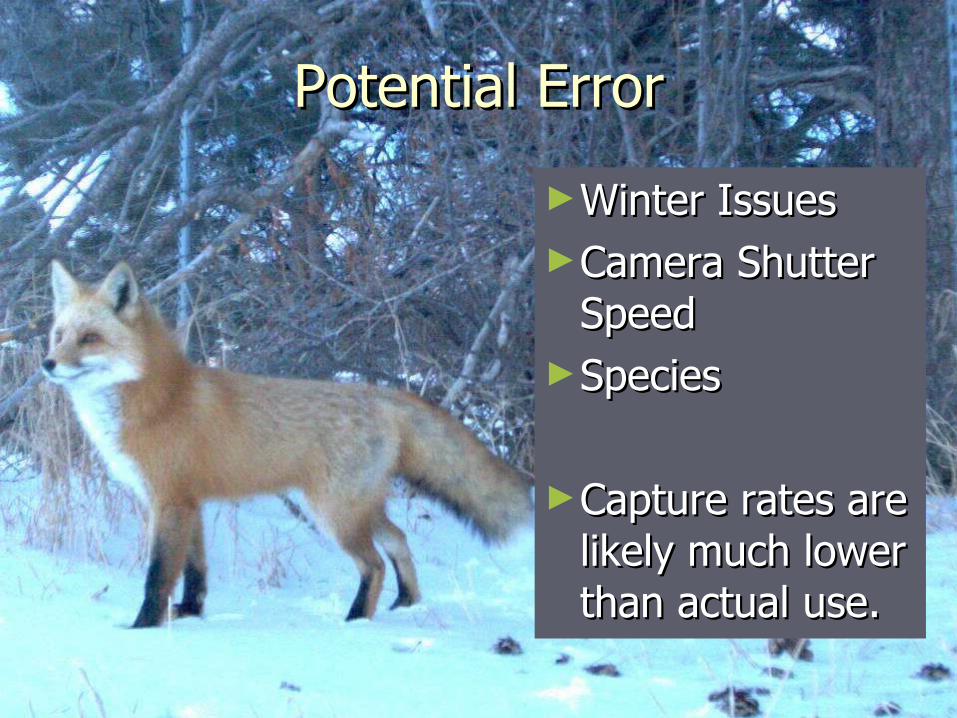
Potential ErrorPotential Error
►Winter IssuesWinter Issues►Camera Shutter Camera Shutter
SpeedSpeed►SpeciesSpecies
►Capture rates are Capture rates are likely much lower likely much lower than actual use.than actual use.


0%
20%
40%
60%
80%
100%
120%
140%
Bear Coyote Deer Elk Fox Person
2007 CR
2008 CR
Objective 1. Monitor wildlife use pre/post openingObjective 1. Monitor wildlife use pre/post opening
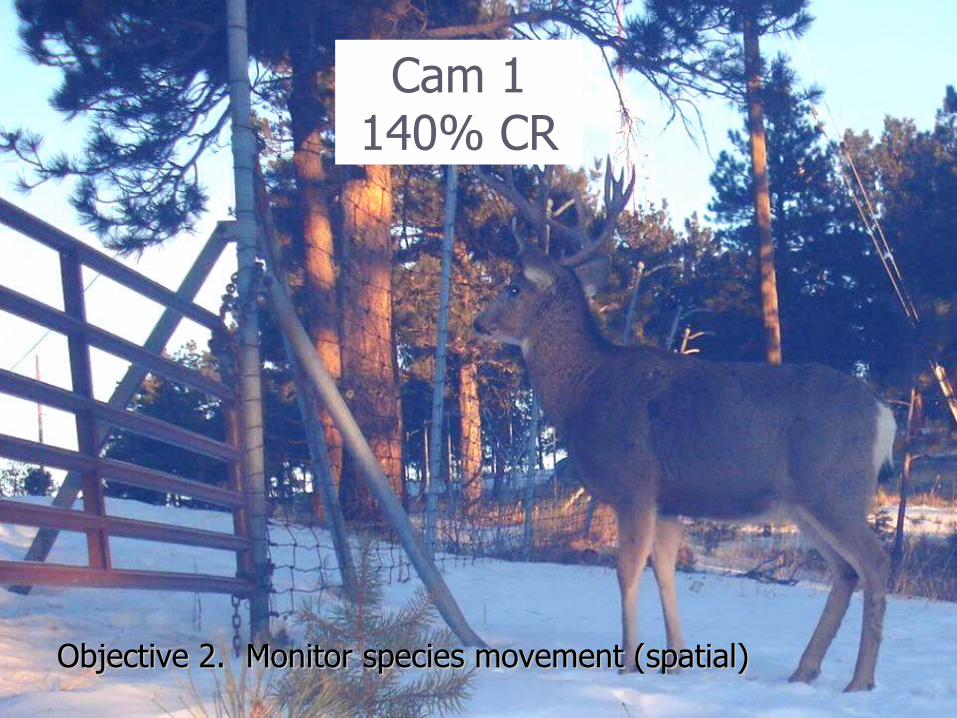
Cam 1140% CR
Objective 2. Monitor species movement (spatial)Objective 2. Monitor species movement (spatial)

Cam 220% CR
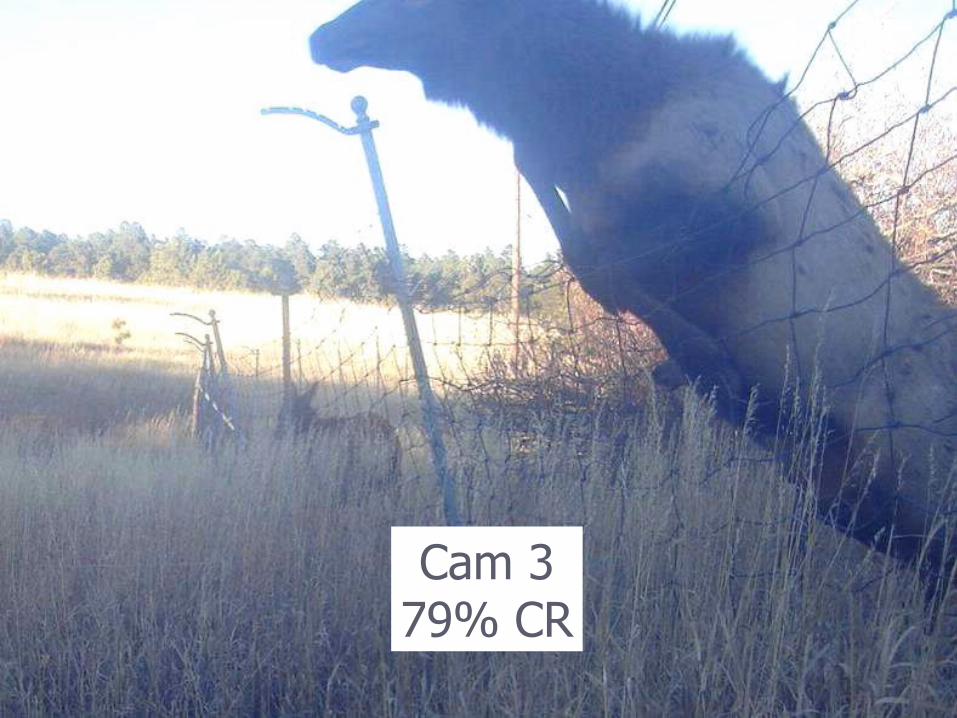
Cam 379% CR

Cam 448% CR
0102030405060708090
100
July
August
Sep
tem
ber
Oct
ober
Nove
mber
Dec
ember
Januar
y
Februar
y
Mar
ch
Apri
l
May
June
July
August
Sep
tem
ber
Oct
ober
Deer
Elk
05
101520253035
July
Aug
ust
Sep
tem
ber
Oct
ober
Nov
ember
Dec
ember
Janua
ry
Feb
ruar
y
Mar
ch
Apr
il
May
June
July
Aug
ust
Sep
tem
ber
Oct
ober
BearBobcatCoyoteFoxLion
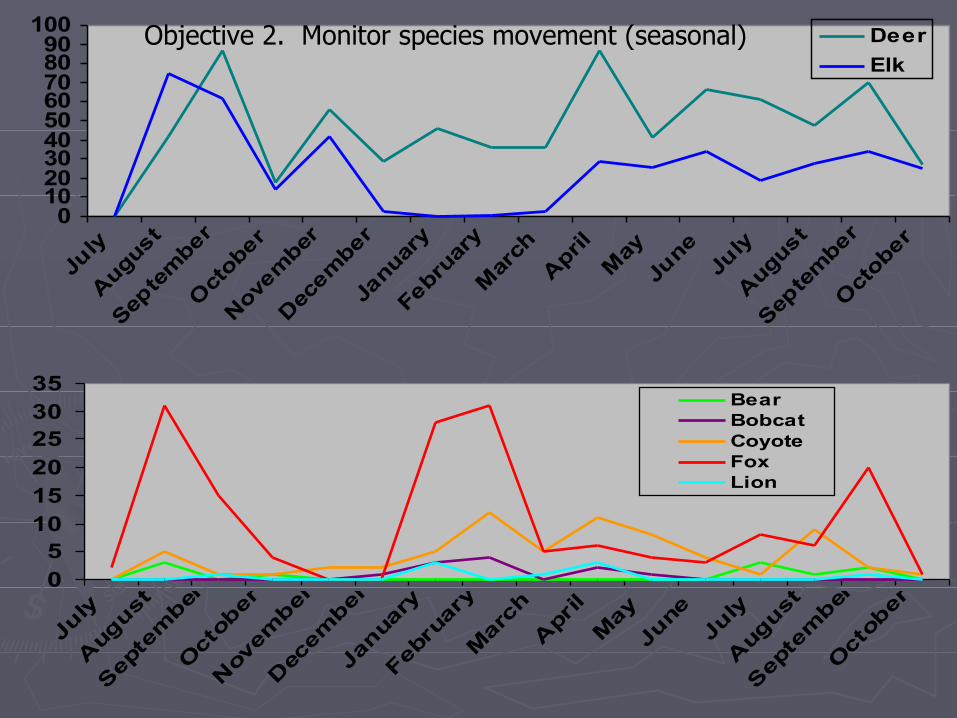
Objective 2. Monitor species movement (seasonal)Objective 2. Monitor species movement (seasonal)

0
10
20
30
40
50
60
70
80
90
100
0 1 2 3 4 5 6 7 8 9 10 11 12 13 14 15 16 17 18 19 20 21 22 23
DogPersonWildlife
Objective 2. Monitor species movement (temporal)Objective 2. Monitor species movement (temporal)

0
2 0
4 0
6 0
8 0
10 0
12 0
01
2
3
4
5
6
7
8
9
10
1112
13
14
15
16
17
18
19
20
21
22
23
LKT
Noon
Midnight

0
2 0
4 0
6 0
8 0
10 0
12 0
01
2
3
4
5
6
7
8
9
10
1112
13
14
15
16
17
18
19
20
21
22
23
LKT
OtherLocations
Compare LKT hours of
activity with other survey
locations.
Based on LKT species only.
Noon
Midnight
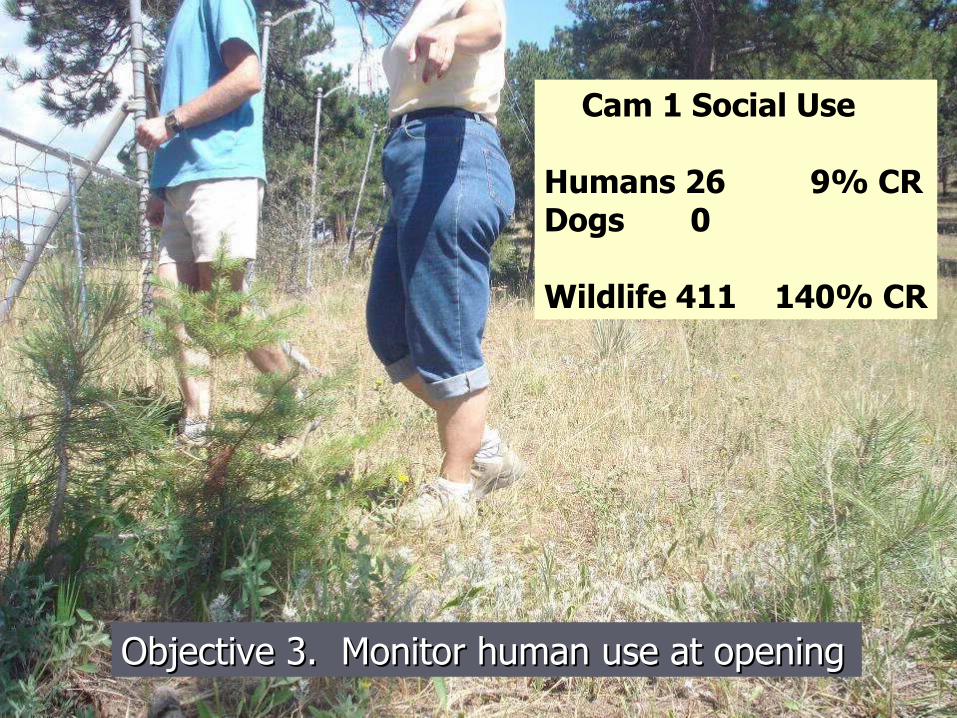
Cam 1 Social Use
Humans 26 9% CRDogs 0
Wildlife 411 140% CR
Objective 3. Monitor human use at openingObjective 3. Monitor human use at opening

Cam 4 Social Use
Humans 5 1% CRDogs 10 3% CR
Wildlife 192 48% CR

Monitoring wildlife and recreational Monitoring wildlife and recreational activity on newly acquired landactivity on newly acquired land


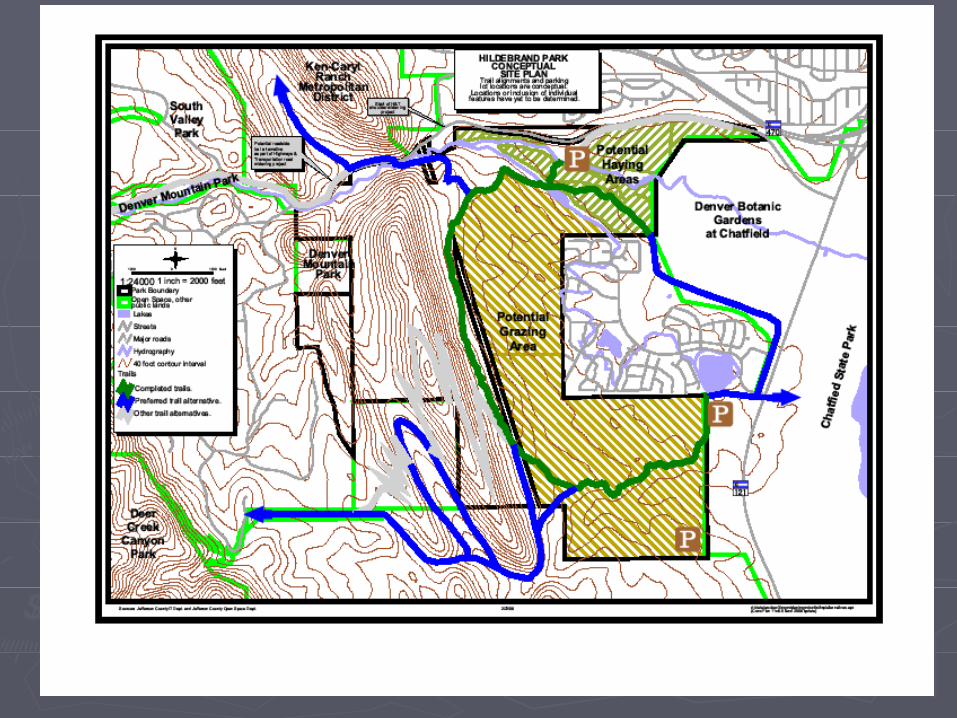
Hildebrand RanchWildlife Movement- Funnels


292%21.98%
27.59%
8.19%
1.29%
36.21%
1.29%
46.12%
76.72%
54.74%
2.16%
20.26%
2008 Capture Rate (232 TN)
51Skunk
155%692Total
64Red
19Raccoon
3Lion
84Gray
3Fox
30%107Elk
94%178Deer
13%127Coyote
5Bobcat
17%47Bear
2006 Capture Rate (64 TN)
2008 Activity
Species
0
5
10
15
20
25
30
Midnite1
2
3
4
5
6:00 AM
7
8
9
1011
Noon13
14
15
16
17
6:00 PM
19
20
21
2223 Deer
Elk
0
5
10
15
20Midnight
12
3
4
5
6:00 AM
7
8
9
1011
Noon13
14
15
16
17
6:00 PM
19
20
21
2223 East
West
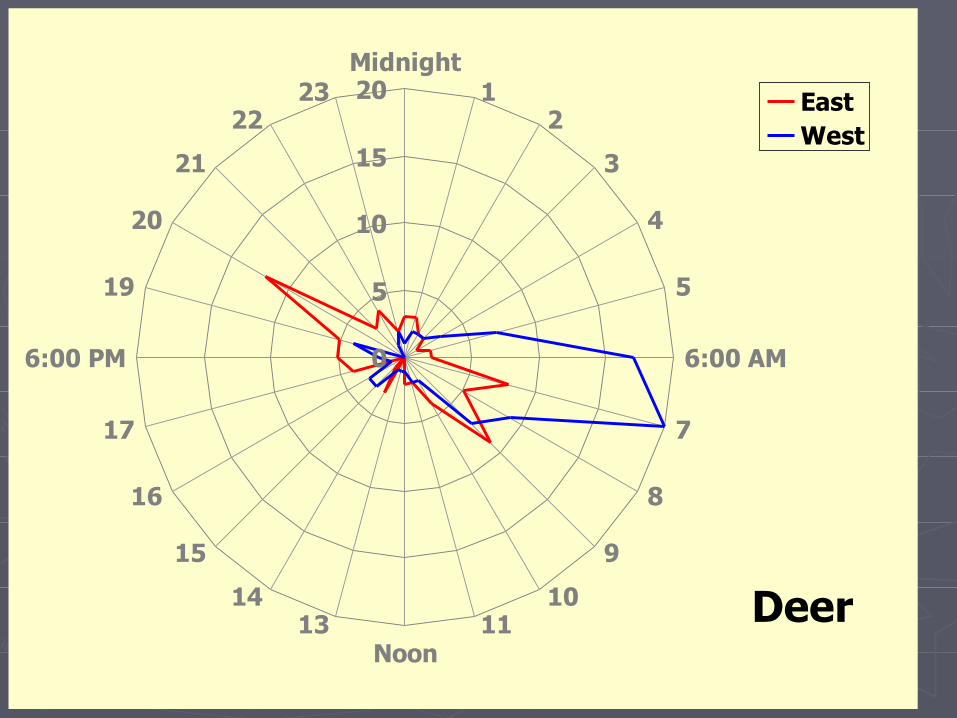
Deer
0
5
10
15
20
25Midnight
12
3
4
5
6:00 AM
7
8
9
1011
Noon13
14
15
16
17
6:00 PM
19
20
21
2223 East
West
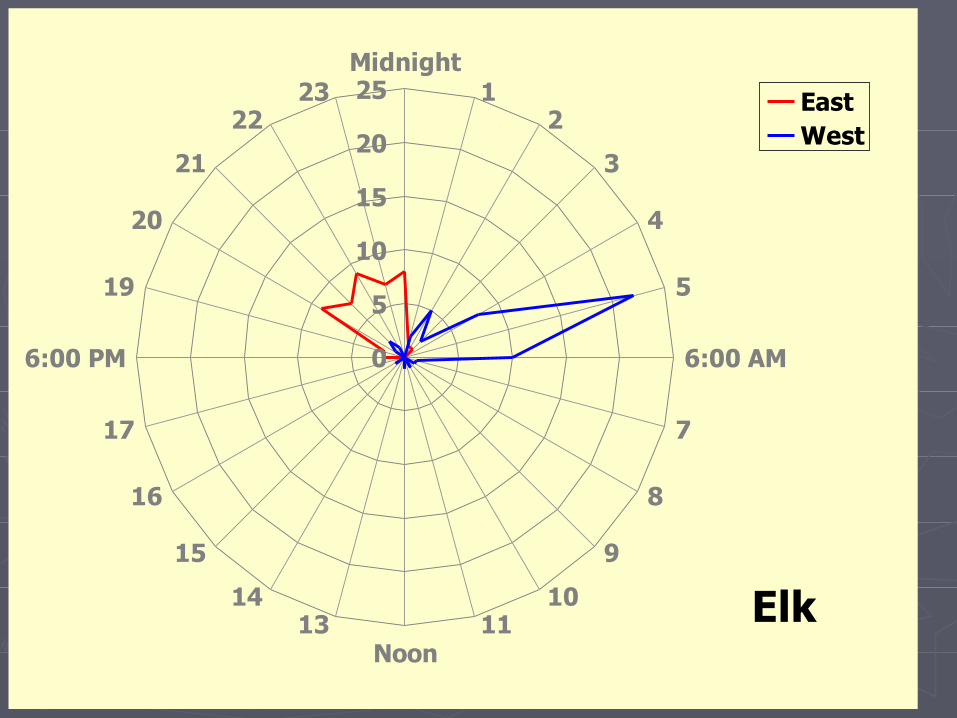
Elk
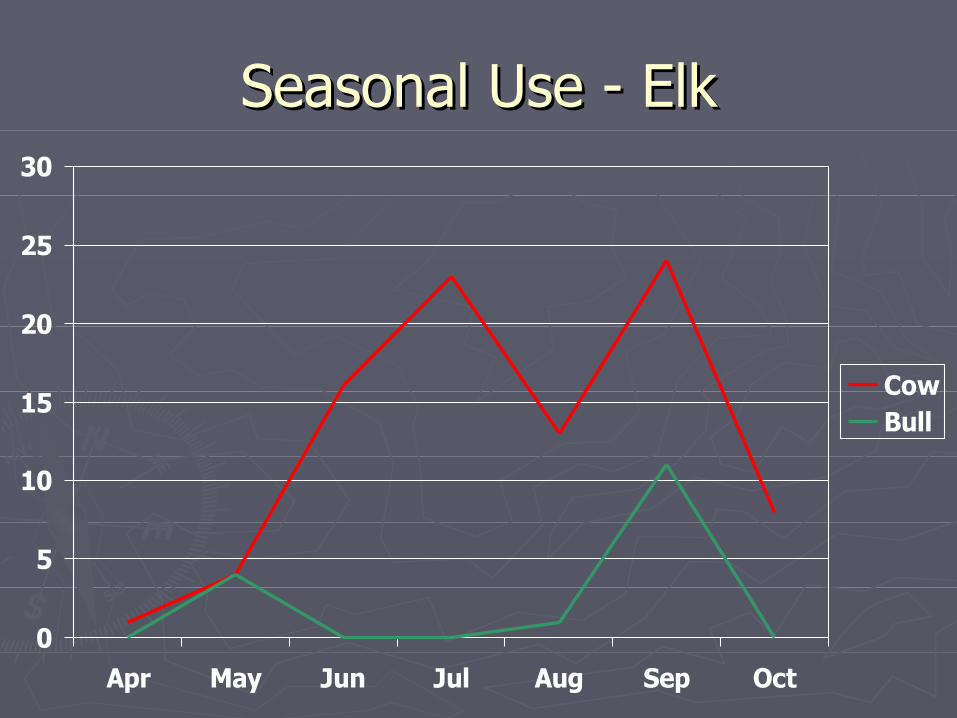
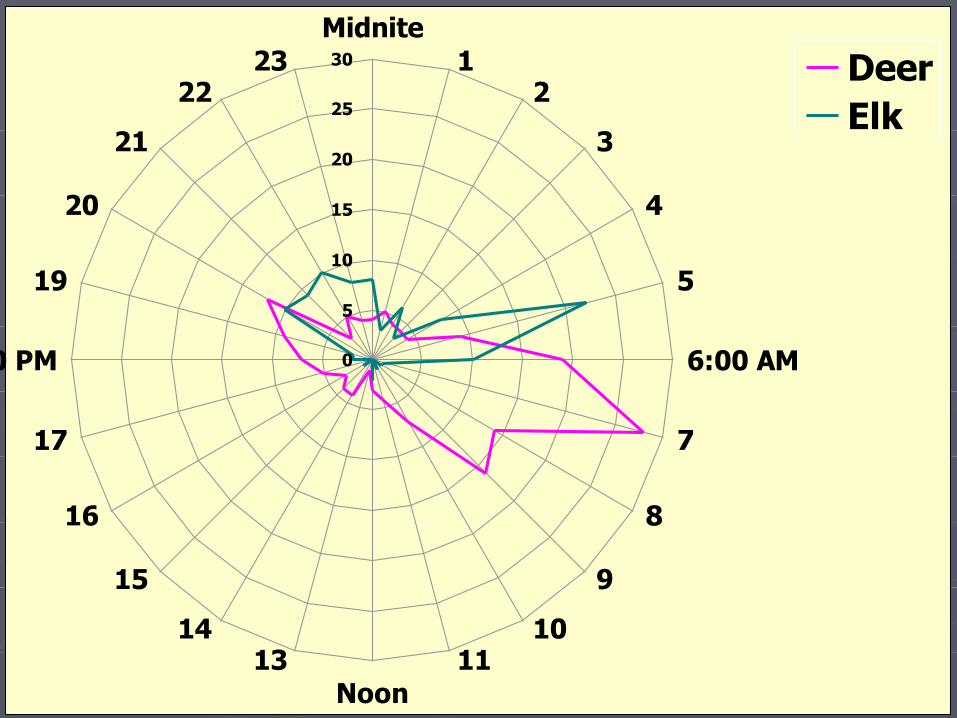
Seasonal Use - ElkSeasonal Use - Elk
0
5
10
15
20
25
30
Apr May Jun Jul Aug Sep Oct
CowBull
0
1
2
3
4
5
6
7Midnight
12
3
4
5
6:00 AM
7
8
9
1011
Noon13
14
15
16
17
6:00 PM
19
20
21
2223 East
West
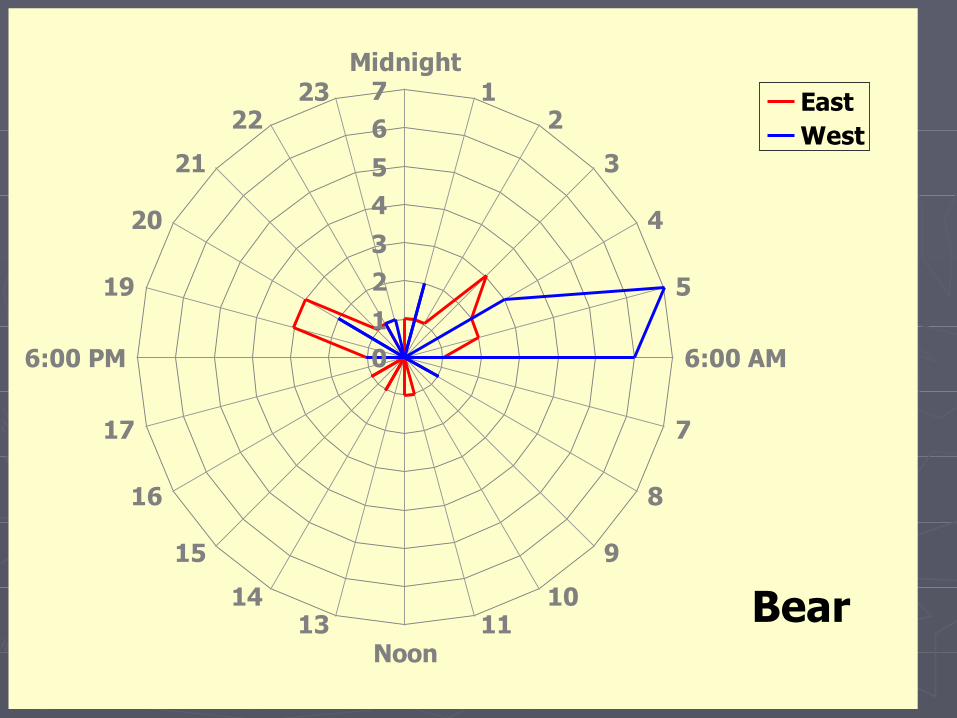
Bear
0
10
20
30
40
50Midnight
12
3
4
5
6:00 AM
7
8
9
1011
Noon13
14
15
16
17
6:00 PM
19
20
21
2223 East
West
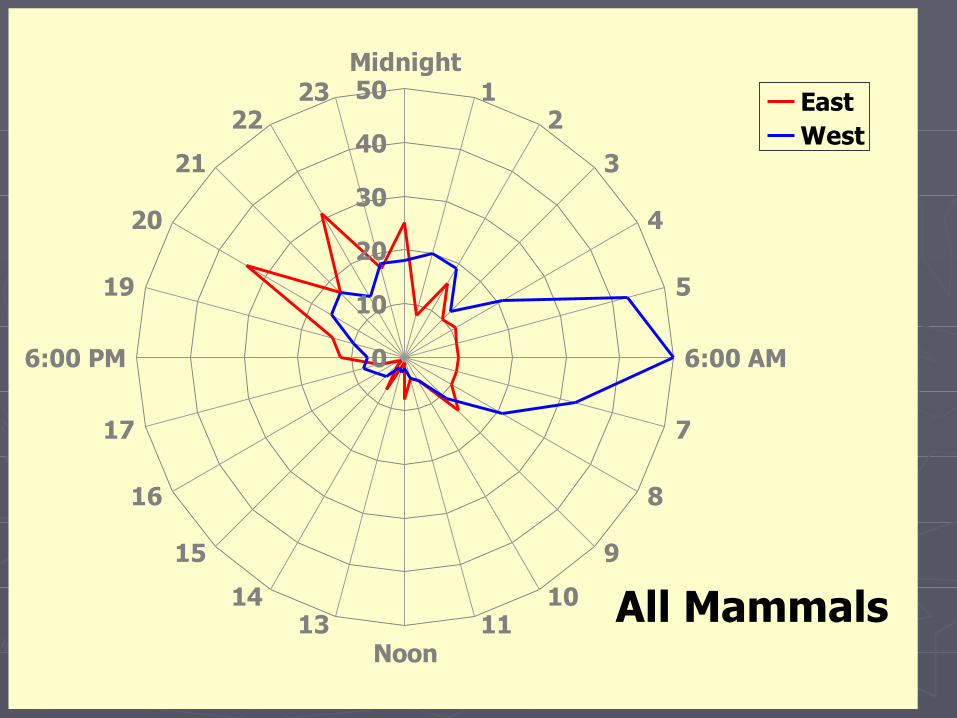
All Mammals

Movement During Park HoursMovement During Park Hours
0
50
100
150
200
250
300
350
400
Dawn Day Dusk Night Park Hours
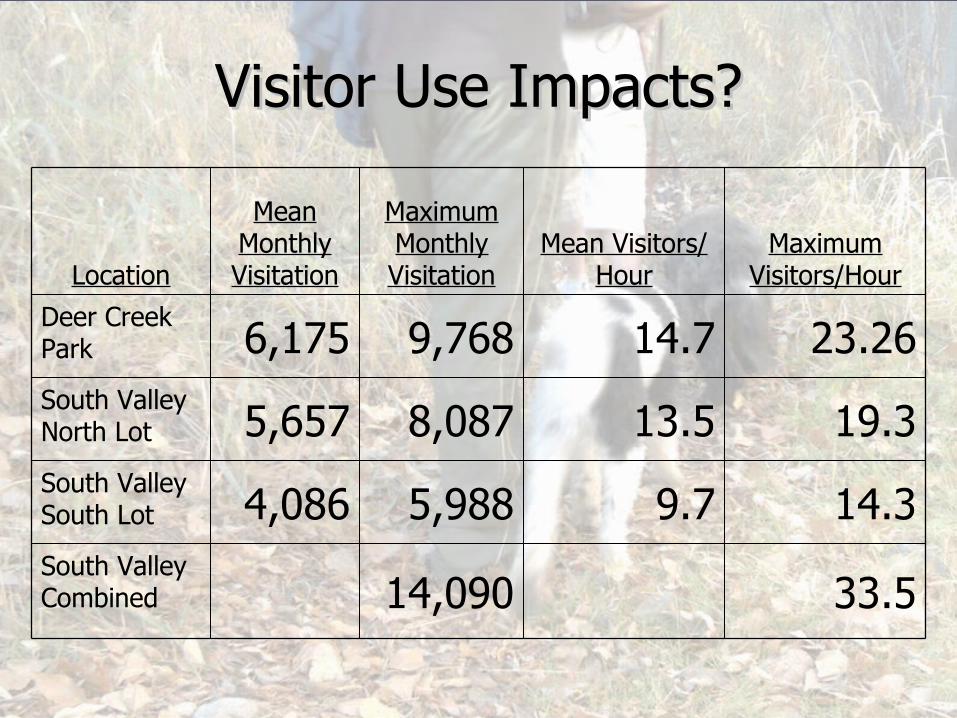
Visitor Use Impacts?Visitor Use Impacts?
33.514,090South Valley Combined
14.39.75,9884,086South Valley South Lot
19.313.58,0875,657South Valley North Lot
23.2614.79,7686,175Deer Creek Park
Maximum Visitors/Hour
Mean Visitors/Hour
Maximum Monthly Visitation
Mean Monthly VisitationLocation

0
10
20
30
40
50
60
70
800
1
2
3
4
5
6
7
8
9
10
11
12
13
14
15
16
17
18
19
20
21
22
23
LKT Deer/ElkHRP Deer/ElkOther Deer/Elk
Deer and Elk Hours of
Movement
Backcountry vs.
Human Use Areas
Noon
Midnight


Trail Planners
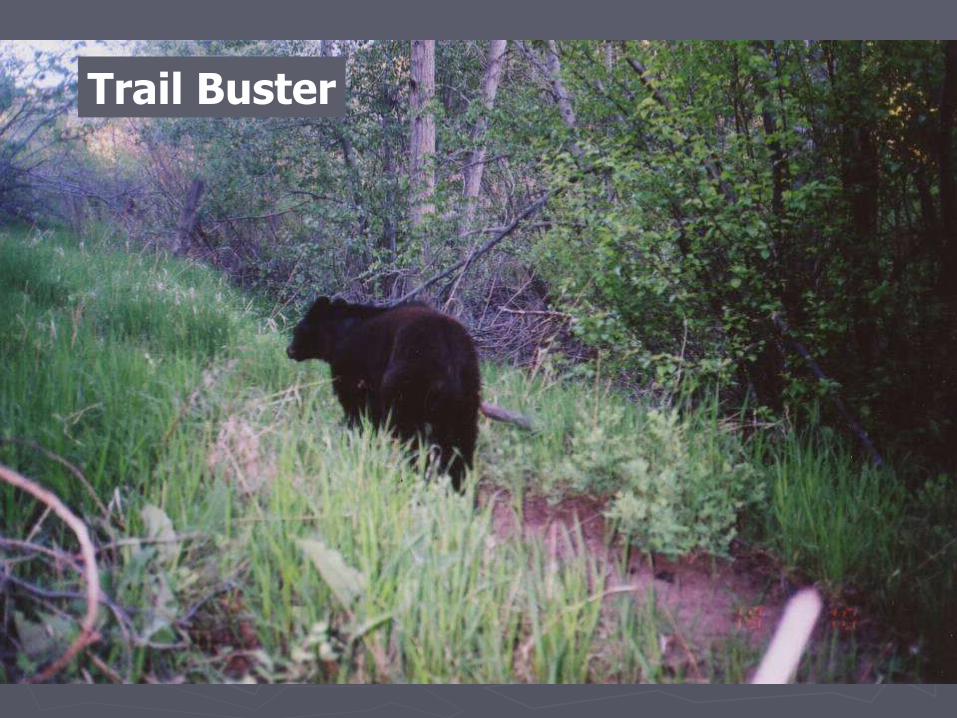
Trail Buster

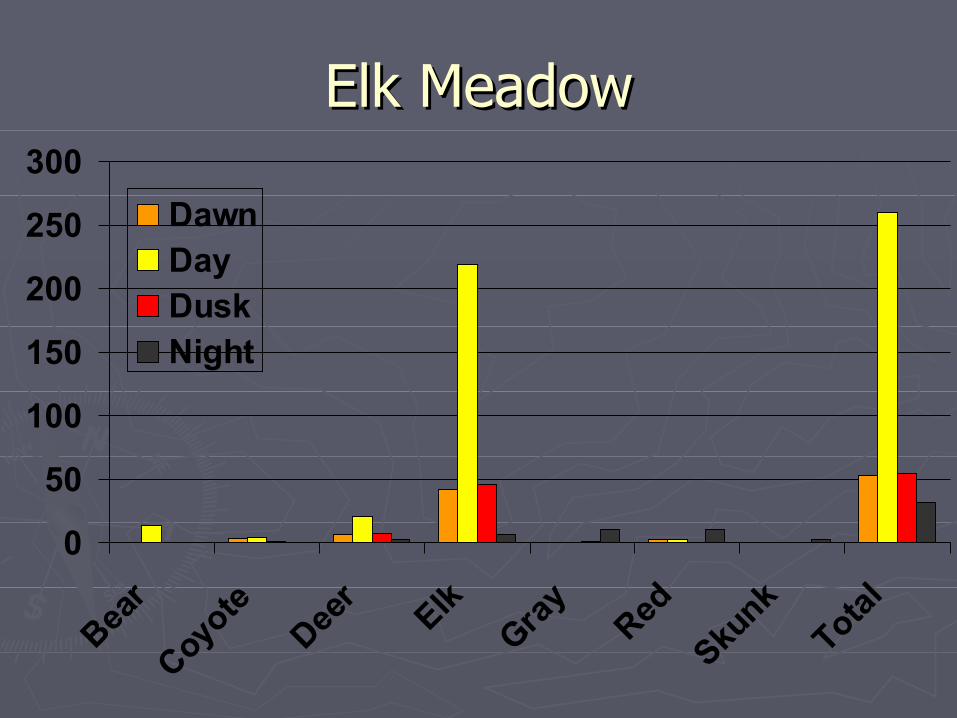
Elk Meadow ParkElk Meadow Park


0
5
10
15
20
25
30
35Midnite
12
3
4
5
6
7
8
9
1011
Noon13
14
15
16
17
18
19
20
21
2223
Deer
Elk
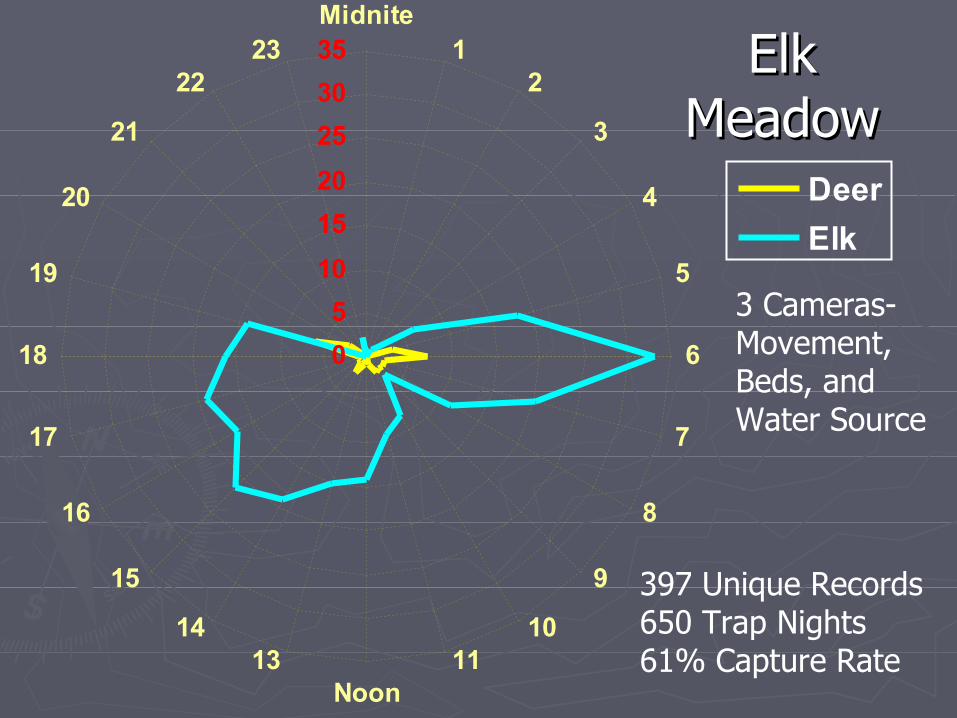
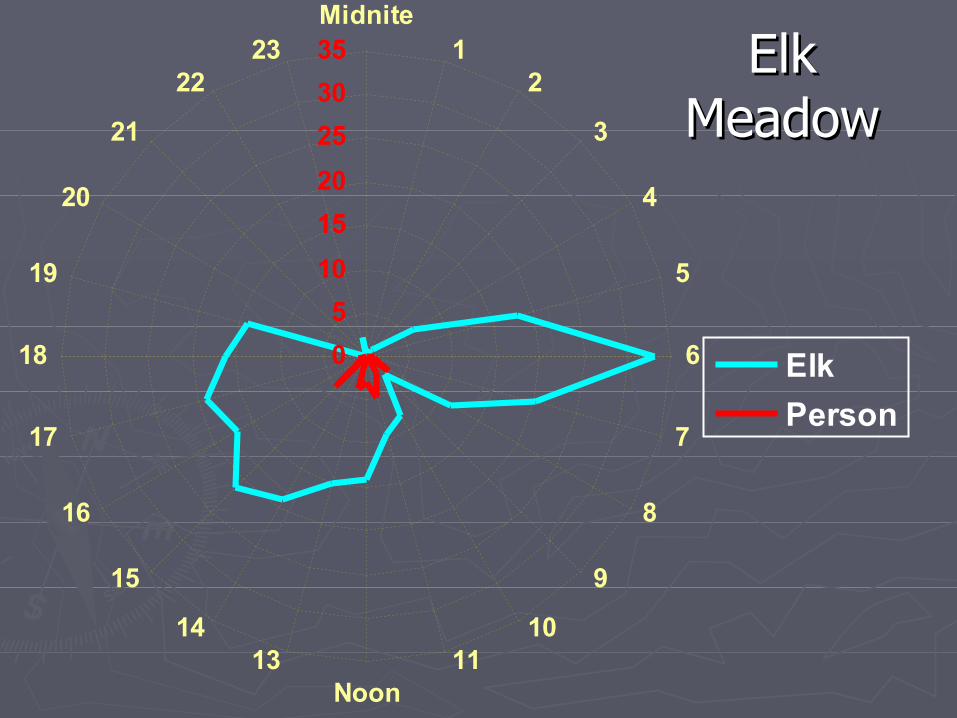
Elk Elk MeadowMeadow
3 Cameras-Movement,Beds, and Water Source
397 Unique Records650 Trap Nights61% Capture Rate
0
5
10
15
20
25
30
35Midnite
12
3
4
5
6
7
8
9
1011
Noon13
14
15
16
17
18
19
20
21
2223
Elk
Person
Elk Elk MeadowMeadow

0
50
100
150
200
250
300
350
Bear Coyote Deer Elk Gray Person Red Skunk
Elk MeadowElk Meadow

0
20
40
60
80
100
Mar Apr May Jun Jul Aug Sep
Deer
Elk
Elk MeadowElk Meadow
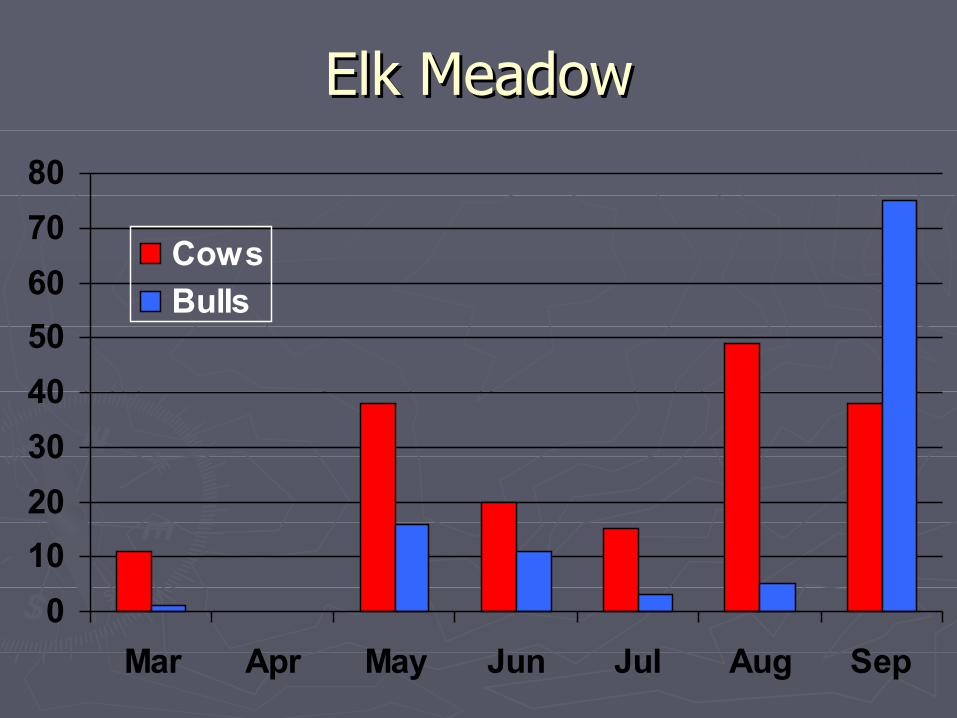
Elk MeadowElk Meadow
0
10
20
30
40
50
60
70
80
Mar Apr May Jun Jul Aug Sep
Cows
Bulls

Elk MeadowElk Meadow
0
50
100
150
200
250
300
Bear
Coyote
Deer
ElkGra
yRed
Skunk
Total
DawnDayDuskNight
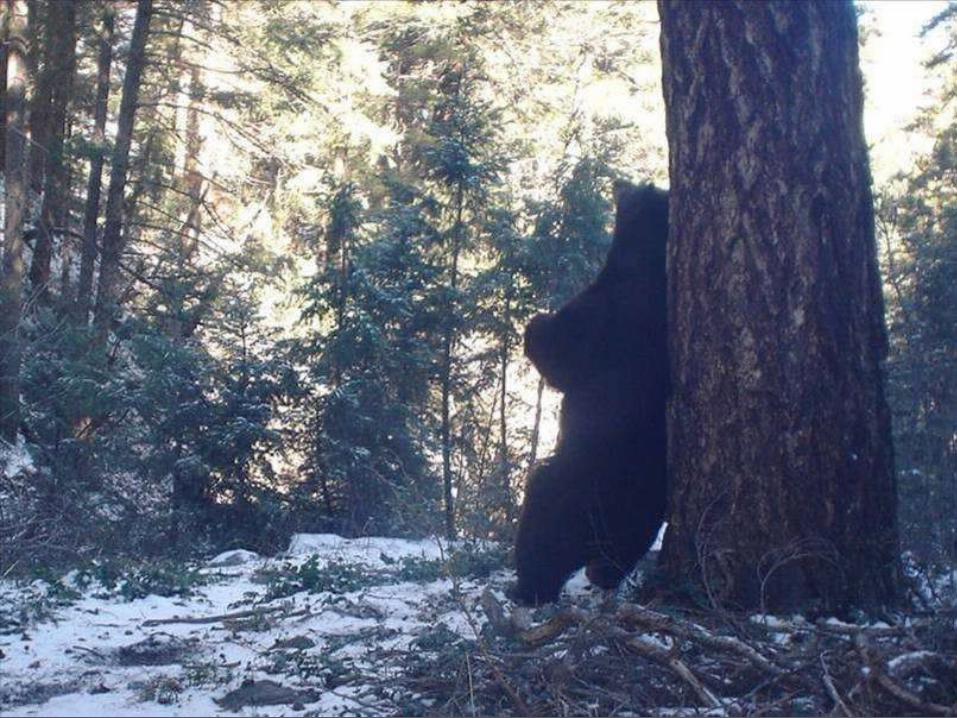
Concluding Comments►Humans enjoy wildlife
Birdwatchers Respect and Appreciation
►Humans impact wildlife Riparian and wetlands, corridors,
funnels Development, fencing, roads, trails Recreation- heavy numbers of people
►Wildlife react to humans Avoidance, attraction, habituation Conflicts Escape cover Large animals need big spaces

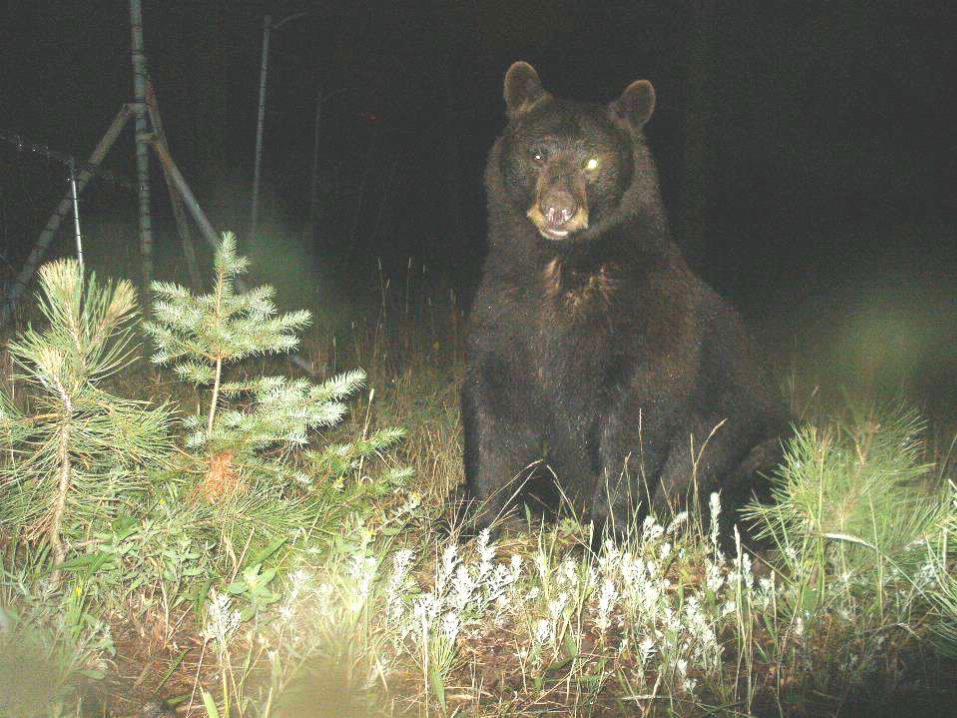
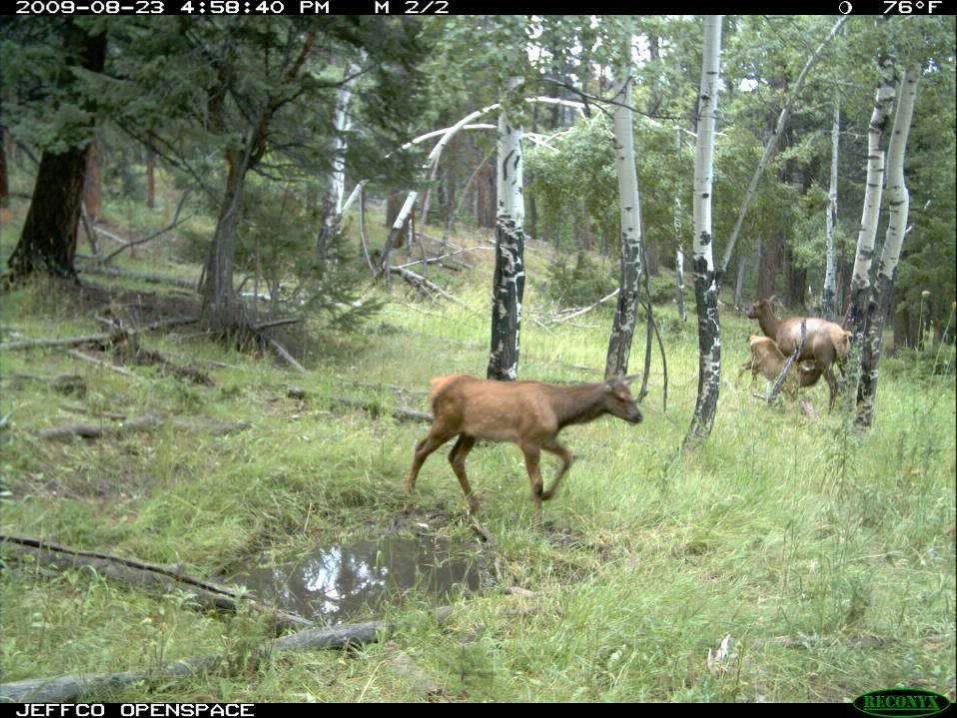
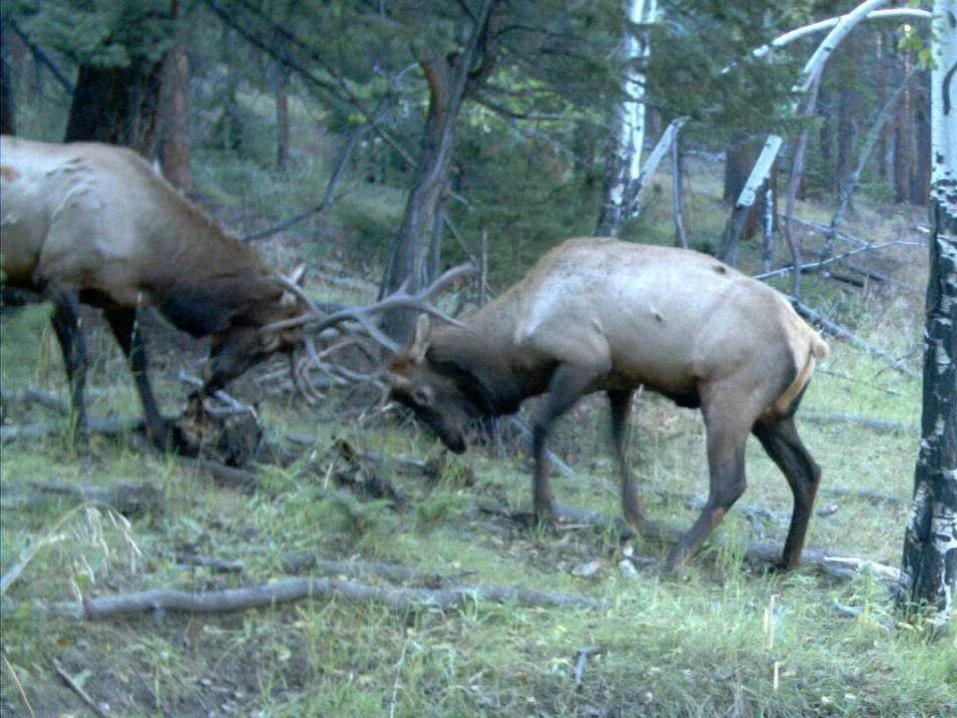
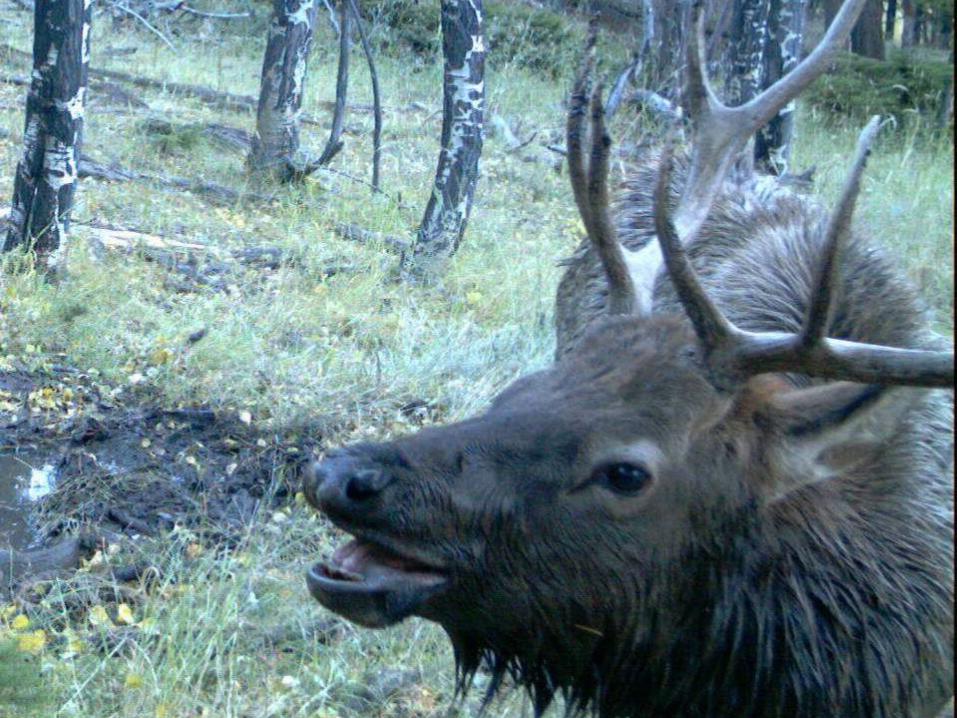
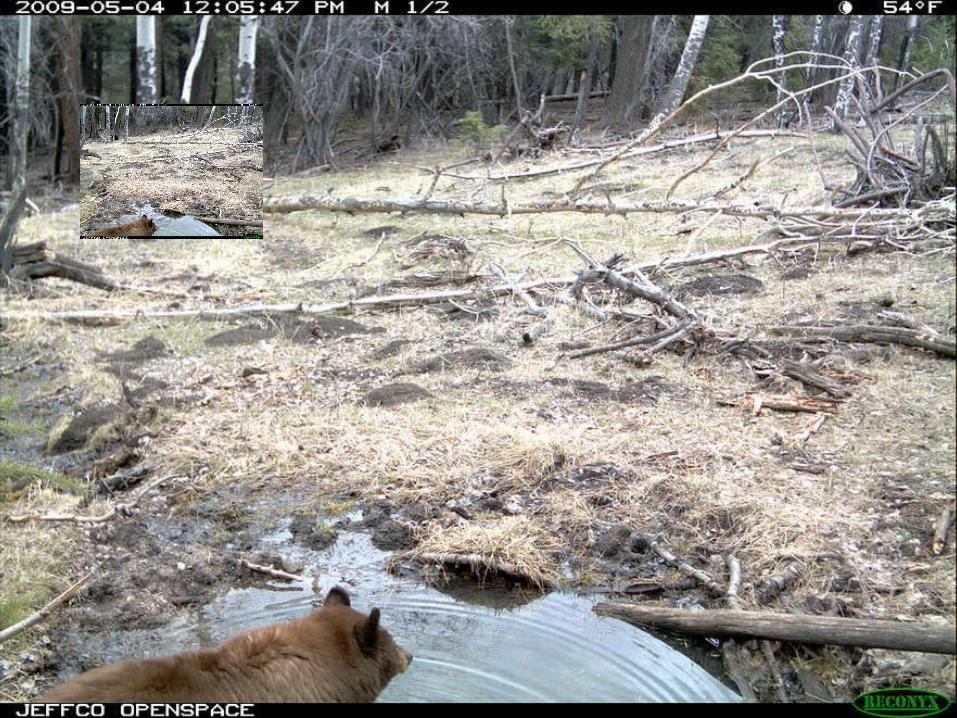
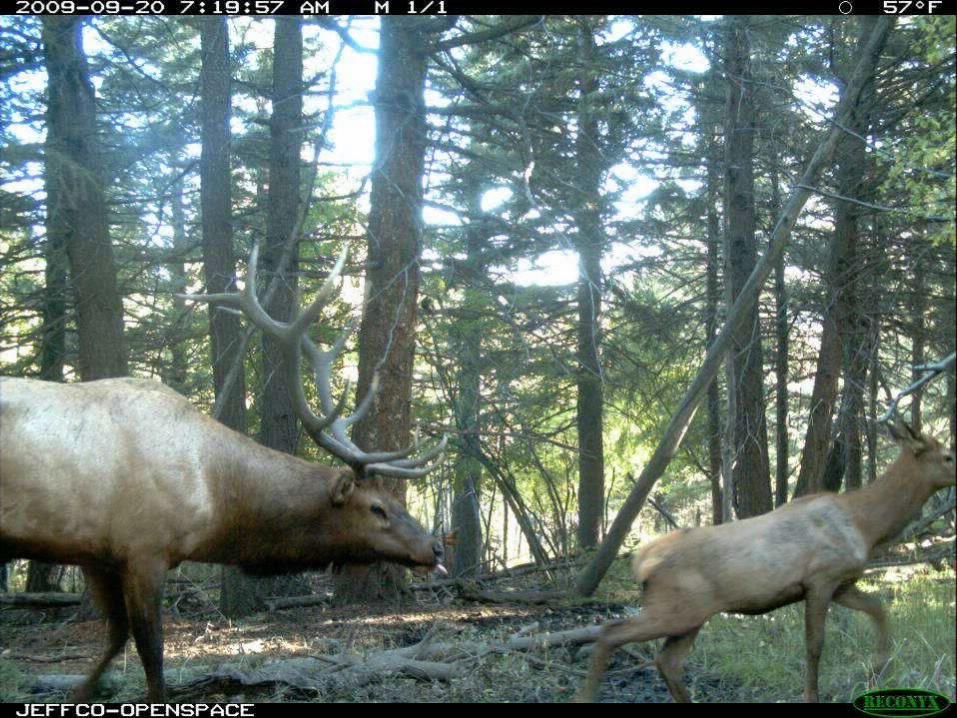
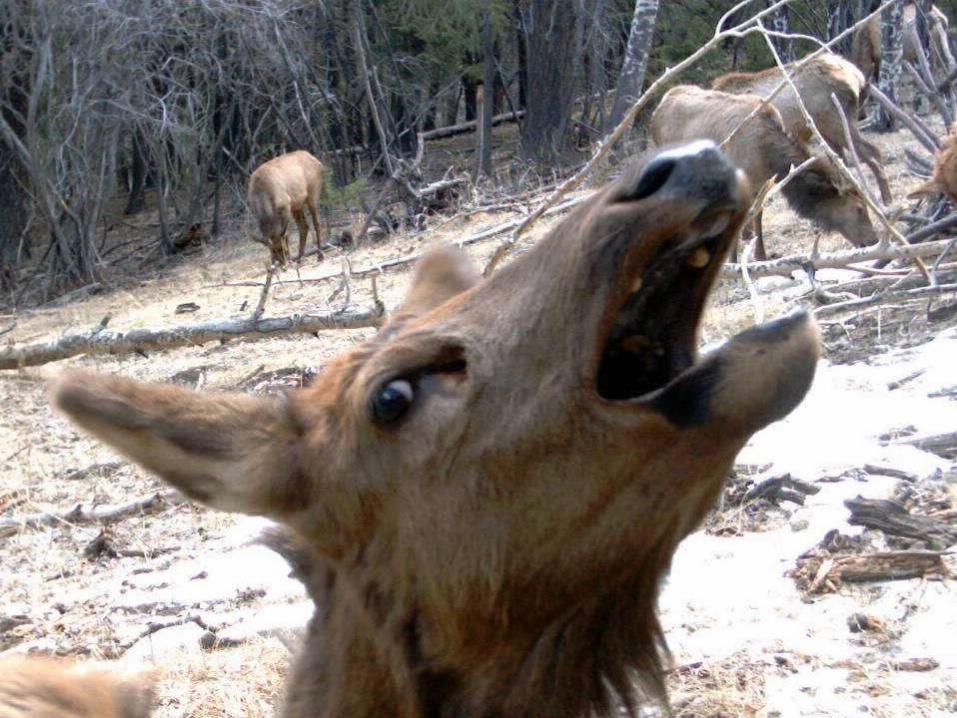
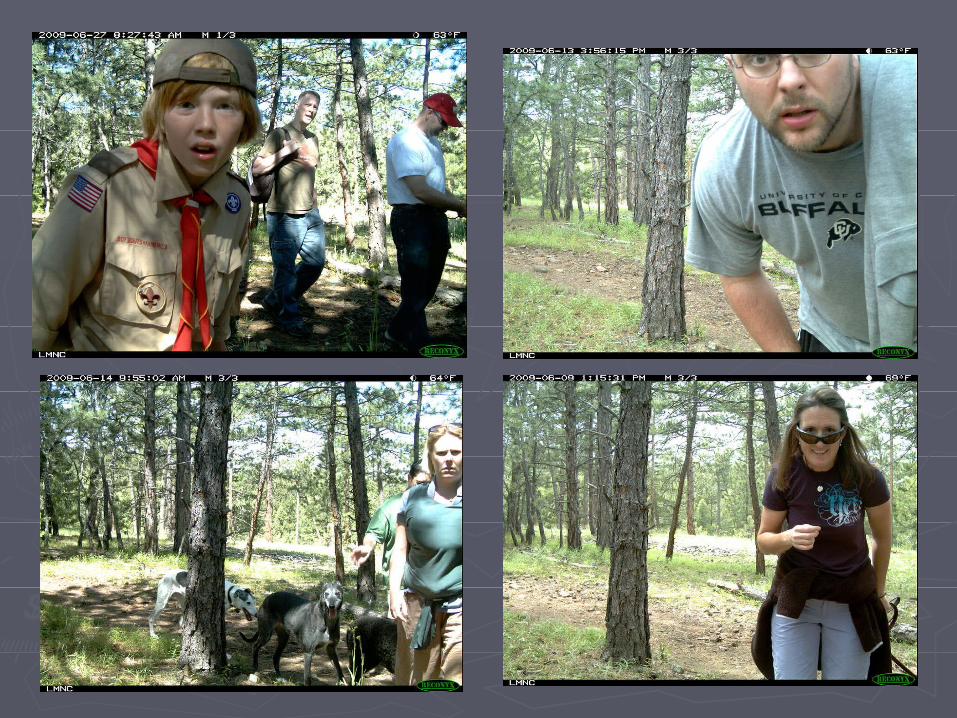
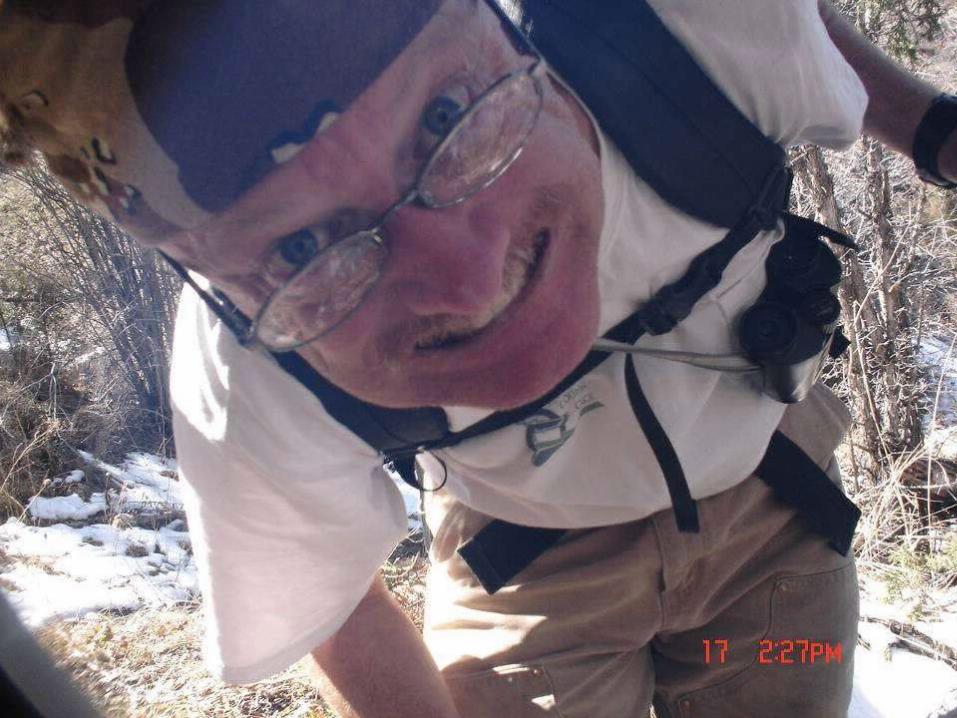
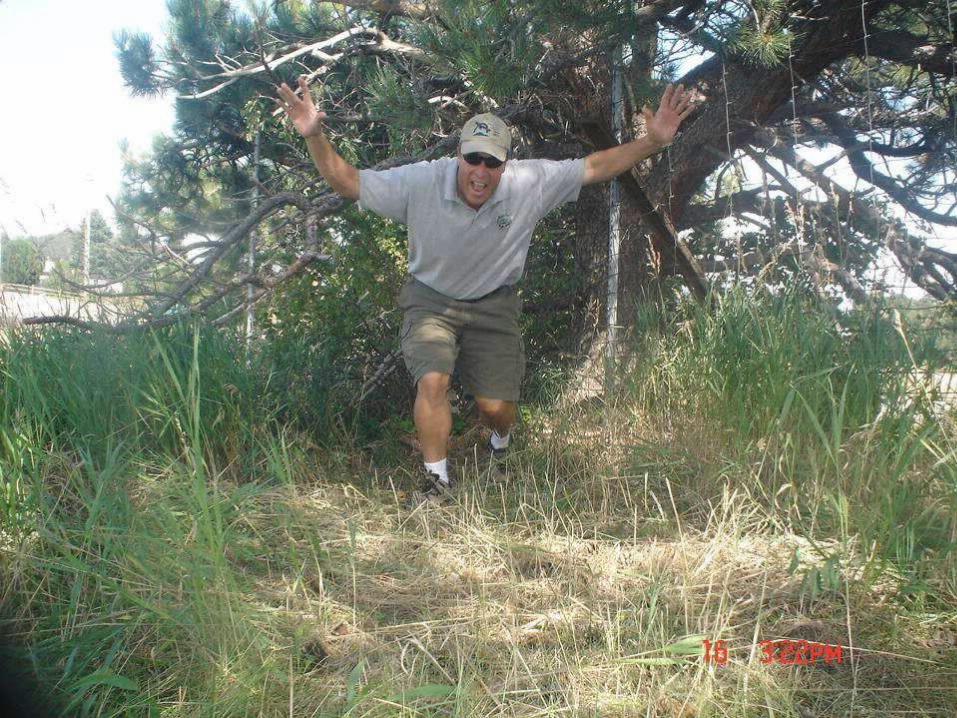
Just some other neat photos


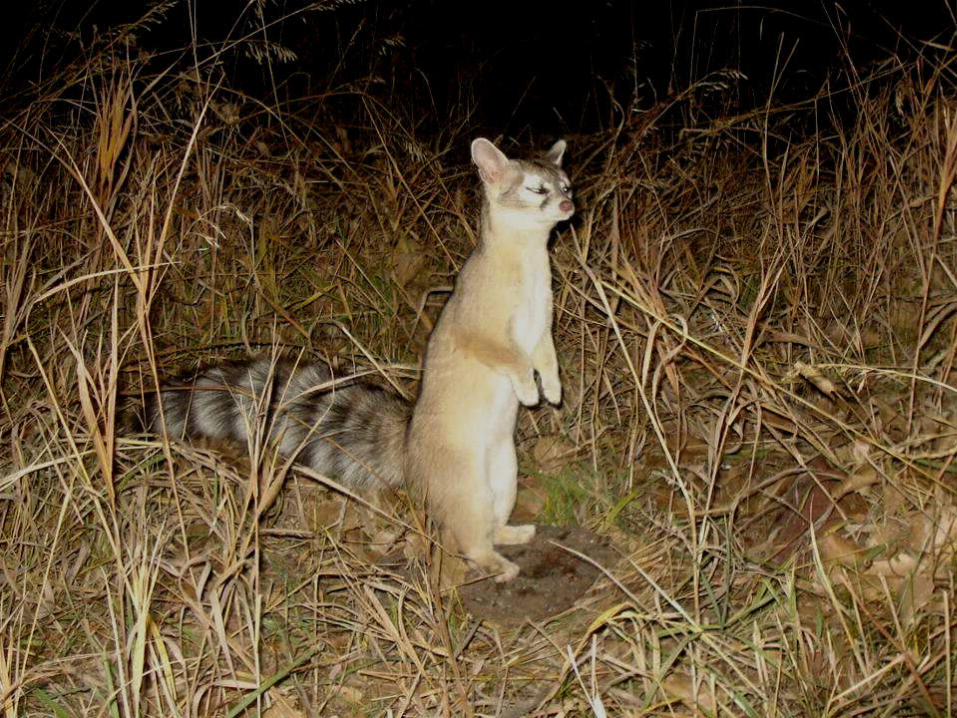


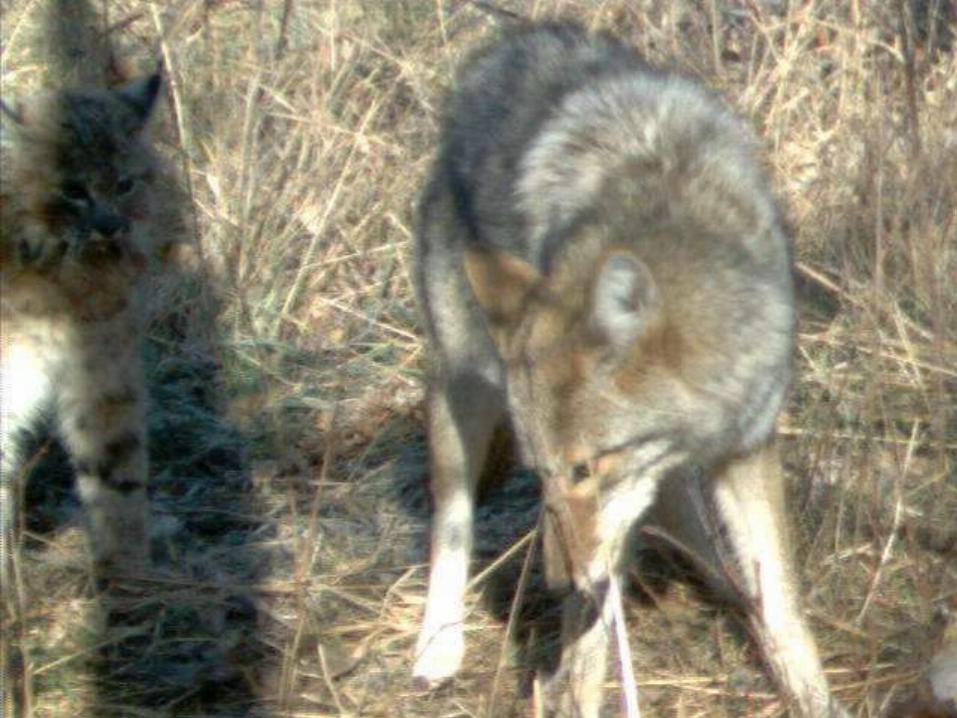
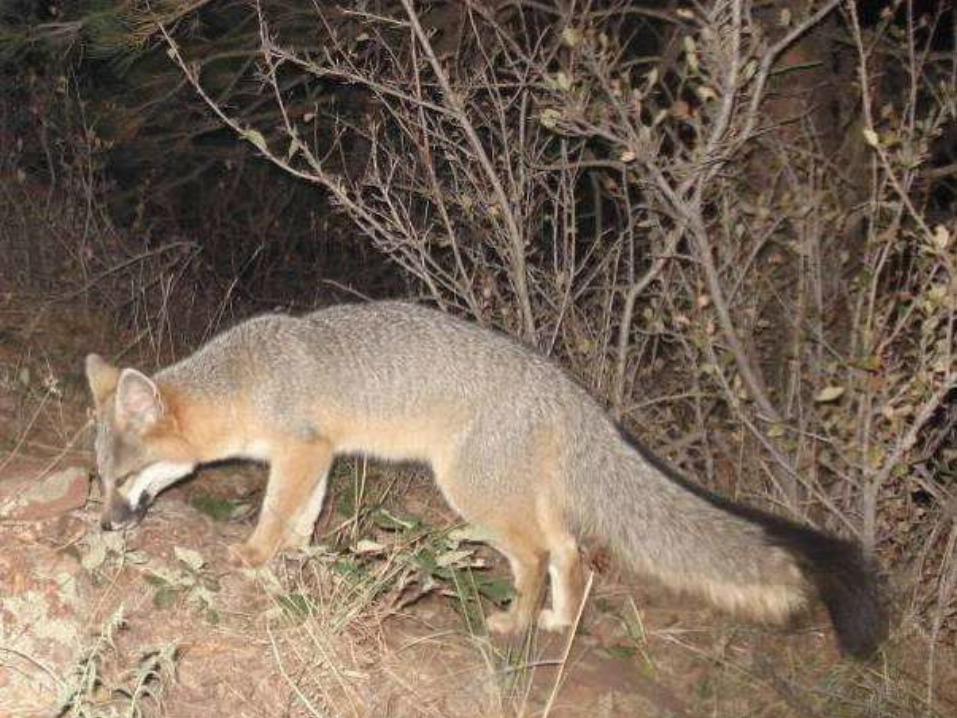
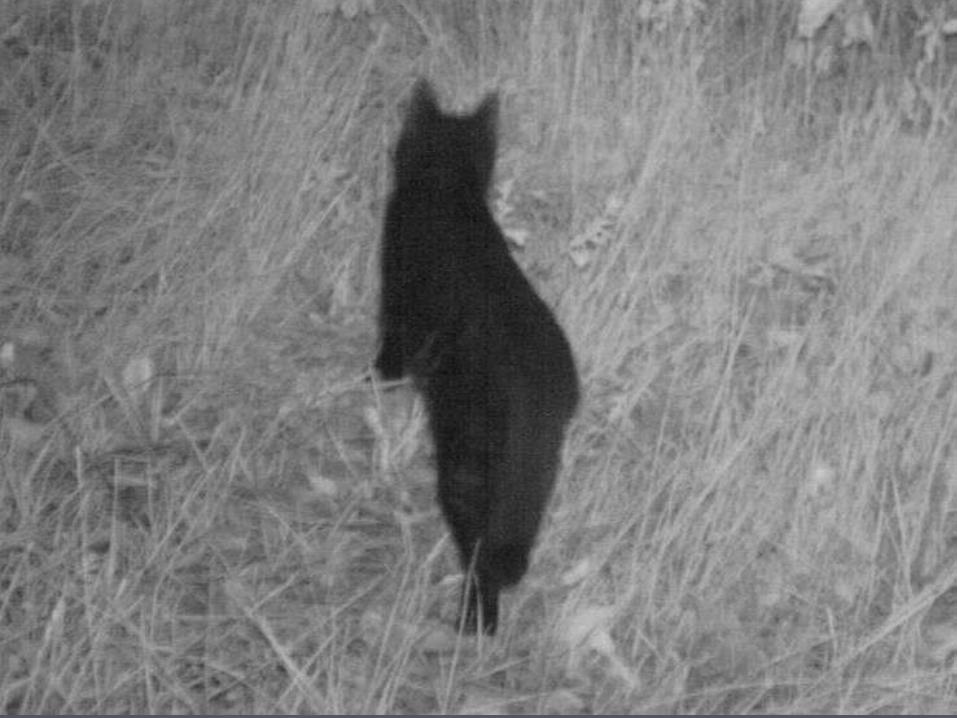


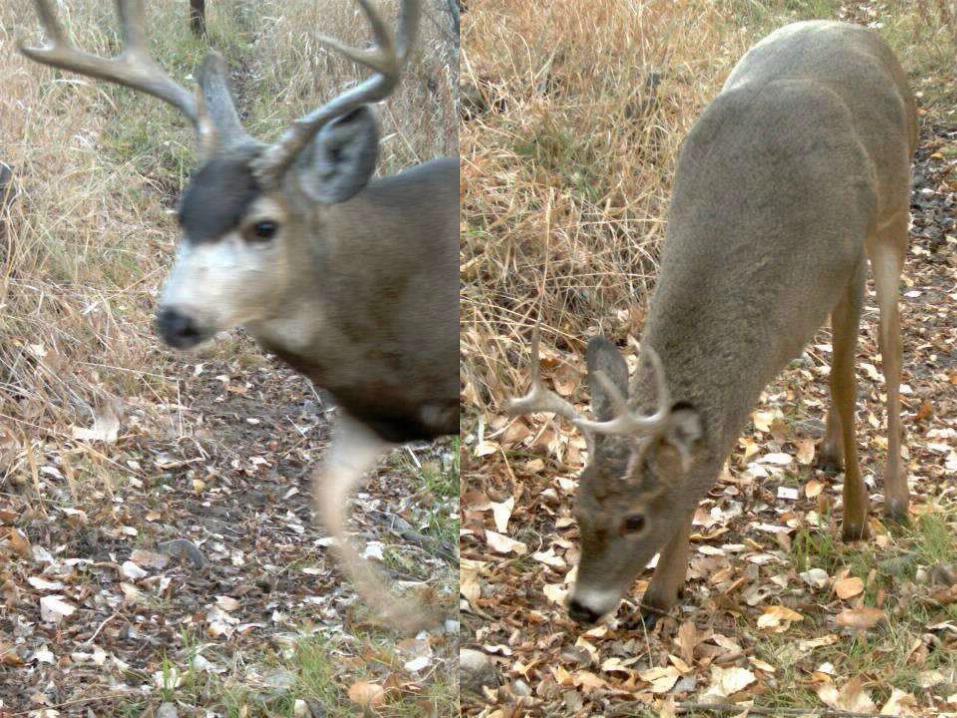

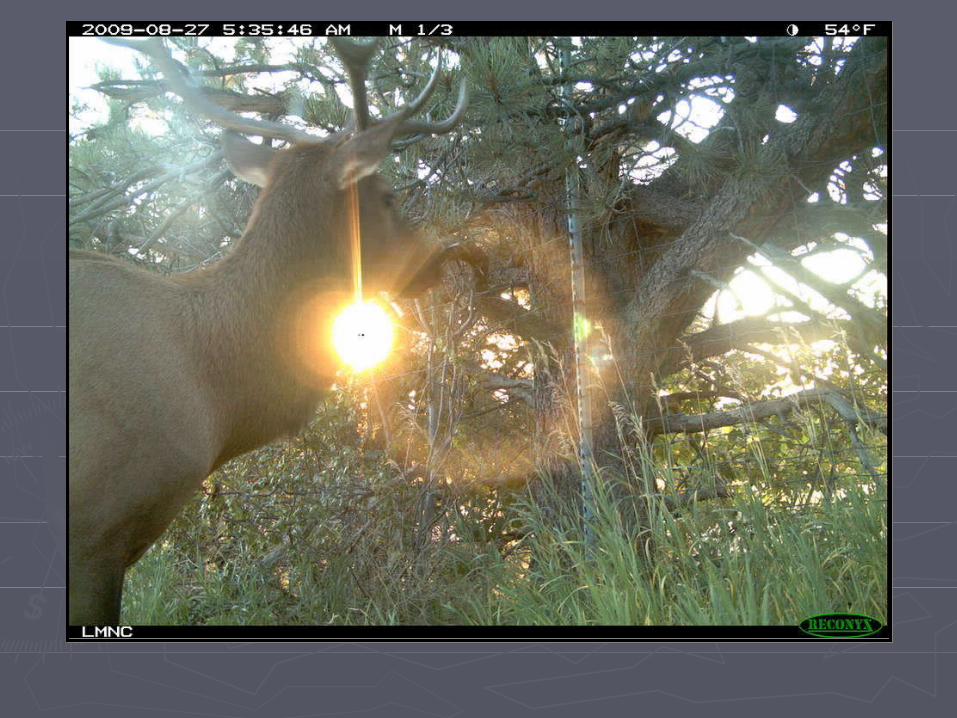
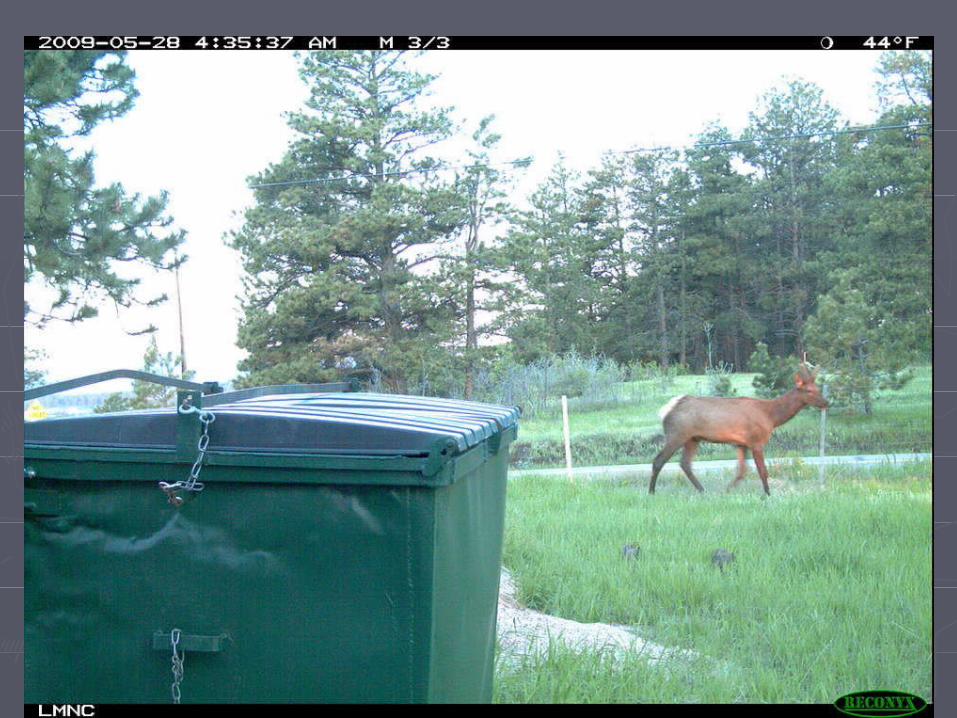
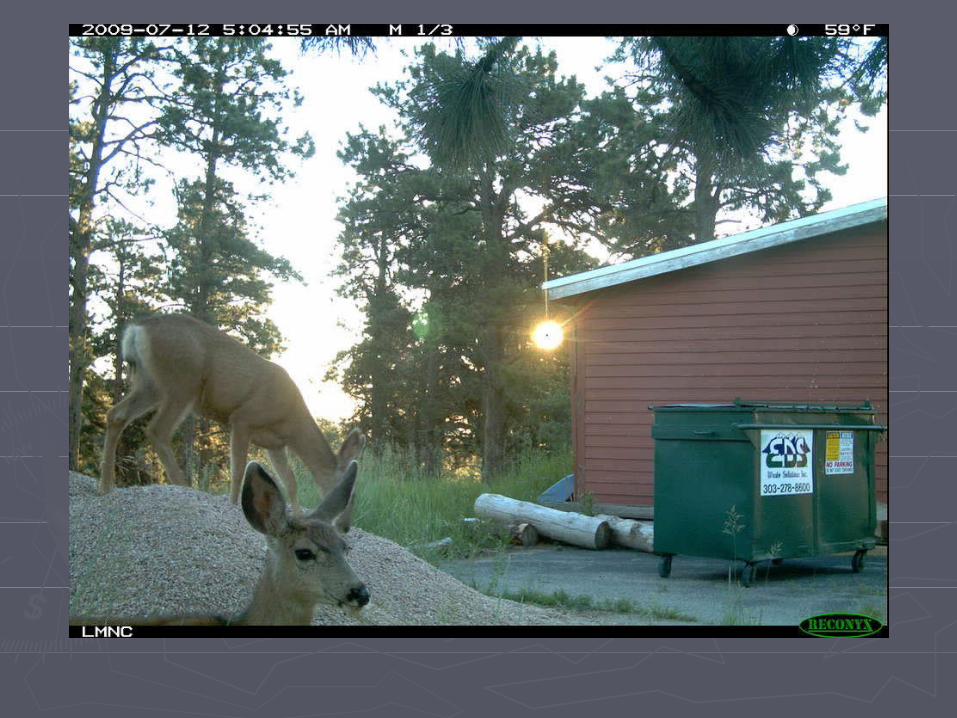

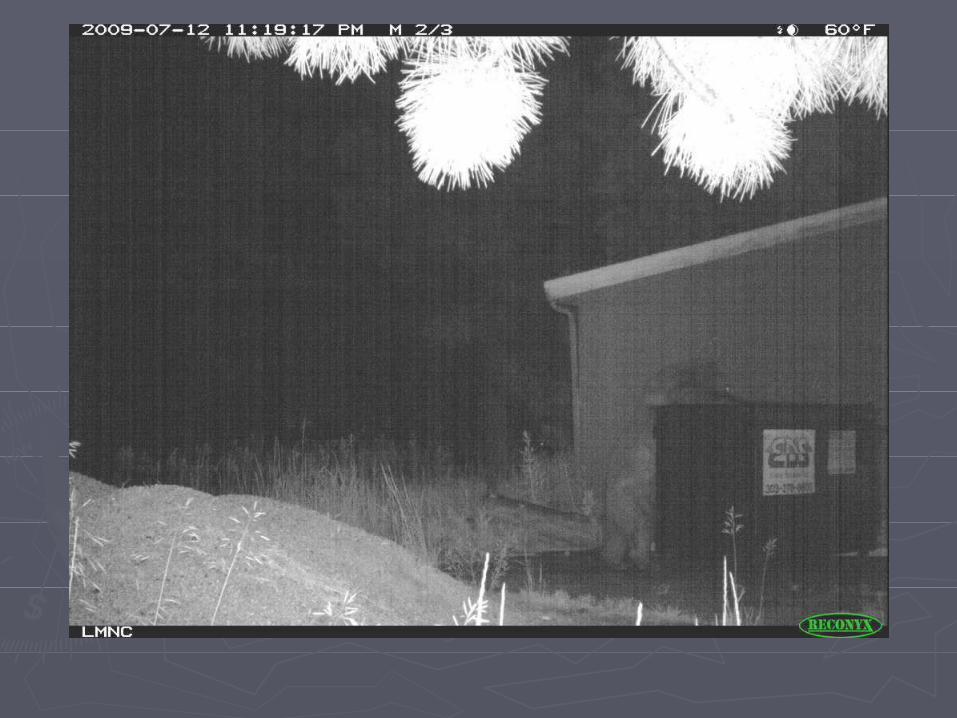


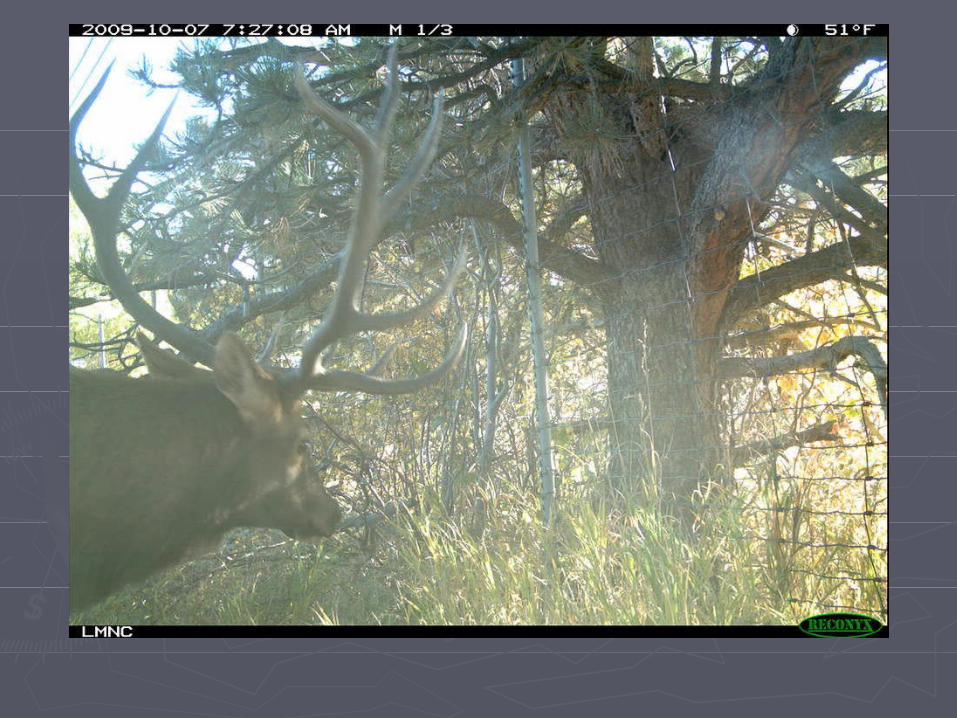

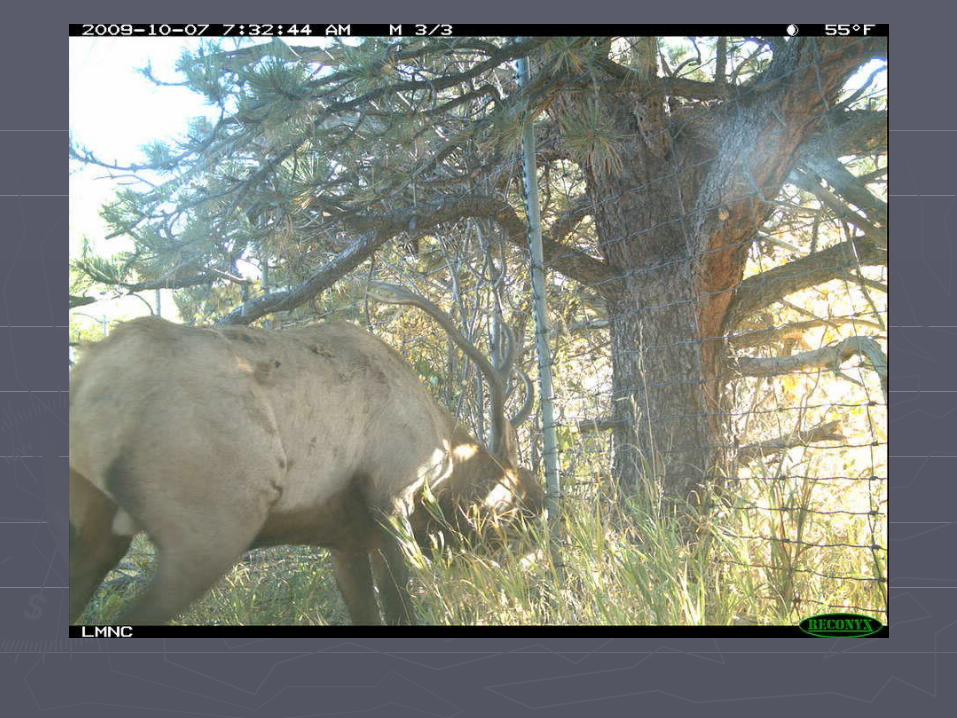

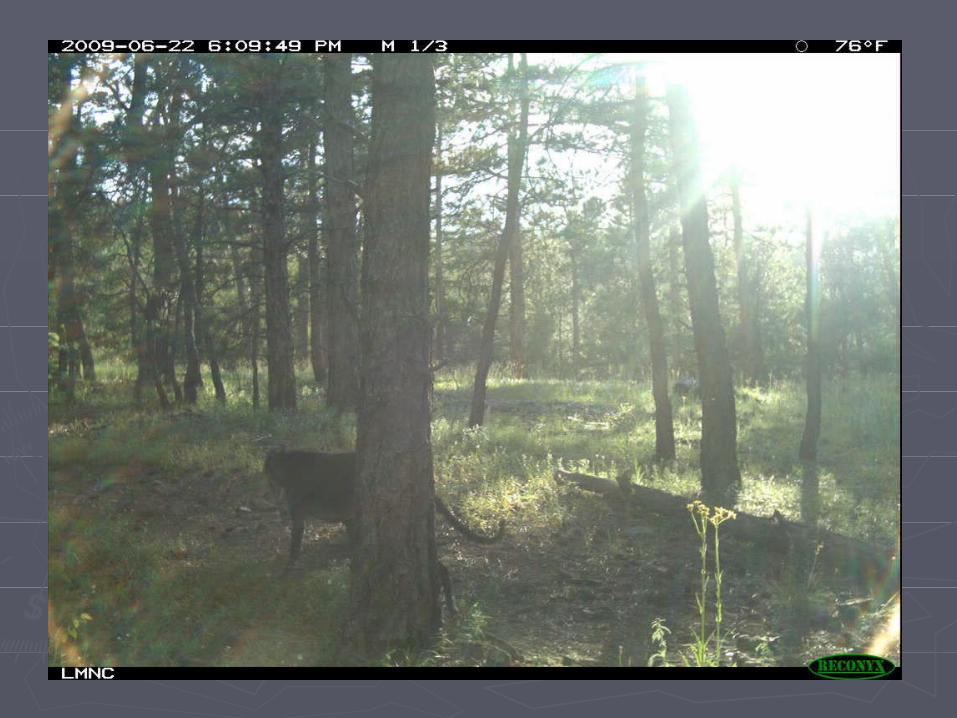

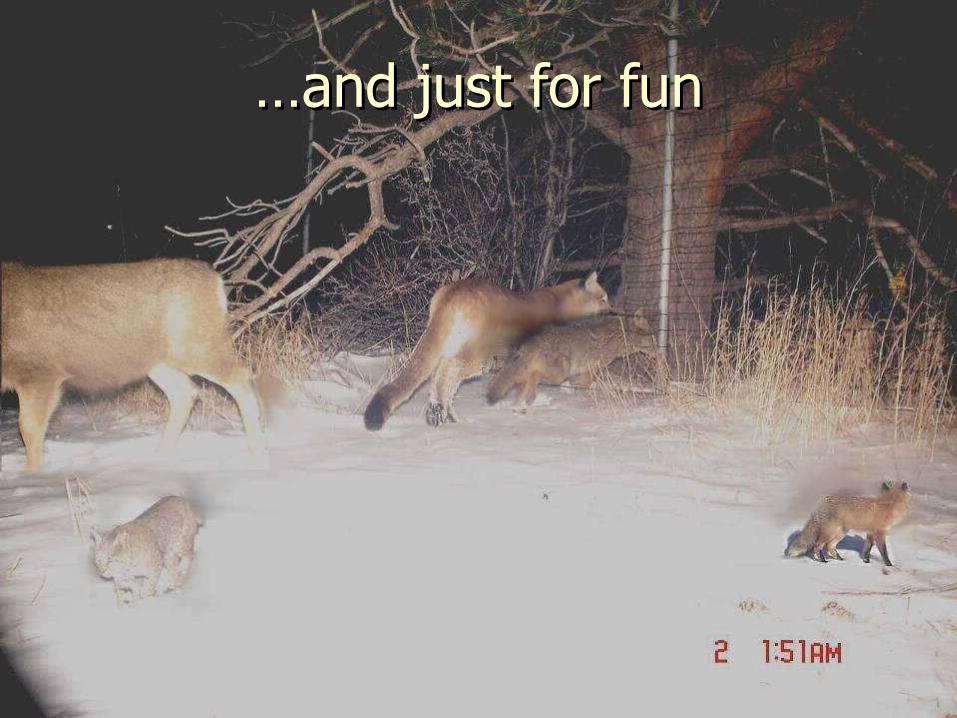
……and just for funand just for fun


0123456789
10111213
01
2
3
4
5
6
7
8
9
1011
1213
14
15
16
17
18
19
20
21
2223
BearCoyote

0
1
2
3
4
5
6
7
8
9
10
11
01
2
3
4
5
6
7
8
9
1011
1213
14
15
16
17
18
19
20
21
2223
GrayRed


![Wildlife camera - Rusta · Wildlife camera Read the user manual carefully to make sure that the product is assembled, used and ... [Mode] key to shift to “Playback” mode, users](https://img.pdfslide.us/doc/110x75/5fc5f4cc28958269db74ab67/wildlife-camera-rusta-wildlife-camera-read-the-user-manual-carefully-to-make-sure.jpg)