Embed Size (px)
Citation preview

Faith, Food and
Fitness, Lesson 3:
Borlaug and GMOsJEFF AND LINDA GAURA, SPRING 2015

Agenda for Lesson 3
Prayer
Follow up on photos-????
Items that others have shared
Norman Borlaug Story
Wheat Belly
Obesity Trends
Alfredo Sauce

Story: Alex Gaura

What I found in the pantry….
Contains Egg-Mayonnaise
Contains Wheat-British Muffins
Contains Milk derivatives-Coffee Creamer

Who is this guy?

But there were consequences…

The culprit
Gluten via Borlaug’s wheat.
Wheatbellyblog.com front quote….
Insulin issues……

WORLDWIDE PREVALENCE OF DIABETES IN 2000
AND ESTIMATES FOR THE YEAR 2030 (IN MILLIONS)
19.7 33.9
2000
2030
20.7 42.3
31.7 79.4
28.3 37.4
13.3 33.0
20.0 52.8
7.1 18.6
0.9 1.7
22.3 58.1
148%
104%
161%
150%164%
32%
89%
162%
72%
United States
and Canada
India
China
Southeast
Asia
Middle
EastEurope
Latin America
and Carabbean
Sub-Saharan
Africa
Australia
Adapted from Hossain P et al. N Engl J Med 2007; 356: 213-5

Definitions:
• Obesity: Body Mass Index (BMI) of 30 or higher.
• Body Mass Index (BMI): A measure of an adult’s weight in relation to his or her height, specifically the adult’s weight in kilograms divided by the square of his or her height in meters.
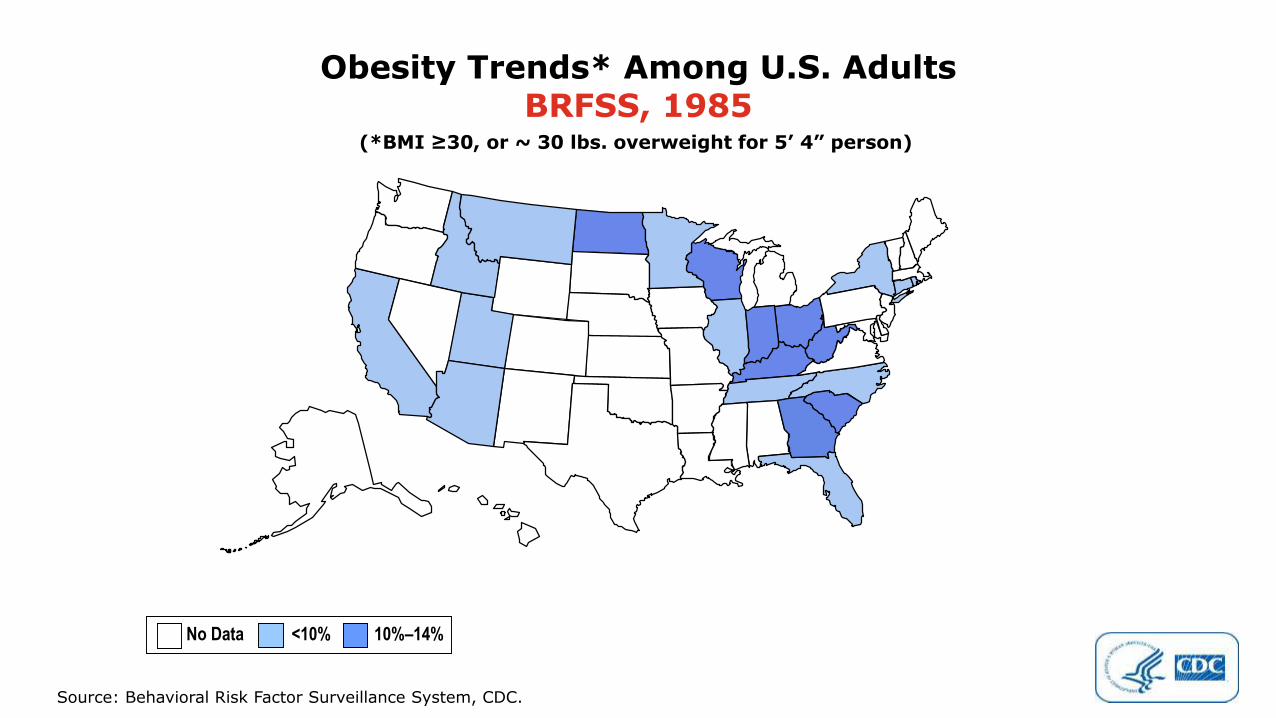
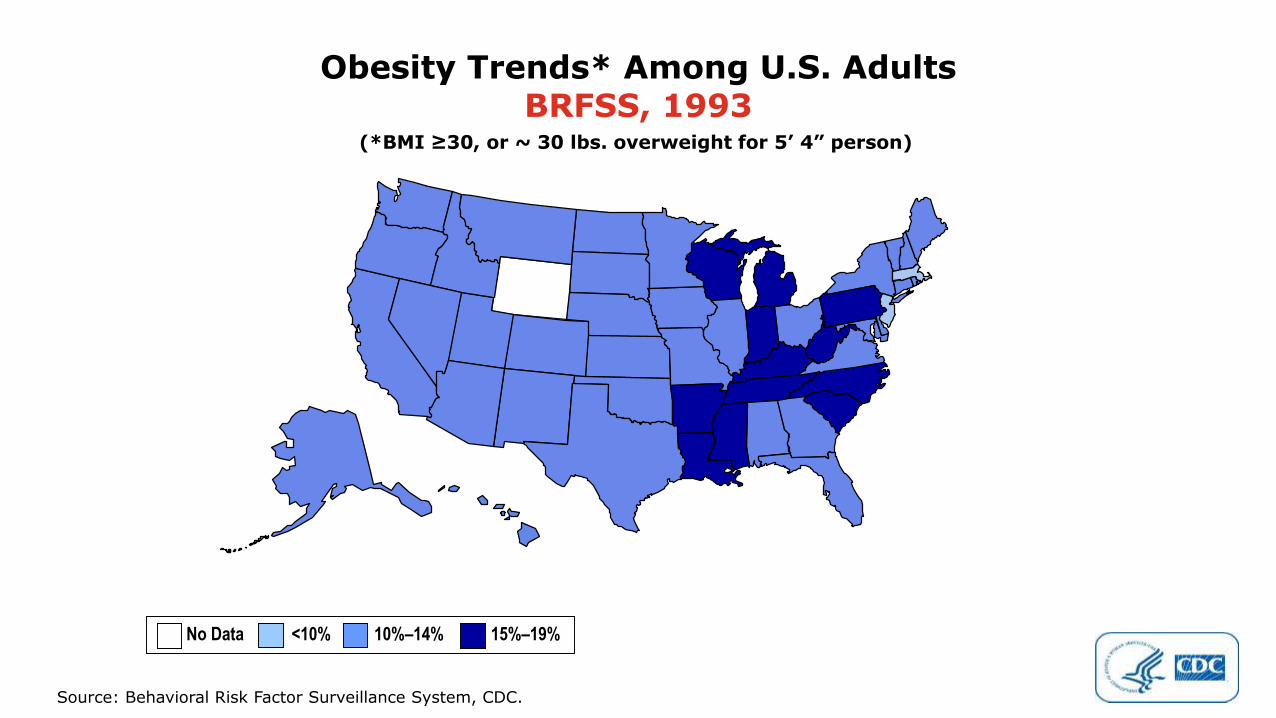
Obesity Trends Among U.S. Adults Between 1985 and 2010

Citations
• Mokdad AH, et al. The spread of the obesity epidemic in the United States, 1991–1998. JAMA 1999;282:16:1519–22.
• Mokdad AH, et al. The continuing epidemics of obesity and diabetes in the United States. JAMA 2001;286:10:1519–22.
• Mokdad AH, et al. Prevalence of obesity, diabetes, and obesity-related health risk factors, 2001. JAMA 2003;289:1:76–9.
• CDC. State-specific prevalence of obesity among adults —United States, 2005. MMWR 2006;55(36):985–8.
• CDC. State-specific prevalence of obesity among adults —United States, 2007. MMWR 2008;57(28):765–8.
• CDC. Vital signs: State-specific prevalence of obesity among adults — United States, 2009. MMWR 2010;59:1–5.
Source: Behavioral Risk Factor Surveillance System, CDC.
Obesity Trends* Among U.S. AdultsBRFSS, 1985
(*BMI ≥30, or ~ 30 lbs. overweight for 5’ 4” person)
No Data <10% 10%–14%

Source: Behavioral Risk Factor Surveillance System, CDC.
Obesity Trends* Among U.S. AdultsBRFSS, 1986
(*BMI ≥30, or ~ 30 lbs. overweight for 5’ 4” person)
No Data <10% 10%–14%

Source: Behavioral Risk Factor Surveillance System, CDC.
Obesity Trends* Among U.S. AdultsBRFSS, 1987
(*BMI ≥30, or ~ 30 lbs. overweight for 5’ 4” person)
No Data <10% 10%–14%

Source: Behavioral Risk Factor Surveillance System, CDC.
Obesity Trends* Among U.S. AdultsBRFSS, 1988
(*BMI ≥30, or ~ 30 lbs. overweight for 5’ 4” person)
No Data <10% 10%–14%

Source: Behavioral Risk Factor Surveillance System, CDC.
Obesity Trends* Among U.S. AdultsBRFSS, 1989
(*BMI ≥30, or ~ 30 lbs. overweight for 5’ 4” person)
No Data <10% 10%–14%

Source: Behavioral Risk Factor Surveillance System, CDC.
Obesity Trends* Among U.S. AdultsBRFSS, 1990
(*BMI ≥30, or ~ 30 lbs. overweight for 5’ 4” person)
No Data <10% 10%–14%

Source: Behavioral Risk Factor Surveillance System, CDC.
Obesity Trends* Among U.S. AdultsBRFSS, 1991
(*BMI ≥30, or ~ 30 lbs. overweight for 5’ 4” person)
No Data <10% 10%–14% 15%–19%

Source: Behavioral Risk Factor Surveillance System, CDC.
Obesity Trends* Among U.S. AdultsBRFSS, 1992
(*BMI ≥30, or ~ 30 lbs. overweight for 5’ 4” person)
No Data <10% 10%–14% 15%–19%
Source: Behavioral Risk Factor Surveillance System, CDC.
Obesity Trends* Among U.S. AdultsBRFSS, 1993
(*BMI ≥30, or ~ 30 lbs. overweight for 5’ 4” person)
No Data <10% 10%–14% 15%–19%

Source: Behavioral Risk Factor Surveillance System, CDC.
Obesity Trends* Among U.S. AdultsBRFSS, 1994
(*BMI ≥30, or ~ 30 lbs. overweight for 5’ 4” person)
No Data <10% 10%–14% 15%–19%

Source: Behavioral Risk Factor Surveillance System, CDC.
Obesity Trends* Among U.S. AdultsBRFSS, 1995
(*BMI ≥30, or ~ 30 lbs. overweight for 5’ 4” person)
No Data <10% 10%–14% 15%–19%

Source: Behavioral Risk Factor Surveillance System, CDC.
Obesity Trends* Among U.S. AdultsBRFSS, 1996
(*BMI ≥30, or ~ 30 lbs. overweight for 5’ 4” person)
No Data <10% 10%–14% 15%–19%

Source: Behavioral Risk Factor Surveillance System, CDC.
Obesity Trends* Among U.S. AdultsBRFSS, 1997
(*BMI ≥30, or ~ 30 lbs. overweight for 5’ 4” person)
No Data <10% 10%–14% 15%–19% ≥20%

Source: Behavioral Risk Factor Surveillance System, CDC.
Obesity Trends* Among U.S. AdultsBRFSS, 1998
(*BMI ≥30, or ~ 30 lbs. overweight for 5’ 4” person)
No Data <10% 10%–14% 15%–19% ≥20%

Source: Behavioral Risk Factor Surveillance System, CDC.
Obesity Trends* Among U.S. AdultsBRFSS, 1999
(*BMI ≥30, or ~ 30 lbs. overweight for 5’ 4” person)
No Data <10% 10%–14% 15%–19% ≥20%

Source: Behavioral Risk Factor Surveillance System, CDC.
Obesity Trends* Among U.S. AdultsBRFSS, 2000
(*BMI ≥30, or ~ 30 lbs. overweight for 5’ 4” person)
No Data <10% 10%–14% 15%–19% ≥20%

Source: Behavioral Risk Factor Surveillance System, CDC.
Obesity Trends* Among U.S. AdultsBRFSS, 2001
(*BMI ≥30, or ~ 30 lbs. overweight for 5’ 4” person)
No Data <10% 10%–14% 15%–19% 20%–24% ≥25%

Source: Behavioral Risk Factor Surveillance System, CDC.
(*BMI ≥30, or ~ 30 lbs. overweight for 5’ 4” person)
Obesity Trends* Among U.S. AdultsBRFSS, 2002
No Data <10% 10%–14% 15%–19% 20%–24% ≥25%

Source: Behavioral Risk Factor Surveillance System, CDC.
Obesity Trends* Among U.S. AdultsBRFSS, 2003
(*BMI ≥30, or ~ 30 lbs. overweight for 5’ 4” person)
No Data <10% 10%–14% 15%–19% 20%–24% ≥25%

Source: Behavioral Risk Factor Surveillance System, CDC.
Obesity Trends* Among U.S. AdultsBRFSS, 2004
(*BMI ≥30, or ~ 30 lbs. overweight for 5’ 4” person)
No Data <10% 10%–14% 15%–19% 20%–24% ≥25%

Source: Behavioral Risk Factor Surveillance System, CDC.
Obesity Trends* Among U.S. AdultsBRFSS, 2005
(*BMI ≥30, or ~ 30 lbs. overweight for 5’ 4” person)
No Data <10% 10%–14% 15%–19% 20%–24% 25%–29% ≥30%

Source: Behavioral Risk Factor Surveillance System, CDC.
Obesity Trends* Among U.S. AdultsBRFSS, 2006
(*BMI ≥30, or ~ 30 lbs. overweight for 5’ 4” person)
No Data <10% 10%–14% 15%–19% 20%–24% 25%–29% ≥30%

Source: Behavioral Risk Factor Surveillance System, CDC.
Obesity Trends* Among U.S. AdultsBRFSS, 2007
(*BMI ≥30, or ~ 30 lbs. overweight for 5’ 4” person)
No Data <10% 10%–14% 15%–19% 20%–24% 25%–29% ≥30%

Source: Behavioral Risk Factor Surveillance System, CDC.
Obesity Trends* Among U.S. AdultsBRFSS, 2008
(*BMI ≥30, or ~ 30 lbs. overweight for 5’ 4” person)
No Data <10% 10%–14% 15%–19% 20%–24% 25%–29% ≥30%

Source: Behavioral Risk Factor Surveillance System, CDC.
Obesity Trends* Among U.S. AdultsBRFSS, 2009
(*BMI ≥30, or ~ 30 lbs. overweight for 5’ 4” person)
No Data <10% 10%–14% 15%–19% 20%–24% 25%–29% ≥30%

Source: Behavioral Risk Factor Surveillance System, CDC.
Obesity Trends* Among U.S. AdultsBRFSS, 2010
(*BMI ≥30, or ~ 30 lbs. overweight for 5’ 4” person)
No Data <10% 10%–14% 15%–19% 20%–24% 25%–29% ≥30%
The response….
This is why we are here.
Talk about this, with others.
Be positive about the path ahead of you