Embed Size (px)
Citation preview

Market Failures: Public Goods and Externalities
05
McGraw-Hill/Irwin Copyright © 2012 by The McGraw-Hill Companies, Inc. All rights reserved.

Market Failures
• Market fails to produce the right
amount of the product
• Resources may be:
•Over-allocated
•Under-allocated
LO1 5-2

Demand-Side Failures
• Impossible to charge consumers
what they are willing to pay for the
product
•Some can enjoy benefits without
paying
LO1 5-3

Supply-Side Failures
•Occurs when a firm does not pay
the full cost of producing its output
•External costs of producing the
good are not reflected in supply
LO1 5-4

Efficiently Functioning Markets
• Demand curve must reflect the
consumers full willingness to pay
• Supply curve must reflect all the costs
of production
LO1 5-5

Consumer Surplus
• Difference between what a consumer
is willing to pay for a good and what
the consumer actually pays
• Extra benefit from paying less than
the maximum price
LO2 5-6

Consumer Surplus
LO2
Consumer Surplus
(1)
Person
(2)
Maximum
Price Willing
to Pay
(3)
Actual Price
(Equilibrium
Price)
(4)
Consumer
Surplus
Bob $13 $8 $5 (=$13-$8)
Barb 12 8 4 (=$12-$8)
Bill 11 8 3 (=$11-$8)
Bart 10 8 2 (=$10-$8)
Brent 9 8 1 (= $9-$8)
Betty 8 8 0 (= $8-$8)
5-7

Consumer Surplus
LO2 LO2
Pri
ce
(p
er
ba
g)
Quantity (bags)
D
Q1
P1
Consumer
Surplus
Equilibrium
Price
5-8

Producer Surplus
• Difference between the actual price a
producer receives and the minimum
price they would accept
• Extra benefit from receiving a higher
price
LO2 5-9

Producer Surplus
LO2
Producer Surplus
(1)
Person
(2)
Minimum
Acceptable
Price
(3)
Actual Price
(Equilibrium
Price)
(4)
Producer
Surplus
Carlos $3 $8 $5 (=$8-$3)
Courtney 4 8 4 (=$8-$4)
Chuck 5 8 3 (=$8-$5)
Cindy 6 8 2 (=$8-$6)
Craig 7 8 1 (=$8-$7)
Chad 8 8 0 (=$8-$8)
5-10

Producer Surplus
LO2 LO2
Pri
ce (
per
bag
)
Quantity (bags)
S
Q1
P1
Equilibrium
price
Producer
surplus
5-11

Efficiency Revisited
LO2
Pri
ce
(p
er
ba
g)
Quantity (bags)
S
Q1
P1
D
Consumer
surplus
Producer
surplus
5-12

Quantity (bags)
Pri
ce (
per
bag
)
Efficiency Losses
LO2
c
S
Q1 Q2
D
b
d
a
e
Efficiency loss
from underproduction
5-13

Efficiency Losses
LO2
c
S
Q1 Q3
D
b
f
a
g
Quantity (bags)
Pri
ce
(p
er
ba
g)
Efficiency loss
from overproduction
5-14

Private Goods
• Produced in the market by firms
• Offered for sale
• Characteristics
•Rivalry
•Excludability
LO3 5-15

Public Goods
• Provided by government
•Offered for free
• Characteristics
•Nonrivalry
•Nonexcludability
• Free-rider problem
LO3 5-16

Summary
LO3 5-17
Excludable Non-excludable
Rivalrous Private Good Food, clothing, cars,
personal electronics
Common Goods Fish stocks, timber, coal
Non-rivalrous Club Good Cinemas, private parks,
satellite television
Public Good Free-to-air television, air,
national defense, city
fireworks shows

Demand for Public Goods
LO3
Demand for a Public Good, Two Individuals
(1)
Quantity
of Public
Good
(2)
Adams’ Willingness
to Pay (Price)
(3)
Benson’s
Willingness to
Pay (Price)
(4)
Collective
Willingness
to Pay (Price)
1 $4 + $5 = $9
2 3 + 4 = 7
3 2 + 3 = 5
4 1 + 2 = 3
5 0 + 1 = 1
5-18

Demand for Public Goods
LO3
$6
5
4
3
2
1
0
P
Q 1 2 3 4 5
$6
5
4
3
2
1 0
P
Q 1 2 3 4 5 Adams
Benson
D1
D2
Adams’ Demand
Benson’s Demand
$3 for 2 Items
$4 for 2 Items
$1 for 4 Items
$2 for 4 Items
$9
7
5
3
1
0
P
Q 1 2 3 4 5 Collective Demand and Supply
DC
S Collective Demand
$7 for 2 Items
$3 for 4 Items
Connect the Dots
Optimal Quantity
Collective Willingness
To Pay
5-19

Cost-Benefit Analysis
• Cost
•Resources diverted from private
good production
•Private goods that will not be
produced
• Benefit
• The extra satisfaction from the
output of more public goods
LO3 5-20

Cost-Benefit Analysis
LO3
Cost-Benefit Analysis for a National Highway Construction Project
(in Billions)
(1)
Plan
(2)
Total Cost
of Project
(3)
Marginal
Cost
(4)
Total
Benefit
(5)
Marginal
Benefit
(6)
Net Benefit
(4) – (2)
No new construction $0 $0 $0
A: Widen existing highways 4 $4 5 $5 1
B: New 2-lane highways 10 6 13 8 3
C: New 4-lane highways 18 8 22 10 5
D: New 6-lane highways 28 10 26 3 -2
5-21

Quasi-Public Goods
• Could be provided through the market
system
• Because of positive externalities the
government provides them
• Examples: education, streets,
libraries
LO3 5-22

The Reallocation Process
• Government
• Taxes individuals and businesses
• Takes the money and spends on
production of public goods
LO3 5-23

Externalities
• A cost or benefit accruing to a third
party external to the transaction
• Positive externalities
• Too little is produced
•Demand-side market failures
• Negative externalities
• Too much is produced
•Supply side market failures
LO4 5-24

Externalities
LO4
(a)
Negative externalities (b)
Positive externalities
0
D
S
St
Overallocation
Negative
Externalities St
Underallocation
Positive
Externalities
Qo Qo Qe Qe
P P
0 Q Q
D
Dt
a
c
z
x
b y
5-25

Government Intervention
• Correct negative externalities
•Direct controls
•Specific taxes
• Correct positive externalities
•Subsidies and government
provision
LO4 5-26

Government Intervention
LO4
(a)
Negative Externalities
D
S
St
Overallocation
Negative
Externalities
Qo Qe
P
0 Q
a
c
b
(b)
Correct externality with
tax
D
S
St
Qo Qe
P
0 Q
a
T
5-27

Government Intervention
LO4
(a)
Positive Externalities
0
St
Underallocation
Positive
Externalities
Qo Qe
D
Dt
z
x
y
(b)
Correcting via a subsidy
to consumers
0
St
Qo Qe
D
Dt
(c)
Correcting via a subsidy
to producers
0
S't
Qo Qe
D
Subsidy
St
Subsidy
U
5-28
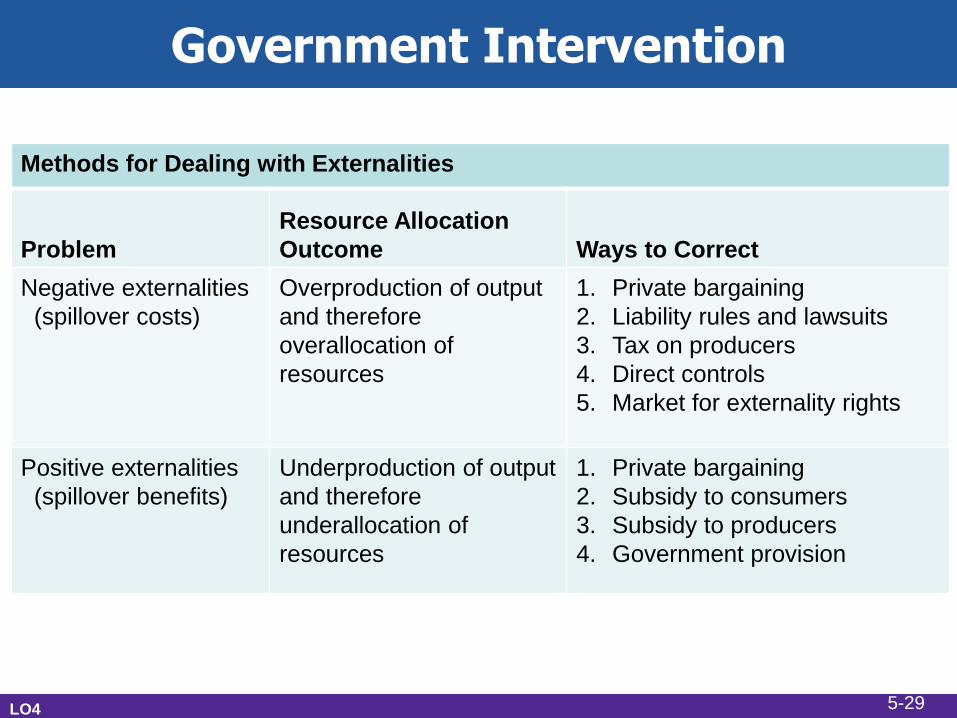
Government Intervention
LO4
Methods for Dealing with Externalities
Problem
Resource Allocation
Outcome Ways to Correct
Negative externalities
(spillover costs)
Overproduction of output
and therefore
overallocation of
resources
1. Private bargaining
2. Liability rules and lawsuits
3. Tax on producers
4. Direct controls
5. Market for externality rights
Positive externalities
(spillover benefits)
Underproduction of output
and therefore
underallocation of
resources
1. Private bargaining
2. Subsidy to consumers
3. Subsidy to producers
4. Government provision
5-29

Society’s Optimal Amounts
LO5
0
So
cie
ty’s
Marg
inal
Be
nefi
t an
d M
arg
inal
Co
st
of
Po
llu
tio
n A
bate
men
t (D
ollars
)
Q1
MB
MC
Socially
Optimal Amount
Of Pollution
Abatement
5-30

Government’s Role in the Economy
• Government can have a role in
correcting externalities
• Officials must correctly identify the
existence and cause
• Has to be done in the context of
politics
LO5 5-31

Controlling Carbon Dioxide Emissions
• Cap and trade
•Sets a cap for the total amount of
emissions
•Assigns property rights to pollute
•Rights can then be bought and sold
• Carbon tax
•Raises cost of polluting
• Easier to enforce
5-32

Problem #1
Market failure is said to occur whenever:
A. private markets do not allocate resources
in the most economically desirable way.
B. prices rise.
C. some consumers who want a good do not
obtain it because the price is higher than
they are willing to pay.
D. government intervenes in the functioning
of private markets.
5-33
A

Problem #2
Refer to the diagrams for two separate product markets. Assume that
society's optimal level of output in each market is Q0 and that
government purposely shifts the market supply curve from S to S1 in
diagram (a) and from S to S2 in diagram (b). We can conclude that the
government is correcting for:
A. negative externalities in diagram (a) and positive externalities in
diagram (b).
B. positive externalities in diagram (a) and negative externalities in
diagram (b).
C. negative externalities in both diagrams.
D. positive externalities in both diagrams.
5-34
A
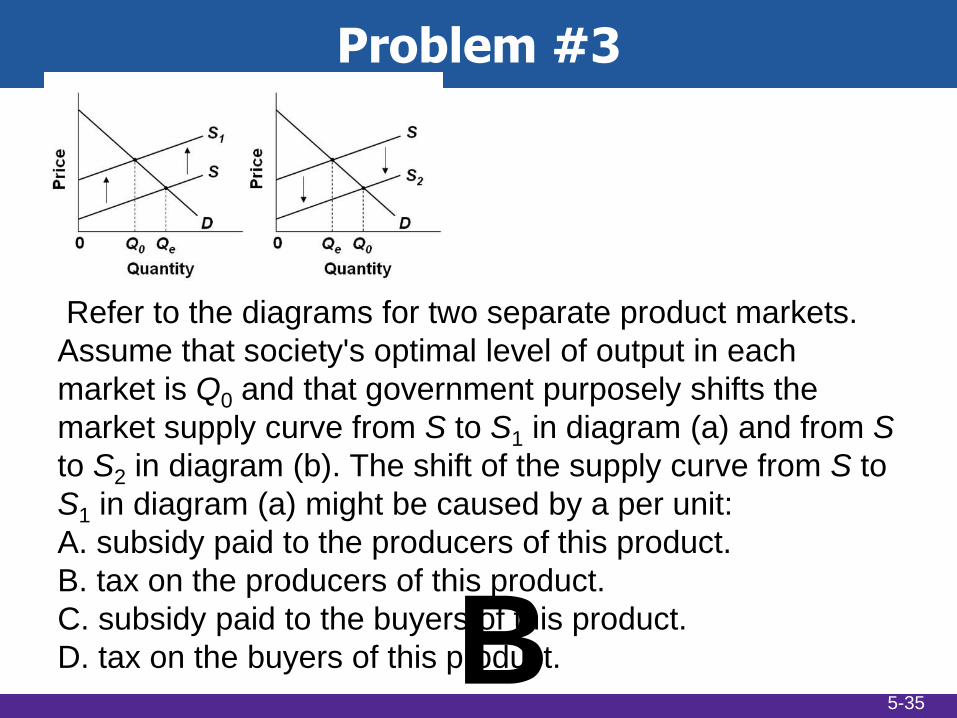
Problem #3
Refer to the diagrams for two separate product markets.
Assume that society's optimal level of output in each
market is Q0 and that government purposely shifts the
market supply curve from S to S1 in diagram (a) and from S
to S2 in diagram (b). The shift of the supply curve from S to
S1 in diagram (a) might be caused by a per unit:
A. subsidy paid to the producers of this product.
B. tax on the producers of this product.
C. subsidy paid to the buyers of this product.
D. tax on the buyers of this product.
5-35
B

Problem #4
Producer surplus:
A. is the difference between the maximum prices
consumers are willing to pay for a product and the
lower equilibrium price.
B. rises as equilibrium price falls.
C. is the difference between the minimum prices
producers are willing to accept for a product and
the higher equilibrium price.
D. is the difference between the maximum prices
consumers are willing to pay for a product and the
minimum prices producers are willing to accept.
5-36
C

Problem #5
The two main characteristics of a public
good are:
A. production at constant marginal cost
and rising demand.
B. nonexcludability and production at
rising marginal cost.
C. nonrivalry and nonexcludability.
D. nonrivalry and large negative
externalities.
5-37
C

Problem #6
Demand-side market failures occur when:
A. the demand and supply curves don't reflect
consumers' full willingness to pay for a good or
service.
B. the demand and supply curves don't reflect the
full cost of producing a good or service.
C. government imposes a tax on a good or
service.
D. a good or service is not produced because no
one demands it.
5-38
A

Problem #7
Amanda buys a ruby for $330 for which she was
willing to pay $340. The minimum acceptable price
to the seller, Tony, was $140. Amanda
experiences:
A. a consumer surplus of $10 and Tony
experiences a producer surplus of $190.
B. a producer surplus of $200 and Tony
experiences a consumer surplus of $10.
C. a consumer surplus of $670 and Tony
experiences a producer surplus of $200.
D. a producer surplus of $10 and Tony
experiences a consumer surplus of $190.
5-39
A

Problem #8
Unlike a private good, a public good:
A. has no opportunity costs.
B. has benefits available to all,
including nonpayers.
C. produces no positive or negative
externalities.
D. is characterized by rivalry and
excludability.
5-40
B

Problem #9
Refer to the above
diagram. Assuming
equilibrium price P1,
consumer surplus is
represented by
areas:
A. a + b.
B. a + b + c + d.
C. c + d.
D. a + c.
5-41
A
Problem #10
From society's perspective, in the presence of a
supply-side market failure, the last unit of a good
produced typically:
A. generates more of a benefit than it costs to
produce.
B. produces a benefit exactly equal to the cost of
producing the last unit.
C. maximizes the net benefit to society.
D. costs more to produce than it provides in
benefits.
5-42
D

Problem #11
Public goods are those for which there:
A. is no free-rider problem.
B. are no externalities.
C. is nonrivalry and nonexcludability.
D. is rivalry and excludability.
5-43
C

Problem #12
Refer to the
diagram. With MB1
and MC1, society's
optimal amount of
pollution abatement
is:
A. Q1.
B. Q2.
C. Q3.
D. Q4.
5-44
A

Problem #13
Which of the following statements is not
true?
A. Some public goods are paid for by
private philanthropy.
B. Private provision of public goods is
usually unprofitable.
C. The free-rider problem results from the
characteristics of nonrivalry and
nonexcludability.
D. Public goods are only provided by
government. 5-45
D

Problem #14
If the demand curve reflects consumers' full
willingness to pay, and the supply curve reflects all
costs of production, then which of the following is
true?
A. The benefit surpluses shared between
consumers and producers will be maximized.
B. The benefit surpluses received by consumers
and producers will be equal.
C. There will be no consumer or producer surplus.
D. Consumer surplus will be maximized, and
producer surplus will be minimized.
5-46
A

Problem #15
Which of the following statements is not
true?
A. Some public goods are paid for by private
philanthropy.
B. Private provision of public goods is
usually unprofitable.
C. The free-rider problem results from the
characteristics of nonrivalry and
nonexcludability.
D. Public goods are only provided by
government. 5-47
D

Problem #16
Refer to the diagram. If actual
production and consumption
occur at Q1:
A. efficiency is achieved.
B. consumer surplus is
maximized.
C. an efficiency loss (or
deadweight loss) of b + d
occurs.
D. an efficiency loss (or
deadweight loss) of e + d
occurs. 5-48
C

Problem #17
Allocative efficiency occurs only at that output
where:
A. marginal benefit exceeds marginal cost by the
greatest amount.
B. consumer surplus exceeds producer surplus by
the greatest amount.
C. the combined amounts of consumer surplus
and producer surplus are maximized.
D. the areas of consumer and producer surplus
are equal.
5-49
C

Problem #18
An efficiency loss (or deadweight loss):
A. is measured as the combined loss of consumer
surplus and producer surplus.
B. results from producing a unit of output for which
the maximum willingness to pay exceeds the
minimum acceptable price.
C. can result from underproduction, but not from
overproduction.
D. can result from overproduction, but not from
underproduction.
5-50
A

Problem #19
The MC curves in the above diagram slope
upward because of the law of:
A. demand.
B. conservation of matter and energy.
C. diminishing marginal utility.
D. diminishing returns.
5-51
D