Embed Size (px)
Citation preview
Listening through a Vibration Motor
Nirupam Roy, Romit Roy ChoudhuryUniversity of Illinois at Urbana-Champaign
ABSTRACTThis paper demonstrates the feasibility of using the vibra-tion motor in mobile devices as a sound sensor, almost likea microphone. We show that the vibrating mass inside themotor – designed to oscillate to changing magnetic fields –also responds to air vibrations from nearby sounds. Withappropriate processing, the responses become intelligible, tothe extent that humans can understand the vibra-motorrecorded words with greater than 80% average accuracy.Even off-the-shelf speech recognition softwares are able todecode at 60% accuracy, without any training or machinelearning. While these findings are not fundamentally sur-prising (given that any vibrating object should respond toair vibrations), the fidelity to which this is possible has beensomewhat unexpected. We present our overall techniquesand results through a system called VibraPhone, and dis-cuss implications to both sensing and security.
1. INTRODUCTIONVibration motors, also called“vibra-motors”, are small actu-ators embedded in all types of phones and wearables. Theseactuators have been classically used to provide tactile alertsto human users. This paper identifies the possibility of us-ing vibra-motors as a sound sensor, based on the observa-tion that the same movable mass that causes the pulsation,should also respond to changes in air pressure. Even thoughthe vibra-motor is likely to be far less sensitive comparedto the (much lighter) diaphragm of an actual microphone,the question we ask is: to what fidelity can the sound bereproduced?
Even modest reproduction could prompt new applicationsand threats. On one hand, wearable devices like fitbits, thatotherwise do not have a microphone, could now respond tovoice commands. Further, in devices that already have mi-crophones, perhaps better SNR could be achieved by com-bining the uncorrelated (noise) properties of the vibra-motorand microphone. On the other hand, leaking sound throughvibra-motors opens new side channels – a malware that has
Permission to make digital or hard copies of all or part of this work for personal orclassroom use is granted without fee provided that copies are not made or distributedfor profit or commercial advantage and that copies bear this notice and the full citationon the first page. Copyrights for components of this work owned by others than theauthor(s) must be honored. Abstracting with credit is permitted. To copy otherwise, orrepublish, to post on servers or to redistribute to lists, requires prior specific permissionand/or a fee. Request permissions from [email protected].
MobiSys’16, June 25 - 30, 2016, Singapore, Singaporec© 2016 Copyright held by the owner/author(s). Publication rights licensed to ACM.
ISBN 978-1-4503-4269-8/16/06. . . $15.00
DOI: http://dx.doi.org/10.1145/2906388.2906415
default access to a phone’s vibra-motor may now be ableto eavesdrop into every phone conversation. Toys that havevibra-motors embedded could potentially listen into the am-bience. This paper is an investigation into the vibra-motor’sefficacy as a sound sensor, speech in particular.
Our work follows a recent line of work in which motion sen-sors in smartphones have been shown to detect sound. Au-thors of Gyrophone [30] first demonstrated the feasibilityof detecting sound signals from the rotational motions ofsmartphone gyroscopes. A recent work [47] reported howaccelerometers may also be able to detect sound, in fact,classify spoken keywords such as “OK Google” or “HelloSiri”. Authors rightly identified the applicability to continu-ous sound sensing – the energy-efficient accelerometer couldalways stay active, and turn on the energy-hungry micro-phone only upon detecting a keyword. While certainly use-ful, we observe that these systems run pattern recognitionalgorithms on the features of the signals. The vocabulary isnaturally limited to less than 3 keywords, trained by a spe-cific speaker. VibraPhone is attempting a different problemaltogether – instead of learning a motion signature, it at-tempts to reconstruct the inherent speech content from thelow bandwidth, highly distorted output of the vibra-motor.Hence, there are no vocabulary restrictions, and the out-put of VibraPhone should be decodable by speech-to-textsoftwares.
As a first step towards converting a vibra-motor into a soundsensor, VibraPhone exploits the notion of reverse electromo-tive force (back-EMF) in electronic circuits. Briefly, the A/Ccurrent in the vibra-motor creates a changing magnetic fieldaround a coil, which in turn causes the vibra-motor mass tovibrate. However, when an external force impinges on thesame mass – say due to the pressure of ambient sound – itcauses additional motion, translating into a current in theopposite direction. This current, called back-EMF, can bedetected through an ADC after sufficient amplification. Ofcourse, the signal extracted from the back-EMF is noisy andat a lower bandwidth than human speech. However, giventhat human speech obeys an “acoustic grammar”, we findan opportunity to recover the spoken words even from theback-EMF’s signal traces. VibraPhone focuses on exactlythis problem, and develops a sequence of techniques, includ-ing spectral subtraction, energy localization, formant extrap-olation, and harmonic reconstruction, to ultimately distillout legible speech.
Our experimentation platform is both a Samsung smart-phone and a custom circuit that uses vibra-motor chips pur-
chased online (these chips are exactly the ones used in to-day’s phones and wearables). We characterize the extentof signal reconstruction as a function of the loudness of thesound source. Performance metrics are defined by the accu-racy with which the reconstructed signals are intelligible tohumans and to (open-source) automatic speech recognitionsoftwares. We use the smartphone microphone as an upperbound, and for fairness, record the speech at the same soundpressure level (SPL) [24, 4, 42] across all the devices. Weexperiment across a range of scenarios within our universitybuilding, and observe that results are robust/useful whenthe speaker is less than 2 meters from the vibra-motor.
Finally, we emphasize that smartphone vibra-motors can-not be used as microphones today, primarily because theactuator is simply not connected to an ADC. To this end,launching side-channel attacks is not immediate. However,as discussed later, we find that enabling the listening ca-pability requires almost trivial rewiring (just soldering at 4clearly visible junctions). This paper sidesteps these imme-diacy questions and concentrates on the core nature of theinformation leakage. At the least, we hope this work willdraw attention to the permission policies on vibra-motors,which today are open to all apps by default. We have madevarious audio demos of VibraPhone available on our website[5] – we request the readers to listen to them to better expe-rience the audio effects and reconstructions. In closing, themain contributions in this paper may be summarized as:
• Recognizing that ambient sound manifests itself as back-EMF inside vibra-motor chips. This leads to an actuatorbecoming a sound sensor with minimal changes to thecurrent mobile device hardware.
• Designing techniques that exploit constraints and struc-ture of human speech to decode words from a noisy, lowbandwidth signal. Building the system on a smartphoneand custom hardware platform, and demonstrating de-coding accuracy of up to 88% when a male user is speak-ing in normal voice near his phone.
The rest of the paper expands on these contributions. Webegin with a brief introduction to vibra-motors and ourhardware platform.
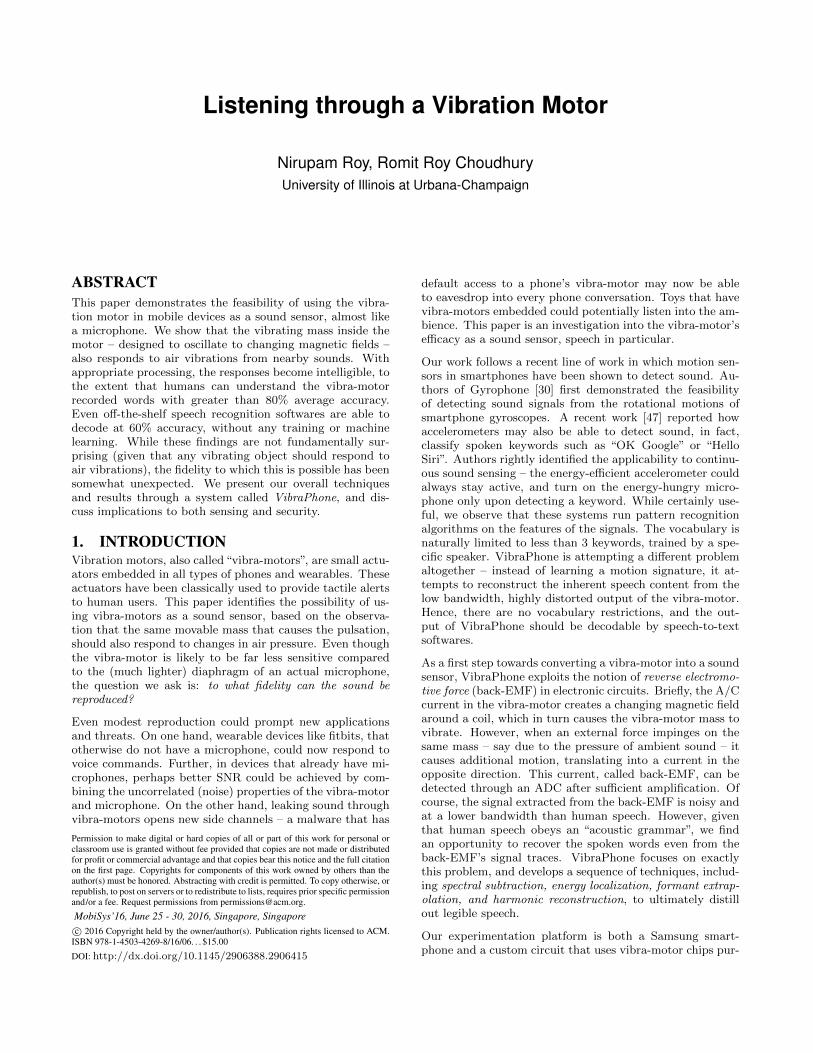
2. UNDERSTANDING VIBRA-MOTORSA vibra-motor is an electro-mechanical device that movesa magnetic mass rhythmically around a neutral position togenerate vibrations [36]. While there are various kinds ofvibra-motors, a popular one is called Linear Resonant Ac-tuators (LRA) shown in Figure 1. With LRA, vibration isgenerated by the linear movement of the magnetic mass sus-pended near a coil, called the“voice coil”. Upon applying ACcurrent to the motor, the coil also behaves like a magnet (dueto the generated electromagnetic field) and causes the massto be attracted or repelled, depending on the direction of thecurrent. This generates vibration at the same frequency asthe input AC signal, while the amplitude of vibration is dic-tated by the signal’s peak-to-peak voltage. Thus LRAs offercontrol on both the magnitude and frequency of vibration.Most smartphones today use LRA based vibra-motors.
2.1 Sound Sensing through back-EMFBack-EMF is an electro-magnetic effect observed in magnet-based motors when relative motion occurs between the cur-rent carrying armature/coil and the magnetic mass’s own
Figure 1: Basic sketch of an LRA vibra-motor.
field. According to Faraday’s law of electromagnetic induc-tion [16], this changing magnetic flux induces an electromo-tive force in the coil. Lenz’s law [41] says this electromotiveforce acts in the reverse direction of the driving voltage,called back-EMF of the motor. As the rate of change of themagnetic flux is proportional to the speed of the magneticmass, the back-EMF serves as an indicator of the extraneousvibration experienced by the mass.
Since sound is a source of external vibration, the movablemass in the vibra-motor is expected to exhibit a (subtle)response to it. Our experiments show that, when the vibra-motor is connected to an ADC, the back-EMF generatedby the ambient sound can be recorded. This is possibleeven when the vibra-motor is passive (i.e., not pulsatingto produce tactile alerts). We call this ADC output vibra-signal to distinguish it from the microphone signal that wewill later use as a baseline for comparison. We now describeour platform to record and process the vibra-signal.
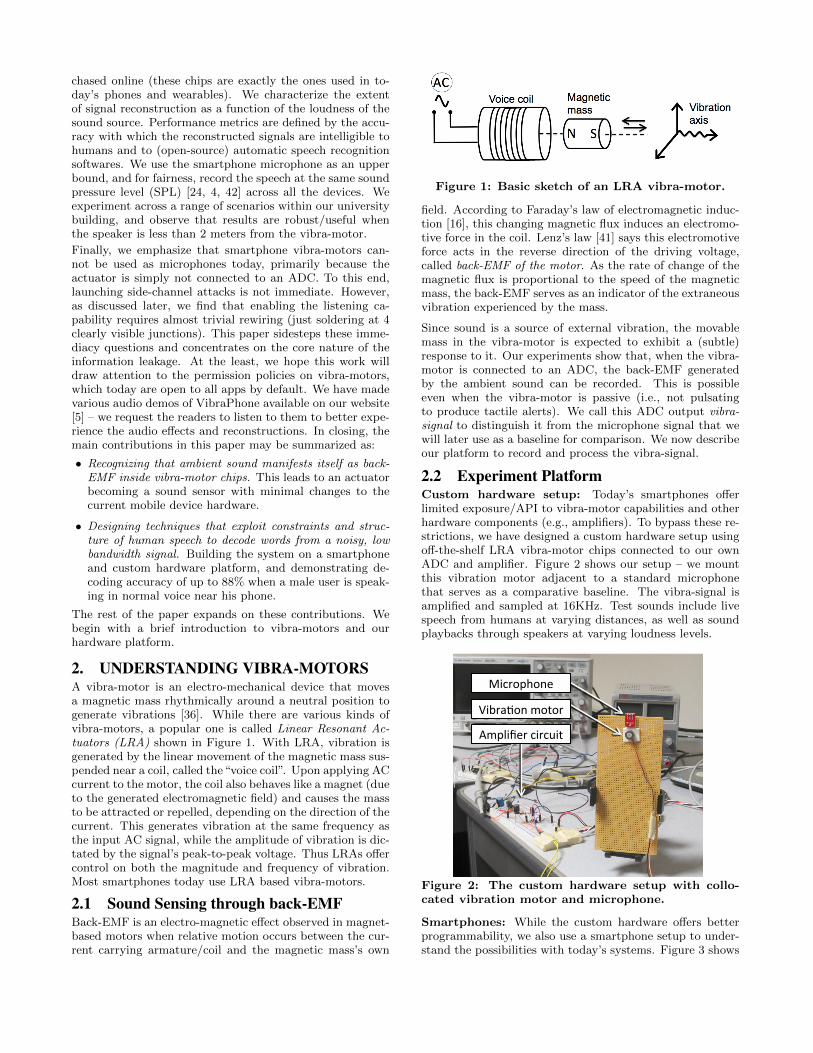
2.2 Experiment PlatformCustom hardware setup: Today’s smartphones offerlimited exposure/API to vibra-motor capabilities and otherhardware components (e.g., amplifiers). To bypass these re-strictions, we have designed a custom hardware setup usingoff-the-shelf LRA vibra-motor chips connected to our ownADC and amplifier. Figure 2 shows our setup – we mountthis vibration motor adjacent to a standard microphonethat serves as a comparative baseline. The vibra-signal isamplified and sampled at 16KHz. Test sounds include livespeech from humans at varying distances, as well as soundplaybacks through speakers at varying loudness levels.
Microphone
Vibra7onmotor
Amplifiercircuit
Figure 2: The custom hardware setup with collo-cated vibration motor and microphone.
Smartphones: While the custom hardware offers betterprogrammability, we also use a smartphone setup to under-stand the possibilities with today’s systems. Figure 3 shows
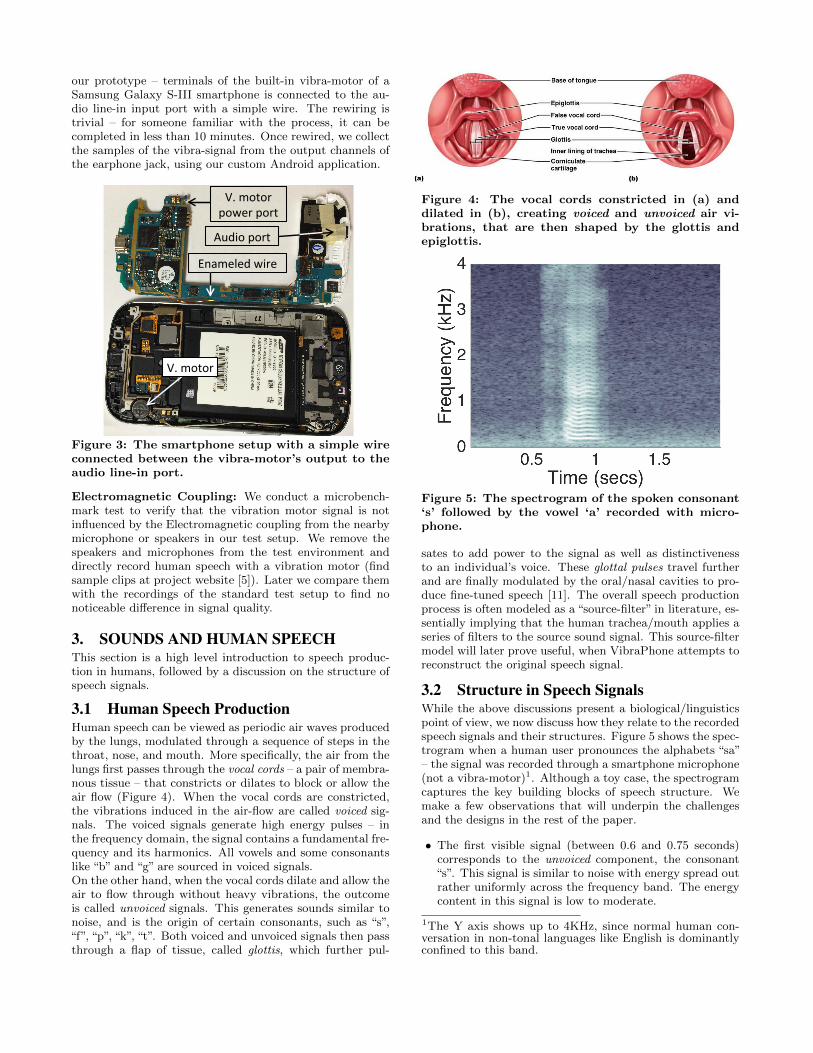
our prototype – terminals of the built-in vibra-motor of aSamsung Galaxy S-III smartphone is connected to the au-dio line-in input port with a simple wire. The rewiring istrivial – for someone familiar with the process, it can becompleted in less than 10 minutes. Once rewired, we collectthe samples of the vibra-signal from the output channels ofthe earphone jack, using our custom Android application.
V.motorpowerport
Enameledwire
Audioport
V.motor
Figure 3: The smartphone setup with a simple wireconnected between the vibra-motor’s output to theaudio line-in port.
Electromagnetic Coupling: We conduct a microbench-mark test to verify that the vibration motor signal is notinfluenced by the Electromagnetic coupling from the nearbymicrophone or speakers in our test setup. We remove thespeakers and microphones from the test environment anddirectly record human speech with a vibration motor (findsample clips at project website [5]). Later we compare themwith the recordings of the standard test setup to find nonoticeable difference in signal quality.
3. SOUNDS AND HUMAN SPEECHThis section is a high level introduction to speech produc-tion in humans, followed by a discussion on the structure ofspeech signals.
3.1 Human Speech ProductionHuman speech can be viewed as periodic air waves producedby the lungs, modulated through a sequence of steps in thethroat, nose, and mouth. More specifically, the air from thelungs first passes through the vocal cords – a pair of membra-nous tissue – that constricts or dilates to block or allow theair flow (Figure 4). When the vocal cords are constricted,the vibrations induced in the air-flow are called voiced sig-nals. The voiced signals generate high energy pulses – inthe frequency domain, the signal contains a fundamental fre-quency and its harmonics. All vowels and some consonantslike “b” and “g” are sourced in voiced signals.On the other hand, when the vocal cords dilate and allow theair to flow through without heavy vibrations, the outcomeis called unvoiced signals. This generates sounds similar tonoise, and is the origin of certain consonants, such as “s”,“f”, “p”, “k”, “t”. Both voiced and unvoiced signals then passthrough a flap of tissue, called glottis, which further pul-
Figure 4: The vocal cords constricted in (a) anddilated in (b), creating voiced and unvoiced air vi-brations, that are then shaped by the glottis andepiglottis.
Figure 5: The spectrogram of the spoken consonant‘s’ followed by the vowel ‘a’ recorded with micro-phone.
sates to add power to the signal as well as distinctivenessto an individual’s voice. These glottal pulses travel furtherand are finally modulated by the oral/nasal cavities to pro-duce fine-tuned speech [11]. The overall speech productionprocess is often modeled as a “source-filter” in literature, es-sentially implying that the human trachea/mouth applies aseries of filters to the source sound signal. This source-filtermodel will later prove useful, when VibraPhone attempts toreconstruct the original speech signal.
3.2 Structure in Speech SignalsWhile the above discussions present a biological/linguisticspoint of view, we now discuss how they relate to the recordedspeech signals and their structures. Figure 5 shows the spec-trogram when a human user pronounces the alphabets “sa”– the signal was recorded through a smartphone microphone(not a vibra-motor)1. Although a toy case, the spectrogramcaptures the key building blocks of speech structure. Wemake a few observations that will underpin the challengesand the designs in the rest of the paper.
• The first visible signal (between 0.6 and 0.75 seconds)corresponds to the unvoiced component, the consonant“s”. This signal is similar to noise with energy spread outrather uniformly across the frequency band. The energycontent in this signal is low to moderate.
1The Y axis shows up to 4KHz, since normal human con-versation in non-tonal languages like English is dominantlyconfined to this band.
• The second visible signal corresponds to the vowel “a”and is an example of the voiced component. The signalshows a low fundamental frequency and many harmon-ics all the way to 4KHz. Fundamental frequencies arearound 85–180Hz for males and 165–255Hz for females[43]. The energy content of this signal is far strongerthan the unvoiced counterpart.
• Within the voiced signal, the energy content is higherin the lower frequencies. These strong low frequencycomponents determine the intelligibility of the spokenphonemes (i.e. the perceptually distinct units of sound[44]), and are referred to as formants [28]. The first twoformants (say, F1, F2) remain between 300–2500Hz andcompletely forms the sound of the vowels, while some con-sonants have another significant formant, F3, at a higherfrequency. Figure 6 shows examples of 2 vowel formants– “i” and “a” – recorded by the microphone.
Frequency (KHz) 1.3 2.7 4
Magn
itude
(dB)
20
25
30
35
40
45
F1 (330 Hz)
F2 (2.53 KHz)
1.3 2.7 4
F1 (800 Hz)F2 (1.46 KHz)
Figure 6: The locations of the first two formants (F1and F2) for (a) the vowel sound ‘i’ and (b) the vowelsound ‘a’, both recorded with microphone.
In extracting human speech from the vibra-motor’s back-EMF signal, VibraPhone will need to identify, construct,and bolster these formants through signal processing.
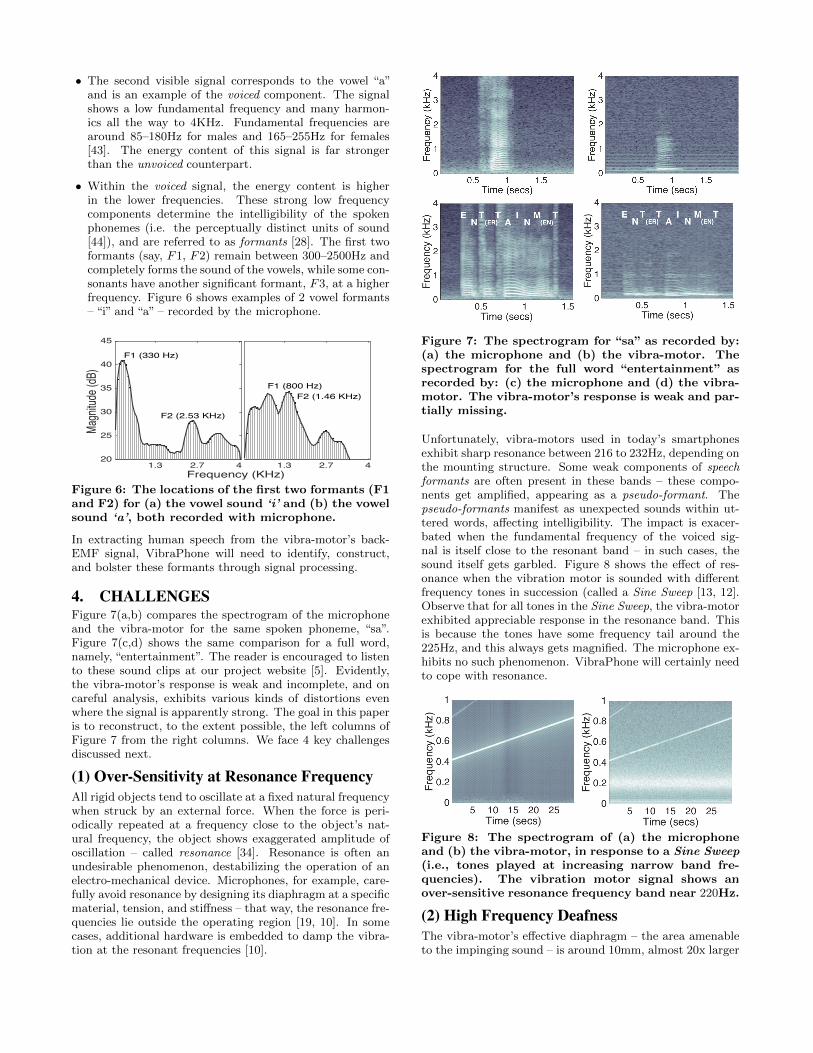
4. CHALLENGESFigure 7(a,b) compares the spectrogram of the microphoneand the vibra-motor for the same spoken phoneme, “sa”.Figure 7(c,d) shows the same comparison for a full word,namely, “entertainment”. The reader is encouraged to listento these sound clips at our project website [5]. Evidently,the vibra-motor’s response is weak and incomplete, and oncareful analysis, exhibits various kinds of distortions evenwhere the signal is apparently strong. The goal in this paperis to reconstruct, to the extent possible, the left columns ofFigure 7 from the right columns. We face 4 key challengesdiscussed next.
(1) Over-Sensitivity at Resonance FrequencyAll rigid objects tend to oscillate at a fixed natural frequencywhen struck by an external force. When the force is peri-odically repeated at a frequency close to the object’s nat-ural frequency, the object shows exaggerated amplitude ofoscillation – called resonance [34]. Resonance is often anundesirable phenomenon, destabilizing the operation of anelectro-mechanical device. Microphones, for example, care-fully avoid resonance by designing its diaphragm at a specificmaterial, tension, and stiffness – that way, the resonance fre-quencies lie outside the operating region [19, 10]. In somecases, additional hardware is embedded to damp the vibra-tion at the resonant frequencies [10].
Figure 7: The spectrogram for “sa” as recorded by:(a) the microphone and (b) the vibra-motor. Thespectrogram for the full word “entertainment” asrecorded by: (c) the microphone and (d) the vibra-motor. The vibra-motor’s response is weak and par-tially missing.
Unfortunately, vibra-motors used in today’s smartphonesexhibit sharp resonance between 216 to 232Hz, depending onthe mounting structure. Some weak components of speechformants are often present in these bands – these compo-nents get amplified, appearing as a pseudo-formant. Thepseudo-formants manifest as unexpected sounds within ut-tered words, affecting intelligibility. The impact is exacer-bated when the fundamental frequency of the voiced sig-nal is itself close to the resonant band – in such cases, thesound itself gets garbled. Figure 8 shows the effect of res-onance when the vibration motor is sounded with differentfrequency tones in succession (called a Sine Sweep [13, 12].Observe that for all tones in the Sine Sweep, the vibra-motorexhibited appreciable response in the resonance band. Thisis because the tones have some frequency tail around the225Hz, and this always gets magnified. The microphone ex-hibits no such phenomenon. VibraPhone will certainly needto cope with resonance.
Figure 8: The spectrogram of (a) the microphoneand (b) the vibra-motor, in response to a Sine Sweep(i.e., tones played at increasing narrow band fre-quencies). The vibration motor signal shows anover-sensitive resonance frequency band near 220Hz.
(2) High Frequency DeafnessThe vibra-motor’s effective diaphragm – the area amenableto the impinging sound – is around 10mm, almost 20x larger
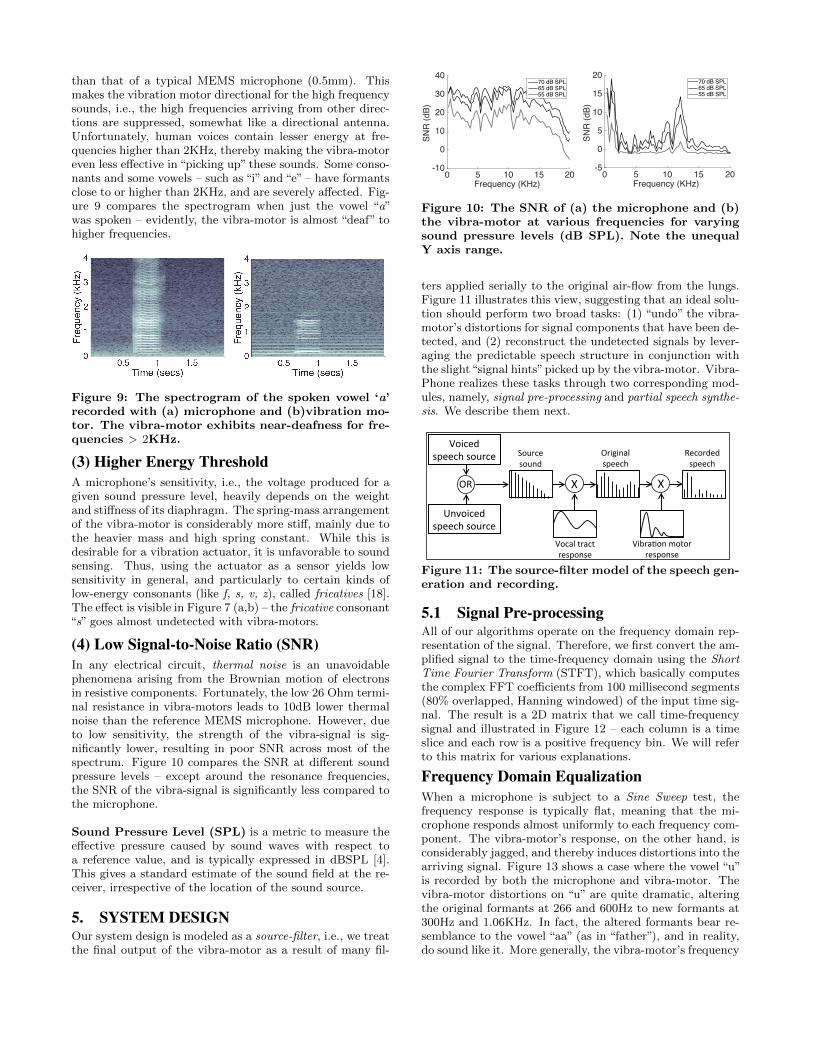
than that of a typical MEMS microphone (0.5mm). Thismakes the vibration motor directional for the high frequencysounds, i.e., the high frequencies arriving from other direc-tions are suppressed, somewhat like a directional antenna.Unfortunately, human voices contain lesser energy at fre-quencies higher than 2KHz, thereby making the vibra-motoreven less effective in “picking up” these sounds. Some conso-nants and some vowels – such as “i” and “e” – have formantsclose to or higher than 2KHz, and are severely affected. Fig-ure 9 compares the spectrogram when just the vowel “a”was spoken – evidently, the vibra-motor is almost “deaf” tohigher frequencies.
Figure 9: The spectrogram of the spoken vowel ‘a’recorded with (a) microphone and (b)vibration mo-tor. The vibra-motor exhibits near-deafness for fre-quencies > 2KHz.
(3) Higher Energy ThresholdA microphone’s sensitivity, i.e., the voltage produced for agiven sound pressure level, heavily depends on the weightand stiffness of its diaphragm. The spring-mass arrangementof the vibra-motor is considerably more stiff, mainly due tothe heavier mass and high spring constant. While this isdesirable for a vibration actuator, it is unfavorable to soundsensing. Thus, using the actuator as a sensor yields lowsensitivity in general, and particularly to certain kinds oflow-energy consonants (like f, s, v, z), called fricatives [18].The effect is visible in Figure 7 (a,b) – the fricative consonant“s” goes almost undetected with vibra-motors.
(4) Low Signal-to-Noise Ratio (SNR)In any electrical circuit, thermal noise is an unavoidablephenomena arising from the Brownian motion of electronsin resistive components. Fortunately, the low 26 Ohm termi-nal resistance in vibra-motors leads to 10dB lower thermalnoise than the reference MEMS microphone. However, dueto low sensitivity, the strength of the vibra-signal is sig-nificantly lower, resulting in poor SNR across most of thespectrum. Figure 10 compares the SNR at different soundpressure levels – except around the resonance frequencies,the SNR of the vibra-signal is significantly less compared tothe microphone.
Sound Pressure Level (SPL) is a metric to measure theeffective pressure caused by sound waves with respect toa reference value, and is typically expressed in dBSPL [4].This gives a standard estimate of the sound field at the re-ceiver, irrespective of the location of the sound source.
5. SYSTEM DESIGNOur system design is modeled as a source-filter, i.e., we treatthe final output of the vibra-motor as a result of many fil-
Frequency (KHz) 0 5 10 15 20
SNR
(dB)
-10
0
10
20
30
4070 dB SPL65 dB SPL55 dB SPL
Frequency (KHz) 0 5 10 15 20
SNR
(dB)
-5
0
5
10
15
2070 dB SPL65 dB SPL55 dB SPL
Figure 10: The SNR of (a) the microphone and (b)the vibra-motor at various frequencies for varyingsound pressure levels (dB SPL). Note the unequalY axis range.
ters applied serially to the original air-flow from the lungs.Figure 11 illustrates this view, suggesting that an ideal solu-tion should perform two broad tasks: (1) “undo” the vibra-motor’s distortions for signal components that have been de-tected, and (2) reconstruct the undetected signals by lever-aging the predictable speech structure in conjunction withthe slight“signal hints”picked up by the vibra-motor. Vibra-Phone realizes these tasks through two corresponding mod-ules, namely, signal pre-processing and partial speech synthe-sis. We describe them next.
Voicedspeechsource
Unvoicedspeechsource
OR X X
Vocaltractresponse
Vibra7onmotorresponse
Originalspeech
Recordedspeech
Sourcesound
Figure 11: The source-filter model of the speech gen-eration and recording.
5.1 Signal Pre-processingAll of our algorithms operate on the frequency domain rep-resentation of the signal. Therefore, we first convert the am-plified signal to the time-frequency domain using the ShortTime Fourier Transform (STFT), which basically computesthe complex FFT coefficients from 100 millisecond segments(80% overlapped, Hanning windowed) of the input time sig-nal. The result is a 2D matrix that we call time-frequencysignal and illustrated in Figure 12 – each column is a timeslice and each row is a positive frequency bin. We will referto this matrix for various explanations.
Frequency Domain EqualizationWhen a microphone is subject to a Sine Sweep test, thefrequency response is typically flat, meaning that the mi-crophone responds almost uniformly to each frequency com-ponent. The vibra-motor’s response, on the other hand, isconsiderably jagged, and thereby induces distortions into thearriving signal. Figure 13 shows a case where the vowel “u”is recorded by both the microphone and vibra-motor. Thevibra-motor distortions on “u” are quite dramatic, alteringthe original formants at 266 and 600Hz to new formants at300Hz and 1.06KHz. In fact, the altered formants bear re-semblance to the vowel “aa” (as in “father”), and in reality,do sound like it. More generally, the vibra-motor’s frequency
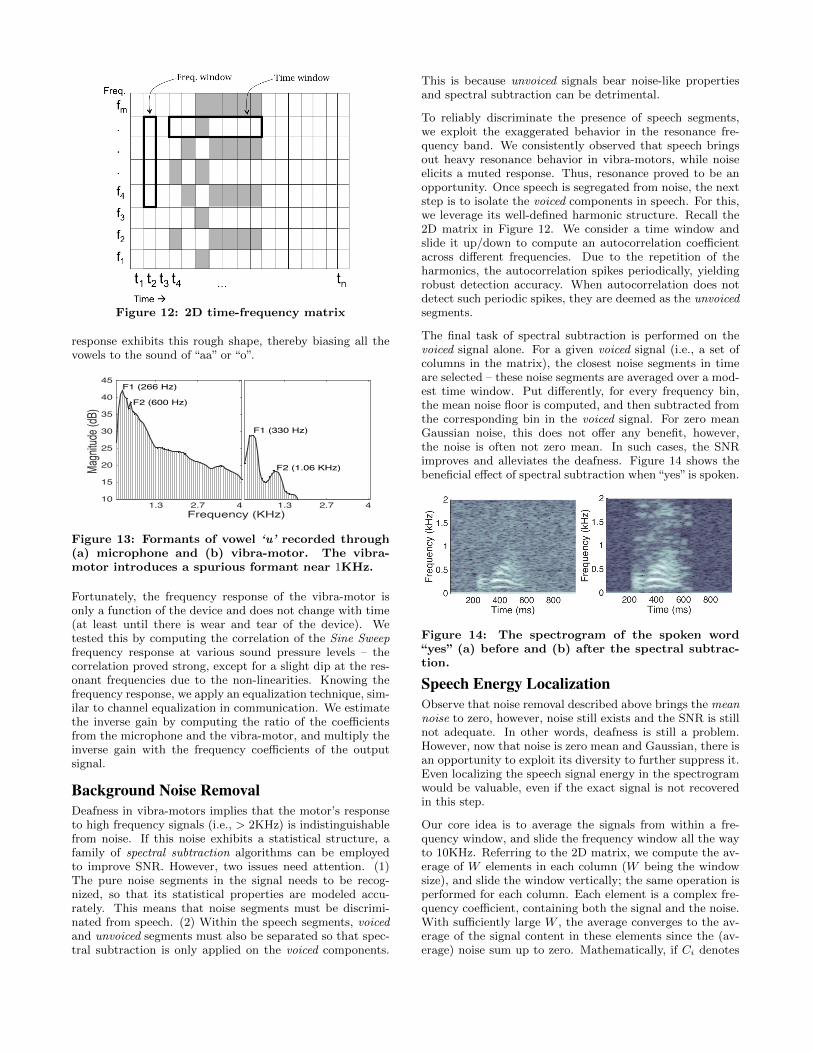
Figure 12: 2D time-frequency matrix
response exhibits this rough shape, thereby biasing all thevowels to the sound of “aa” or “o”.
Frequency (KHz) 1.3 2.7 4
Magn
itude
(dB)
10
15
20
25
30
35
40
45F1 (266 Hz)
F2 (600 Hz)
1.3 2.7 4
F1 (330 Hz)
F2 (1.06 KHz)
Figure 13: Formants of vowel ‘u’ recorded through(a) microphone and (b) vibra-motor. The vibra-motor introduces a spurious formant near 1KHz.
Fortunately, the frequency response of the vibra-motor isonly a function of the device and does not change with time(at least until there is wear and tear of the device). Wetested this by computing the correlation of the Sine Sweepfrequency response at various sound pressure levels – thecorrelation proved strong, except for a slight dip at the res-onant frequencies due to the non-linearities. Knowing thefrequency response, we apply an equalization technique, sim-ilar to channel equalization in communication. We estimatethe inverse gain by computing the ratio of the coefficientsfrom the microphone and the vibra-motor, and multiply theinverse gain with the frequency coefficients of the outputsignal.
Background Noise RemovalDeafness in vibra-motors implies that the motor’s responseto high frequency signals (i.e., > 2KHz) is indistinguishablefrom noise. If this noise exhibits a statistical structure, afamily of spectral subtraction algorithms can be employedto improve SNR. However, two issues need attention. (1)The pure noise segments in the signal needs to be recog-nized, so that its statistical properties are modeled accu-rately. This means that noise segments must be discrimi-nated from speech. (2) Within the speech segments, voicedand unvoiced segments must also be separated so that spec-tral subtraction is only applied on the voiced components.
This is because unvoiced signals bear noise-like propertiesand spectral subtraction can be detrimental.
To reliably discriminate the presence of speech segments,we exploit the exaggerated behavior in the resonance fre-quency band. We consistently observed that speech bringsout heavy resonance behavior in vibra-motors, while noiseelicits a muted response. Thus, resonance proved to be anopportunity. Once speech is segregated from noise, the nextstep is to isolate the voiced components in speech. For this,we leverage its well-defined harmonic structure. Recall the2D matrix in Figure 12. We consider a time window andslide it up/down to compute an autocorrelation coefficientacross different frequencies. Due to the repetition of theharmonics, the autocorrelation spikes periodically, yieldingrobust detection accuracy. When autocorrelation does notdetect such periodic spikes, they are deemed as the unvoicedsegments.
The final task of spectral subtraction is performed on thevoiced signal alone. For a given voiced signal (i.e., a set ofcolumns in the matrix), the closest noise segments in timeare selected – these noise segments are averaged over a mod-est time window. Put differently, for every frequency bin,the mean noise floor is computed, and then subtracted fromthe corresponding bin in the voiced signal. For zero meanGaussian noise, this does not offer any benefit, however,the noise is often not zero mean. In such cases, the SNRimproves and alleviates the deafness. Figure 14 shows thebeneficial effect of spectral subtraction when “yes” is spoken.
Figure 14: The spectrogram of the spoken word“yes” (a) before and (b) after the spectral subtrac-tion.
Speech Energy LocalizationObserve that noise removal described above brings the meannoise to zero, however, noise still exists and the SNR is stillnot adequate. In other words, deafness is still a problem.However, now that noise is zero mean and Gaussian, there isan opportunity to exploit its diversity to further suppress it.Even localizing the speech signal energy in the spectrogramwould be valuable, even if the exact signal is not recoveredin this step.
Our core idea is to average the signals from within a fre-quency window, and slide the frequency window all the wayto 10KHz. Referring to the 2D matrix, we compute the av-erage of W elements in each column (W being the windowsize), and slide the window vertically; the same operation isperformed for each column. Each element is a complex fre-quency coefficient, containing both the signal and the noise.With sufficiently large W , the average converges to the av-erage of the signal content in these elements since the (av-erage) noise sum up to zero. Mathematically, if Ci denotes
the signal at frequency fi, and Ci = Si + Ni, where Si isthe speech signal and Ni the noise, then the averaged C∗
i iscomputed as:
C∗i =
1
W
i+W2∑
f=i−W2
Ci =1
W
i+W2∑
f=i−W2
Si +1
W
i+W2∑
f=i−W2
Ni (1)
Since the term∑
Ni is zero mean Gaussian, it approacheszero for larger W , while the 1
W
∑Si term is simple smooth-
ing. For every frequency bin, we normalize the C∗i values
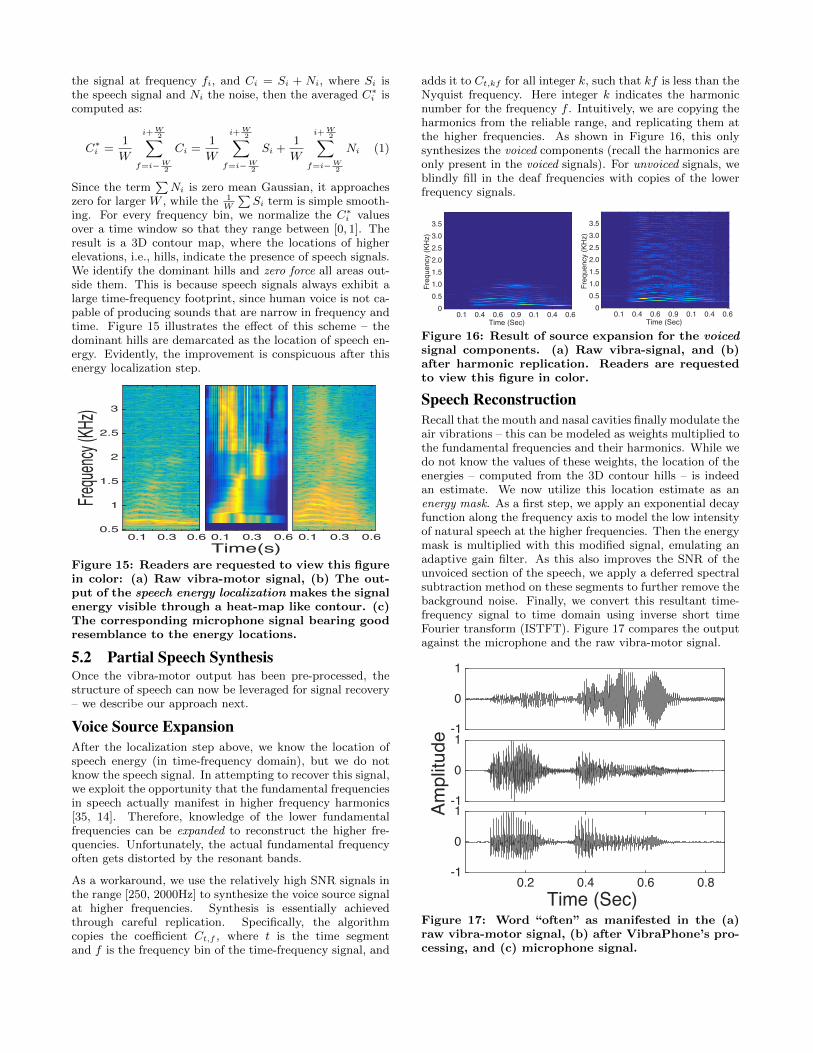
over a time window so that they range between [0, 1]. Theresult is a 3D contour map, where the locations of higherelevations, i.e., hills, indicate the presence of speech signals.We identify the dominant hills and zero force all areas out-side them. This is because speech signals always exhibit alarge time-frequency footprint, since human voice is not ca-pable of producing sounds that are narrow in frequency andtime. Figure 15 illustrates the effect of this scheme – thedominant hills are demarcated as the location of speech en-ergy. Evidently, the improvement is conspicuous after thisenergy localization step.
0.1 0.3 0.6
Freque
ncy (K
Hz) 3
2.5
2
1.5
1
0.5
Time(s)0.1 0.3 0.6 0.1 0.3 0.6
Figure 15: Readers are requested to view this figurein color: (a) Raw vibra-motor signal, (b) The out-put of the speech energy localization makes the signalenergy visible through a heat-map like contour. (c)The corresponding microphone signal bearing goodresemblance to the energy locations.
5.2 Partial Speech SynthesisOnce the vibra-motor output has been pre-processed, thestructure of speech can now be leveraged for signal recovery– we describe our approach next.
Voice Source ExpansionAfter the localization step above, we know the location ofspeech energy (in time-frequency domain), but we do notknow the speech signal. In attempting to recover this signal,we exploit the opportunity that the fundamental frequenciesin speech actually manifest in higher frequency harmonics[35, 14]. Therefore, knowledge of the lower fundamentalfrequencies can be expanded to reconstruct the higher fre-quencies. Unfortunately, the actual fundamental frequencyoften gets distorted by the resonant bands.
As a workaround, we use the relatively high SNR signals inthe range [250, 2000Hz] to synthesize the voice source signalat higher frequencies. Synthesis is essentially achievedthrough careful replication. Specifically, the algorithmcopies the coefficient Ct,f , where t is the time segmentand f is the frequency bin of the time-frequency signal, and
adds it to Ct,kf for all integer k, such that kf is less than theNyquist frequency. Here integer k indicates the harmonicnumber for the frequency f . Intuitively, we are copying theharmonics from the reliable range, and replicating them atthe higher frequencies. As shown in Figure 16, this onlysynthesizes the voiced components (recall the harmonics areonly present in the voiced signals). For unvoiced signals, weblindly fill in the deaf frequencies with copies of the lowerfrequency signals.
Time (Sec) 0.1 0.4 0.6 0.9 0.1 0.4 0.6
Freq
uenc
y (K
Hz)
3.53.02.52.01.51.00.5
0
Time (Sec) 0.1 0.4 0.6 0.9 0.1 0.4 0.6
Freq
uenc
y (K
Hz)
3.53.02.52.01.51.00.5
0
Figure 16: Result of source expansion for the voicedsignal components. (a) Raw vibra-signal, and (b)after harmonic replication. Readers are requestedto view this figure in color.
Speech ReconstructionRecall that the mouth and nasal cavities finally modulate theair vibrations – this can be modeled as weights multiplied tothe fundamental frequencies and their harmonics. While wedo not know the values of these weights, the location of theenergies – computed from the 3D contour hills – is indeedan estimate. We now utilize this location estimate as anenergy mask. As a first step, we apply an exponential decayfunction along the frequency axis to model the low intensityof natural speech at the higher frequencies. Then the energymask is multiplied with this modified signal, emulating anadaptive gain filter. As this also improves the SNR of theunvoiced section of the speech, we apply a deferred spectralsubtraction method on these segments to further remove thebackground noise. Finally, we convert this resultant time-frequency signal to time domain using inverse short timeFourier transform (ISTFT). Figure 17 compares the outputagainst the microphone and the raw vibra-motor signal.
-1
0
1
Ampl
itude
-1
0
1
Time (Sec) 0.2 0.4 0.6 0.8
-1
0
1
Figure 17: Word “often” as manifested in the (a)raw vibra-motor signal, (b) after VibraPhone’s pro-cessing, and (c) microphone signal.
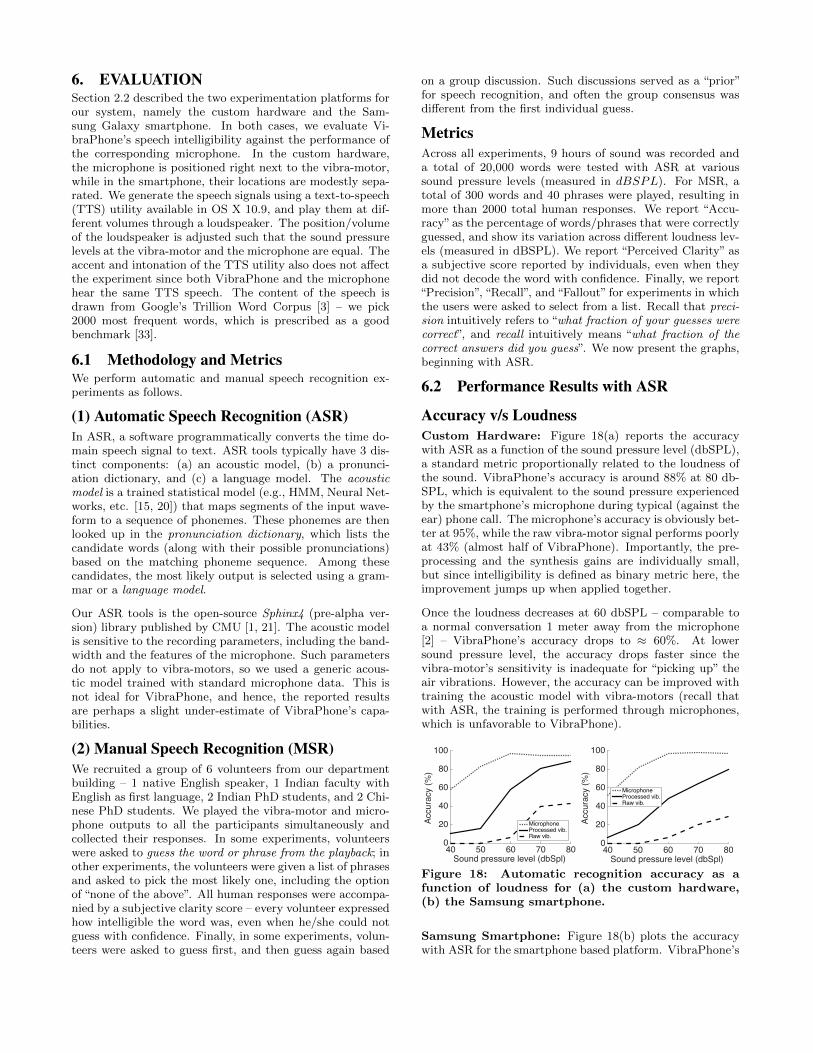
6. EVALUATIONSection 2.2 described the two experimentation platforms forour system, namely the custom hardware and the Sam-sung Galaxy smartphone. In both cases, we evaluate Vi-braPhone’s speech intelligibility against the performance ofthe corresponding microphone. In the custom hardware,the microphone is positioned right next to the vibra-motor,while in the smartphone, their locations are modestly sepa-rated. We generate the speech signals using a text-to-speech(TTS) utility available in OS X 10.9, and play them at dif-ferent volumes through a loudspeaker. The position/volumeof the loudspeaker is adjusted such that the sound pressurelevels at the vibra-motor and the microphone are equal. Theaccent and intonation of the TTS utility also does not affectthe experiment since both VibraPhone and the microphonehear the same TTS speech. The content of the speech isdrawn from Google’s Trillion Word Corpus [3] – we pick2000 most frequent words, which is prescribed as a goodbenchmark [33].
6.1 Methodology and MetricsWe perform automatic and manual speech recognition ex-periments as follows.
(1) Automatic Speech Recognition (ASR)In ASR, a software programmatically converts the time do-main speech signal to text. ASR tools typically have 3 dis-tinct components: (a) an acoustic model, (b) a pronunci-ation dictionary, and (c) a language model. The acousticmodel is a trained statistical model (e.g., HMM, Neural Net-works, etc. [15, 20]) that maps segments of the input wave-form to a sequence of phonemes. These phonemes are thenlooked up in the pronunciation dictionary, which lists thecandidate words (along with their possible pronunciations)based on the matching phoneme sequence. Among thesecandidates, the most likely output is selected using a gram-mar or a language model.
Our ASR tools is the open-source Sphinx4 (pre-alpha ver-sion) library published by CMU [1, 21]. The acoustic modelis sensitive to the recording parameters, including the band-width and the features of the microphone. Such parametersdo not apply to vibra-motors, so we used a generic acous-tic model trained with standard microphone data. This isnot ideal for VibraPhone, and hence, the reported resultsare perhaps a slight under-estimate of VibraPhone’s capa-bilities.
(2) Manual Speech Recognition (MSR)We recruited a group of 6 volunteers from our departmentbuilding – 1 native English speaker, 1 Indian faculty withEnglish as first language, 2 Indian PhD students, and 2 Chi-nese PhD students. We played the vibra-motor and micro-phone outputs to all the participants simultaneously andcollected their responses. In some experiments, volunteerswere asked to guess the word or phrase from the playback; inother experiments, the volunteers were given a list of phrasesand asked to pick the most likely one, including the optionof “none of the above”. All human responses were accompa-nied by a subjective clarity score – every volunteer expressedhow intelligible the word was, even when he/she could notguess with confidence. Finally, in some experiments, volun-teers were asked to guess first, and then guess again based
on a group discussion. Such discussions served as a “prior”for speech recognition, and often the group consensus wasdifferent from the first individual guess.
MetricsAcross all experiments, 9 hours of sound was recorded anda total of 20,000 words were tested with ASR at varioussound pressure levels (measured in dBSPL). For MSR, atotal of 300 words and 40 phrases were played, resulting inmore than 2000 total human responses. We report “Accu-racy”as the percentage of words/phrases that were correctlyguessed, and show its variation across different loudness lev-els (measured in dBSPL). We report “Perceived Clarity” asa subjective score reported by individuals, even when theydid not decode the word with confidence. Finally, we report“Precision”, “Recall”, and “Fallout” for experiments in whichthe users were asked to select from a list. Recall that preci-sion intuitively refers to “what fraction of your guesses werecorrect”, and recall intuitively means “what fraction of thecorrect answers did you guess”. We now present the graphs,beginning with ASR.
6.2 Performance Results with ASR
Accuracy v/s LoudnessCustom Hardware: Figure 18(a) reports the accuracywith ASR as a function of the sound pressure level (dbSPL),a standard metric proportionally related to the loudness ofthe sound. VibraPhone’s accuracy is around 88% at 80 db-SPL, which is equivalent to the sound pressure experiencedby the smartphone’s microphone during typical (against theear) phone call. The microphone’s accuracy is obviously bet-ter at 95%, while the raw vibra-motor signal performs poorlyat 43% (almost half of VibraPhone). Importantly, the pre-processing and the synthesis gains are individually small,but since intelligibility is defined as binary metric here, theimprovement jumps up when applied together.
Once the loudness decreases at 60 dbSPL – comparable toa normal conversation 1 meter away from the microphone[2] – VibraPhone’s accuracy drops to ≈ 60%. At lowersound pressure level, the accuracy drops faster since thevibra-motor’s sensitivity is inadequate for “picking up” theair vibrations. However, the accuracy can be improved withtraining the acoustic model with vibra-motors (recall thatwith ASR, the training is performed through microphones,which is unfavorable to VibraPhone).
Sound pressure level (dbSpl) 40 50 60 70 80
Accu
racy
(%)
0
20
40
60
80
100
MicrophoneProcessed vib.Raw vib.
Sound pressure level (dbSpl) 40 50 60 70 80
Accu
racy
(%)
0
20
40
60
80
100
MicrophoneProcessed vib.Raw vib.
Figure 18: Automatic recognition accuracy as afunction of loudness for (a) the custom hardware,(b) the Samsung smartphone.
Samsung Smartphone: Figure 18(b) plots the accuracywith ASR for the smartphone based platform. VibraPhone’s
performance is weaker compared to the custom hardwaresetup, although the difference is marginal – ASR outputis still at 80% at 80 dbSPL. Admittedly, we are not exactlysure of the reason for this difference – we conjecture that thesmartphone signal processing pipeline may not be exactlytuned to the vibra-motor like we have done in the customcase.
Rank of the WordsThe accuracy results above counts only perfect matches be-tween ASR’s output and the actual spoken word. In certainapplications, a list of possible words may also be useful, par-ticularly when the quality of the speech is poor. We recordthe list of all predictions from ASR for each spoken word,played at 50 dbSPL. Figure 19 plots the CDF of the rank ofthe correct word in this list. At this relatively softer 50 db-SPL experiment, only ≈ 20% of the words are ranked at 1,implying exact match. In 41% of the cases, the words werewithin top-5 of the list, and top-10 presents a 58% accuracy.
Word rank0 10 20 30 40
CD
F
0
0.2
0.4
0.6
0.8
1
MicrophoneProcessed vib.Raw vib.
Figure 19: The CDF of word rank from ASR’s pre-diction at 50 dbSPL for custom hardware.
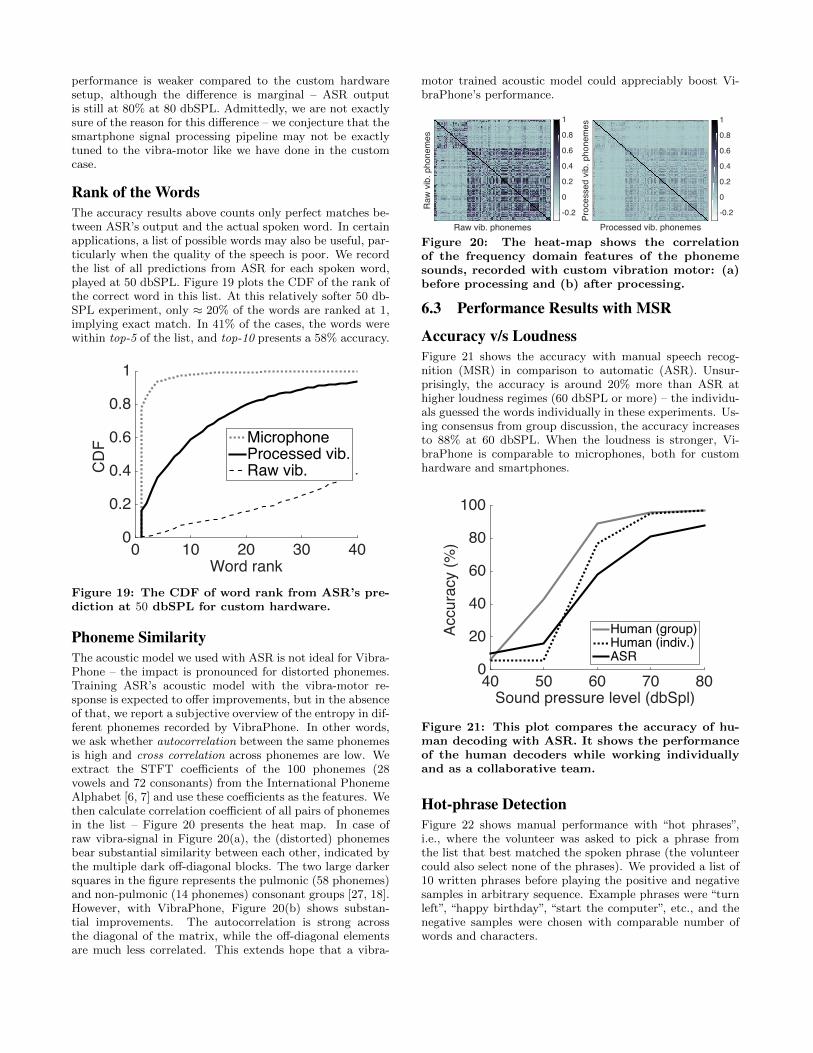
Phoneme SimilarityThe acoustic model we used with ASR is not ideal for Vibra-Phone – the impact is pronounced for distorted phonemes.Training ASR’s acoustic model with the vibra-motor re-sponse is expected to offer improvements, but in the absenceof that, we report a subjective overview of the entropy in dif-ferent phonemes recorded by VibraPhone. In other words,we ask whether autocorrelation between the same phonemesis high and cross correlation across phonemes are low. Weextract the STFT coefficients of the 100 phonemes (28vowels and 72 consonants) from the International PhonemeAlphabet [6, 7] and use these coefficients as the features. Wethen calculate correlation coefficient of all pairs of phonemesin the list – Figure 20 presents the heat map. In case ofraw vibra-signal in Figure 20(a), the (distorted) phonemesbear substantial similarity between each other, indicated bythe multiple dark off-diagonal blocks. The two large darkersquares in the figure represents the pulmonic (58 phonemes)and non-pulmonic (14 phonemes) consonant groups [27, 18].However, with VibraPhone, Figure 20(b) shows substan-tial improvements. The autocorrelation is strong acrossthe diagonal of the matrix, while the off-diagonal elementsare much less correlated. This extends hope that a vibra-
motor trained acoustic model could appreciably boost Vi-braPhone’s performance.
Raw vib. phonemes
Raw
vib
. pho
nem
es
-0.2
0
0.2
0.4
0.6
0.8
1
Processed vib. phonemes
Proc
esse
d vi
b. p
hone
mes
-0.2
0
0.2
0.4
0.6
0.8
1
Figure 20: The heat-map shows the correlationof the frequency domain features of the phonemesounds, recorded with custom vibration motor: (a)before processing and (b) after processing.
6.3 Performance Results with MSR
Accuracy v/s LoudnessFigure 21 shows the accuracy with manual speech recog-nition (MSR) in comparison to automatic (ASR). Unsur-prisingly, the accuracy is around 20% more than ASR athigher loudness regimes (60 dbSPL or more) – the individu-als guessed the words individually in these experiments. Us-ing consensus from group discussion, the accuracy increasesto 88% at 60 dbSPL. When the loudness is stronger, Vi-braPhone is comparable to microphones, both for customhardware and smartphones.
Sound pressure level (dbSpl) 40 50 60 70 80
Accu
racy
(%)
0
20
40
60
80
100
Human (group)Human (indiv.)ASR
Figure 21: This plot compares the accuracy of hu-man decoding with ASR. It shows the performanceof the human decoders while working individuallyand as a collaborative team.
Hot-phrase DetectionFigure 22 shows manual performance with “hot phrases”,i.e., where the volunteer was asked to pick a phrase fromthe list that best matched the spoken phrase (the volunteercould also select none of the phrases). We provided a list of10 written phrases before playing the positive and negativesamples in arbitrary sequence. Example phrases were “turnleft”, “happy birthday”, “start the computer”, etc., and thenegative samples were chosen with comparable number ofwords and characters.
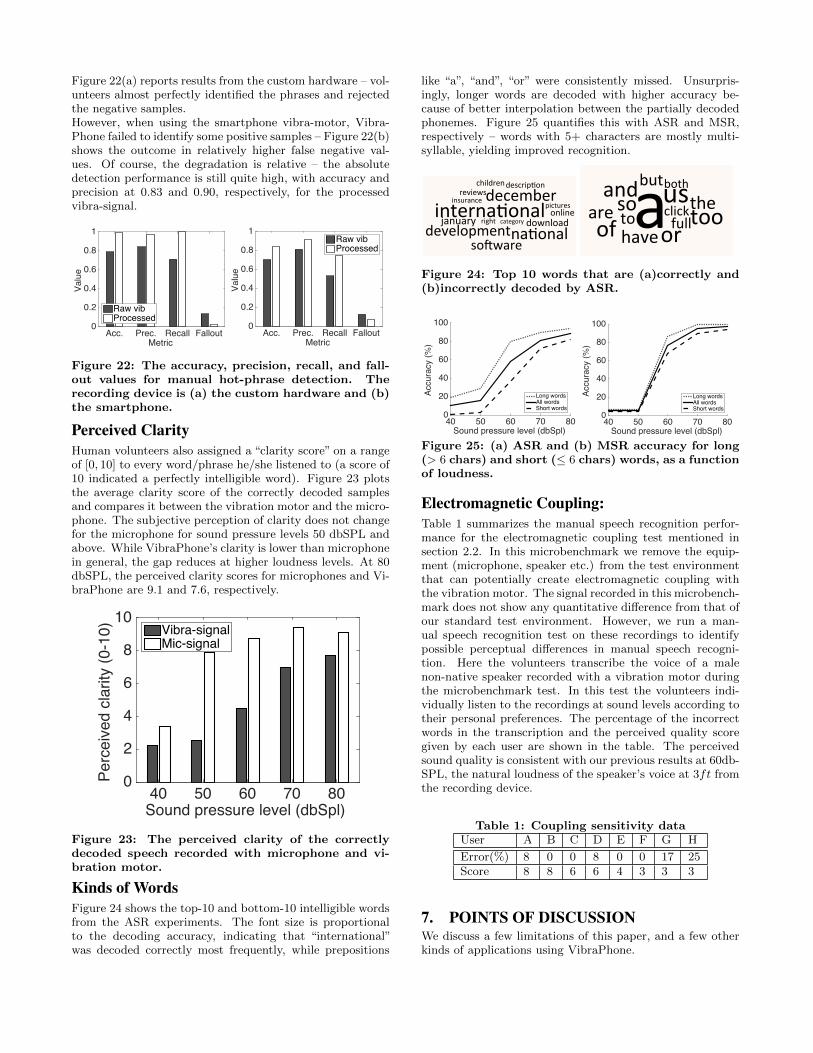
Figure 22(a) reports results from the custom hardware – vol-unteers almost perfectly identified the phrases and rejectedthe negative samples.However, when using the smartphone vibra-motor, Vibra-Phone failed to identify some positive samples – Figure 22(b)shows the outcome in relatively higher false negative val-ues. Of course, the degradation is relative – the absolutedetection performance is still quite high, with accuracy andprecision at 0.83 and 0.90, respectively, for the processedvibra-signal.
Metric Acc. Prec. Recall Fallout
Valu
e
0
0.2
0.4
0.6
0.8
1
Raw vibProcessed
Metric Acc. Prec. Recall Fallout
Valu
e
0
0.2
0.4
0.6
0.8
1Raw vibProcessed
Figure 22: The accuracy, precision, recall, and fall-out values for manual hot-phrase detection. Therecording device is (a) the custom hardware and (b)the smartphone.
Perceived ClarityHuman volunteers also assigned a “clarity score” on a rangeof [0, 10] to every word/phrase he/she listened to (a score of10 indicated a perfectly intelligible word). Figure 23 plotsthe average clarity score of the correctly decoded samplesand compares it between the vibration motor and the micro-phone. The subjective perception of clarity does not changefor the microphone for sound pressure levels 50 dbSPL andabove. While VibraPhone’s clarity is lower than microphonein general, the gap reduces at higher loudness levels. At 80dbSPL, the perceived clarity scores for microphones and Vi-braPhone are 9.1 and 7.6, respectively.
Sound pressure level (dbSpl) 40 50 60 70 80
Perc
eive
d cl
arity
(0-1
0)
0
2
4
6
8
10Vibra-signalMic-signal
Figure 23: The perceived clarity of the correctlydecoded speech recorded with microphone and vi-bration motor.
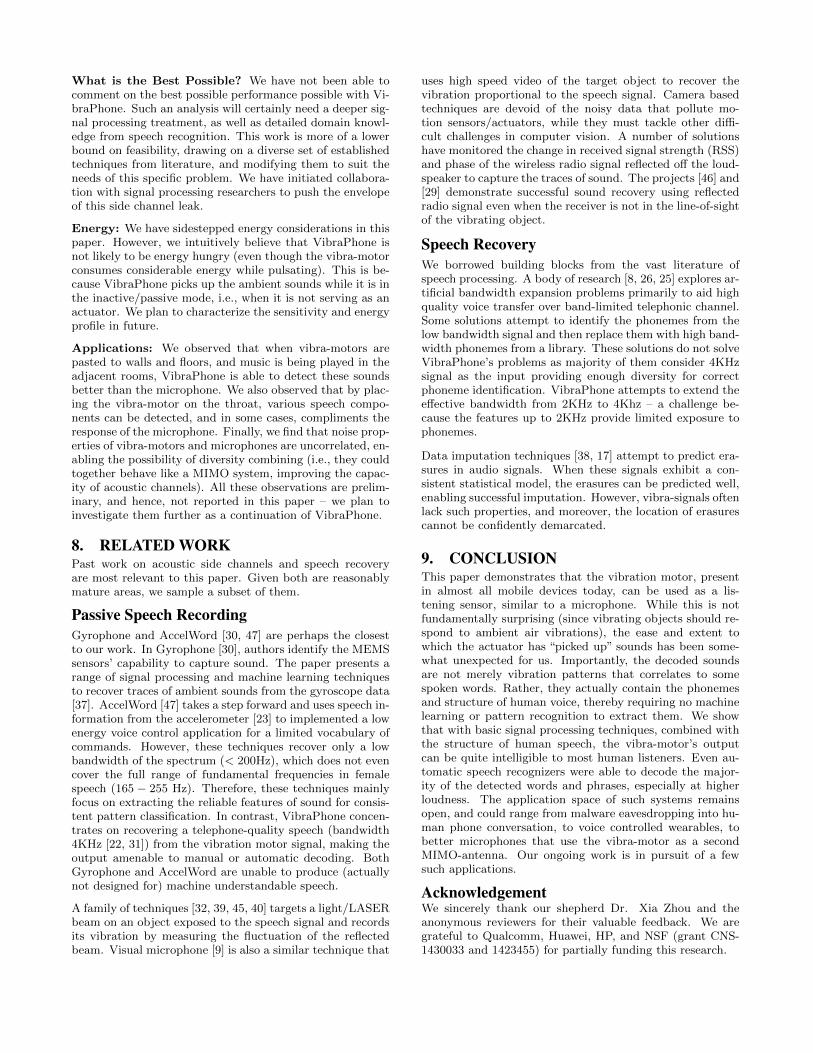
Kinds of WordsFigure 24 shows the top-10 and bottom-10 intelligible wordsfrom the ASR experiments. The font size is proportionalto the decoding accuracy, indicating that “international”was decoded correctly most frequently, while prepositions
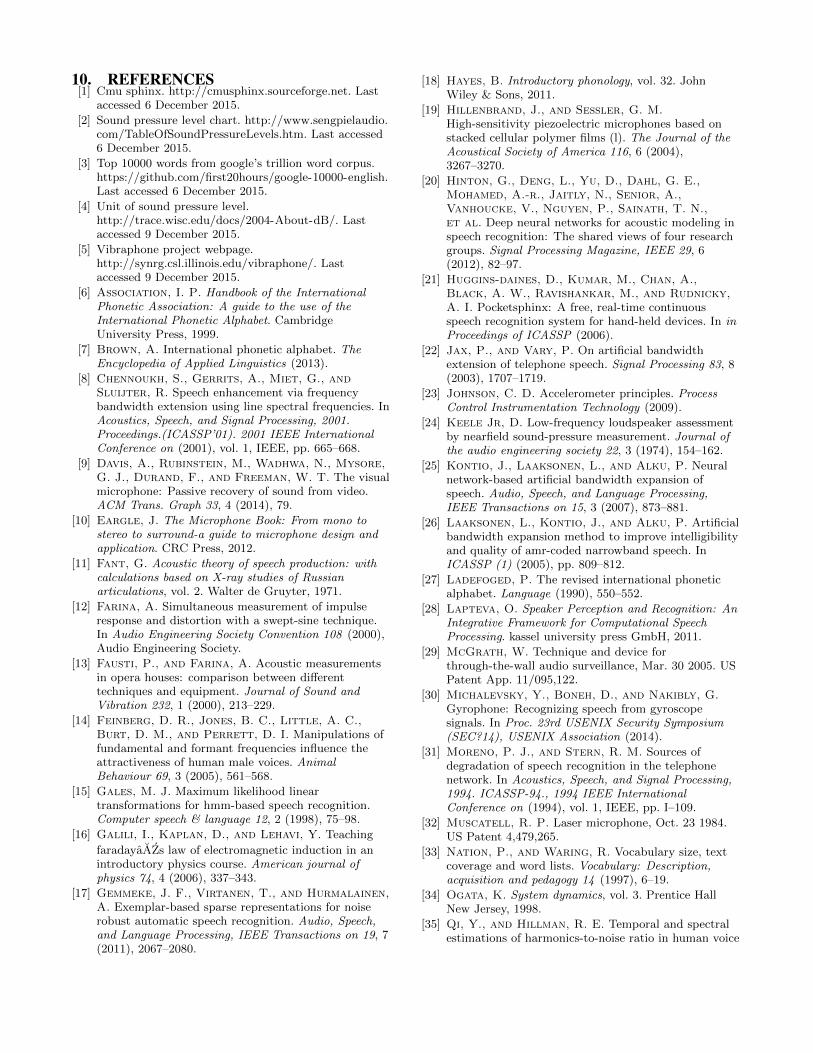
like “a”, “and”, “or” were consistently missed. Unsurpris-ingly, longer words are decoded with higher accuracy be-cause of better interpolation between the partially decodedphonemes. Figure 25 quantifies this with ASR and MSR,respectively – words with 5+ characters are mostly multi-syllable, yielding improved recognition.
interna3onaldevelopmentna3onal
descrip3on
insurance decembercategoryright download
so9ware
januarypictures
childrenreviews
onlinethe
of
andaarehaveto
butso click
full
usboth
ortoo
Figure 24: Top 10 words that are (a)correctly and(b)incorrectly decoded by ASR.
Sound pressure level (dbSpl) 40 50 60 70 80
Accu
racy
(%)
0
20
40
60
80
100
Long wordsAll wordsShort words
Sound pressure level (dbSpl) 40 50 60 70 80
Accu
racy
(%)
0
20
40
60
80
100
Long wordsAll wordsShort words
Figure 25: (a) ASR and (b) MSR accuracy for long(> 6 chars) and short (≤ 6 chars) words, as a functionof loudness.
Electromagnetic Coupling:Table 1 summarizes the manual speech recognition perfor-mance for the electromagnetic coupling test mentioned insection 2.2. In this microbenchmark we remove the equip-ment (microphone, speaker etc.) from the test environmentthat can potentially create electromagnetic coupling withthe vibration motor. The signal recorded in this microbench-mark does not show any quantitative difference from that ofour standard test environment. However, we run a man-ual speech recognition test on these recordings to identifypossible perceptual differences in manual speech recogni-tion. Here the volunteers transcribe the voice of a malenon-native speaker recorded with a vibration motor duringthe microbenchmark test. In this test the volunteers indi-vidually listen to the recordings at sound levels according totheir personal preferences. The percentage of the incorrectwords in the transcription and the perceived quality scoregiven by each user are shown in the table. The perceivedsound quality is consistent with our previous results at 60db-SPL, the natural loudness of the speaker’s voice at 3ft fromthe recording device.
Table 1: Coupling sensitivity dataUser A B C D E F G H
Error(%) 8 0 0 8 0 0 17 25Score 8 8 6 6 4 3 3 3
7. POINTS OF DISCUSSIONWe discuss a few limitations of this paper, and a few otherkinds of applications using VibraPhone.
What is the Best Possible? We have not been able tocomment on the best possible performance possible with Vi-braPhone. Such an analysis will certainly need a deeper sig-nal processing treatment, as well as detailed domain knowl-edge from speech recognition. This work is more of a lowerbound on feasibility, drawing on a diverse set of establishedtechniques from literature, and modifying them to suit theneeds of this specific problem. We have initiated collabora-tion with signal processing researchers to push the envelopeof this side channel leak.
Energy: We have sidestepped energy considerations in thispaper. However, we intuitively believe that VibraPhone isnot likely to be energy hungry (even though the vibra-motorconsumes considerable energy while pulsating). This is be-cause VibraPhone picks up the ambient sounds while it is inthe inactive/passive mode, i.e., when it is not serving as anactuator. We plan to characterize the sensitivity and energyprofile in future.
Applications: We observed that when vibra-motors arepasted to walls and floors, and music is being played in theadjacent rooms, VibraPhone is able to detect these soundsbetter than the microphone. We also observed that by plac-ing the vibra-motor on the throat, various speech compo-nents can be detected, and in some cases, compliments theresponse of the microphone. Finally, we find that noise prop-erties of vibra-motors and microphones are uncorrelated, en-abling the possibility of diversity combining (i.e., they couldtogether behave like a MIMO system, improving the capac-ity of acoustic channels). All these observations are prelim-inary, and hence, not reported in this paper – we plan toinvestigate them further as a continuation of VibraPhone.
8. RELATED WORKPast work on acoustic side channels and speech recoveryare most relevant to this paper. Given both are reasonablymature areas, we sample a subset of them.
Passive Speech RecordingGyrophone and AccelWord [30, 47] are perhaps the closestto our work. In Gyrophone [30], authors identify the MEMSsensors’ capability to capture sound. The paper presents arange of signal processing and machine learning techniquesto recover traces of ambient sounds from the gyroscope data[37]. AccelWord [47] takes a step forward and uses speech in-formation from the accelerometer [23] to implemented a lowenergy voice control application for a limited vocabulary ofcommands. However, these techniques recover only a lowbandwidth of the spectrum (< 200Hz), which does not evencover the full range of fundamental frequencies in femalespeech (165 − 255 Hz). Therefore, these techniques mainlyfocus on extracting the reliable features of sound for consis-tent pattern classification. In contrast, VibraPhone concen-trates on recovering a telephone-quality speech (bandwidth4KHz [22, 31]) from the vibration motor signal, making theoutput amenable to manual or automatic decoding. BothGyrophone and AccelWord are unable to produce (actuallynot designed for) machine understandable speech.
A family of techniques [32, 39, 45, 40] targets a light/LASERbeam on an object exposed to the speech signal and recordsits vibration by measuring the fluctuation of the reflectedbeam. Visual microphone [9] is also a similar technique that
uses high speed video of the target object to recover thevibration proportional to the speech signal. Camera basedtechniques are devoid of the noisy data that pollute mo-tion sensors/actuators, while they must tackle other diffi-cult challenges in computer vision. A number of solutionshave monitored the change in received signal strength (RSS)and phase of the wireless radio signal reflected off the loud-speaker to capture the traces of sound. The projects [46] and[29] demonstrate successful sound recovery using reflectedradio signal even when the receiver is not in the line-of-sightof the vibrating object.
Speech RecoveryWe borrowed building blocks from the vast literature ofspeech processing. A body of research [8, 26, 25] explores ar-tificial bandwidth expansion problems primarily to aid highquality voice transfer over band-limited telephonic channel.Some solutions attempt to identify the phonemes from thelow bandwidth signal and then replace them with high band-width phonemes from a library. These solutions do not solveVibraPhone’s problems as majority of them consider 4KHzsignal as the input providing enough diversity for correctphoneme identification. VibraPhone attempts to extend theeffective bandwidth from 2KHz to 4Khz – a challenge be-cause the features up to 2KHz provide limited exposure tophonemes.
Data imputation techniques [38, 17] attempt to predict era-sures in audio signals. When these signals exhibit a con-sistent statistical model, the erasures can be predicted well,enabling successful imputation. However, vibra-signals oftenlack such properties, and moreover, the location of erasurescannot be confidently demarcated.
9. CONCLUSIONThis paper demonstrates that the vibration motor, presentin almost all mobile devices today, can be used as a lis-tening sensor, similar to a microphone. While this is notfundamentally surprising (since vibrating objects should re-spond to ambient air vibrations), the ease and extent towhich the actuator has “picked up” sounds has been some-what unexpected for us. Importantly, the decoded soundsare not merely vibration patterns that correlates to somespoken words. Rather, they actually contain the phonemesand structure of human voice, thereby requiring no machinelearning or pattern recognition to extract them. We showthat with basic signal processing techniques, combined withthe structure of human speech, the vibra-motor’s outputcan be quite intelligible to most human listeners. Even au-tomatic speech recognizers were able to decode the major-ity of the detected words and phrases, especially at higherloudness. The application space of such systems remainsopen, and could range from malware eavesdropping into hu-man phone conversation, to voice controlled wearables, tobetter microphones that use the vibra-motor as a secondMIMO-antenna. Our ongoing work is in pursuit of a fewsuch applications.
AcknowledgementWe sincerely thank our shepherd Dr. Xia Zhou and theanonymous reviewers for their valuable feedback. We aregrateful to Qualcomm, Huawei, HP, and NSF (grant CNS-1430033 and 1423455) for partially funding this research.
10. REFERENCES[1] Cmu sphinx. http://cmusphinx.sourceforge.net. Last
accessed 6 December 2015.
[2] Sound pressure level chart. http://www.sengpielaudio.com/TableOfSoundPressureLevels.htm. Last accessed6 December 2015.
[3] Top 10000 words from google’s trillion word corpus.https://github.com/first20hours/google-10000-english.Last accessed 6 December 2015.
[4] Unit of sound pressure level.http://trace.wisc.edu/docs/2004-About-dB/. Lastaccessed 9 December 2015.
[5] Vibraphone project webpage.http://synrg.csl.illinois.edu/vibraphone/. Lastaccessed 9 December 2015.
[6] Association, I. P. Handbook of the InternationalPhonetic Association: A guide to the use of theInternational Phonetic Alphabet. CambridgeUniversity Press, 1999.
[7] Brown, A. International phonetic alphabet. TheEncyclopedia of Applied Linguistics (2013).
[8] Chennoukh, S., Gerrits, A., Miet, G., andSluijter, R. Speech enhancement via frequencybandwidth extension using line spectral frequencies. InAcoustics, Speech, and Signal Processing, 2001.Proceedings.(ICASSP’01). 2001 IEEE InternationalConference on (2001), vol. 1, IEEE, pp. 665–668.
[9] Davis, A., Rubinstein, M., Wadhwa, N., Mysore,G. J., Durand, F., and Freeman, W. T. The visualmicrophone: Passive recovery of sound from video.ACM Trans. Graph 33, 4 (2014), 79.
[10] Eargle, J. The Microphone Book: From mono tostereo to surround-a guide to microphone design andapplication. CRC Press, 2012.
[11] Fant, G. Acoustic theory of speech production: withcalculations based on X-ray studies of Russianarticulations, vol. 2. Walter de Gruyter, 1971.
[12] Farina, A. Simultaneous measurement of impulseresponse and distortion with a swept-sine technique.In Audio Engineering Society Convention 108 (2000),Audio Engineering Society.
[13] Fausti, P., and Farina, A. Acoustic measurementsin opera houses: comparison between differenttechniques and equipment. Journal of Sound andVibration 232, 1 (2000), 213–229.
[14] Feinberg, D. R., Jones, B. C., Little, A. C.,Burt, D. M., and Perrett, D. I. Manipulations offundamental and formant frequencies influence theattractiveness of human male voices. AnimalBehaviour 69, 3 (2005), 561–568.
[15] Gales, M. J. Maximum likelihood lineartransformations for hmm-based speech recognition.Computer speech & language 12, 2 (1998), 75–98.
[16] Galili, I., Kaplan, D., and Lehavi, Y. Teaching
faradayaAZs law of electromagnetic induction in anintroductory physics course. American journal ofphysics 74, 4 (2006), 337–343.
[17] Gemmeke, J. F., Virtanen, T., and Hurmalainen,A. Exemplar-based sparse representations for noiserobust automatic speech recognition. Audio, Speech,and Language Processing, IEEE Transactions on 19, 7(2011), 2067–2080.
[18] Hayes, B. Introductory phonology, vol. 32. JohnWiley & Sons, 2011.
[19] Hillenbrand, J., and Sessler, G. M.High-sensitivity piezoelectric microphones based onstacked cellular polymer films (l). The Journal of theAcoustical Society of America 116, 6 (2004),3267–3270.
[20] Hinton, G., Deng, L., Yu, D., Dahl, G. E.,Mohamed, A.-r., Jaitly, N., Senior, A.,Vanhoucke, V., Nguyen, P., Sainath, T. N.,et al. Deep neural networks for acoustic modeling inspeech recognition: The shared views of four researchgroups. Signal Processing Magazine, IEEE 29, 6(2012), 82–97.
[21] Huggins-daines, D., Kumar, M., Chan, A.,Black, A. W., Ravishankar, M., and Rudnicky,A. I. Pocketsphinx: A free, real-time continuousspeech recognition system for hand-held devices. In inProceedings of ICASSP (2006).
[22] Jax, P., and Vary, P. On artificial bandwidthextension of telephone speech. Signal Processing 83, 8(2003), 1707–1719.
[23] Johnson, C. D. Accelerometer principles. ProcessControl Instrumentation Technology (2009).
[24] Keele Jr, D. Low-frequency loudspeaker assessmentby nearfield sound-pressure measurement. Journal ofthe audio engineering society 22, 3 (1974), 154–162.
[25] Kontio, J., Laaksonen, L., and Alku, P. Neuralnetwork-based artificial bandwidth expansion ofspeech. Audio, Speech, and Language Processing,IEEE Transactions on 15, 3 (2007), 873–881.
[26] Laaksonen, L., Kontio, J., and Alku, P. Artificialbandwidth expansion method to improve intelligibilityand quality of amr-coded narrowband speech. InICASSP (1) (2005), pp. 809–812.
[27] Ladefoged, P. The revised international phoneticalphabet. Language (1990), 550–552.
[28] Lapteva, O. Speaker Perception and Recognition: AnIntegrative Framework for Computational SpeechProcessing. kassel university press GmbH, 2011.
[29] McGrath, W. Technique and device forthrough-the-wall audio surveillance, Mar. 30 2005. USPatent App. 11/095,122.
[30] Michalevsky, Y., Boneh, D., and Nakibly, G.Gyrophone: Recognizing speech from gyroscopesignals. In Proc. 23rd USENIX Security Symposium(SEC?14), USENIX Association (2014).
[31] Moreno, P. J., and Stern, R. M. Sources ofdegradation of speech recognition in the telephonenetwork. In Acoustics, Speech, and Signal Processing,1994. ICASSP-94., 1994 IEEE InternationalConference on (1994), vol. 1, IEEE, pp. I–109.
[32] Muscatell, R. P. Laser microphone, Oct. 23 1984.US Patent 4,479,265.
[33] Nation, P., and Waring, R. Vocabulary size, textcoverage and word lists. Vocabulary: Description,acquisition and pedagogy 14 (1997), 6–19.
[34] Ogata, K. System dynamics, vol. 3. Prentice HallNew Jersey, 1998.
[35] Qi, Y., and Hillman, R. E. Temporal and spectralestimations of harmonics-to-noise ratio in human voice
signals. The Journal of the Acoustical Society ofAmerica 102, 1 (1997), 537–543.
[36] Roy, N., Gowda, M., and Choudhury, R. R.Ripple: Communicating through physical vibration.
[37] Scarborough, J. B. The Gyroscope: Theory andApplication. Interscience Pub., 1958.
[38] Smaragdis, P., Raj, B., and Shashanka, M.Missing data imputation for spectral audio signals. InMachine Learning for Signal Processing, 2009. MLSP2009. IEEE International Workshop on (2009), IEEE,pp. 1–6.
[39] Smeets, G. Laser interference microphone forultrasonics and nonlinear acoustics. The Journal of theAcoustical Society of America 61, 3 (1977), 872–875.
[40] Speciale, J. R. Pulsed laser microphone, Oct. 92001. US Patent 6,301,034.
[41] Tanner, P., Loebach, J., Cook, J., and Hallen,H. A pulsed jumping ring apparatus fordemonstration of lenzaAZs law. American Journal ofPhysics 69, 8 (2001), 911–916.
[42] Taylor, B. Guide for the Use of the InternationalSystem of Units (SI): The Metric System. DIANEPublishing, 1995.
[43] Titze, I. R. Principles of voice production. NationalCenter for Voice and Speech, 2000.
[44] Waibel, A., Hanazawa, T., Hinton, G., Shikano,K., and Lang, K. J. Phoneme recognition usingtime-delay neural networks. Acoustics, Speech andSignal Processing, IEEE Transactions on 37, 3 (1989),328–339.
[45] Wang, C.-C., Trivedi, S., Jin, F., Swaminathan,V., Rodriguez, P., and Prasad, N. S. Highsensitivity pulsed laser vibrometer and its applicationas a laser microphone. Applied Physics Letters 94, 5(2009), 051112.
[46] Wei, T., Wang, S., Zhou, A., and Zhang, X.Acoustic eavesdropping through wireless vibrometry.In Proceedings of the 21st Annual InternationalConference on Mobile Computing and Networking(2015), ACM, pp. 130–141.
[47] Zhang, L., Pathak, P. H., Wu, M., Zhao, Y., andMohapatra, P. Accelword: Energy efficient hotworddetection through accelerometer. In Proceedings of the13th Annual International Conference on MobileSystems, Applications, and Services (2015), ACM,pp. 301–315.