Embed Size (px)
Citation preview

Patrick Doig
February 2015
Presented By:
Date:
Value Impacts of Truck Limited Haulage
SME 2015 – Denver
Originally Presented at AusIMMLife of Mine Conference 2014

Overview
Benefits of integrated scheduling
and landform to determine NPV
considering entire value chain
from open to closure.
Narrow focus on reduction of unit
cost = value destruction

Economics
Economic Cycle
Reduce Cost
• Capital expenditure first to be
cut
• High cost of Loading and
Transportation
• Must consider entire costs, not
individual components

Why Detailed Haulage Analysis
Plan material placement
Reduce and understand cost
Selective material placement
Determine final landform
Reduce overall closure risk

Cycle Time Variation
Using average cycle time
Insufficient truck allocation
(over and under trucked)
Reduced mining rate
Schedule delays

Methods of Truck Model
Methods of predicting truck requirements
Old software requires intense manual input
Difficult to run multiple scenarios
Recent advances allows
• More detail
• Selective material placement schedule
• Integrated with mining schedule

Dynamic Integration
Mining
ScheduleHaulage
Integrated Scheduling
& Landform
Reflect trucking restrictions
Optimize haulage strategies
• Maximize Production
• Minimize Cost
• Minimize Rehabilitation Liability

Production Schedule
Calculate Truck
RequirementsCost Model
Traditional Method

Integrated Method
Production Scheduler
Selective Material Placement (Dump
Schedule)
Calculate Truck Requirements
Modify Production Schedule to Truck
Restrictions
Cost Model
Quickly run multiple scenarios

Case Study
How many trucks
Reduce Cost
Reduce Risk
Reduce Rehabilitation Liability
Maximizes NPV

Geological Model

Pit Design
Dragline Spoil Piles Excavator Mining Solids
Truck Dump Designs
Dragline Mining Solids

Mining Schedule
0
1
2
3
4
5
6
7
8
9
10
0
10
20
30
40
50
60
2014 2015 2016 2017 2018
Co
al
(millio
n t
on
nes)
Wa
ste
Pri
me
Vo
lum
e (
mil
lio
n b
cm
)
Prestrip Prime Volume Dragline Prime Volume ROM Coal t Product Coal t

Landform Model

Total Number of Trucks
-
5.00
10.00
15.00
20.00
25.00
30.00
35.00
40.00
To
tal N
um
ber
of
Tru
cks

Truck Limited Model

Integrated Method
Production Scheduler
Selective Material Placement (Dump
Schedule)
Calculate Truck Requirements
Modify Production Schedule to Truck
Restrictions
Cost Model
Multiple Scenarios (12-46 Trucks)
Multiple Truck Fleets
Inadequate trucks =
reduced mining rates
Resulted in
• Schedule Quantities
• Total equipment
requirements
• Operational Hours
Required
• Fuel Burn
• Landform Schedule

Cost Model
Detailed Cost Model
Variable and Fixed Costs
Included Capital and Operational
Mining Disturbance

Results
What to compare
Schedule Physicals
Cost per Product Tonne
Minimum Trucking Cost
NPV

-
5
10
15
20
25
30
35
40
45
50
-
50
100
150
200
250
300
12 16 20 22 24 26 28 30 32 34 38 42 46
Co
al
(millio
n t
on
nes)
Waste
Vo
lum
e (
millio
n b
cm
)
Total Number of Trucks
Prod Coal t ROM Coal t Total Prime bcm Total DRE Prime bcm Total TS Prime bcm
Schedule Physicals
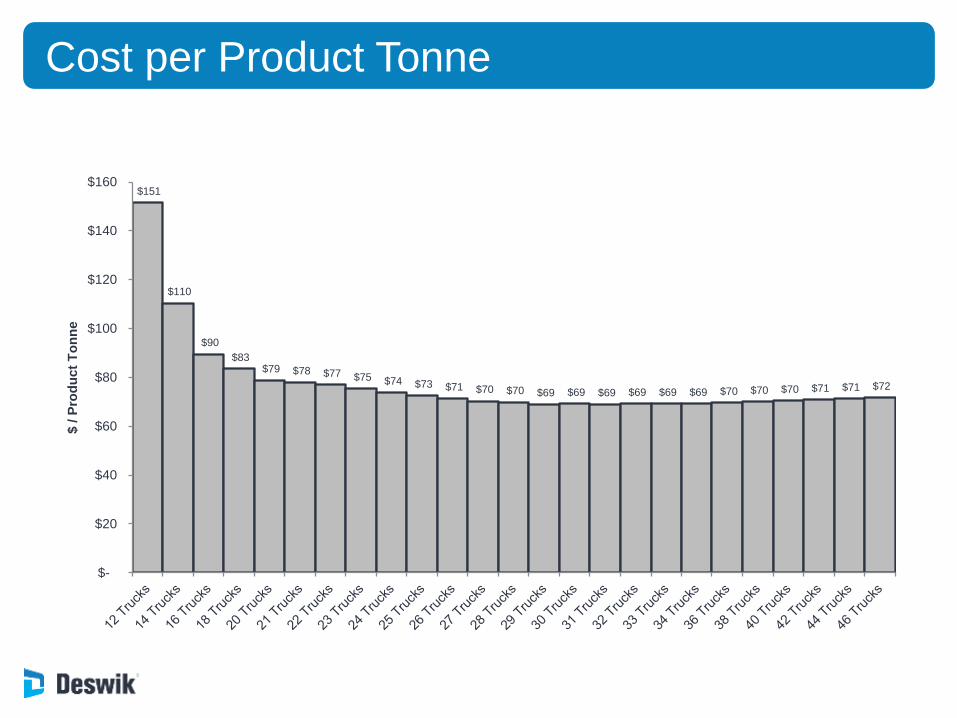
Cost per Product Tonne
$151
$110
$90
$83 $79 $78 $77 $75 $74 $73 $71 $70 $70 $69 $69 $69 $69 $69 $69 $70 $70 $70 $71 $71 $72
$-
$20
$40
$60
$80
$100
$120
$140
$160
$ / P
rod
uct
To
nn
e

$0
$100
$200
$300
$400
$500
$600
-
1
2
3
4
5
6
7
8
9
10
NP
V (
millio
n $
AU
D)
RO
M C
oal (m
illio
n t
on
nes/y
ear)
AVG ROM t/year NPV $AUD
NPV

Truck Unit Cost
$0
$100
$200
$300
$400
$500
$600
$2.00
$2.20
$2.40
$2.60
$2.80
$3.00
$3.20
$3.40
$3.60
0 5 10 15 20 25 30 35 40 45 50
NP
V (
$A
UD
)M
illio
ns
Tru
ck C
ost
($A
UD
/bcm
)
Number of Trucks
Truck Cost$AUD/bcm
NPV $AUD
Maximum
Business
Value
Minimum
Unit Cost

-
5.00
10.00
15.00
20.00
25.00
30.00
35.00
40.00
To
tal N
um
ber
of
Tru
cks
Discussion

Variance in Planned Coal Production
0
0.1
0.2
0.3
0.4
0.5
0.6
0.7
0.8
0.9
RO
M C
oal t
Millio
ns
29 Truck Case Base Case (No Truck Limited)

Video
Summary
Deficit / excess of trucks = increased costs
Understand how many trucks are required
Integrate landform with the mining schedule
• Reduce the mining schedule
• Better cost estimation
• Decrease cost per product tonne
• Reduce Risk

Thanks
Patrick Doig
Senior EngineerMAusIMM(CP), RPEQ
Deswik Australia