Embed Size (px)
Citation preview
Future Facilities| 6SigmaET – Thinking Outside the Box – Server Design for Data Center Optimization 1
The benefits of analyzing thermal performance using computational fluid dynamic (CFD) models at the
board and server level are well understood. This practice, established for decades, has proven to be more
cost effective with respect to product design while yielding faster times to market than earlier non-
simulation methods. In addition, thermal margins have been drastically reduced without compromising
performance and reliability. For the same reasons, data center designers also rely on CFD to ensure the
most cost effective room layout without compromising server inlet air flow and temperature.
An extensive amount of data is required to accurately simulate a data center. This includes thermal
models of the installed IT equipment. Typically server manufacturers do not provide sufficient thermal
information about their products for data center simulation. Currently only the outer dimensions, name
plate power and maximum operating temperature are readily available, but for meaningful data center
results, information regarding flow rates, vent geometry, and typical power consumption is also essential.
Until recently, migrating this information across the simulation supply chain was difficult. However, with
6SigmaDC’s suite of thermal modeling tools, the process has become seamless. Now, detailed, validated
thermal models at the server level can be used in data center models to provide solid, reliable predictions
of facility operations. Using 6SigmaET, the thermal details of the server can be characterized, and a
simplified version, using a control volume (or black box) approach can be used by the rest of the 6SigmaDC
software to predict airflows and heat dissipations at the rack and room levels.
This paper will explore the creation and use of a simplified server model (SSM) using the full suite of
6SigmaDC software. A detailed server model of the Facebook Open Compute Windmill Server will be
created in 6SigmaET. This detailed model will be simplified and the SSM will be used to verify the design
of the Open Compute Rack and an example data center. The paper will discuss the benefits and limitations
of thermal simulation at the server, rack and data center level. The process followed can be seen in figure
1 overleaf. Finally, a comparison will be made between using a SSM in a data center simulation and using
basic server data readily available today, this will be conducted in a failure scenario. Air flows and
temperatures will re-assessed and a discussion presented.
Thinking Outside the Box –
Server Design for Data Center
Optimization
Marie Ross, Senior Applications Engineer
Tom Gregory, Consultant Engineer
October 2013
Ju
Future Facilities| 6SigmaET – Thinking Outside the Box – Server Design for Data Center Optimization 2
Detailed Server
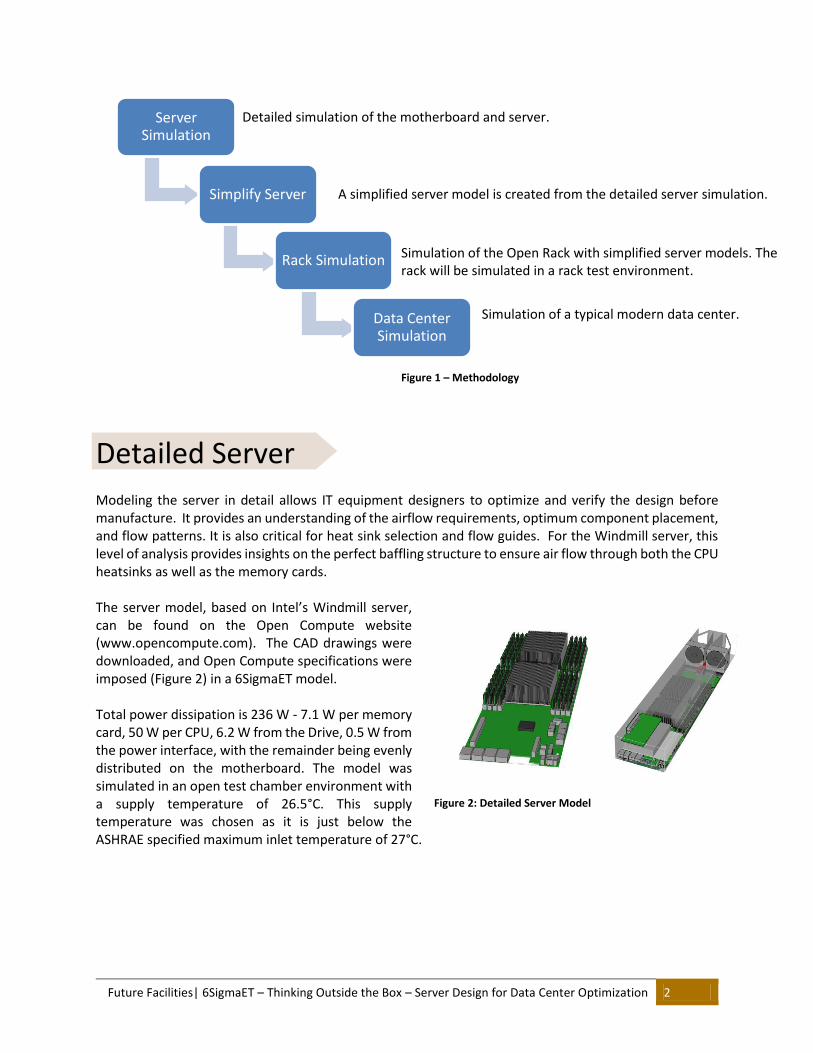
Modeling the server in detail allows IT equipment designers to optimize and verify the design before manufacture. It provides an understanding of the airflow requirements, optimum component placement, and flow patterns. It is also critical for heat sink selection and flow guides. For the Windmill server, this level of analysis provides insights on the perfect baffling structure to ensure air flow through both the CPU heatsinks as well as the memory cards. The server model, based on Intel’s Windmill server, can be found on the Open Compute website (www.opencompute.com). The CAD drawings were downloaded, and Open Compute specifications were imposed (Figure 2) in a 6SigmaET model. Total power dissipation is 236 W - 7.1 W per memory card, 50 W per CPU, 6.2 W from the Drive, 0.5 W from the power interface, with the remainder being evenly distributed on the motherboard. The model was simulated in an open test chamber environment with a supply temperature of 26.5°C. This supply temperature was chosen as it is just below the ASHRAE specified maximum inlet temperature of 27°C.
Server Simulation
Simplify Server
Rack Simulation
Data Center Simulation
Detailed simulation of the motherboard and server.
A simplified server model is created from the detailed server simulation.
Simulation of the Open Rack with simplified server models. The rack will be simulated in a rack test environment.
Simulation of a typical modern data center.
Figure 1 – Methodology
Figure 2: Detailed Server Model
Future Facilities| 6SigmaET – Thinking Outside the Box – Server Design for Data Center Optimization 3
Simplified Server
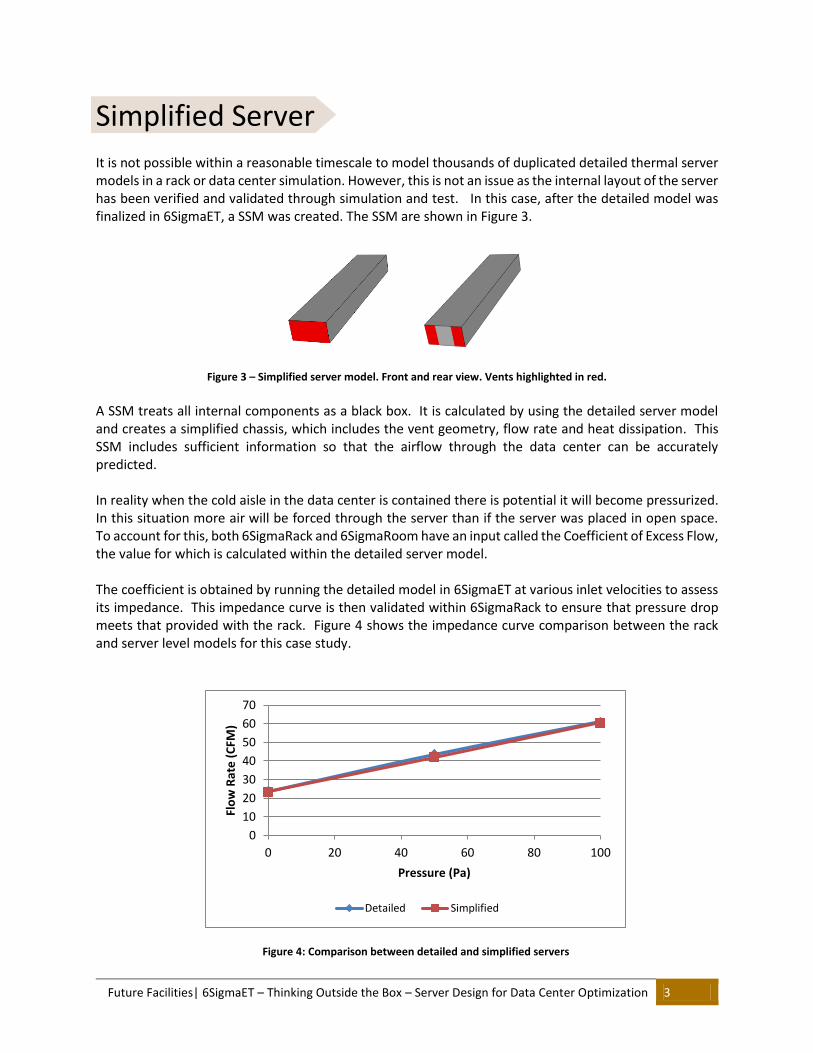
It is not possible within a reasonable timescale to model thousands of duplicated detailed thermal server models in a rack or data center simulation. However, this is not an issue as the internal layout of the server has been verified and validated through simulation and test. In this case, after the detailed model was finalized in 6SigmaET, a SSM was created. The SSM are shown in Figure 3.
Figure 3 – Simplified server model. Front and rear view. Vents highlighted in red.
A SSM treats all internal components as a black box. It is calculated by using the detailed server model and creates a simplified chassis, which includes the vent geometry, flow rate and heat dissipation. This SSM includes sufficient information so that the airflow through the data center can be accurately predicted. In reality when the cold aisle in the data center is contained there is potential it will become pressurized. In this situation more air will be forced through the server than if the server was placed in open space. To account for this, both 6SigmaRack and 6SigmaRoom have an input called the Coefficient of Excess Flow, the value for which is calculated within the detailed server model. The coefficient is obtained by running the detailed model in 6SigmaET at various inlet velocities to assess its impedance. This impedance curve is then validated within 6SigmaRack to ensure that pressure drop meets that provided with the rack. Figure 4 shows the impedance curve comparison between the rack and server level models for this case study.
Figure 4: Comparison between detailed and simplified servers
0
10
20
30
40
50
60
70
0 20 40 60 80 100
Flo
w R
ate
(C
FM)
Pressure (Pa)
Detailed Simplified
Future Facilities| 6SigmaET – Thinking Outside the Box – Server Design for Data Center Optimization 4
Rack
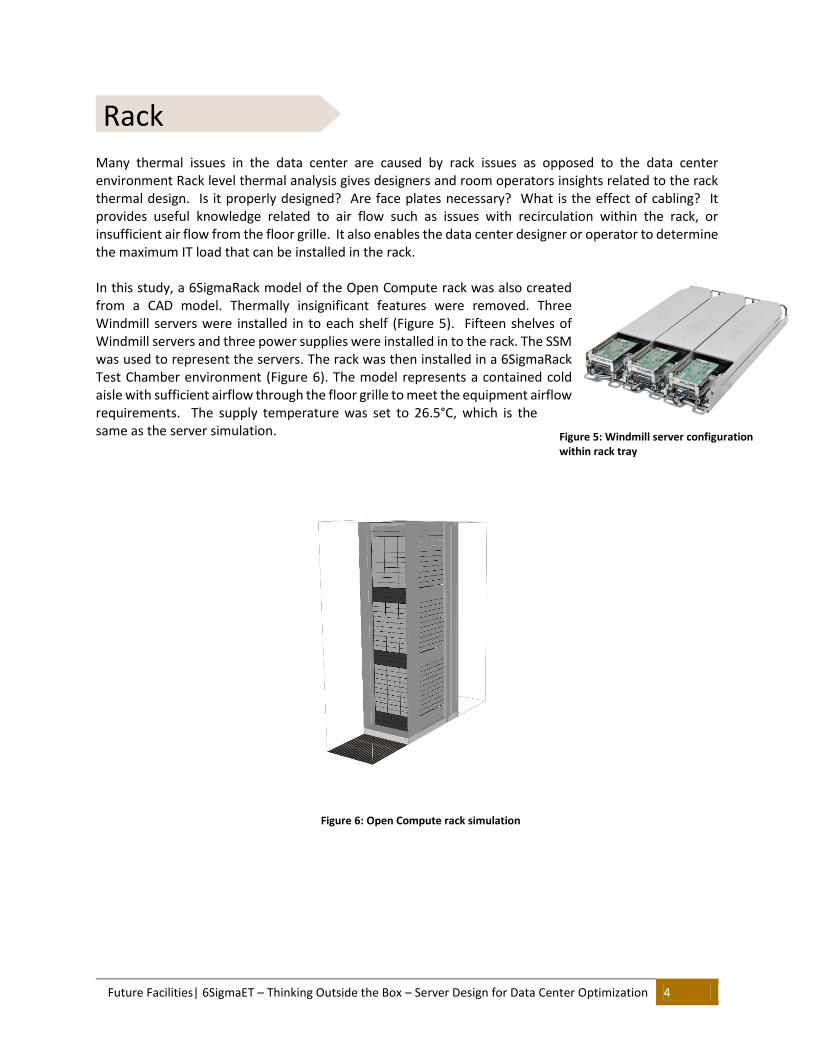
Many thermal issues in the data center are caused by rack issues as opposed to the data center environment Rack level thermal analysis gives designers and room operators insights related to the rack thermal design. Is it properly designed? Are face plates necessary? What is the effect of cabling? It provides useful knowledge related to air flow such as issues with recirculation within the rack, or insufficient air flow from the floor grille. It also enables the data center designer or operator to determine the maximum IT load that can be installed in the rack. In this study, a 6SigmaRack model of the Open Compute rack was also created from a CAD model. Thermally insignificant features were removed. Three Windmill servers were installed in to each shelf (Figure 5). Fifteen shelves of Windmill servers and three power supplies were installed in to the rack. The SSM was used to represent the servers. The rack was then installed in a 6SigmaRack Test Chamber environment (Figure 6). The model represents a contained cold aisle with sufficient airflow through the floor grille to meet the equipment airflow requirements. The supply temperature was set to 26.5°C, which is the same as the server simulation.
Figure 6: Open Compute rack simulation
Figure 5: Windmill server configuration within rack tray
Future Facilities| 6SigmaET – Thinking Outside the Box – Server Design for Data Center Optimization 5
Data Center
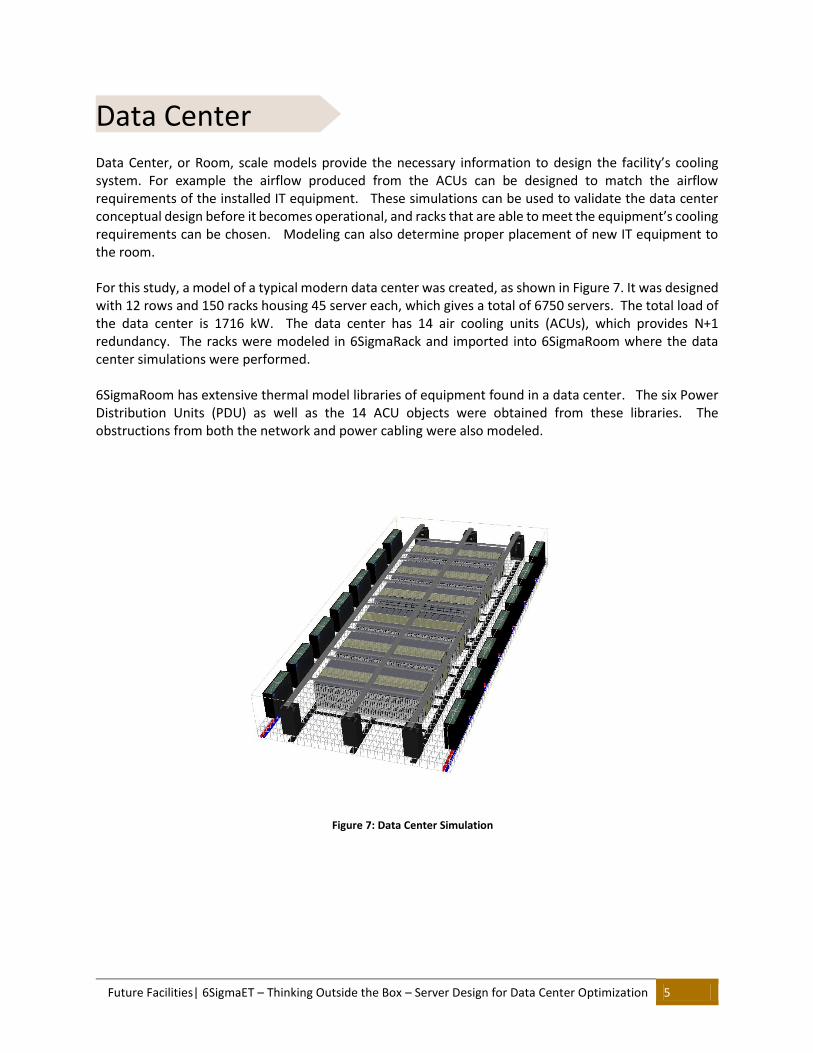
Data Center, or Room, scale models provide the necessary information to design the facility’s cooling system. For example the airflow produced from the ACUs can be designed to match the airflow requirements of the installed IT equipment. These simulations can be used to validate the data center conceptual design before it becomes operational, and racks that are able to meet the equipment’s cooling requirements can be chosen. Modeling can also determine proper placement of new IT equipment to the room. For this study, a model of a typical modern data center was created, as shown in Figure 7. It was designed with 12 rows and 150 racks housing 45 server each, which gives a total of 6750 servers. The total load of the data center is 1716 kW. The data center has 14 air cooling units (ACUs), which provides N+1 redundancy. The racks were modeled in 6SigmaRack and imported into 6SigmaRoom where the data center simulations were performed. 6SigmaRoom has extensive thermal model libraries of equipment found in a data center. The six Power Distribution Units (PDU) as well as the 14 ACU objects were obtained from these libraries. The obstructions from both the network and power cabling were also modeled.
Figure 7: Data Center Simulation
Future Facilities| 6SigmaET – Thinking Outside the Box – Server Design for Data Center Optimization 6
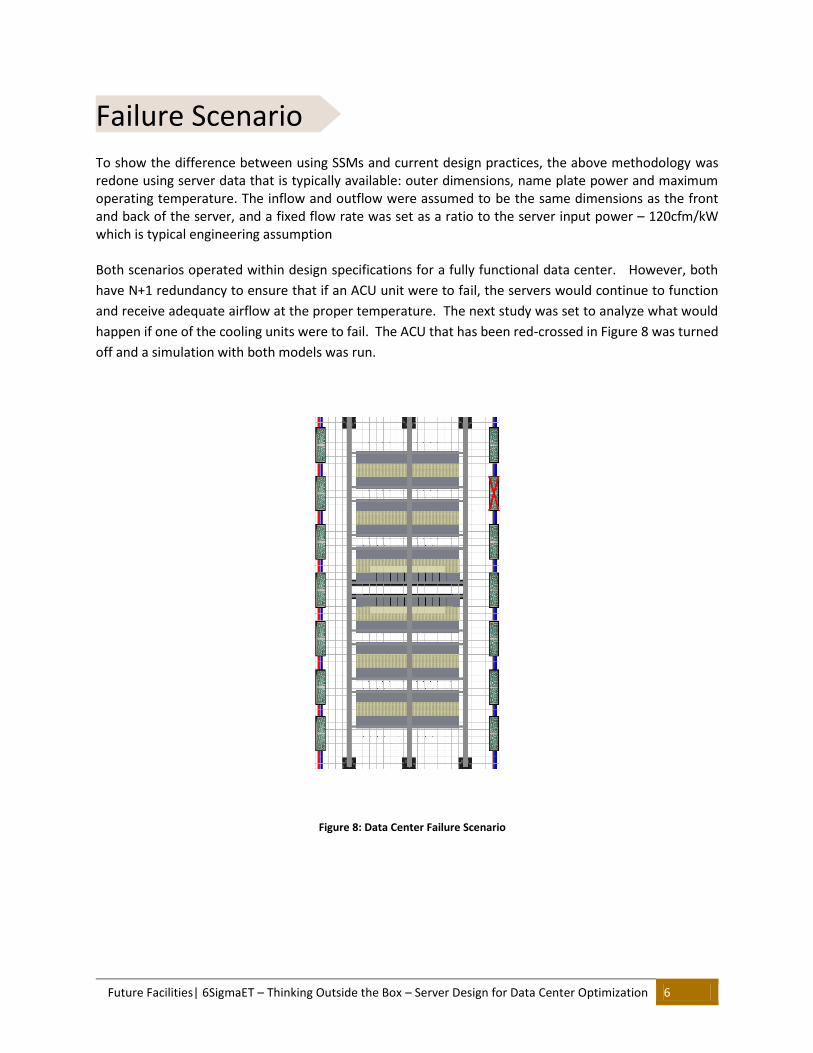
Failure Scenario
To show the difference between using SSMs and current design practices, the above methodology was redone using server data that is typically available: outer dimensions, name plate power and maximum operating temperature. The inflow and outflow were assumed to be the same dimensions as the front and back of the server, and a fixed flow rate was set as a ratio to the server input power – 120cfm/kW which is typical engineering assumption Both scenarios operated within design specifications for a fully functional data center. However, both
have N+1 redundancy to ensure that if an ACU unit were to fail, the servers would continue to function
and receive adequate airflow at the proper temperature. The next study was set to analyze what would
happen if one of the cooling units were to fail. The ACU that has been red-crossed in Figure 8 was turned
off and a simulation with both models was run.
Figure 8: Data Center Failure Scenario
Future Facilities| 6SigmaET – Thinking Outside the Box – Server Design for Data Center Optimization 7
Results
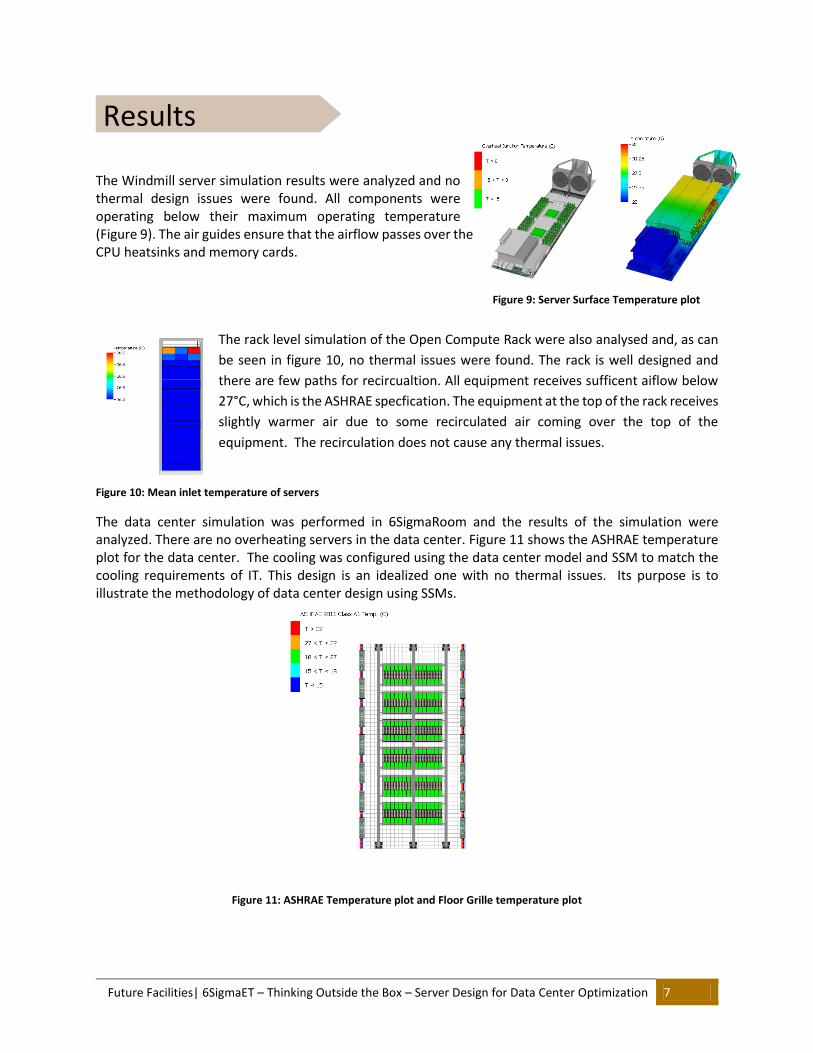
The Windmill server simulation results were analyzed and no thermal design issues were found. All components were operating below their maximum operating temperature (Figure 9). The air guides ensure that the airflow passes over the CPU heatsinks and memory cards.
The rack level simulation of the Open Compute Rack were also analysed and, as can
be seen in figure 10, no thermal issues were found. The rack is well designed and
there are few paths for recircualtion. All equipment receives sufficent aiflow below
27°C, which is the ASHRAE specfication. The equipment at the top of the rack receives
slightly warmer air due to some recirculated air coming over the top of the
equipment. The recirculation does not cause any thermal issues.
Figure 10: Mean inlet temperature of servers
The data center simulation was performed in 6SigmaRoom and the results of the simulation were analyzed. There are no overheating servers in the data center. Figure 11 shows the ASHRAE temperature plot for the data center. The cooling was configured using the data center model and SSM to match the cooling requirements of IT. This design is an idealized one with no thermal issues. Its purpose is to illustrate the methodology of data center design using SSMs.
Figure 11: ASHRAE Temperature plot and Floor Grille temperature plot
Figure 9: Server Surface Temperature plot
Future Facilities| 6SigmaET – Thinking Outside the Box – Server Design for Data Center Optimization 8
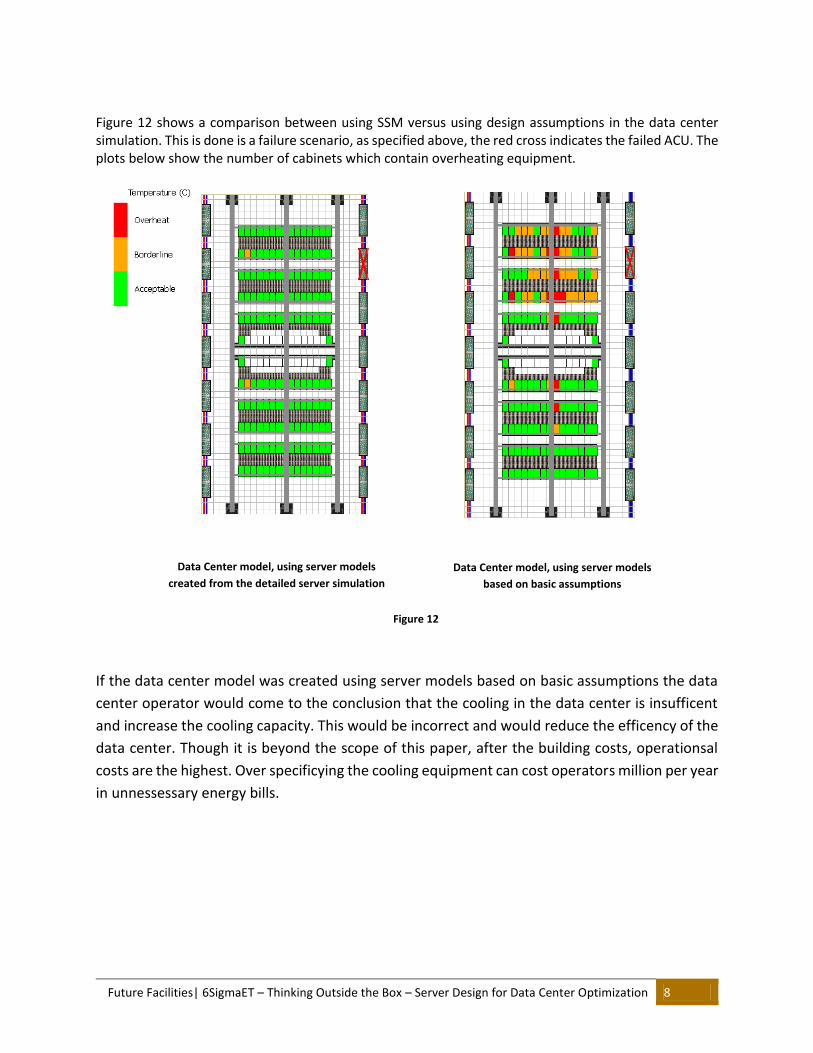
Figure 12 shows a comparison between using SSM versus using design assumptions in the data center simulation. This is done is a failure scenario, as specified above, the red cross indicates the failed ACU. The plots below show the number of cabinets which contain overheating equipment.
If the data center model was created using server models based on basic assumptions the data
center operator would come to the conclusion that the cooling in the data center is insufficent
and increase the cooling capacity. This would be incorrect and would reduce the efficency of the
data center. Though it is beyond the scope of this paper, after the building costs, operationsal
costs are the highest. Over specificying the cooling equipment can cost operators million per year
in unnessessary energy bills.
Data Center model, using server models
created from the detailed server simulation
Data Center model, using server models
based on basic assumptions
Figure 12
Future Facilities| 6SigmaET – Thinking Outside the Box – Server Design for Data Center Optimization 9
Conclusion
Like for IT equipment simulation, using CFD for data centers is a useful tool for design validation and troubleshooting. It allows for a detailed assessment of the heat and air flow patterns that will emanate from the selected IT equipment as these are intricately linked. Without validated and accurate information about the server, a data center simulation will never be correct, and the design will reflect that – even in idealized conceptual designs. To save on solving time, simplified IT equipment models, SSM, can be used to exchange relevant data between electronic simulation and data center simulation tools. Careful consideration must be taken, however, to ensure that specific data is not lost both at the rack and room level as well as within the server. The server model must be a finalized, detailed design before it can be characterized flow and heat dissipation patterns. These are then used as boundary conditions to define a black box without compromising accuracy. This can be done in 6SigmaET, and seamlessly integrated into either 6SigmaRack or 6SigmaRoom. Incorporating the SSM in the rack and data center analysis enables a far better design than those currently done. This innovative approach can save the data center operator millions in energy costs per year. With 6SigmaDC, the entire electronics supply chain can be optimized for functionality, reliably and operational costs.
UK Corporate Headquarters
Future Facilities Limited. 1 Salamanca Street London SE1 7HX Tel: +44 (0) 20 7840 9540 Fax: +44 (0) 20 7091 7171 Email: [email protected]
North America
Future Facilities Inc. 2055 Gateway Place, Suite 110 San Jose CA 95110 Tel: +1 408 436 7701 Fax: +1 408 436 7705 Email: [email protected]
Japan
Future Facilities KK S2 bldg. 5F 2-15-22 Shinjuku Shinjuku-Ku, Tokyo 160-0022 Tel: +81 (0) 3 5312 8070 Fax: +81 (0) 3 5312 8071 Email: [email protected]