Embed Size (px)
Citation preview
1
Session
State Diagram
Checklist
Introduction to State diagram
Explain State diagram notations
Construct State diagram for our Case Study
2
State Diagram
State Diagram also referred to as state chart diagram or state machine describes life of objects
in terms of events that change the state of the object. These events can be external or internal
events. State refers to the current condition of the object. Scope of the state is the entire life of
the object in a system. State diagram has been around for a long time around and is crucial in
embedded development.
Elements of a State Chart Diagram
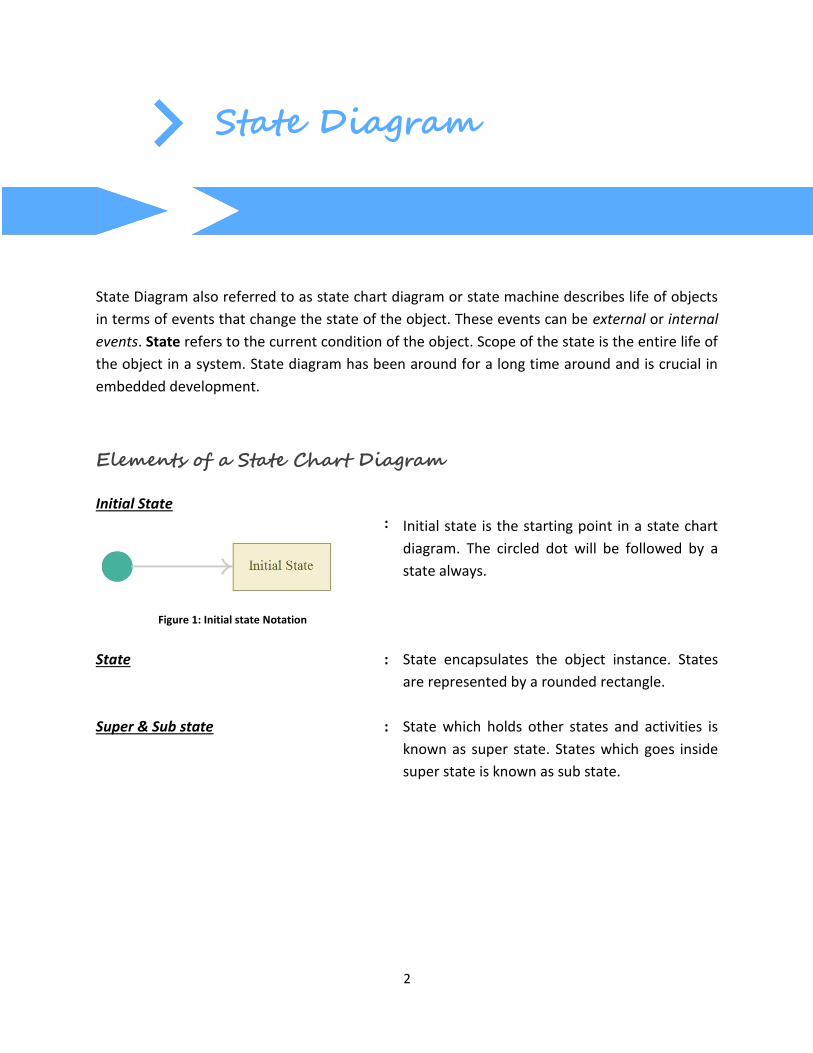
Initial State
Figure 1: Initial state Notation
:
Initial state is the starting point in a state chart
diagram. The circled dot will be followed by a
state always.
State : State encapsulates the object instance. States
are represented by a rounded rectangle.
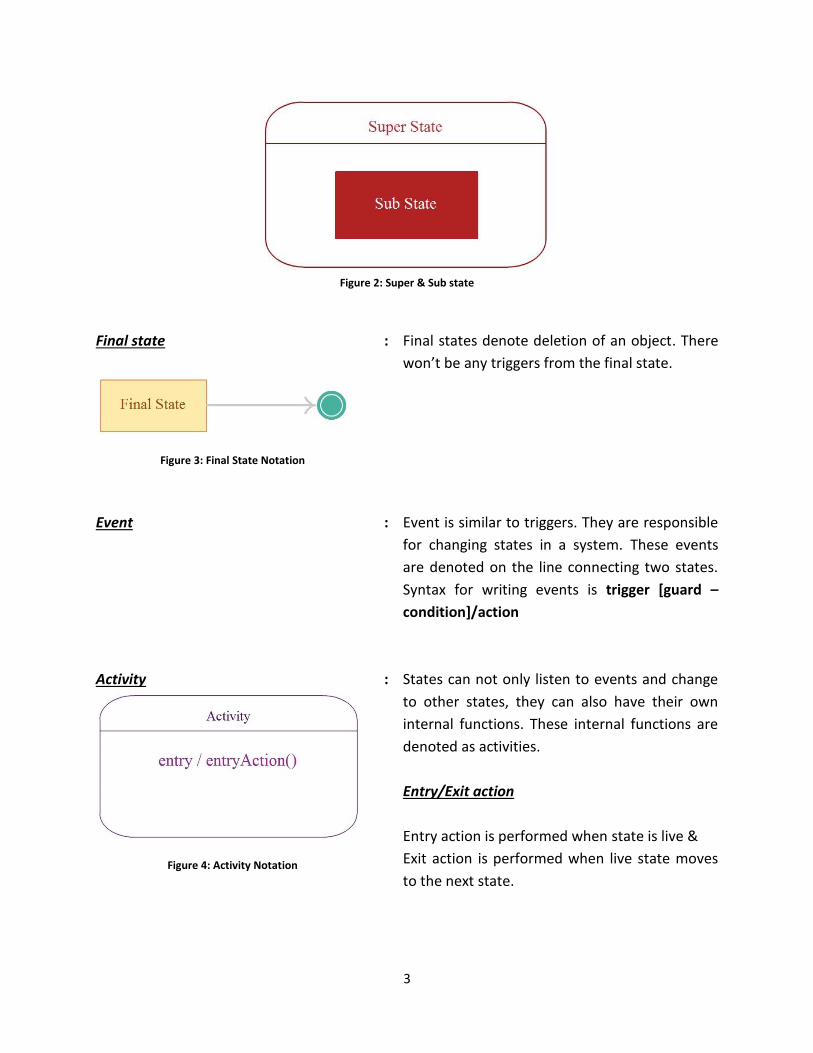
Super & Sub state
: State which holds other states and activities is
known as super state. States which goes inside
super state is known as sub state.
3
Figure 2: Super & Sub state
Final state
Figure 3: Final State Notation
: Final states denote deletion of an object. There
won’t be any triggers from the final state.
Event : Event is similar to triggers. They are responsible
for changing states in a system. These events
are denoted on the line connecting two states.
Syntax for writing events is trigger [guard –
condition]/action
Activity
Figure 4: Activity Notation
: States can not only listen to events and change
to other states, they can also have their own
internal functions. These internal functions are
denoted as activities.
Entry/Exit action
Entry action is performed when state is live &
Exit action is performed when live state moves
to the next state.
4
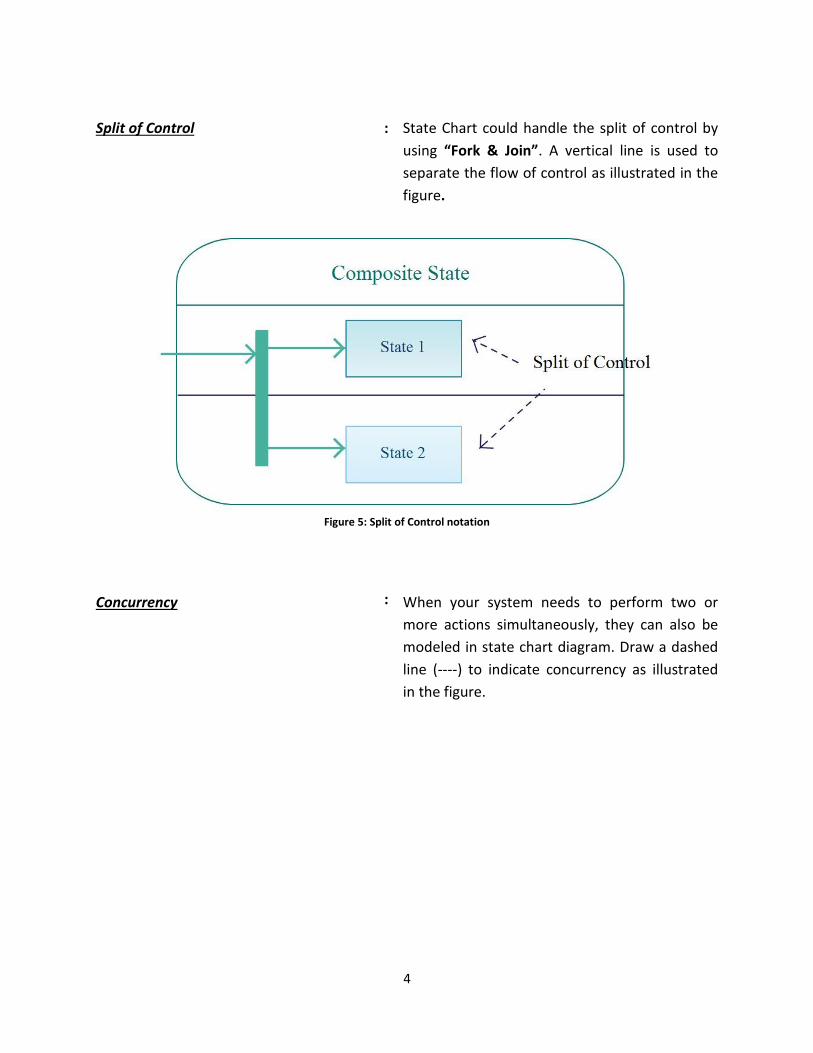
Split of Control : State Chart could handle the split of control by
using “Fork & Join”. A vertical line is used to
separate the flow of control as illustrated in the
figure.
Figure 5: Split of Control notation
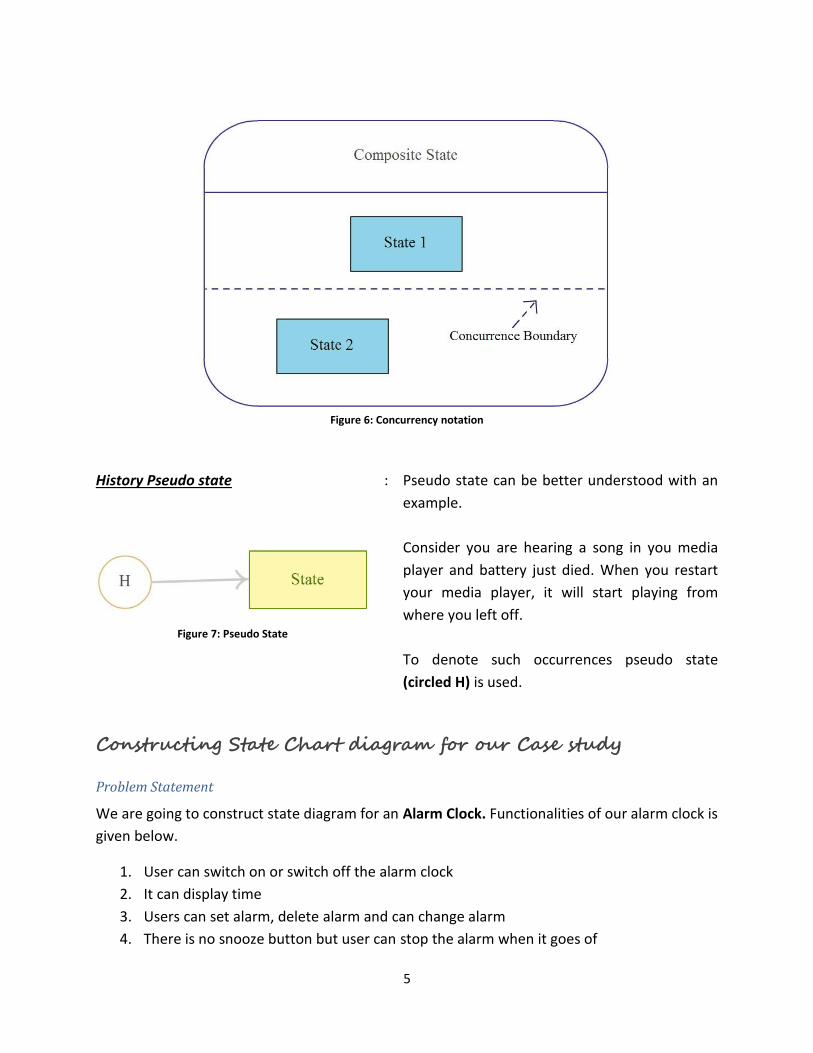
Concurrency
:
When your system needs to perform two or
more actions simultaneously, they can also be
modeled in state chart diagram. Draw a dashed
line (----) to indicate concurrency as illustrated
in the figure.
5
Figure 6: Concurrency notation
History Pseudo state
Figure 7: Pseudo State
: Pseudo state can be better understood with an
example.
Consider you are hearing a song in you media
player and battery just died. When you restart
your media player, it will start playing from
where you left off.
To denote such occurrences pseudo state
(circled H) is used.
Constructing State Chart diagram for our Case study
Problem Statement
We are going to construct state diagram for an Alarm Clock. Functionalities of our alarm clock is
given below.
1. User can switch on or switch off the alarm clock
2. It can display time
3. Users can set alarm, delete alarm and can change alarm
4. There is no snooze button but user can stop the alarm when it goes of
6
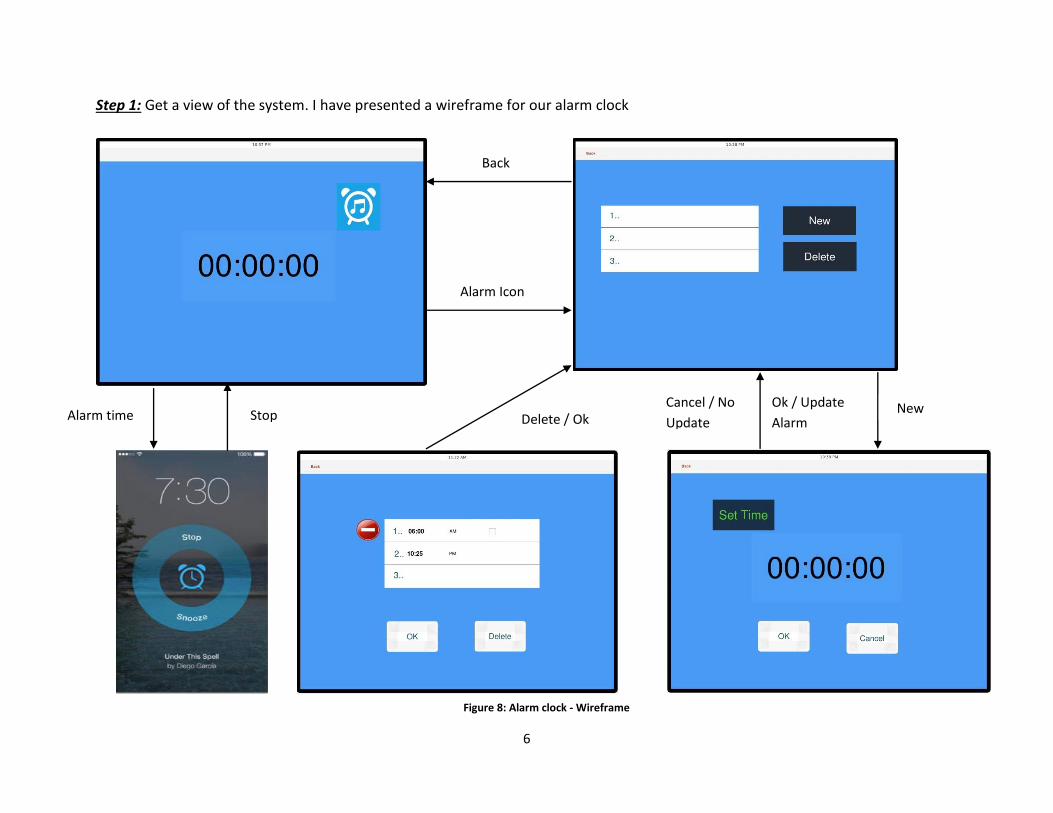
Step 1: Get a view of the system. I have presented a wireframe for our alarm clock
Back
Alarm Icon
New Ok / Update
Alarm
Cancel / No
Update Stop Alarm time Delete / Ok
Figure 8: Alarm clock - Wireframe
7
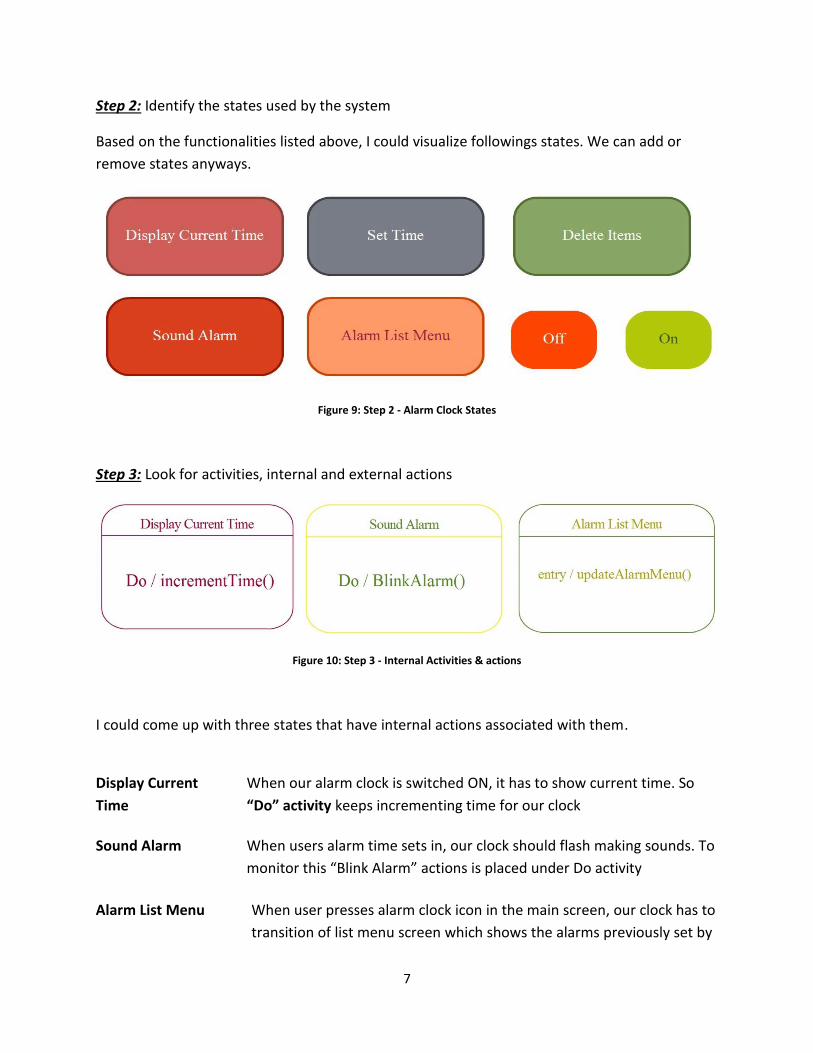
Step 2: Identify the states used by the system
Based on the functionalities listed above, I could visualize followings states. We can add or
remove states anyways.
Figure 9: Step 2 - Alarm Clock States
Step 3: Look for activities, internal and external actions
Figure 10: Step 3 - Internal Activities & actions
I could come up with three states that have internal actions associated with them.
Display Current
Time
When our alarm clock is switched ON, it has to show current time. So
“Do” activity keeps incrementing time for our clock
Sound Alarm When users alarm time sets in, our clock should flash making sounds. To
monitor this “Blink Alarm” actions is placed under Do activity
Alarm List Menu When user presses alarm clock icon in the main screen, our clock has to
transition of list menu screen which shows the alarms previously set by
8
the user.
So whenever user enters this screen the list must be updated. Our
entry function is assigned to take care of this functionality.
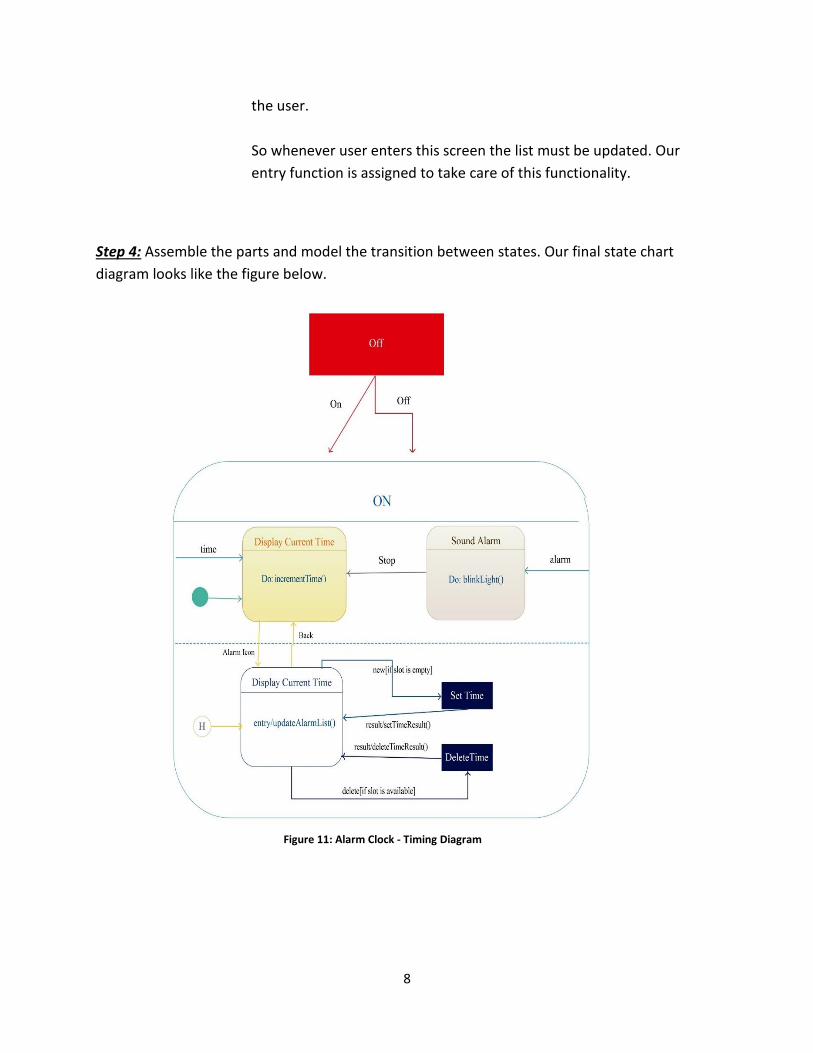
Step 4: Assemble the parts and model the transition between states. Our final state chart
diagram looks like the figure below.
Figure 11: Alarm Clock - Timing Diagram
9
–
Review
State chart diagram describes life of an object in terms of event
State chart diagram is also known as state machine or state diagram
Elements of state diagram – state, activity, pseudo state, event