Embed Size (px)
Citation preview
SAP GRC Process Control
Process Control Automated Monitoring
SAP Process Control
SAP Business Objects Process Control is an enterprise software solution for compliance and policy management. The compliance management capabilities enable organizations to manage and monitor its internal control environment. This provides the ability to proactively remediate any identified issues, and then certify and report on the overall state of the
corresponding compliance activities.
Business Scenario• Basic business processes necessary for running any business are purchasing, sales, hiring
and promotion, etc. SAP Business Objects Governance, Risk and Compliance (GRC) solutions provide an overview of such processes from a risk and compliance point of view, and help customers measure risks and monitor compliance.
• Automated monitoring of backend systems and processes are part of the Process Control 10.0 application (PC 10). Customers of GRC use automated monitoring for configurations, master data and transactions.
• The following figure depicts how GRC fits into the corporate IT landscape, and into a corporate governance and compliance strategy.
• Automated (or semi-automated) monitoring can also help individuals perform the control function. For instance, a person responsible for reviewing and approving purchases might want to look at background information on the requester, vendor, pricing trends, etc. before making a decision. Workflow can route the requisition itself to his or her inbox, but PC automated monitoring can provide the additional information needed to actually reach good decisions.
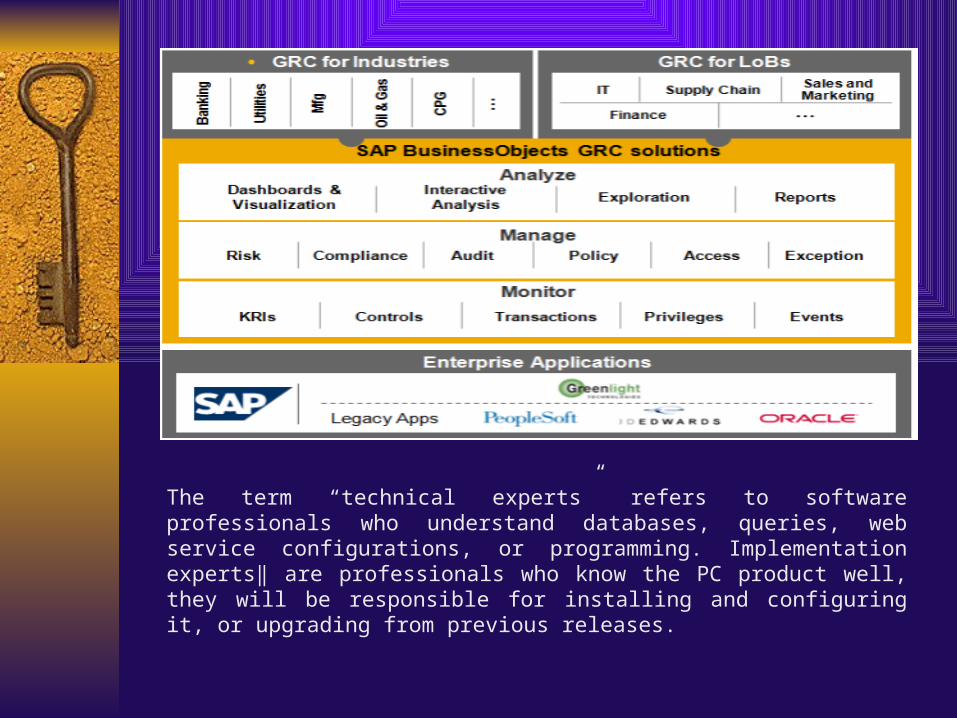
The term “technical experts” refers to software professionals who understand databases, queries, web service configurations, or programming. Implementation experts‖ are professionals who know the PC product well, they will be responsible for installing and configuring it, or upgrading from previous releases.
Automated Monitoring Overview
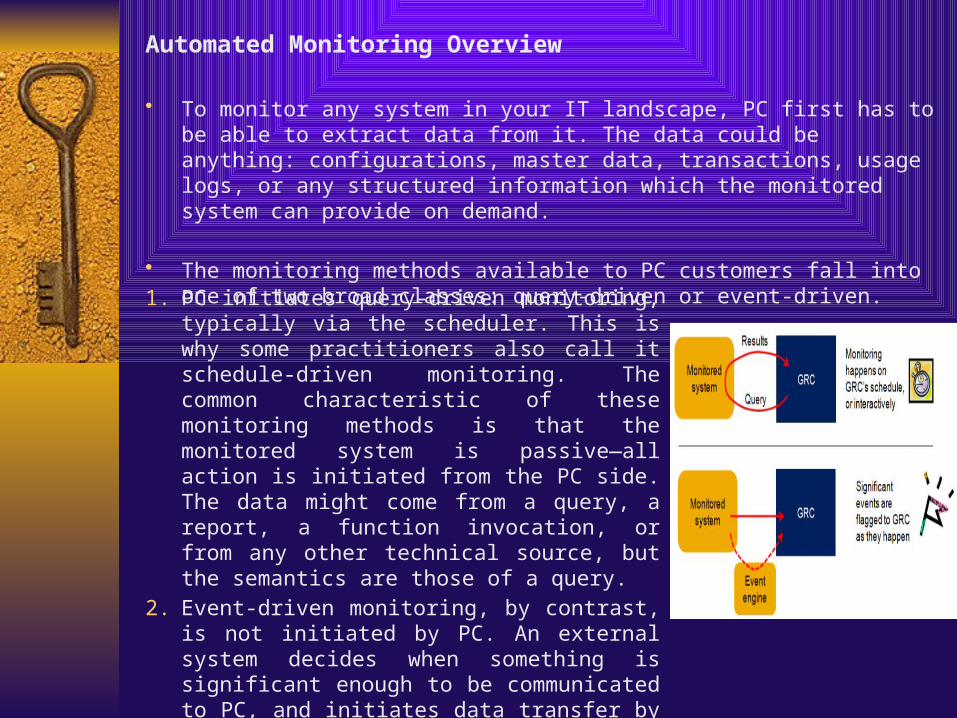
• To monitor any system in your IT landscape, PC first has to be able to extract data from it. The data could be anything: configurations, master data, transactions, usage logs, or any structured information which the monitored system can provide on demand.
• The monitoring methods available to PC customers fall into one of two broad classes: query-driven or event-driven.
1. PC initiates query-driven monitoring, typically via the scheduler. This is why some practitioners also call it schedule-driven monitoring. The common characteristic of these monitoring methods is that the monitored system is passive—all action is initiated from the PC side. The data might come from a query, a report, a function invocation, or from any other technical source, but the semantics are those of a query.
2. Event-driven monitoring, by contrast, is not initiated by PC. An external system decides when something is significant enough to be communicated to PC, and initiates data transfer by raising an event. PC treats such events as data sources much the same as a query-driven data source, and makes the event details available to business rules for further evaluation
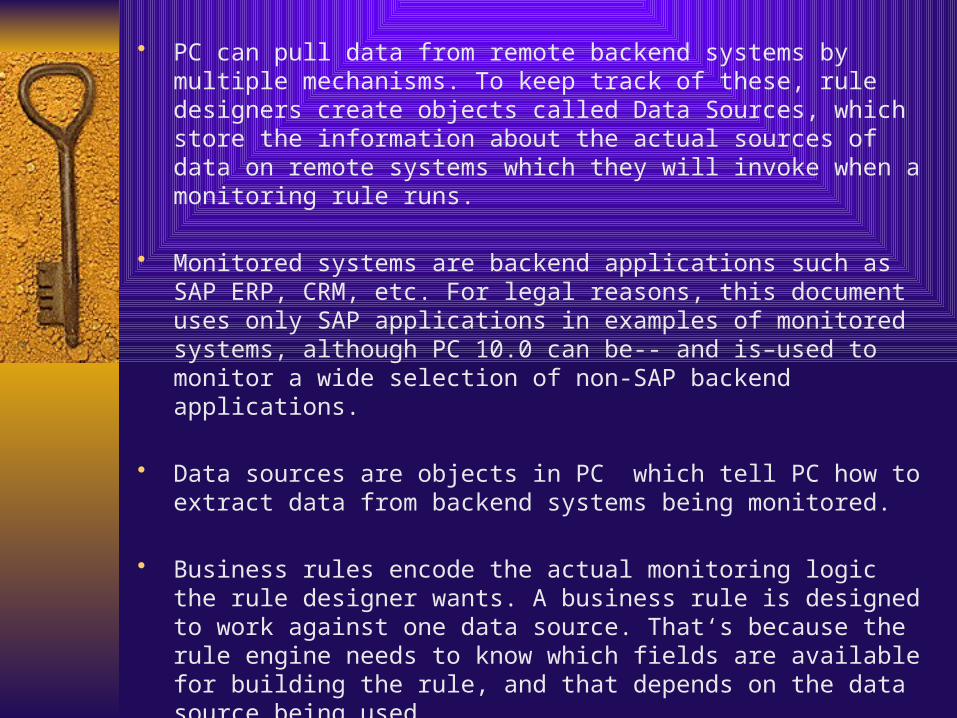
• PC can pull data from remote backend systems by multiple mechanisms. To keep track of these, rule designers create objects called Data Sources, which store the information about the actual sources of data on remote systems which they will invoke when a monitoring rule runs.
• Monitored systems are backend applications such as SAP ERP, CRM, etc. For legal reasons, this document uses only SAP applications in examples of monitored systems, although PC 10.0 can be-- and is–used to monitor a wide selection of non-SAP backend applications.
• Data sources are objects in PC which tell PC how to extract data from backend systems being monitored.
• Business rules encode the actual monitoring logic the rule designer wants. A business rule is designed to work against one data source. That‘s because the rule engine needs to know which fields are available for building the rule, and that depends on the data source being used.
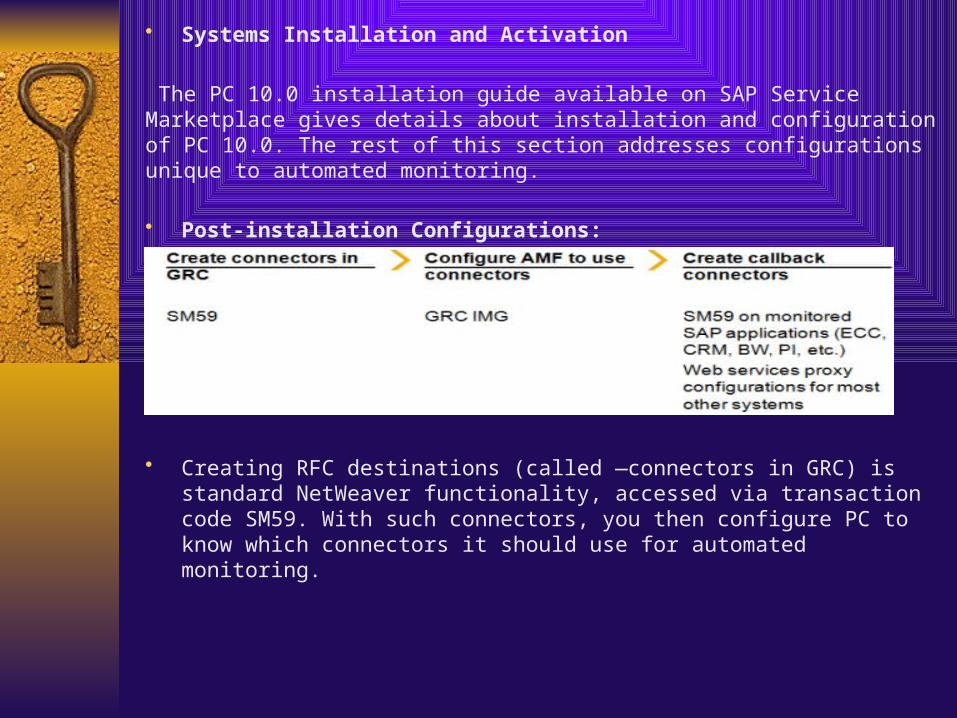
• Systems Installation and Activation
The PC 10.0 installation guide available on SAP Service Marketplace gives details about installation and configuration of PC 10.0. The rest of this section addresses configurations unique to automated monitoring.
• Post-installation Configurations:
• Creating RFC destinations (called ―connectors in GRC) is standard NetWeaver functionality, accessed via transaction code SM59. With such connectors, you then configure PC to know which connectors it should use for automated monitoring.
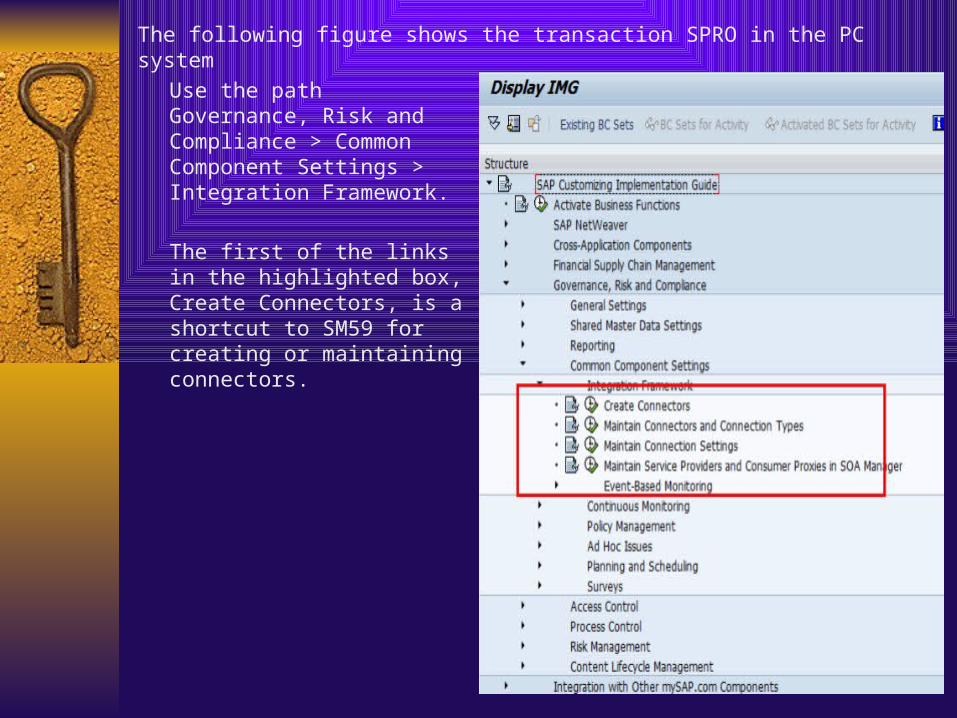
The following figure shows the transaction SPRO in the PC system
Use the path Governance, Risk and Compliance > Common Component Settings > Integration Framework.
The first of the links in the highlighted box, Create Connectors, is a shortcut to SM59 for creating or maintaining connectors.
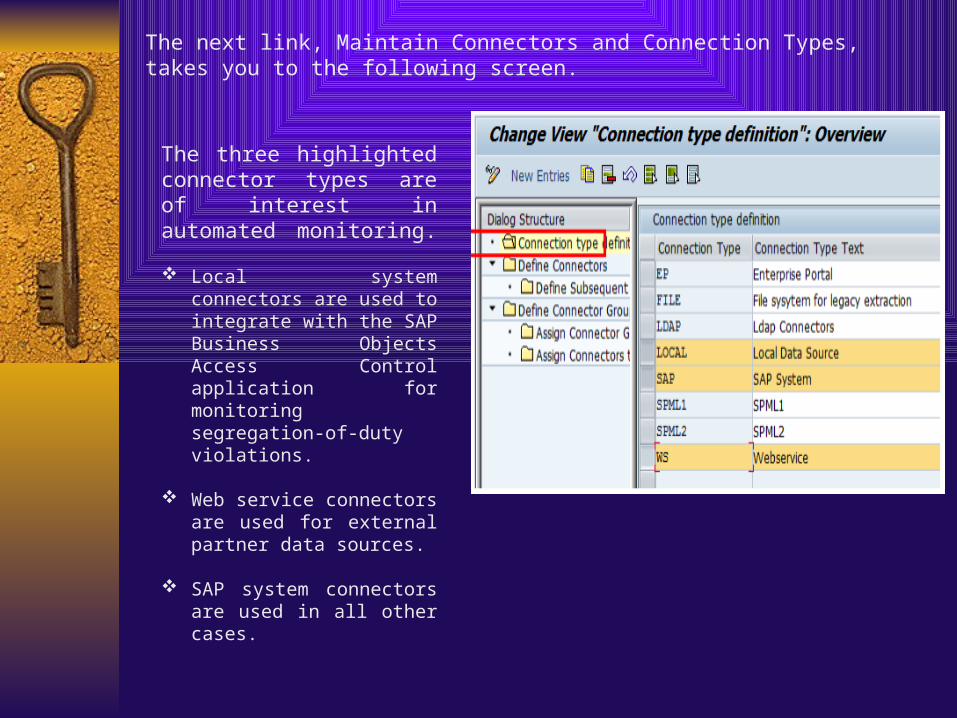
The next link, Maintain Connectors and Connection Types, takes you to the following screen.
The three highlighted connector types are of interest in automated monitoring.
Local system connectors are used to integrate with the SAP Business Objects Access Control application for monitoring segregation-of-duty violations.
Web service connectors are used for external partner data sources.
SAP system connectors are used
in all other cases.
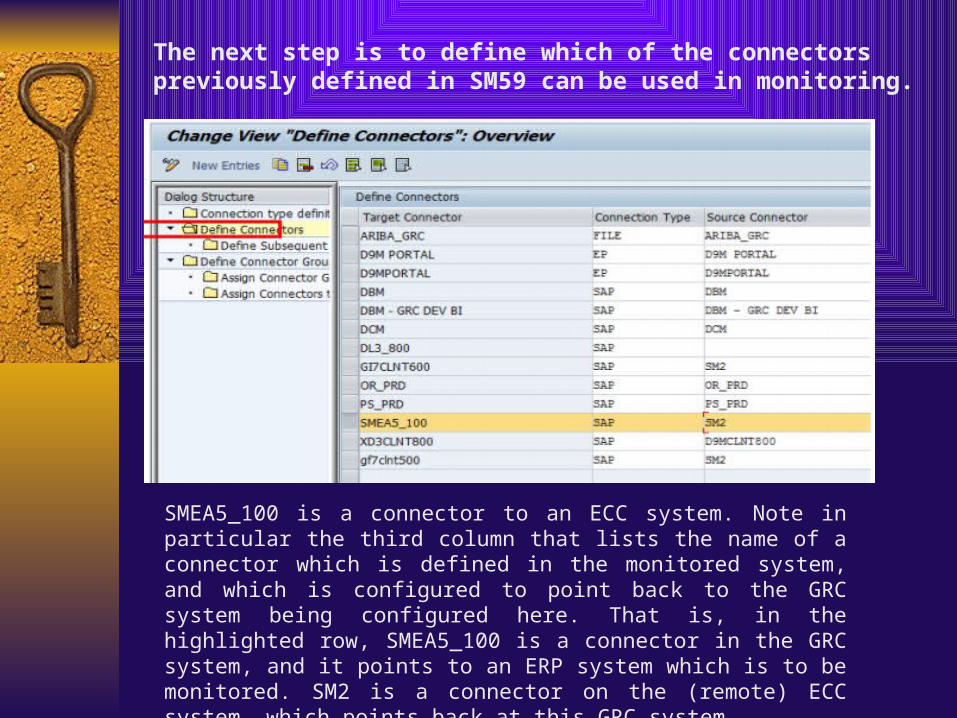
The next step is to define which of the connectors previously defined in SM59 can be used in monitoring.
SMEA5_100 is a connector to an ECC system. Note in particular the third column that lists the name of a connector which is defined in the monitored system, and which is configured to point back to the GRC system being configured here. That is, in the highlighted row, SMEA5_100 is a connector in the GRC system, and it points to an ERP system which is to be monitored. SM2 is a connector on the (remote) ECC system, which points back at this GRC system.
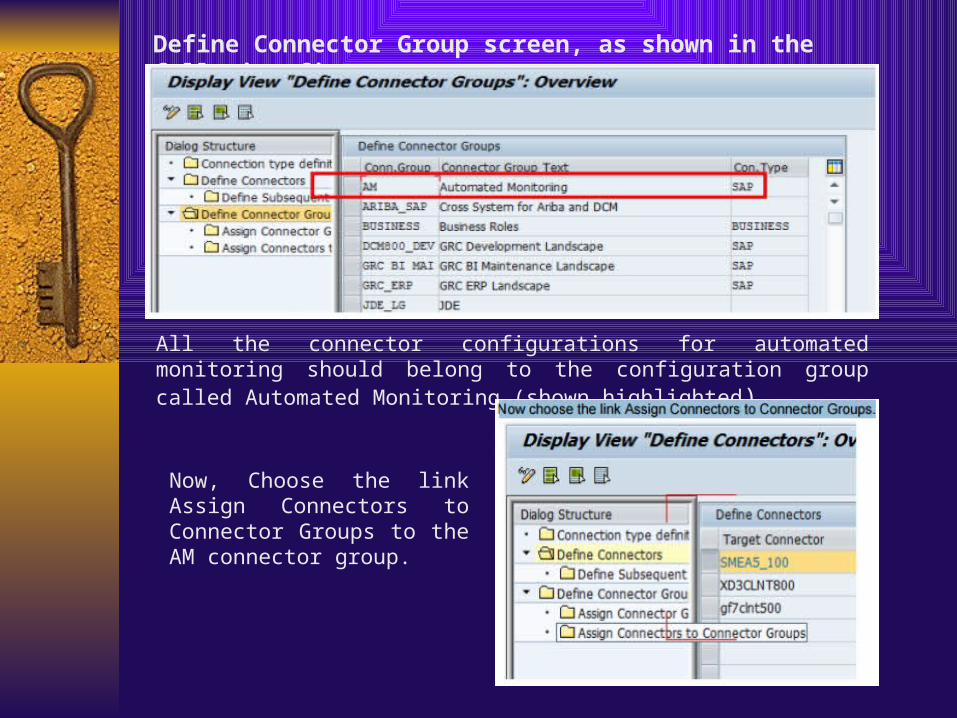
Define Connector Group screen, as shown in the following figure.
All the connector configurations for automated monitoring should belong to the configuration group called Automated Monitoring (shown highlighted).
Now, Choose the link Assign Connectors to Connector Groups to the AM connector group.
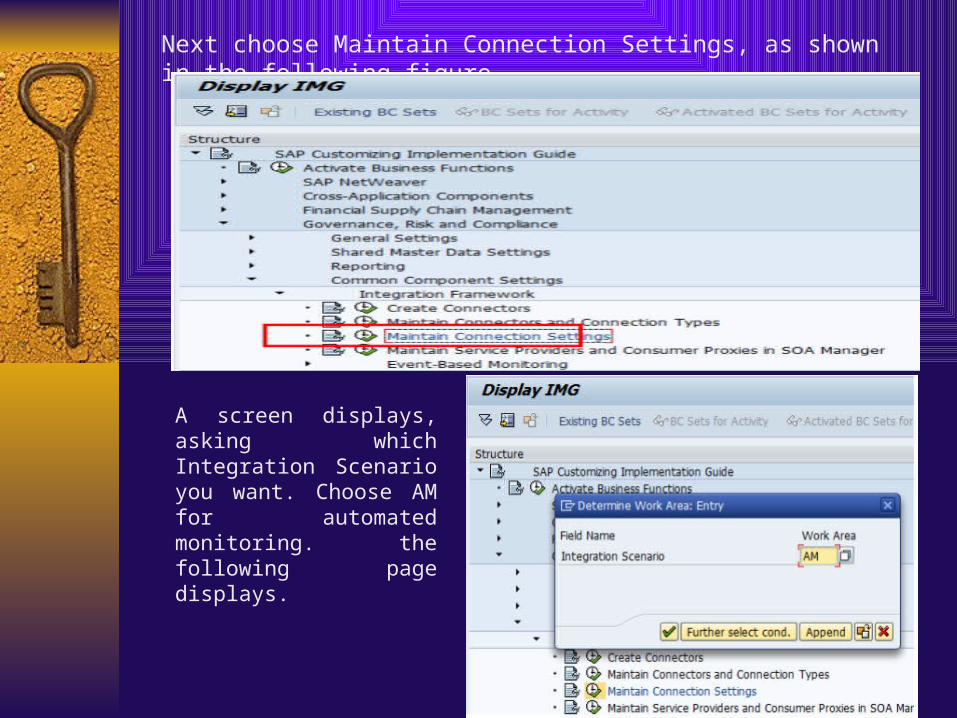
Next choose Maintain Connection Settings, as shown in the following figure.
A screen displays, asking which Integration Scenario you want. Choose AM for automated monitoring. the following page displays.
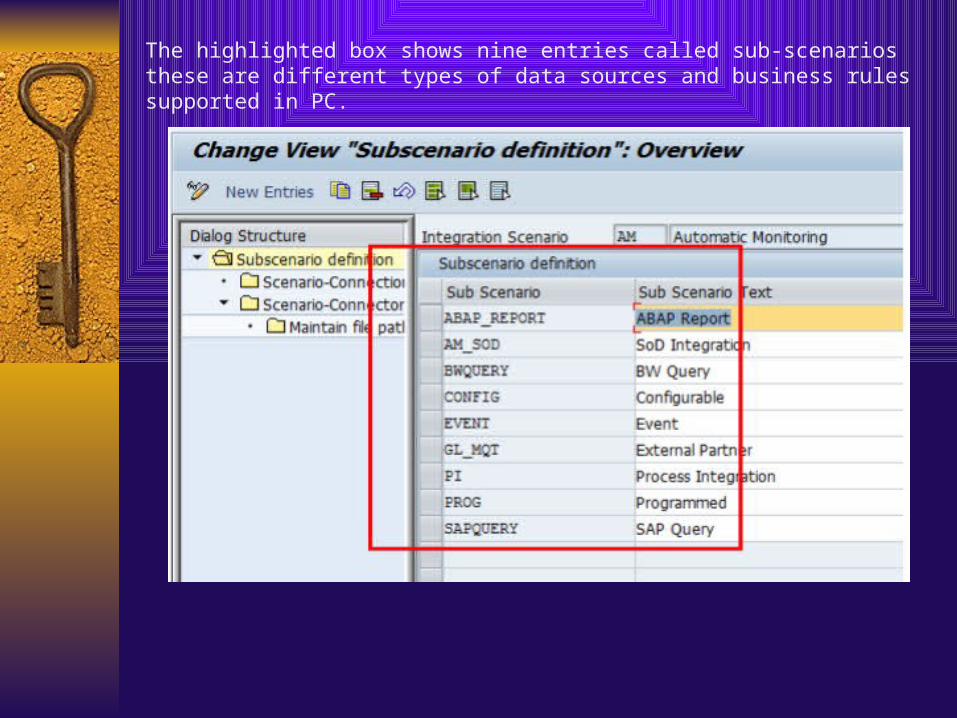
The highlighted box shows nine entries called sub-scenarios these are different types of data sources and business rules supported in PC.
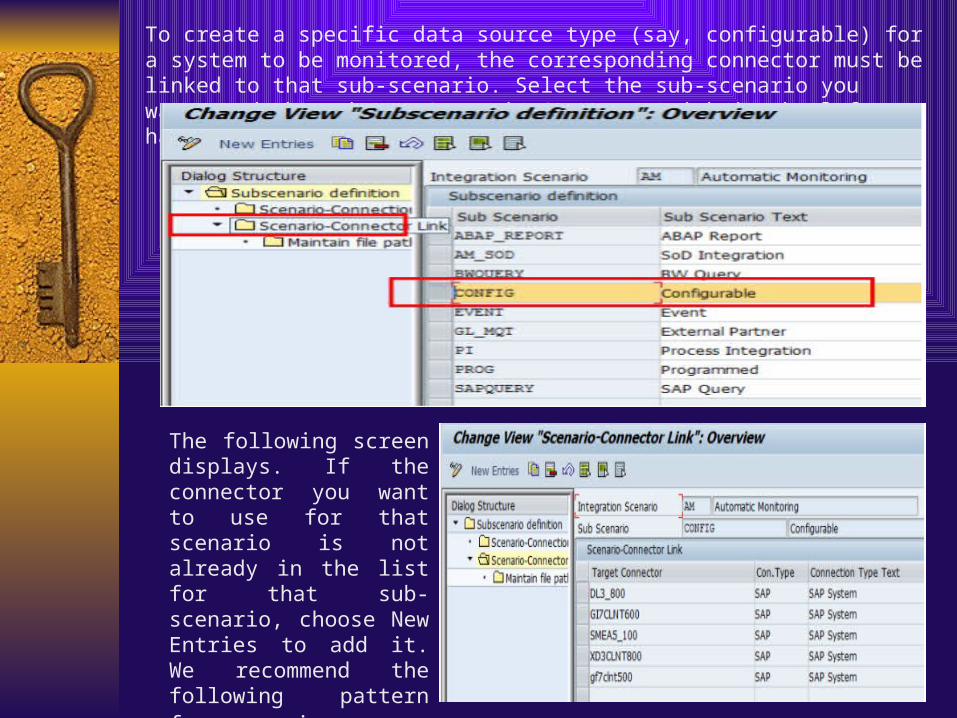
To create a specific data source type (say, configurable) for a system to be monitored, the corresponding connector must be linked to that sub-scenario. Select the sub-scenario you want, and then choose Scenario Connector Link in the left-hand panel, as follows
The following screen displays. If the connector you want to use for that scenario is not already in the list for that sub-scenario, choose New Entries to add it. We recommend the following pattern for convenience.
Master -Data Preparation
Before monitoring rules can be scheduled to run, they must be hooked up to the regulations, controls, and business processes, which are master data for PC.
Monitoring Methods
a) Data Sources in PC 10.0 encapsulate many different ways PC can extract data out of monitored systems, while still presenting a uniform interface to rule designers who want to filter and manipulate the data they extract.
b) Business Rules hold the processing logic for such filters, calculations and the logic to determine if any extracted data represents a problem which control owners need to review or remedy.
Design-time
All design-time user interfaces are located under ―Rule Setup‖ in the top-level toolbar, as highlighted in the following figure.
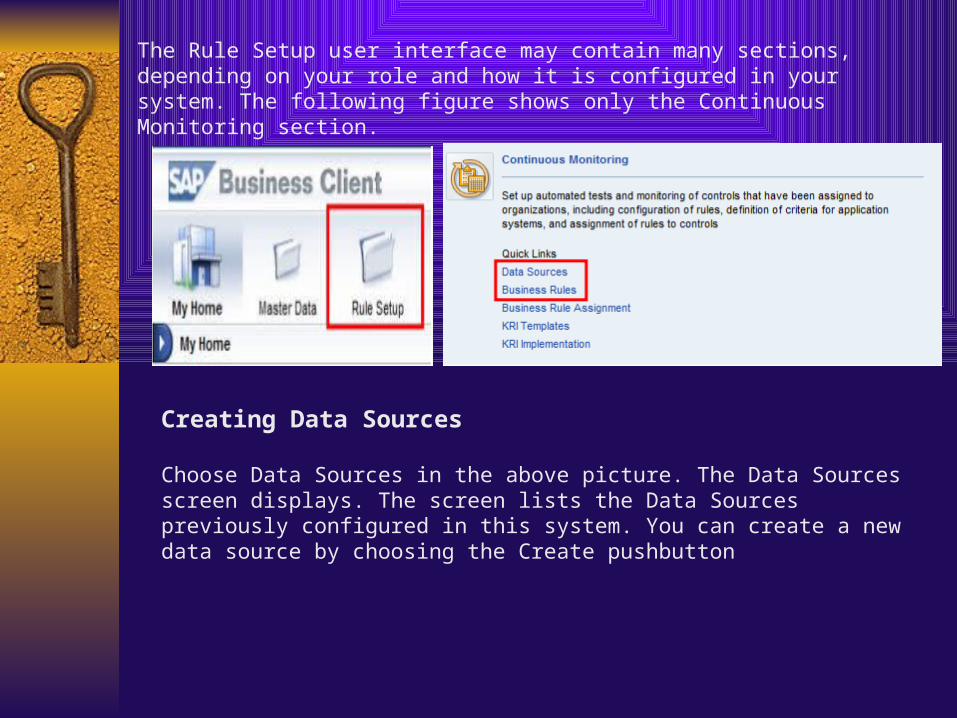
The Rule Setup user interface may contain many sections, depending on your role and how it is configured in your system. The following figure shows only the Continuous Monitoring section.
Creating Data Sources
Choose Data Sources in the above picture. The Data Sources screen displays. The screen lists the Data Sources previously configured in this system. You can create a new data source by choosing the Create pushbutton
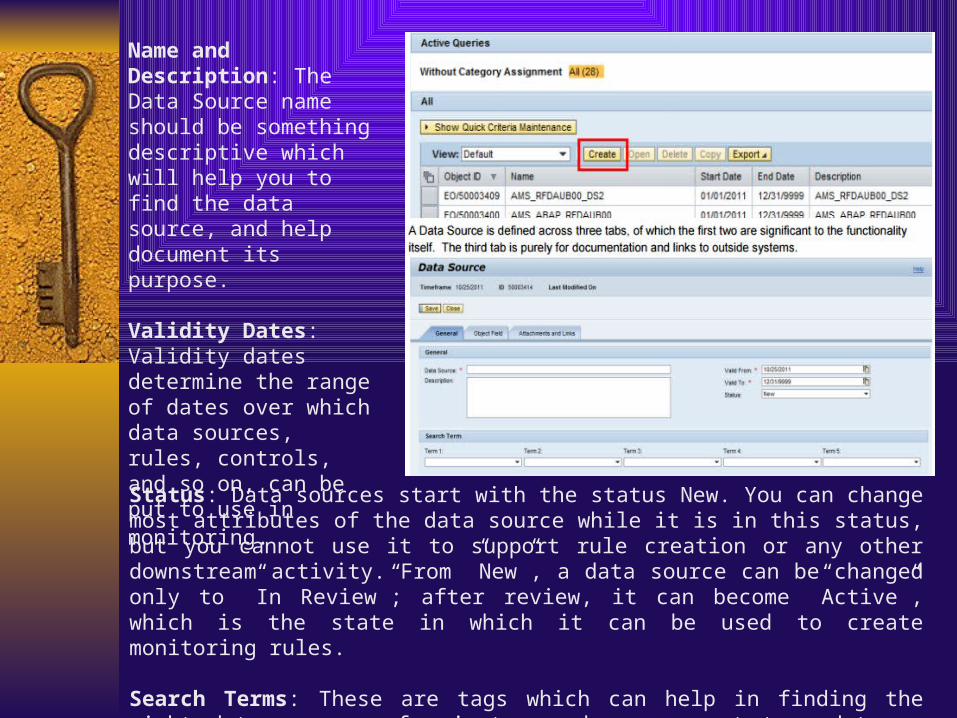
Name and Description: The Data Source name should be something descriptive which will help you to find the data source, and help document its purpose.
Validity Dates: Validity dates determine the range of dates over which data sources, rules, controls, and so on, can be put to use in monitoring.
Status: Data sources start with the status New. You can change most attributes of the data source while it is in this status, but you cannot use it to support rule creation or any other downstream activity. From ”New”, a data source can be changed only to ”In Review”; after review, it can become ”Active”, which is the state in which it can be used to create monitoring rules.
Search Terms: These are tags which can help in finding the right data sources, for instance when you want to update or edit a data source, or you want to find one to reference when creating business rules.
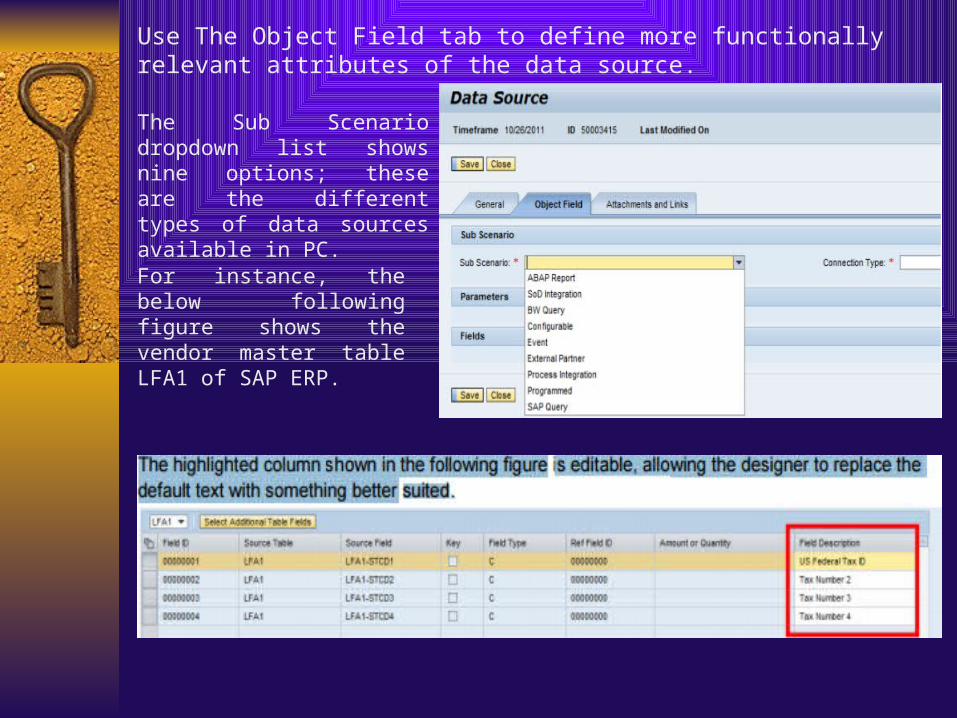
Use The Object Field tab to define more functionally relevant attributes of the data source.
The Sub Scenario dropdown list shows nine options; these are the different types of data sources available in PC.
For instance, the below following figure shows the vendor master table LFA1 of SAP ERP.
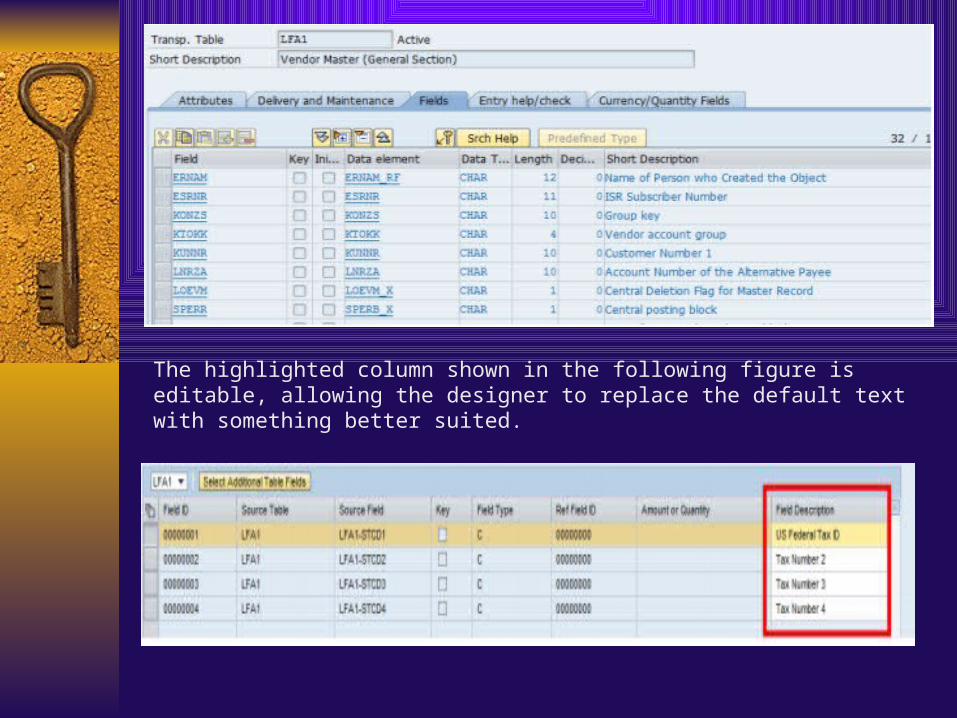
The highlighted column shown in the following figure is editable, allowing the designer to replace the default text with something better suited.
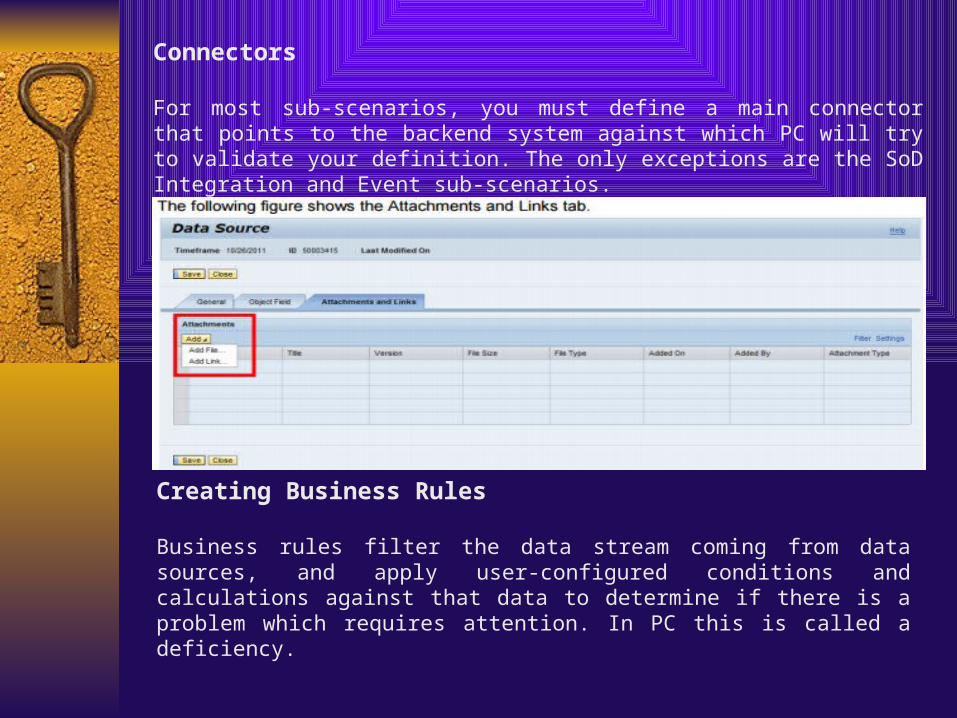
Connectors
For most sub-scenarios, you must define a main connector that points to the backend system against which PC will try to validate your definition. The only exceptions are the SoD Integration and Event sub-scenarios.
Creating Business Rules
Business rules filter the data stream coming from data sources, and apply user-configured conditions and calculations against that data to determine if there is a problem which requires attention. In PC this is called a deficiency.
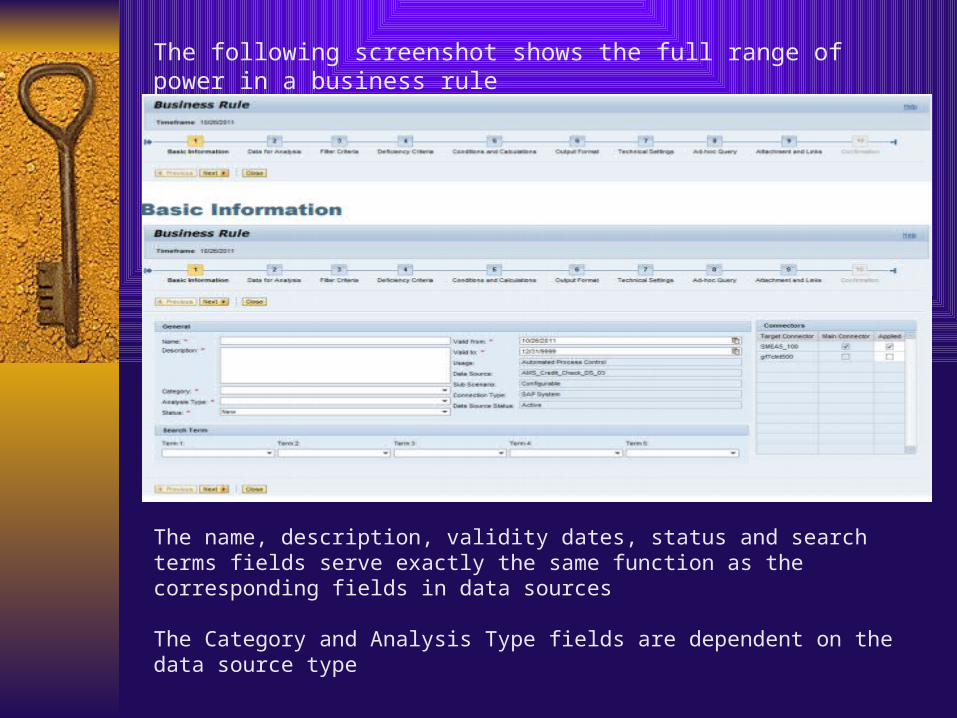
The following screenshot shows the full range of power in a business rule
The name, description, validity dates, status and search terms fields serve exactly the same function as the corresponding fields in data sources
The Category and Analysis Type fields are dependent on the data source type
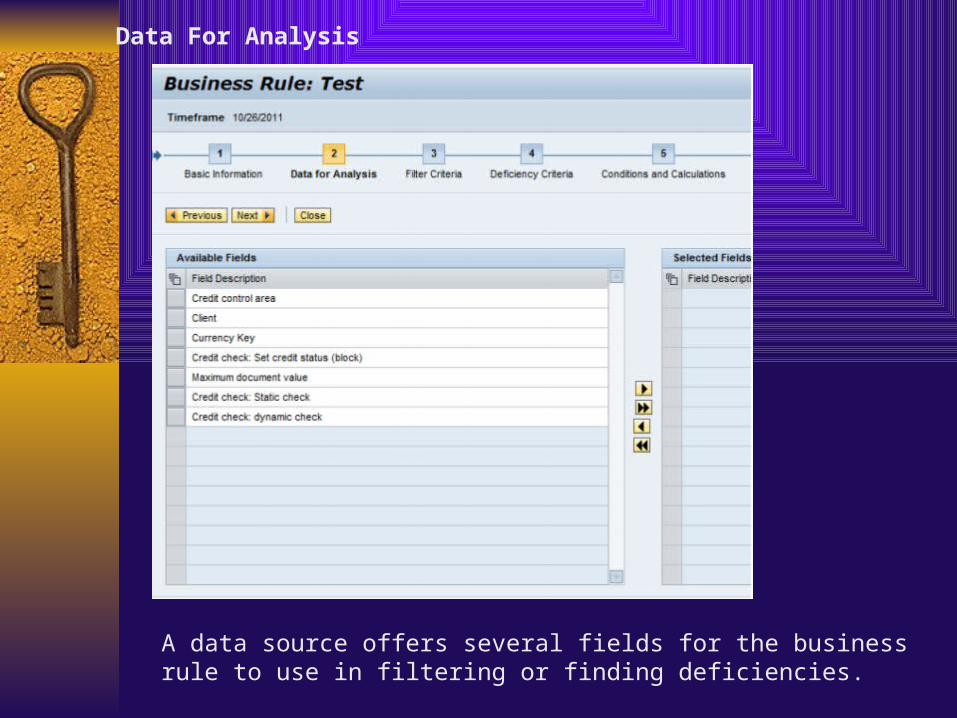
Data For Analysis
A data source offers several fields for the business rule to use in filtering or finding deficiencies.
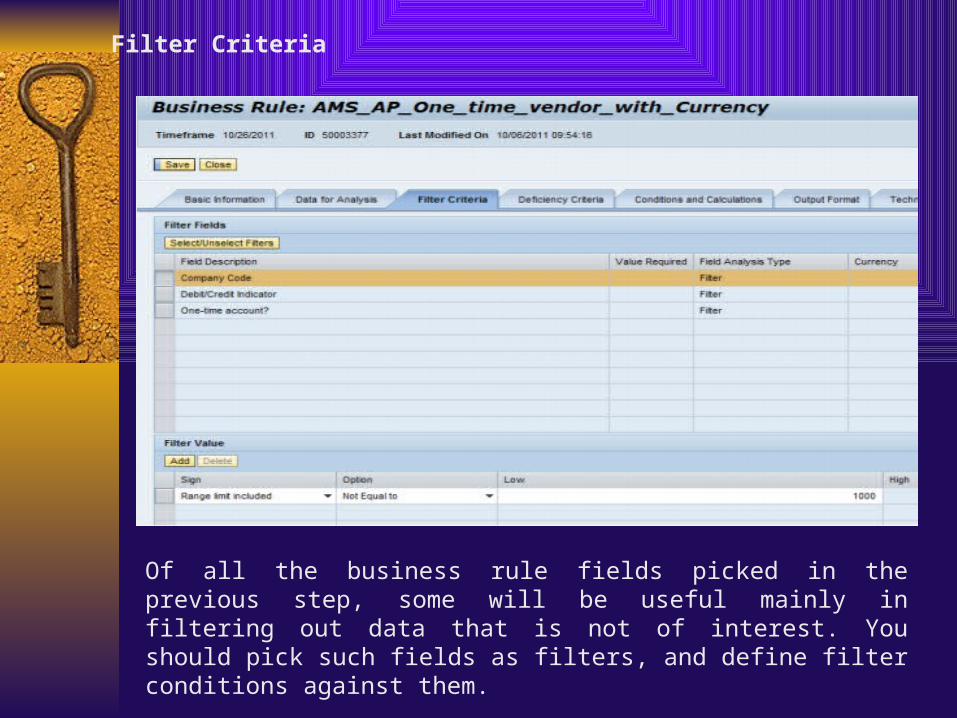
Filter Criteria
Of all the business rule fields picked in the previous step, some will be useful mainly in filtering out data that is not of interest. You should pick such fields as filters, and define filter conditions against them.
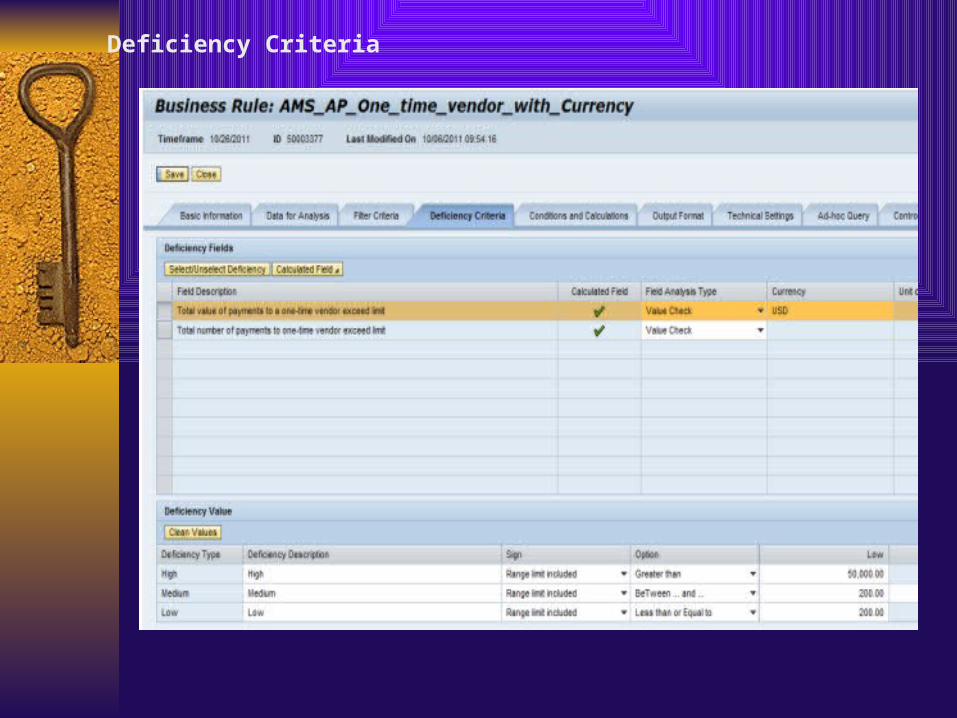
Deficiency Criteria
Conditions and Calculations
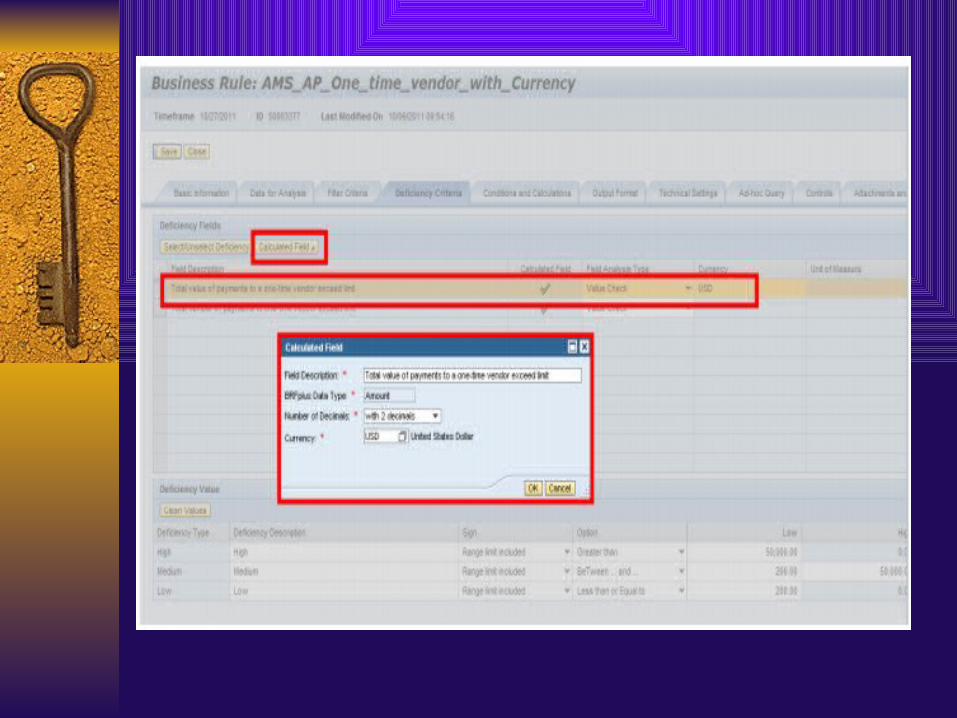
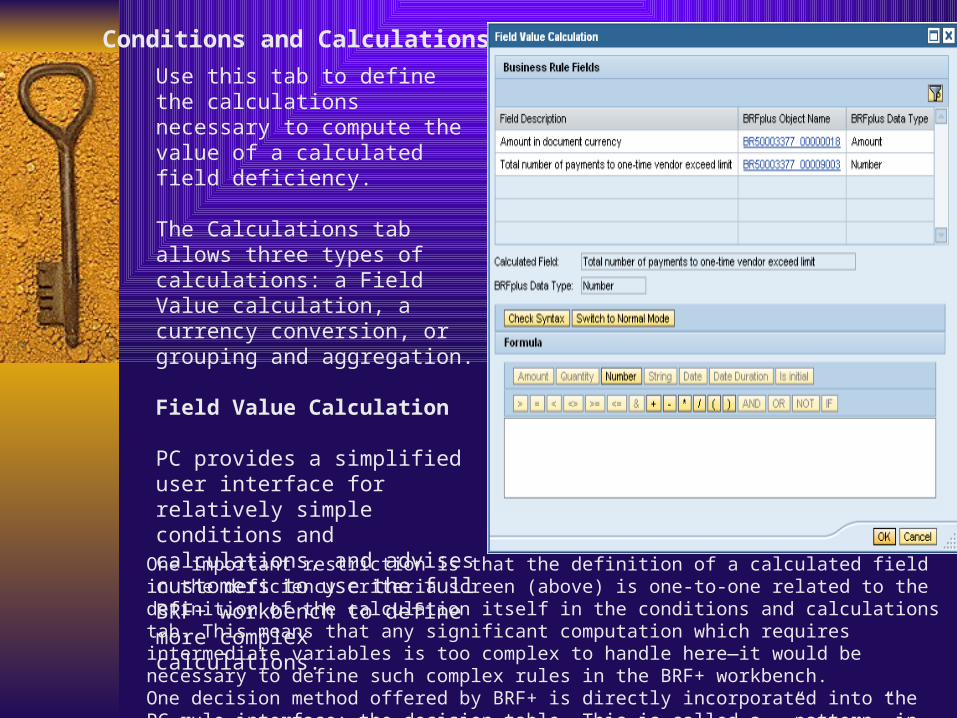
Use this tab to define the calculations necessary to compute the value of a calculated field deficiency.
The Calculations tab allows three types of calculations: a Field Value calculation, a currency conversion, or grouping and aggregation.
Field Value Calculation
PC provides a simplified user interface for relatively simple conditions and calculations, and advises customers to use the full BRF+ workbench to define more complex calculations.
One important restriction is that the definition of a calculated field in the deficiency criteria screen (above) is one-to-one related to the definition of the calculation itself in the conditions and calculations tab. This means that any significant computation which requires intermediate variables is too complex to handle here—it would be necessary to define such complex rules in the BRF+ workbench.One decision method offered by BRF+ is directly incorporated into the PC rule interface: the decision table. This is called a ―”pattern” in the PC 10.0 interface, and is available only for the change log check category of business rule.
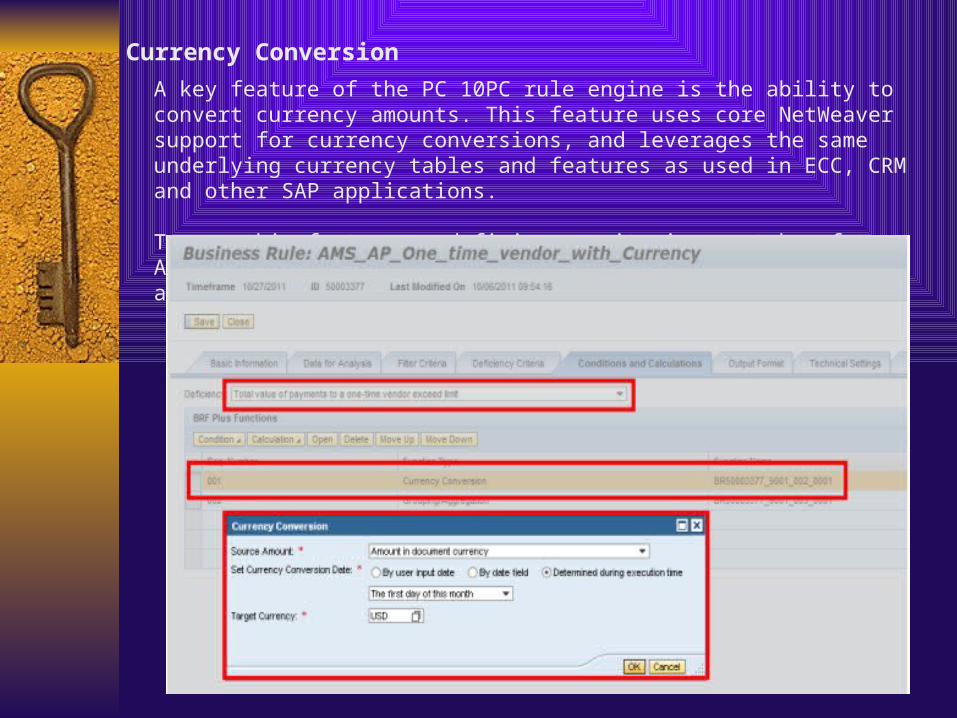
Currency Conversion
A key feature of the PC 10PC rule engine is the ability to convert currency amounts. This feature uses core NetWeaver support for currency conversions, and leverages the same underlying currency tables and features as used in ECC, CRM and other SAP applications.
To use this feature, a deficiency criterion must be of type Amount, and the same must be true of one of the fields available in the rule.
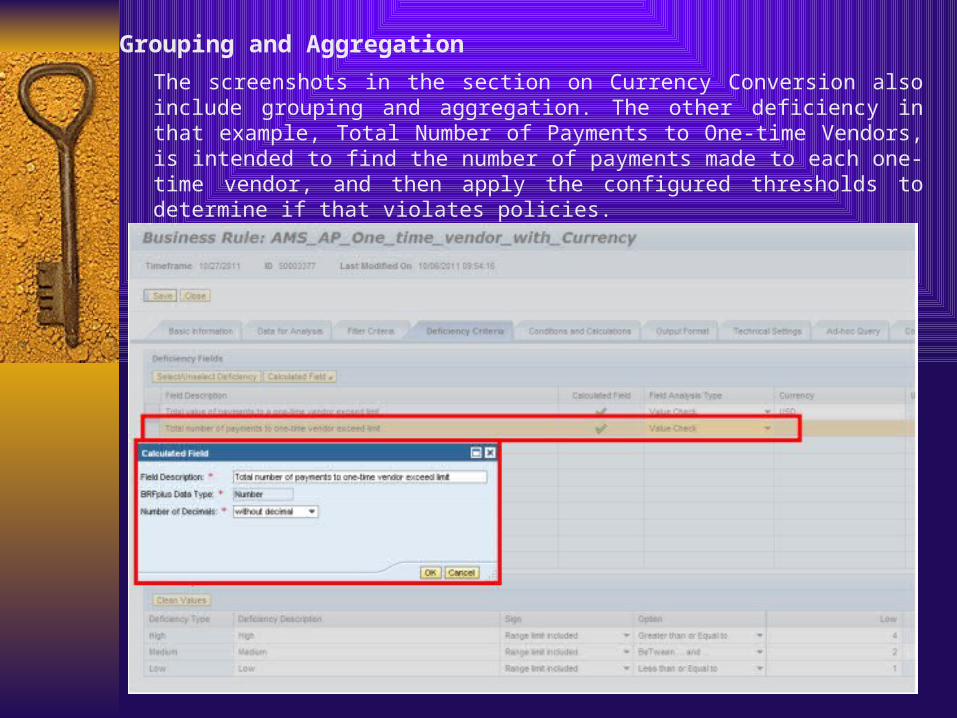
Grouping and Aggregation
The screenshots in the section on Currency Conversion also include grouping and aggregation. The other deficiency in that example, Total Number of Payments to One-time Vendors, is intended to find the number of payments made to each one-time vendor, and then apply the configured thresholds to determine if that violates policies.
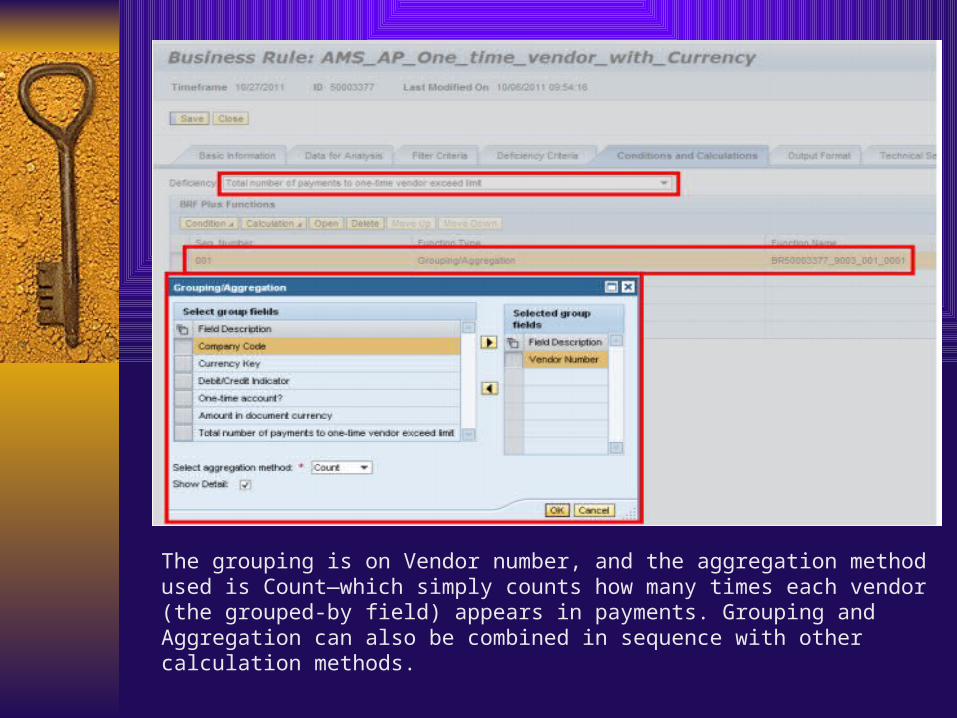
The grouping is on Vendor number, and the aggregation method used is Count—which simply counts how many times each vendor (the grouped-by field) appears in payments. Grouping and Aggregation can also be combined in sequence with other calculation methods.
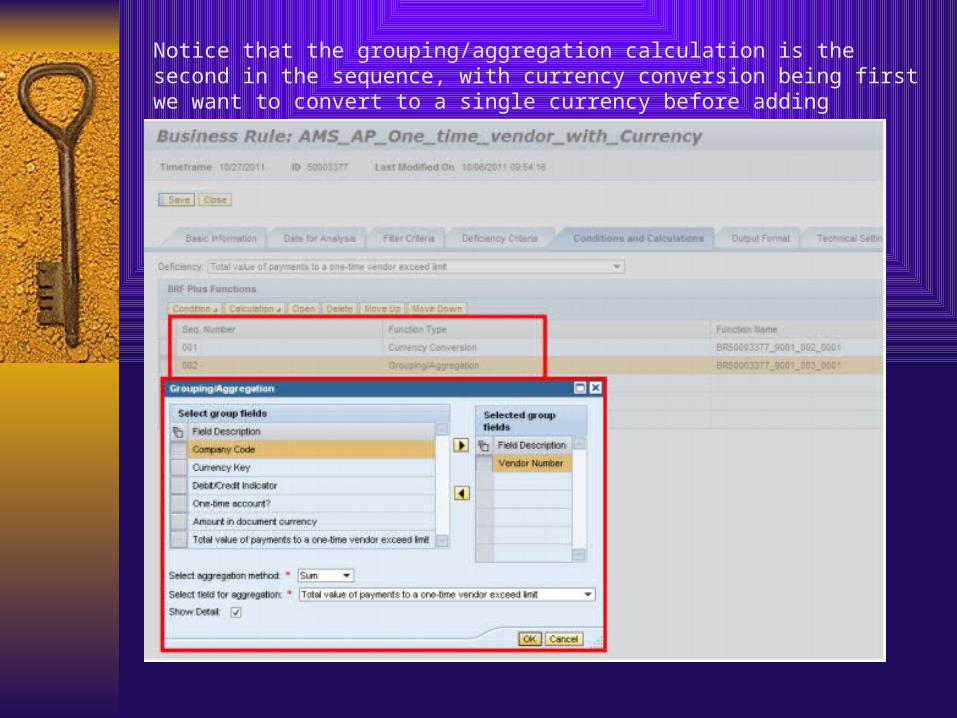
Notice that the grouping/aggregation calculation is the second in the sequence, with currency conversion being first we want to convert to a single currency before adding
BRF+ Workbench
To leverage the full power of BRF+, first create a stub PC Business Rule, and use the generated rule ID
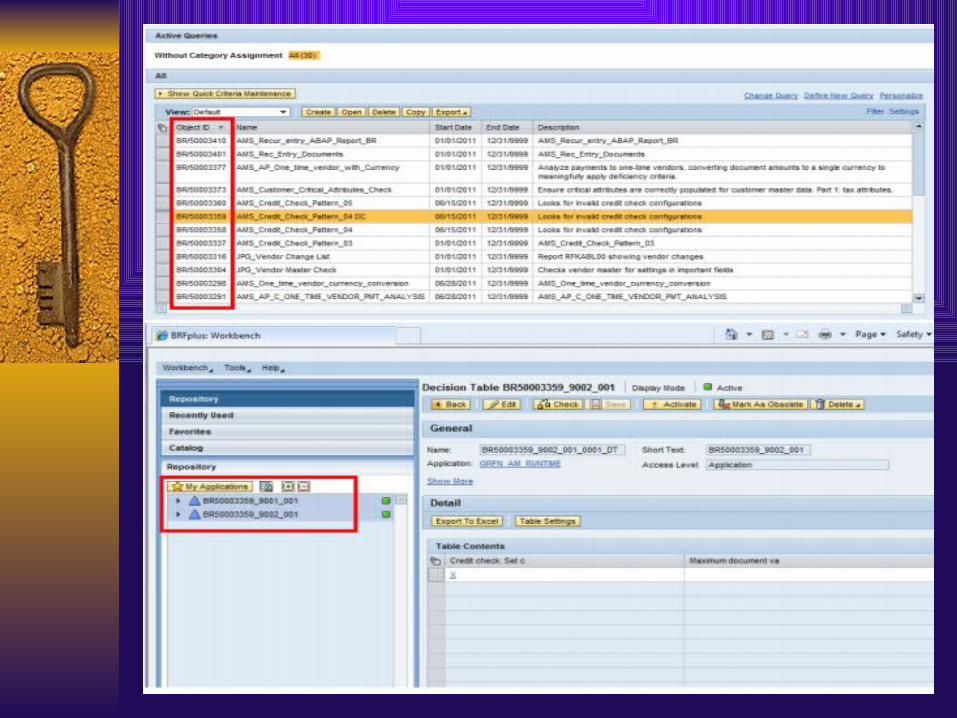
You must know the technical ID of the rule you created, which you can see in the following screenshot of the PC Business Rule finder page. The technical object ID of each rule is displayed in the left-most column. This technical ID serves as the base, or first part, of the BRF+ rule ID in the BRF+ workbench.
The easiest way to find the corresponding BRF+ rule in the BRF+ workbench is to paste this ID, add the wildcard character ‗*‘ to it, and then search. In the left-hand panel of the BRF+ workbench screenshot, there are two BRF+ rules with the same base ID as the PC 10 rule. this is because BRF+ creates new versions of every such rule each time it is changed.
Output Format
This section is common to all business rule/data source types, and arranges the output of any detected deficiencies in the left-to-right column order specified. You can also hide unwanted columns here.
Technical Settings
These primarily affect the execution and performance of monitoring. Most data sources will allow users to cap the maximum amount of data they will process, as a performance management feature.
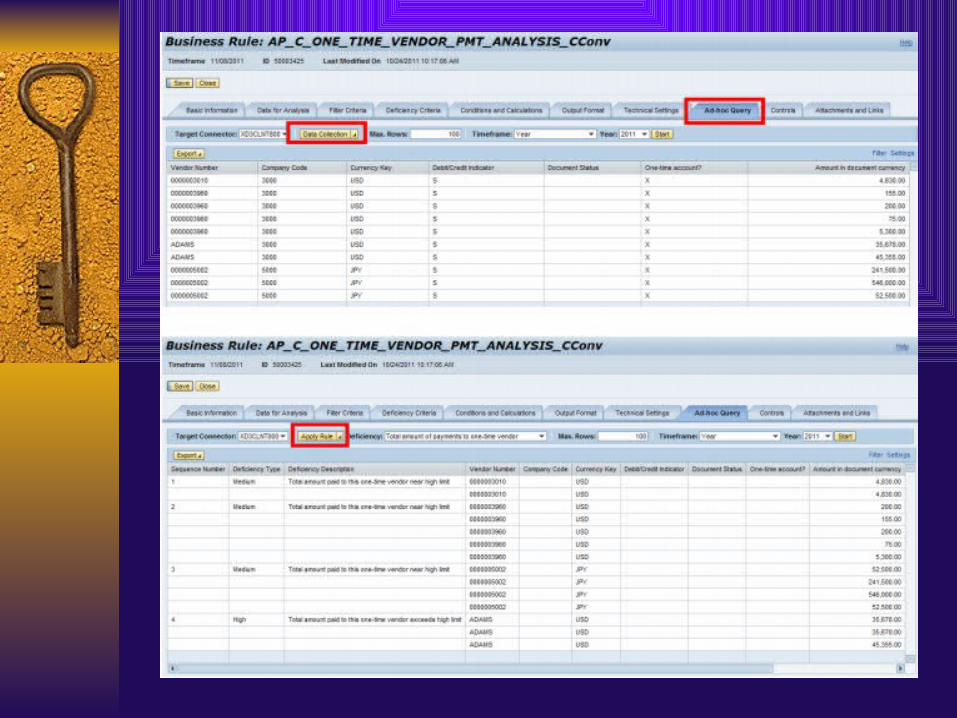
Ad Hoc Query
This is useful for configurable business rules and data sources, which are designed and implemented directly from the PC user interface.
The following screenshots show two modes of ad hoc query operation: one that collects the data as the data source would, and another that applies the rule logic to filter the data and then apply deficiency logic.
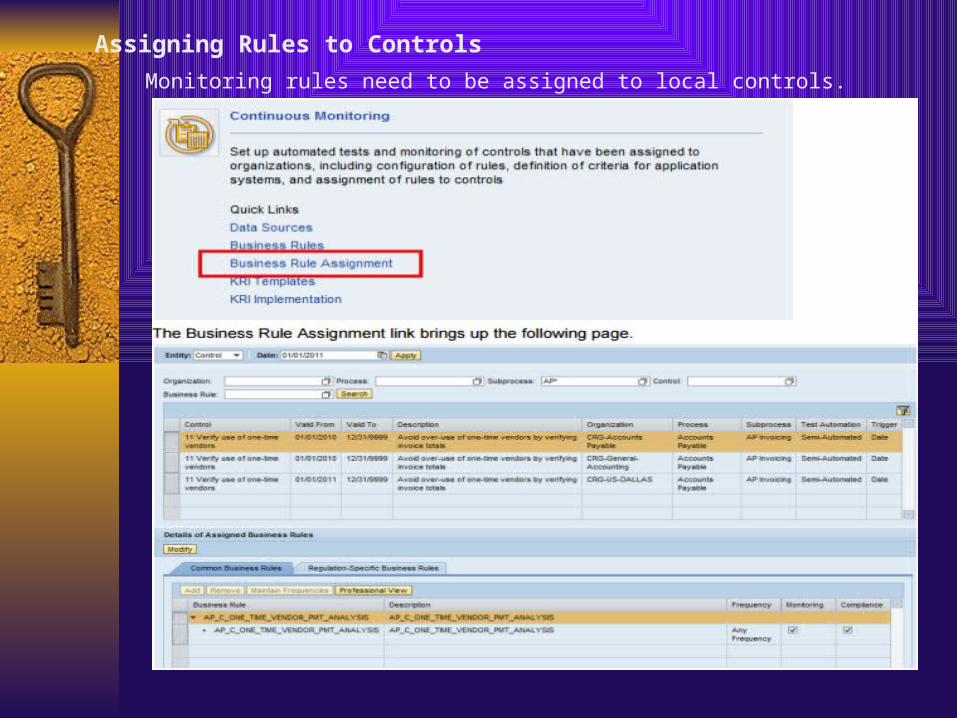
Assigning Rules to Controls
Monitoring rules need to be assigned to local controls.
The search widget at the top of this page lets you search for local controls that is, controls assigned to a particular organization node. The next step is to select it in the middle part of the screen, by clicking on its row.
You then modify the business rules assigned to it by choosing the Modify pushbutton, and then choosing the Add pushbutton in the bottom portion of the screen. A screen displays that allows you to search through Business Rules in the Active state, which you can then assign to the local control.
You can also modify existing assignments and maintain frequencies of monitoring or compliance checks. Once this assignment step is complete, you will be able to schedule the monitoring rule in the Automated Monitoring scheduler.
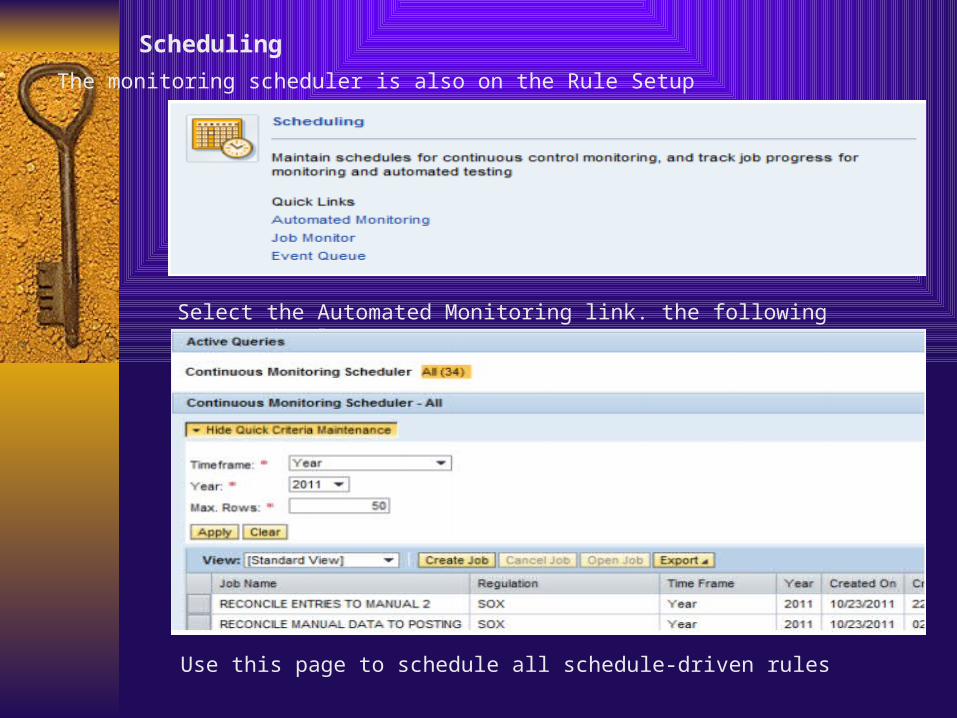
Scheduling
The monitoring scheduler is also on the Rule Setup
Select the Automated Monitoring link. the following screen displays
Use this page to schedule all schedule-driven rules
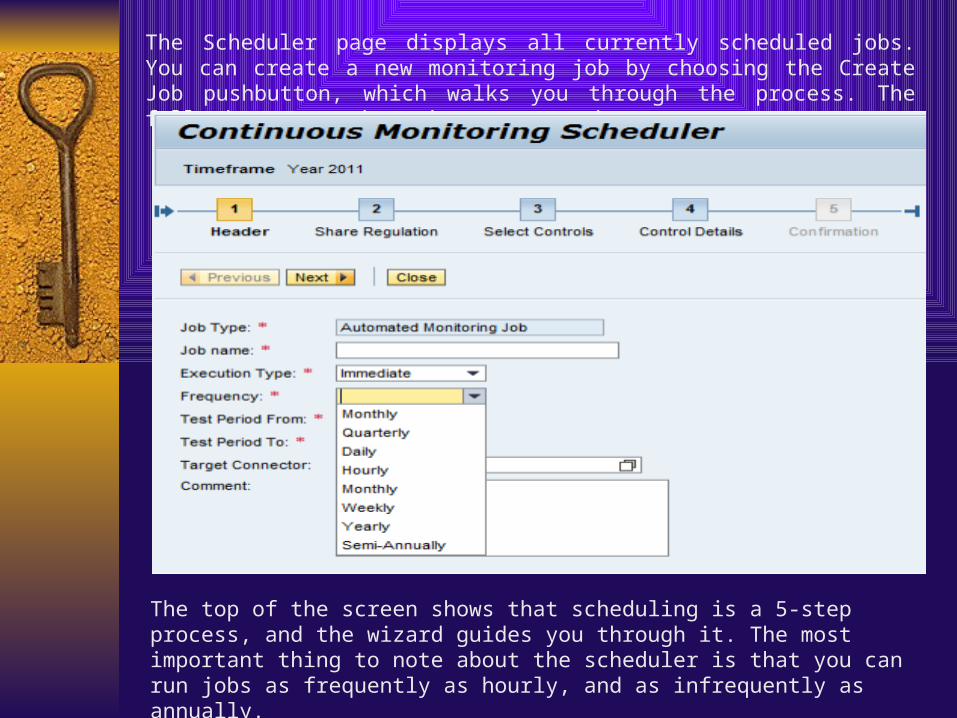
The Scheduler page displays all currently scheduled jobs. You can create a new monitoring job by choosing the Create Job pushbutton, which walks you through the process. The following screenshot gives an overview.
The top of the screen shows that scheduling is a 5-step process, and the wizard guides you through it. The most important thing to note about the scheduler is that you can run jobs as frequently as hourly, and as infrequently as annually.
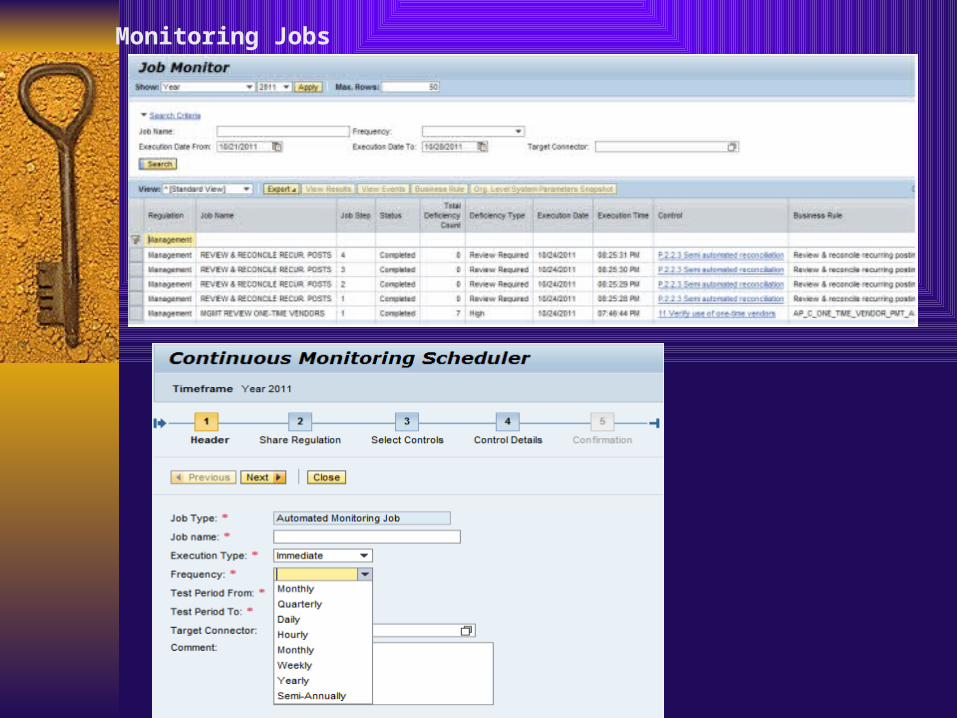
Monitoring Jobs
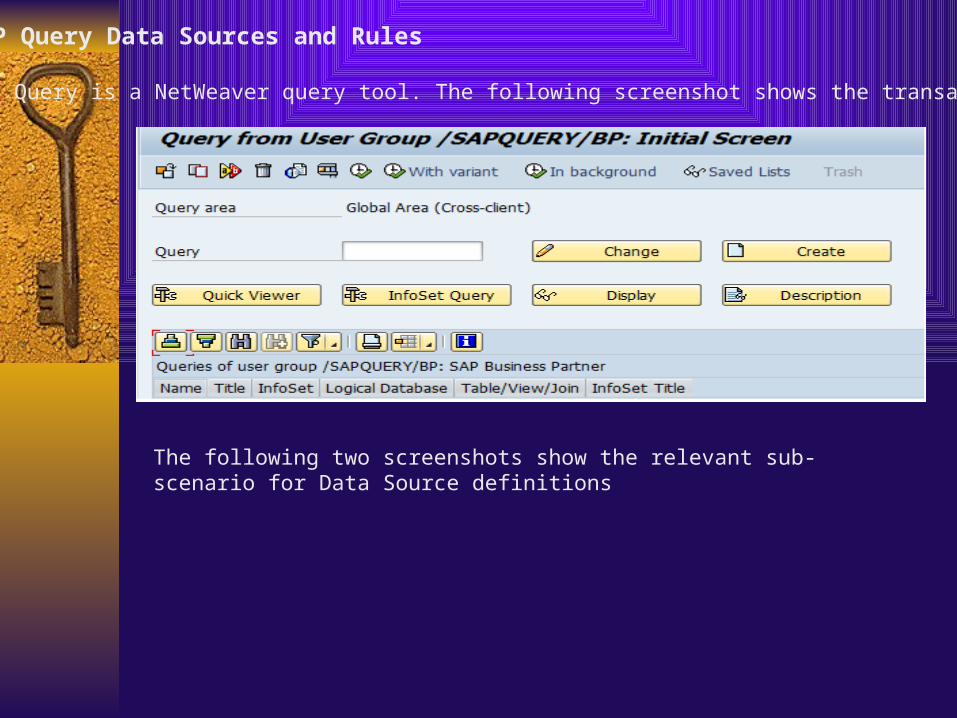
SAP Query Data Sources and Rules
SAP Query is a NetWeaver query tool. The following screenshot shows the transaction SQ01.
The following two screenshots show the relevant sub-scenario for Data Source definitions
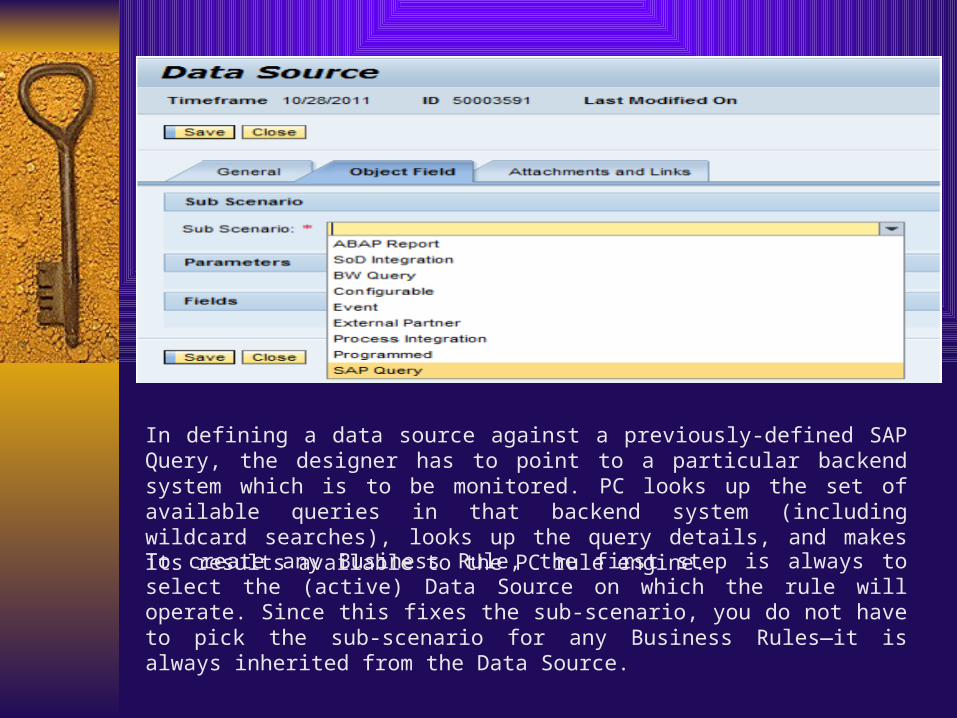
In defining a data source against a previously-defined SAP Query, the designer has to point to a particular backend system which is to be monitored. PC looks up the set of available queries in that backend system (including wildcard searches), looks up the query details, and makes its results available to the PC rule engine.
To create any Business Rule, the first step is always to select the (active) Data Source on which the rule will operate. Since this fixes the sub-scenario, you do not have to pick the sub-scenario for any Business Rules—it is always inherited from the Data Source.
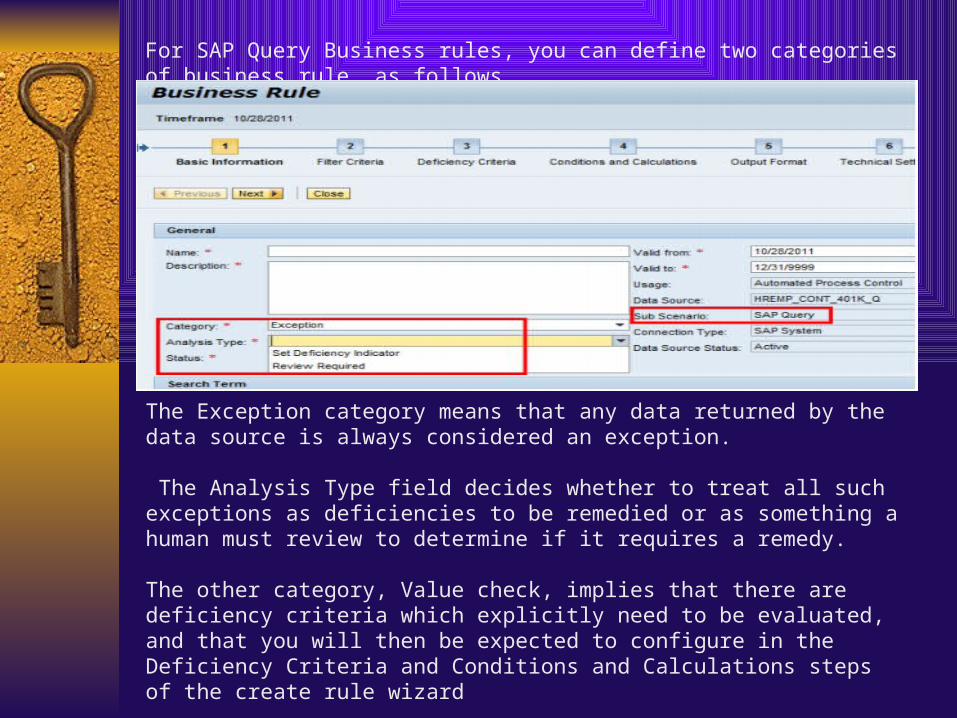
For SAP Query Business rules, you can define two categories of business rule, as follows
The Exception category means that any data returned by the data source is always considered an exception.
The Analysis Type field decides whether to treat all such exceptions as deficiencies to be remedied or as something a human must review to determine if it requires a remedy.
The other category, Value check, implies that there are deficiency criteria which explicitly need to be evaluated, and that you will then be expected to configure in the Deficiency Criteria and Conditions and Calculations steps of the create rule wizard
A configurable data source defines a query against tables in the monitored backend system (such as ECC/ERP, SRM, and so on).
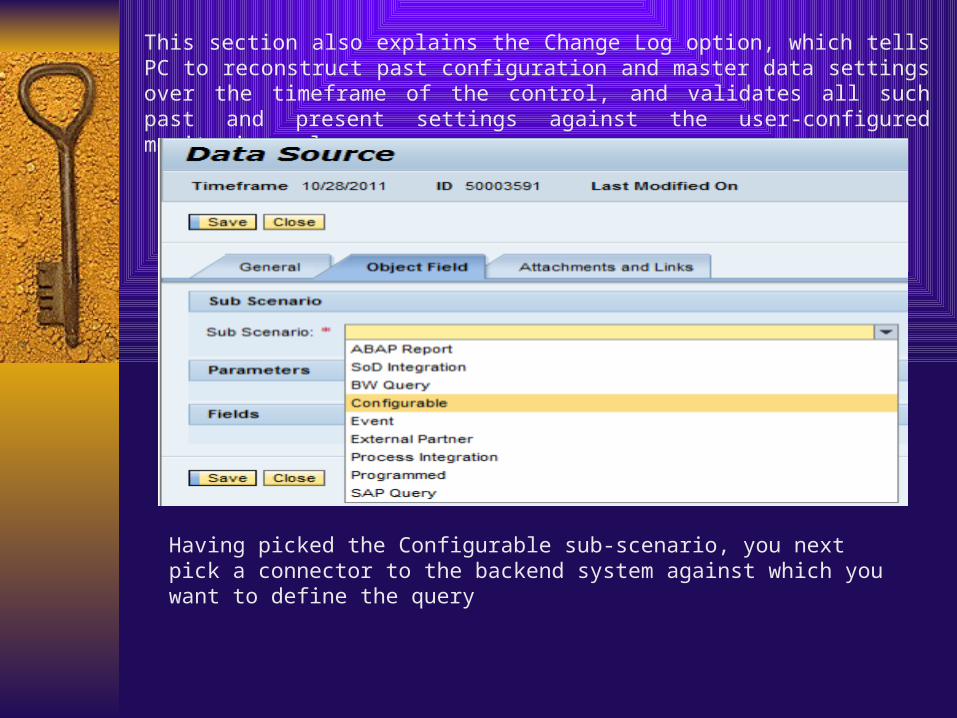
This section also explains the Change Log option, which tells PC to reconstruct past configuration and master data settings over the timeframe of the control, and validates all such past and present settings against the user-configured monitoring rule.
Having picked the Configurable sub-scenario, you next pick a connector to the backend system against which you want to define the query
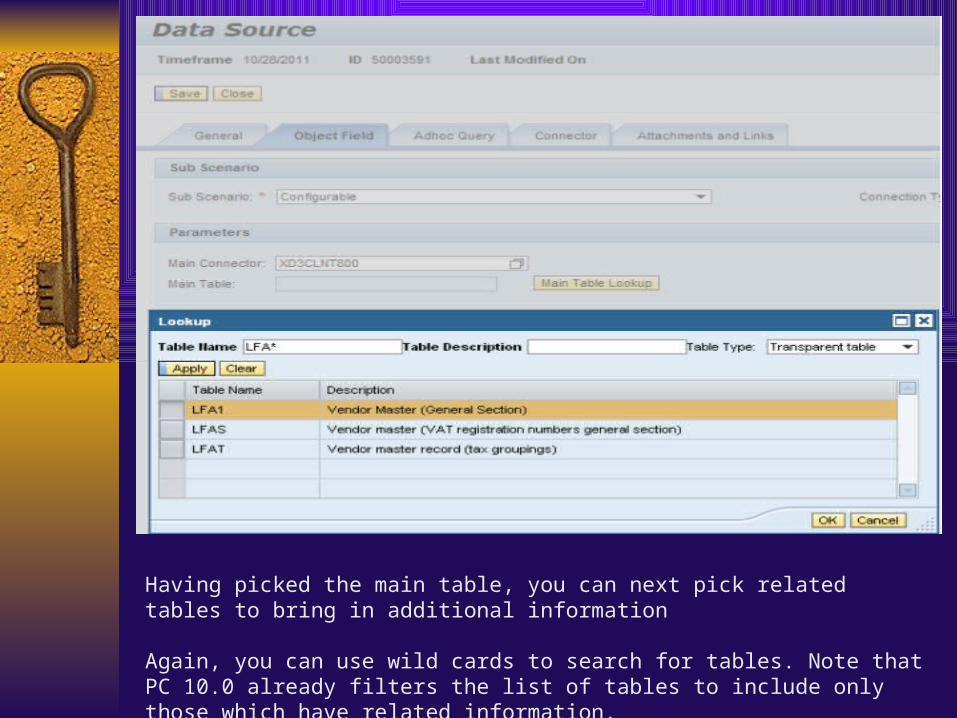
Having picked the main table, you can next pick related tables to bring in additional information
Again, you can use wild cards to search for tables. Note that PC 10.0 already filters the list of tables to include only those which have related information.
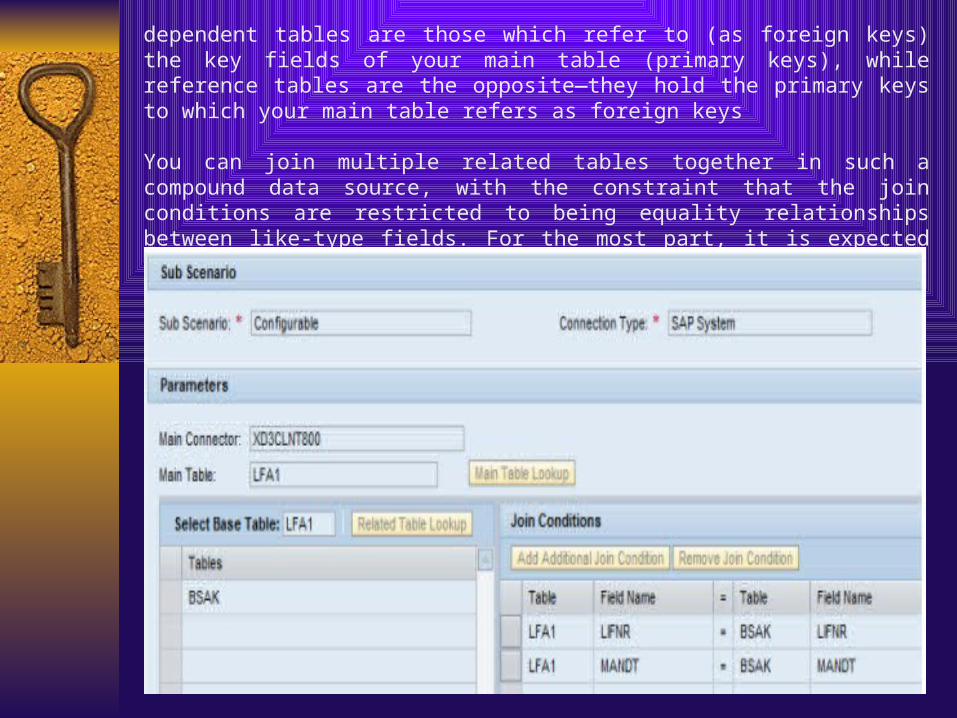
dependent tables are those which refer to (as foreign keys) the key fields of your main table (primary keys), while reference tables are the opposite—they hold the primary keys to which your main table refers as foreign keys
You can join multiple related tables together in such a compound data source, with the constraint that the join conditions are restricted to being equality relationships between like-type fields. For the most part, it is expected you will join primary keys to foreign keys.
Change Log Data Sources and Rules
A change log rule is a variation on the configurable rule defined previously, and hence is presented as a subsection of that type in this document. It is intended to be used for monitoring configuration and master data tables only.
SAP applications have extensive change-tracking mechanisms for database tables, which guarantee that all changes are captured, even if they are of very short duration.
These mechanisms cover changes made directly in the system, and also changes transported into the system.
So a change log business rule allows you to check the validity of a configuration or master data setting at any time, with confidence that all changes made to that setting will be found and tested for correctness. Wrong configurations are caught, no matter how transiently they were in effect.
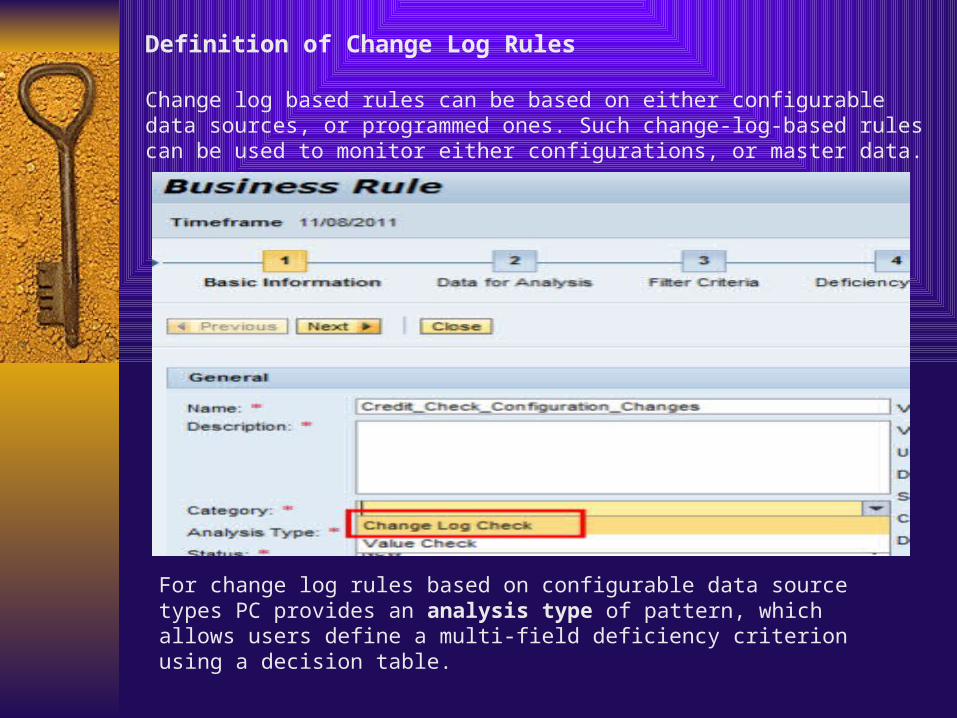
Definition of Change Log Rules
Change log based rules can be based on either configurable data sources, or programmed ones. Such change-log-based rules can be used to monitor either configurations, or master data.
For change log rules based on configurable data source types PC provides an analysis type of pattern, which allows users define a multi-field deficiency criterion using a decision table.
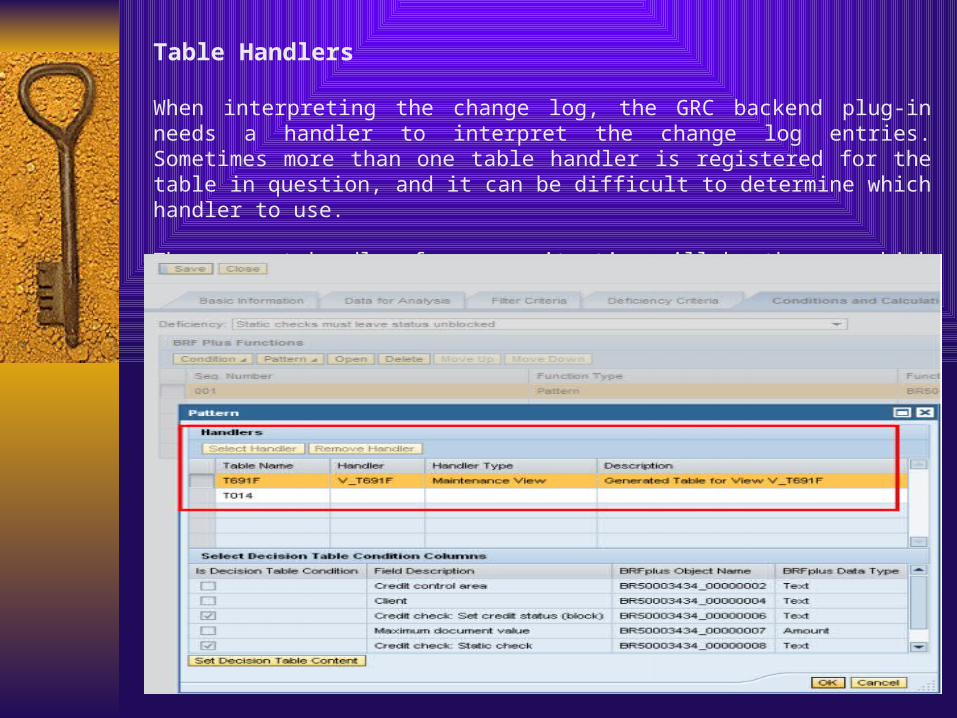
Table Handlers
When interpreting the change log, the GRC backend plug-in needs a handler to interpret the change log entries. Sometimes more than one table handler is registered for the table in question, and it can be difficult to determine which handler to use.
The correct handler for your situation will be the one which makes your deficiency fields available for use in change analysis rule.