Embed Size (px)
Citation preview

Predicting the future without planning*
* some planning will be needed
Dave Longman

0
50
100
150
200
250
300
350
400
Sprint1
Sprint2
Sprint3
Sprint4
Sprint5
Sprint6
Sprint7
Sprint8
Sprint9
Sprint10
Sprint11
Sprint12
Sprint13
Sprint14
Sprint15
Sprint16
Sprint17
Sprint18
Sprint19
Project Progress
Total Points Completed Points
Evidence Based Forecasting
Image by https://www.flickr.com/photos/byzantiumbooks
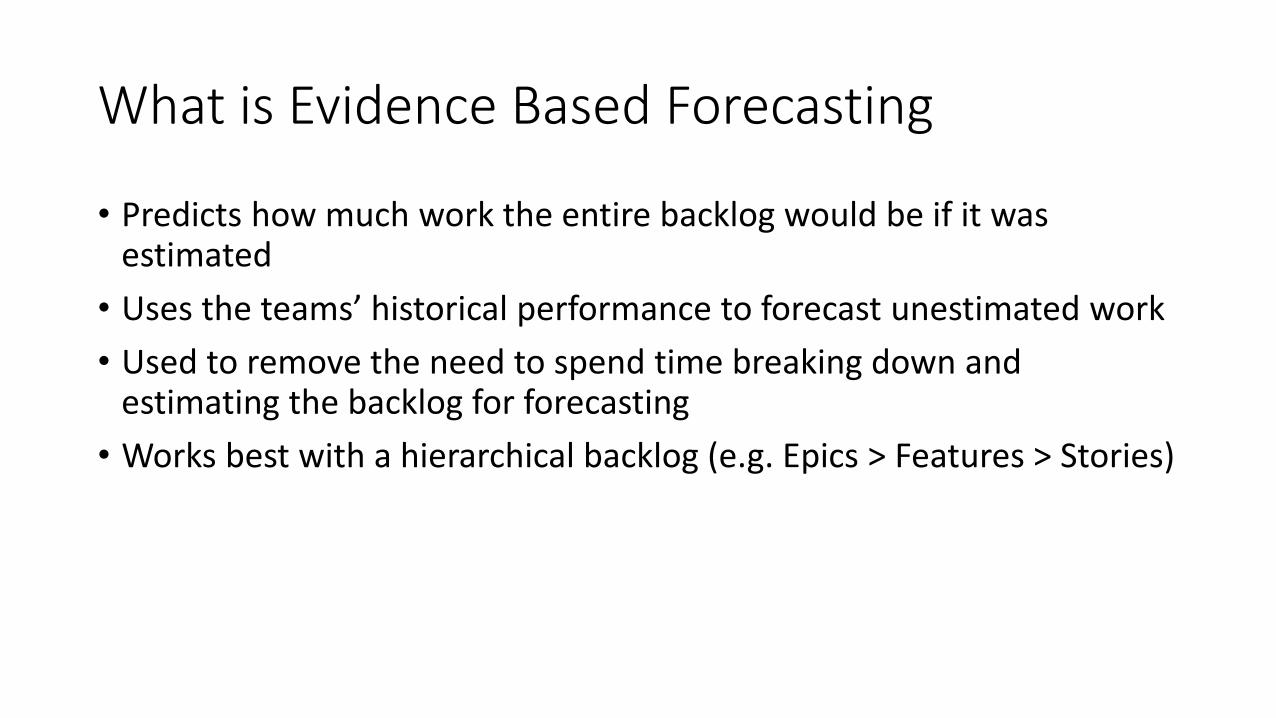
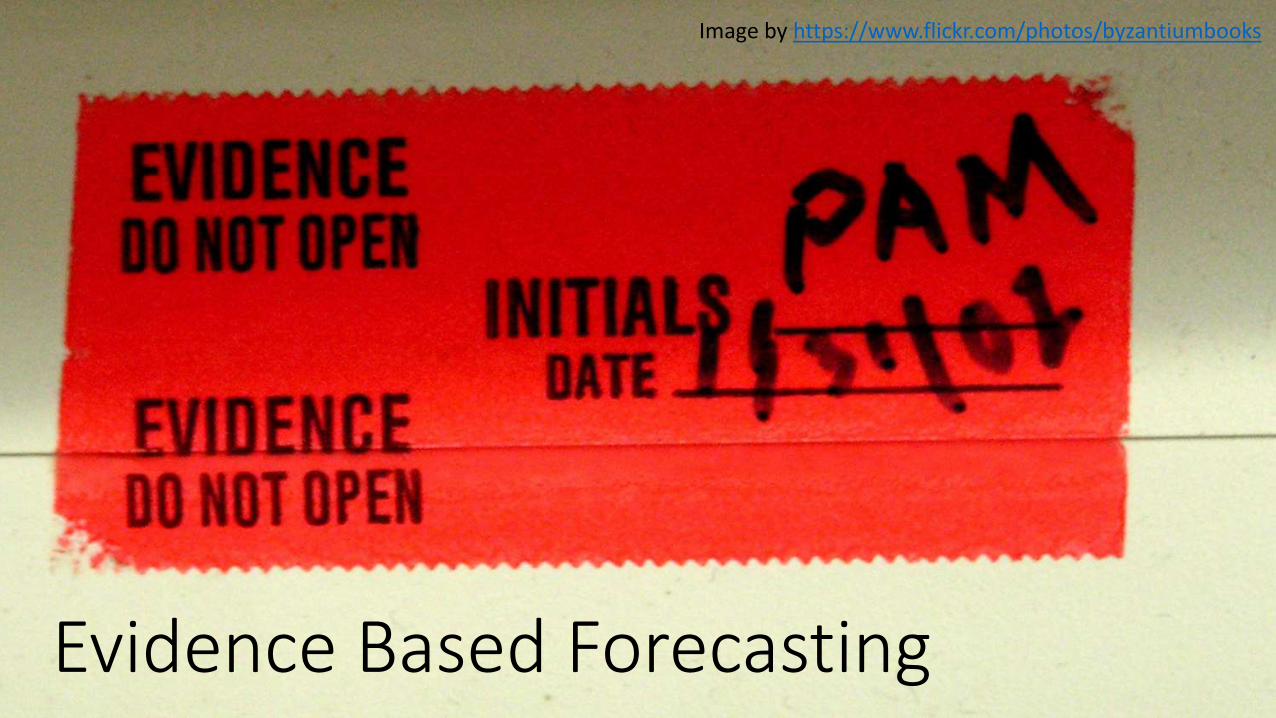
What is Evidence Based Forecasting
• Predicts how much work the entire backlog would be if it was estimated
• Uses the teams’ historical performance to forecast unestimated work
• Used to remove the need to spend time breaking down and estimating the backlog for forecasting
• Works best with a hierarchical backlog (e.g. Epics > Features > Stories)

How does it work?
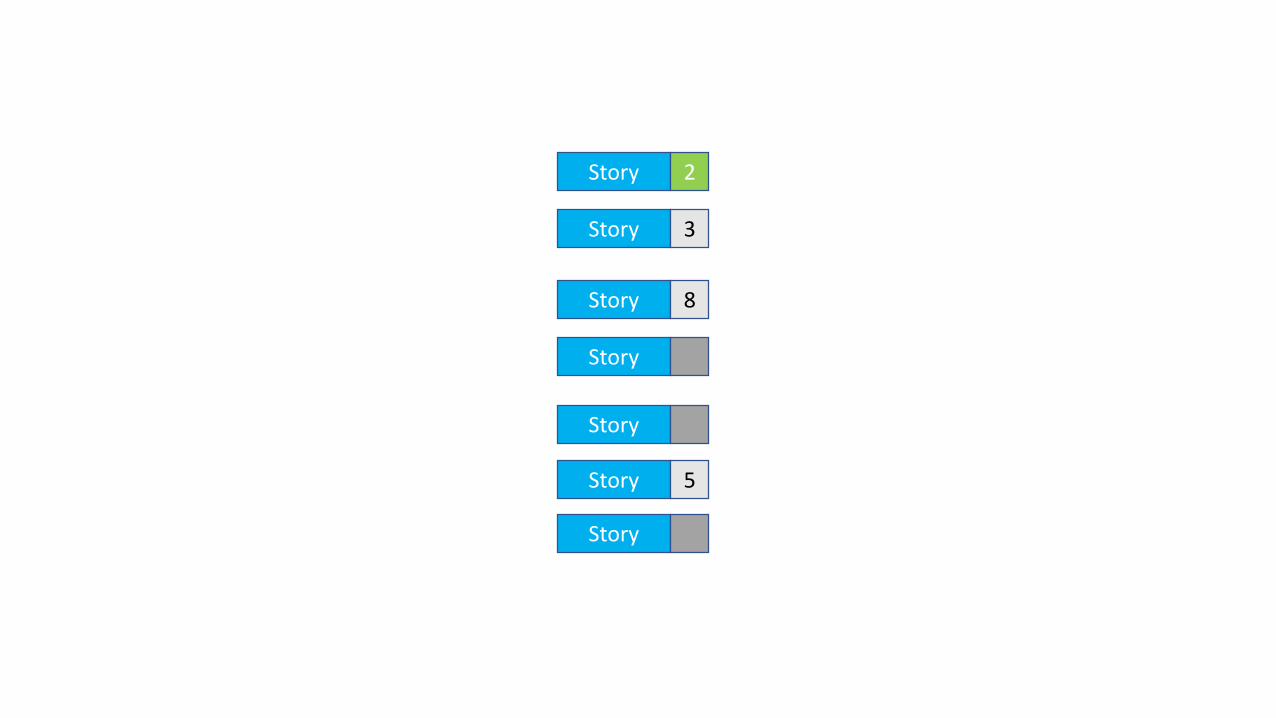
Story 2
Story 3
Story 8
Story 5
Story
Story
Story
Story 2
Story 3
Story 8
Story 5
Story
Story
Story
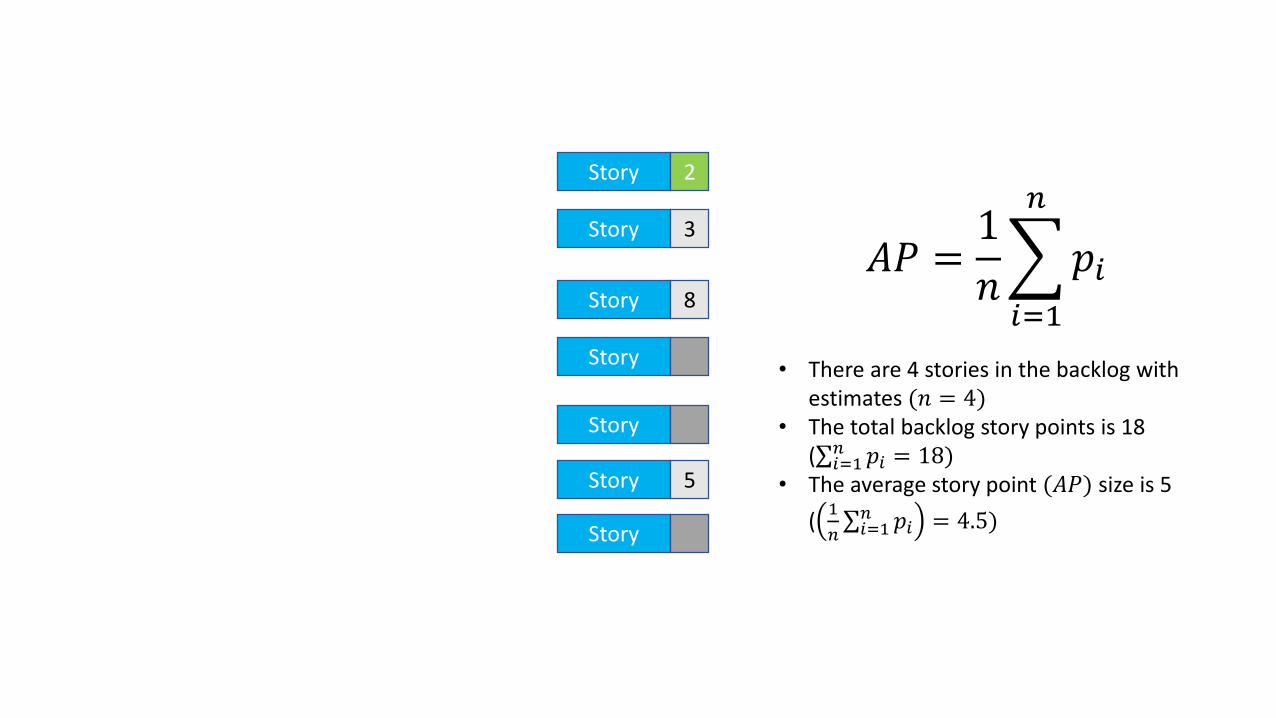
𝐴𝑃 =1
𝑛
𝑖=1
𝑛
𝑝𝑖
• There are 4 stories in the backlog with estimates (𝑛 = 4)
• The total backlog story points is 18 ( 𝑖=1𝑛 𝑝𝑖 = 18)
• The average story point (𝐴𝑃) size is 5
(1
𝑛 𝑖=1𝑛 𝑝𝑖 = 4.5)
Story 2
Story 3
Story 8
Story 5
Story 5
Story 5
Story 5
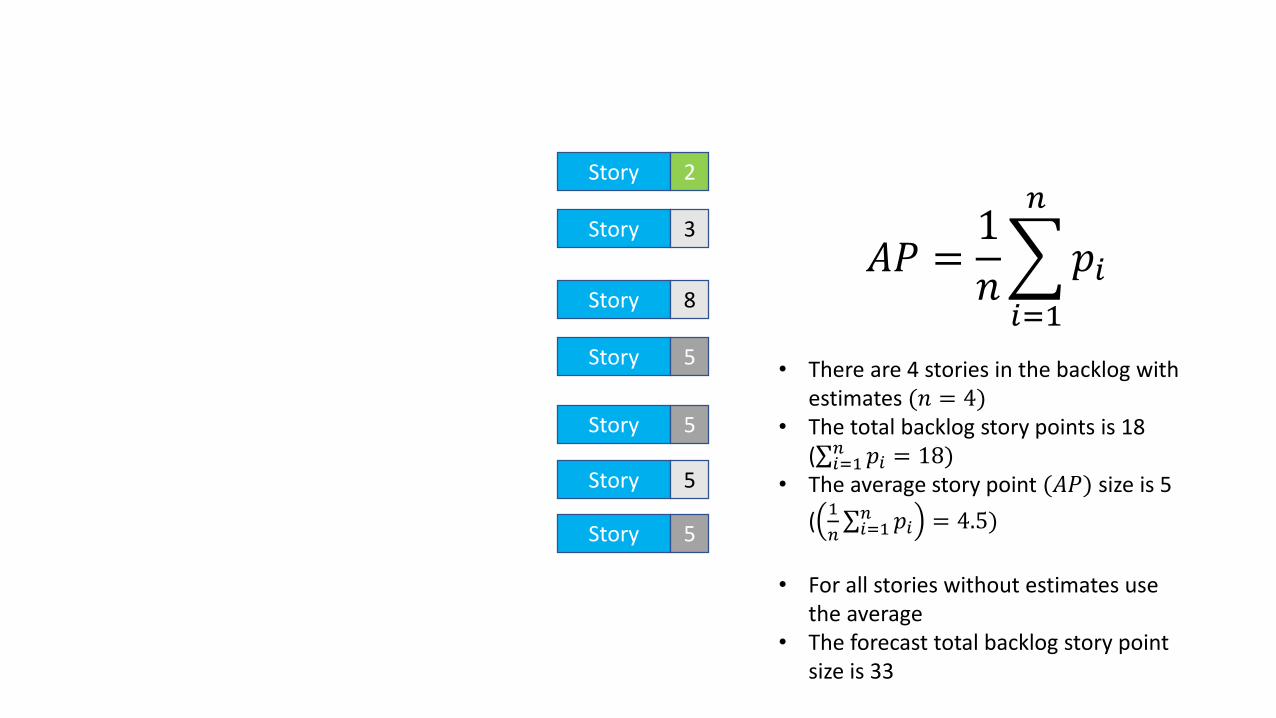
𝐴𝑃 =1
𝑛
𝑖=1
𝑛
𝑝𝑖
• There are 4 stories in the backlog with estimates (𝑛 = 4)
• The total backlog story points is 18 ( 𝑖=1𝑛 𝑝𝑖 = 18)
• The average story point (𝐴𝑃) size is 5
(1
𝑛 𝑖=1𝑛 𝑝𝑖 = 4.5)
• For all stories without estimates use the average
• The forecast total backlog story point size is 33
Story 2
Story 3
Story 8
Story 5
Story 5
Story 5
Story 5
Feature 5
Feature 13
Feature 15Epic 28
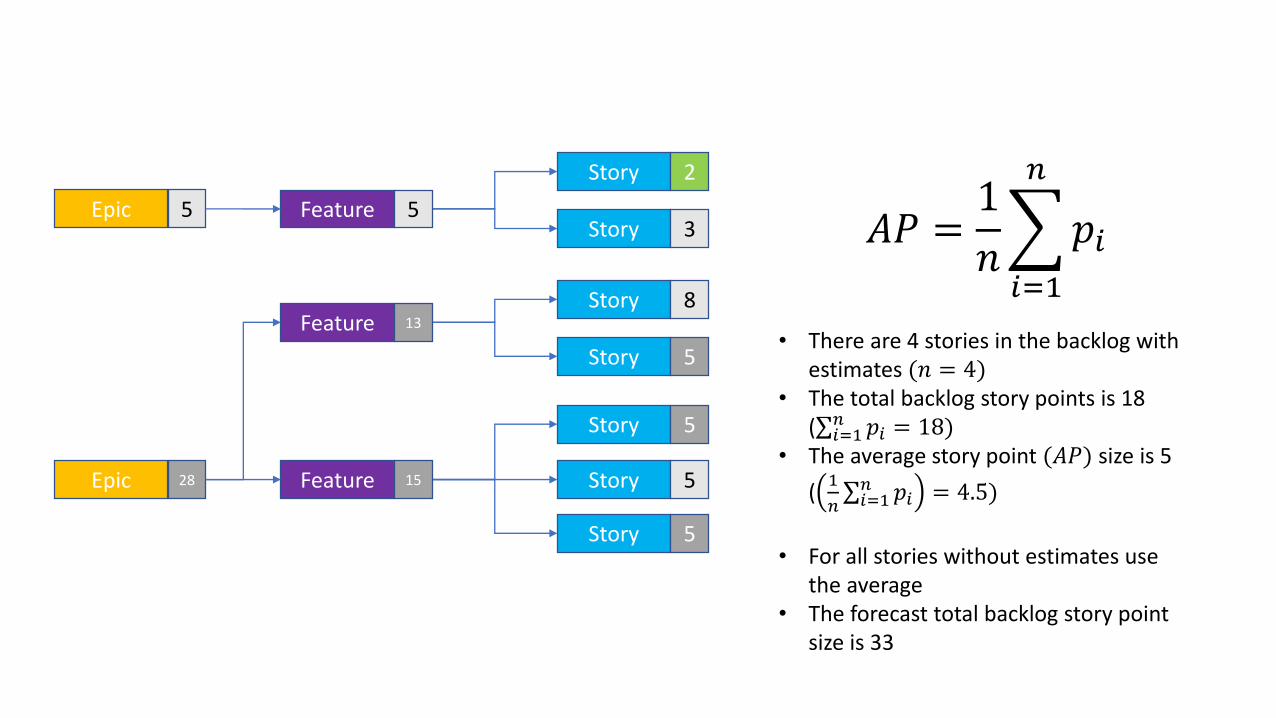
Epic 5𝐴𝑃 =1
𝑛
𝑖=1
𝑛
𝑝𝑖
• There are 4 stories in the backlog with estimates (𝑛 = 4)
• The total backlog story points is 18 ( 𝑖=1𝑛 𝑝𝑖 = 18)
• The average story point (𝐴𝑃) size is 5
(1
𝑛 𝑖=1𝑛 𝑝𝑖 = 4.5)
• For all stories without estimates use the average
• The forecast total backlog story point size is 33
Story 2
Story 3
Story 8
Story 5
Story 5
Story 5
Story 5
Feature 5
Feature 13
Feature 15
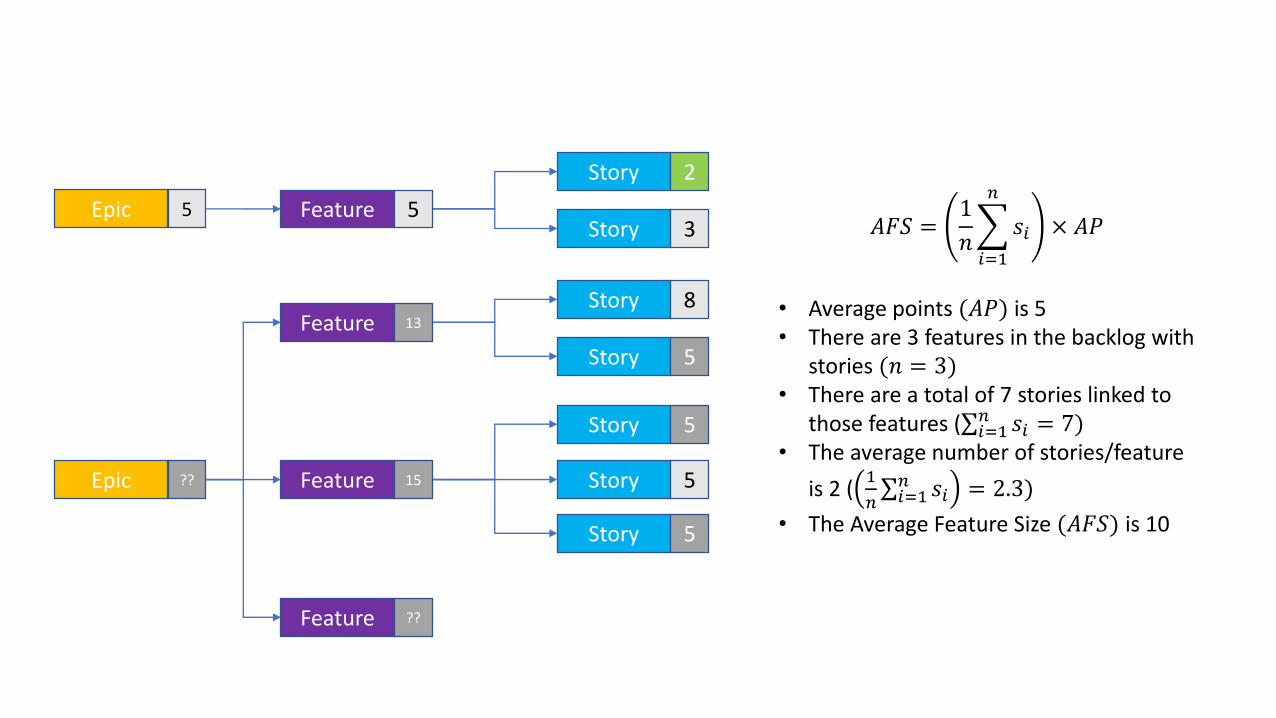
𝐴𝐹𝑆 =1
𝑛
𝑖=1
𝑛
𝑠𝑖 × 𝐴𝑃
• Average points (𝐴𝑃) is 5• There are 3 features in the backlog with
stories (𝑛 = 3)• There are a total of 7 stories linked to
those features ( 𝑖=1𝑛 𝑠𝑖 = 7)
• The average number of stories/feature
is 2 (1
𝑛 𝑖=1𝑛 𝑠𝑖 = 2.3)
• The Average Feature Size (𝐴𝐹𝑆) is 10
Epic ??
Epic 5
Feature ??

Story 2
Story 3
Story 8
Story 5
Story 5
Story 5
Story 5
Feature 5
Feature 13
Feature 15
𝐴𝐹𝑆 =1
𝑛
𝑖=1
𝑛
𝑠𝑖 × 𝐴𝑃
• Average points (𝐴𝑃) is 5• There are 3 features in the backlog with
stories (𝑛 = 3)• There are a total of 7 stories linked to
those features ( 𝑖=1𝑛 𝑠𝑖 = 7)
• The average number of stories/feature
is 2 (1
𝑛 𝑖=1𝑛 𝑠𝑖 = 2.3)
• The Average Feature Size (𝐴𝐹𝑆) is 10
• For each new feature without any stories use the average feature size (𝐴𝐹𝑆)
• Total forecast backlog size now 43
Epic 38
Epic 5
Feature 10
Story 2
Story 3
Story 8
Story 5
Story 5
Story 5
Story 5
Feature 5
Feature 13
Feature 15
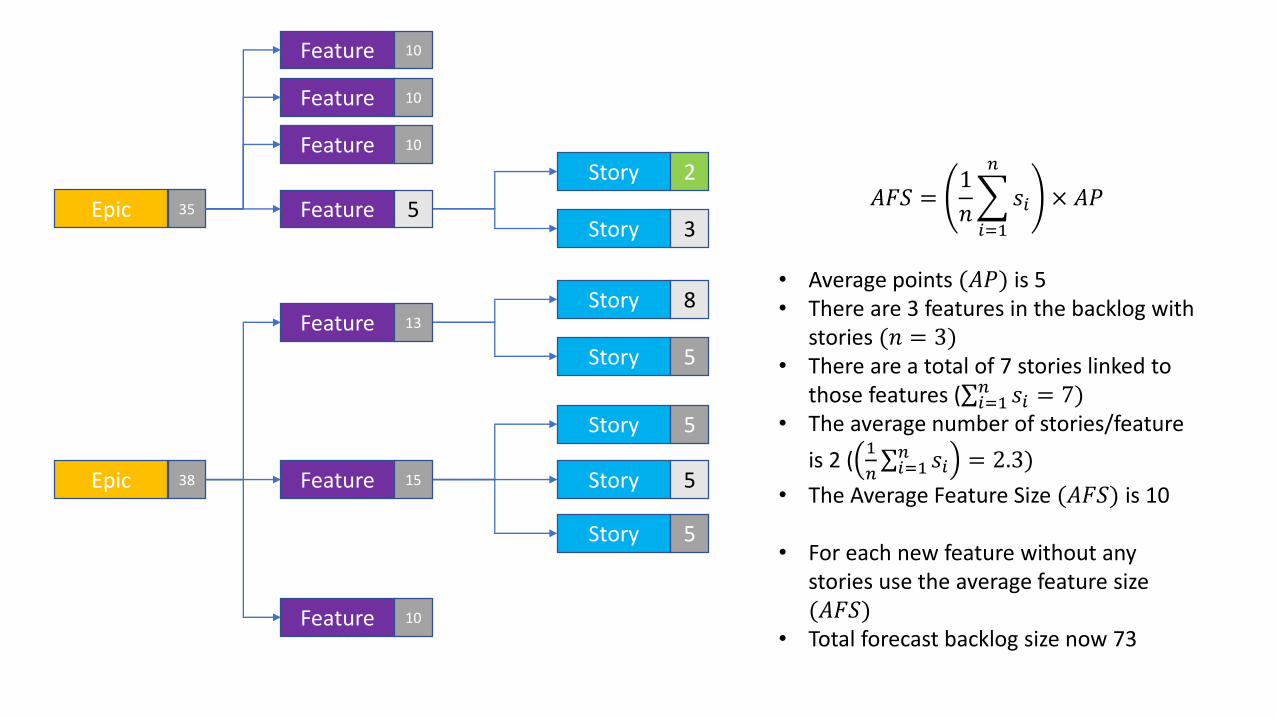
𝐴𝐹𝑆 =1
𝑛
𝑖=1
𝑛
𝑠𝑖 × 𝐴𝑃
• Average points (𝐴𝑃) is 5• There are 3 features in the backlog with
stories (𝑛 = 3)• There are a total of 7 stories linked to
those features ( 𝑖=1𝑛 𝑠𝑖 = 7)
• The average number of stories/feature
is 2 (1
𝑛 𝑖=1𝑛 𝑠𝑖 = 2.3)
• The Average Feature Size (𝐴𝐹𝑆) is 10
• For each new feature without any stories use the average feature size (𝐴𝐹𝑆)
• Total forecast backlog size now 73
Epic 38
Epic 35
Feature 10
Feature 10
Feature 10
Feature 10
Story 2
Story 3
Story 8
Story 5
Story 5
Story 5
Story 5
Feature 5
Feature 13
Feature 15
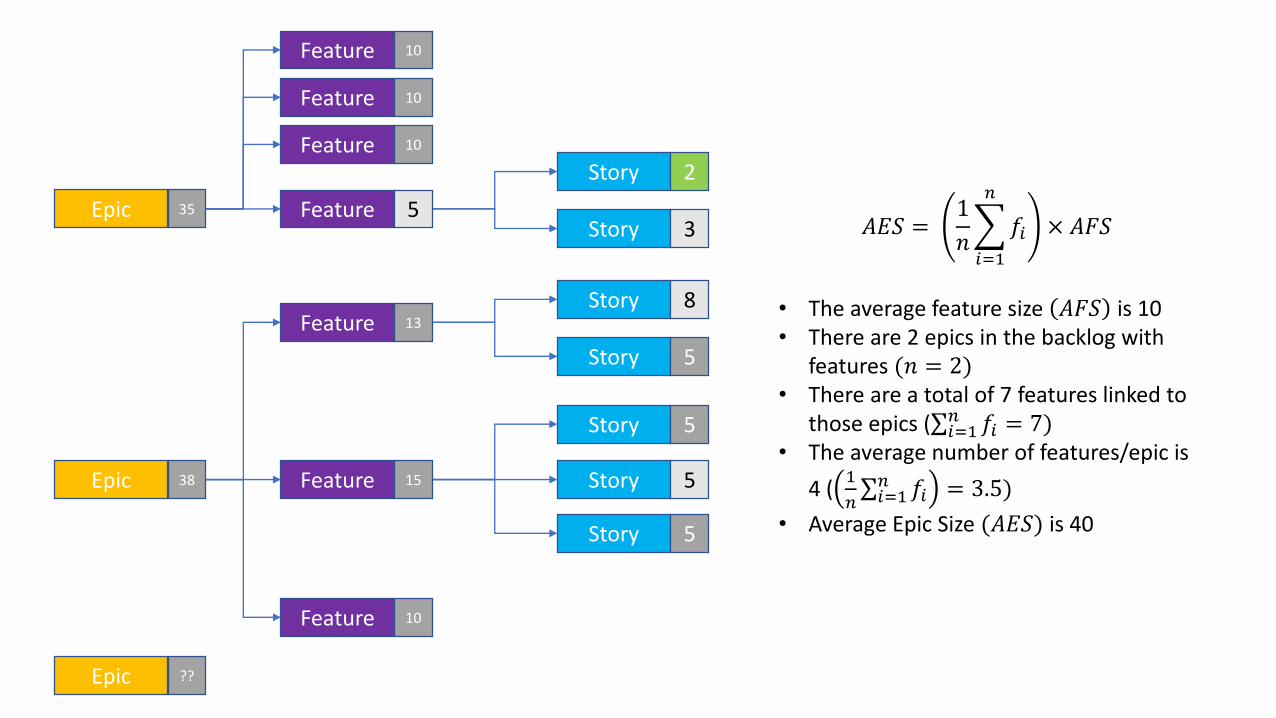
𝐴𝐸𝑆 =1
𝑛
𝑖=1
𝑛
𝑓𝑖 × 𝐴𝐹𝑆
• The average feature size 𝐴𝐹𝑆 is 10• There are 2 epics in the backlog with
features (𝑛 = 2)• There are a total of 7 features linked to
those epics ( 𝑖=1𝑛 𝑓𝑖 = 7)
• The average number of features/epic is
4 (1
𝑛 𝑖=1𝑛 𝑓𝑖 = 3.5)
• Average Epic Size (𝐴𝐸𝑆) is 40
Epic 38
Epic 35
Feature 10
Feature 10
Feature 10
Feature 10
Epic ??
Story 2
Story 3
Story 8
Story 5
Story 5
Story 5
Story 5
Feature 5
Feature 13
Feature 15
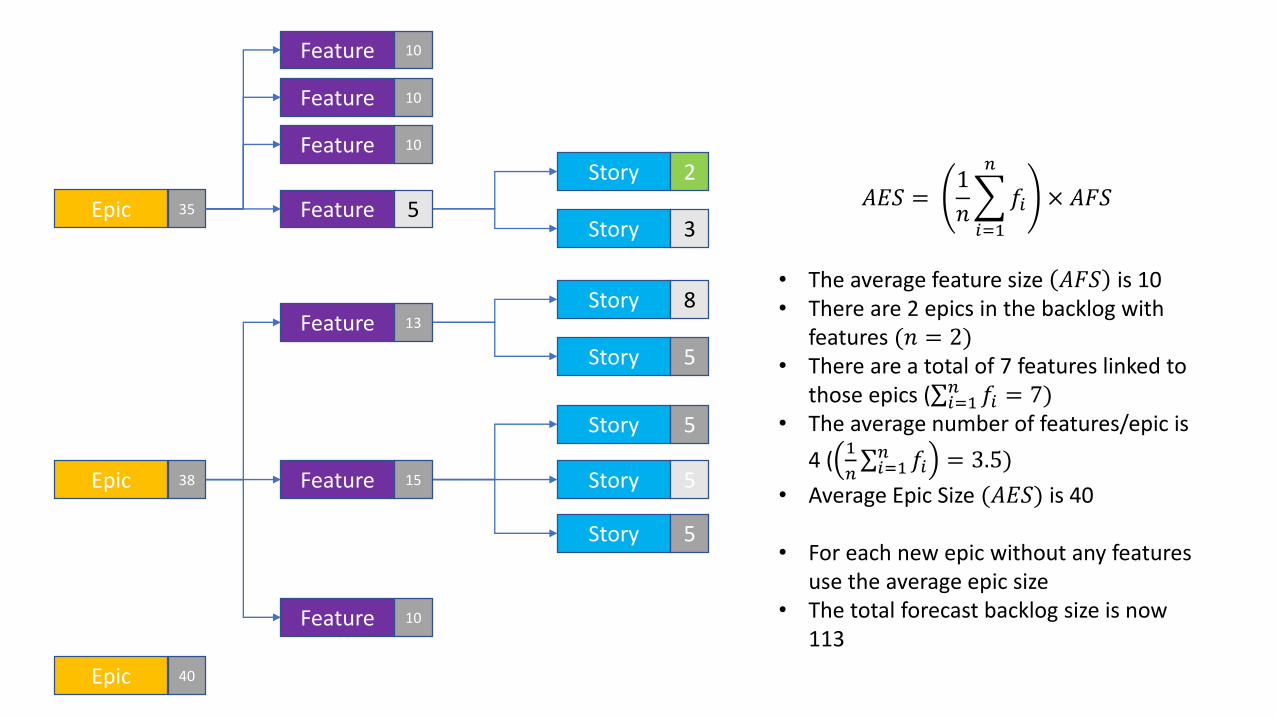
𝐴𝐸𝑆 =1
𝑛
𝑖=1
𝑛
𝑓𝑖 × 𝐴𝐹𝑆
• The average feature size 𝐴𝐹𝑆 is 10• There are 2 epics in the backlog with
features (𝑛 = 2)• There are a total of 7 features linked to
those epics ( 𝑖=1𝑛 𝑓𝑖 = 7)
• The average number of features/epic is
4 (1
𝑛 𝑖=1𝑛 𝑓𝑖 = 3.5)
• Average Epic Size (𝐴𝐸𝑆) is 40
• For each new epic without any features use the average epic size
• The total forecast backlog size is now 113
Epic 38
Epic 35
Feature 10
Feature 10
Feature 10
Feature 10
Epic 40

How is this useful?
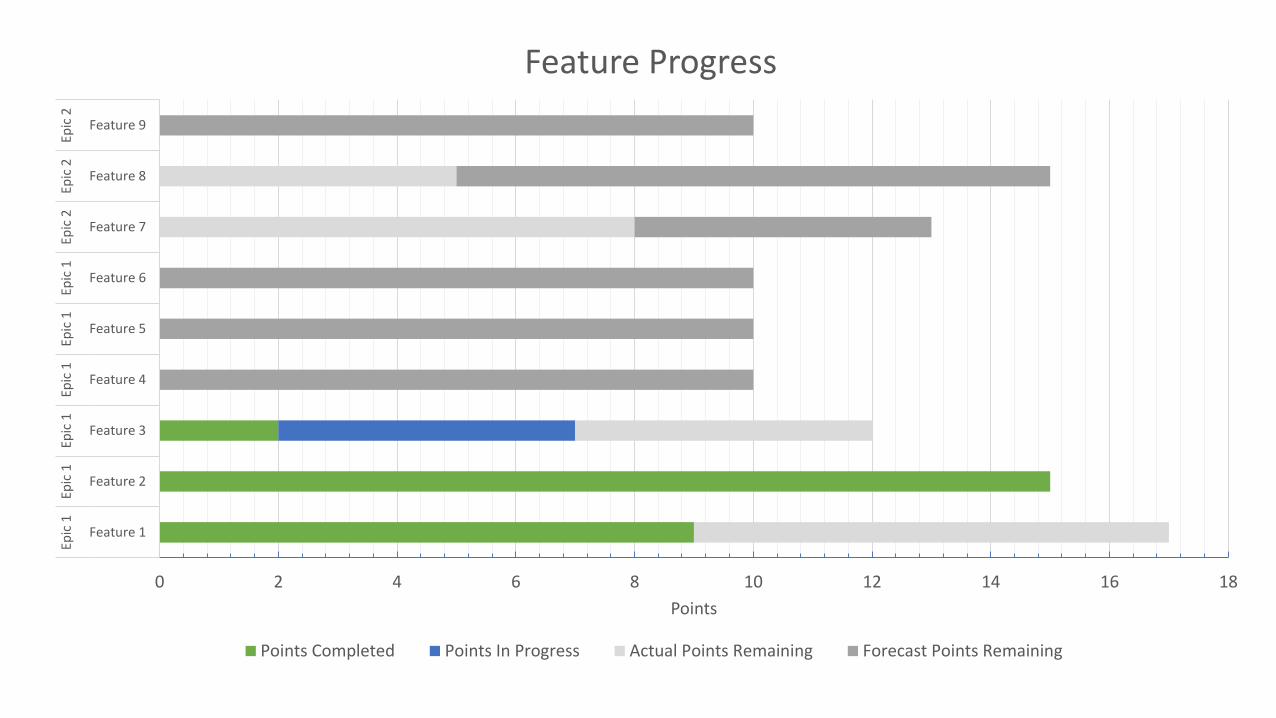
0 2 4 6 8 10 12 14 16 18
Feature 1
Feature 2
Feature 3
Feature 4
Feature 5
Feature 6
Feature 7
Feature 8
Feature 9
Epic
1Ep
ic 1
Epic
1Ep
ic 1
Epic
1Ep
ic 1
Epic
2Ep
ic 2
Epic
2
Points
Feature Progress
Points Completed Points In Progress Actual Points Remaining Forecast Points Remaining
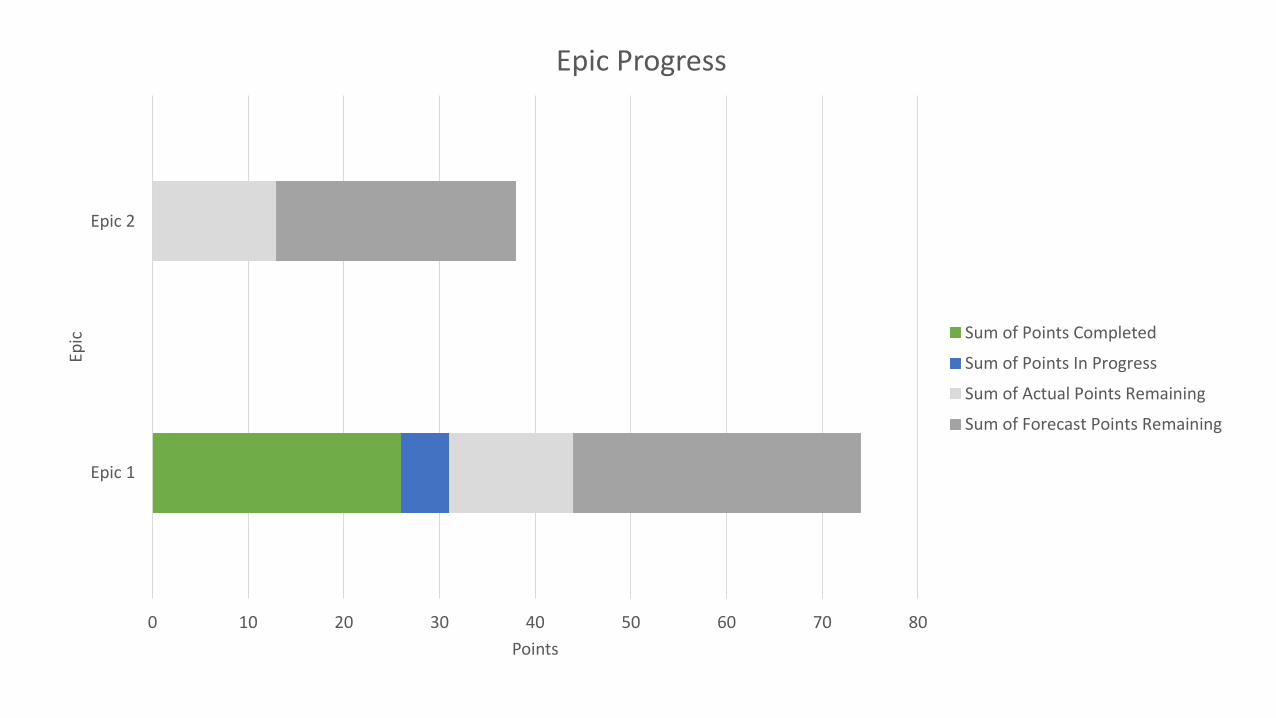
0 10 20 30 40 50 60 70 80
Epic 1
Epic 2
Points
Epic
Epic Progress
Sum of Points Completed
Sum of Points In Progress
Sum of Actual Points Remaining
Sum of Forecast Points Remaining
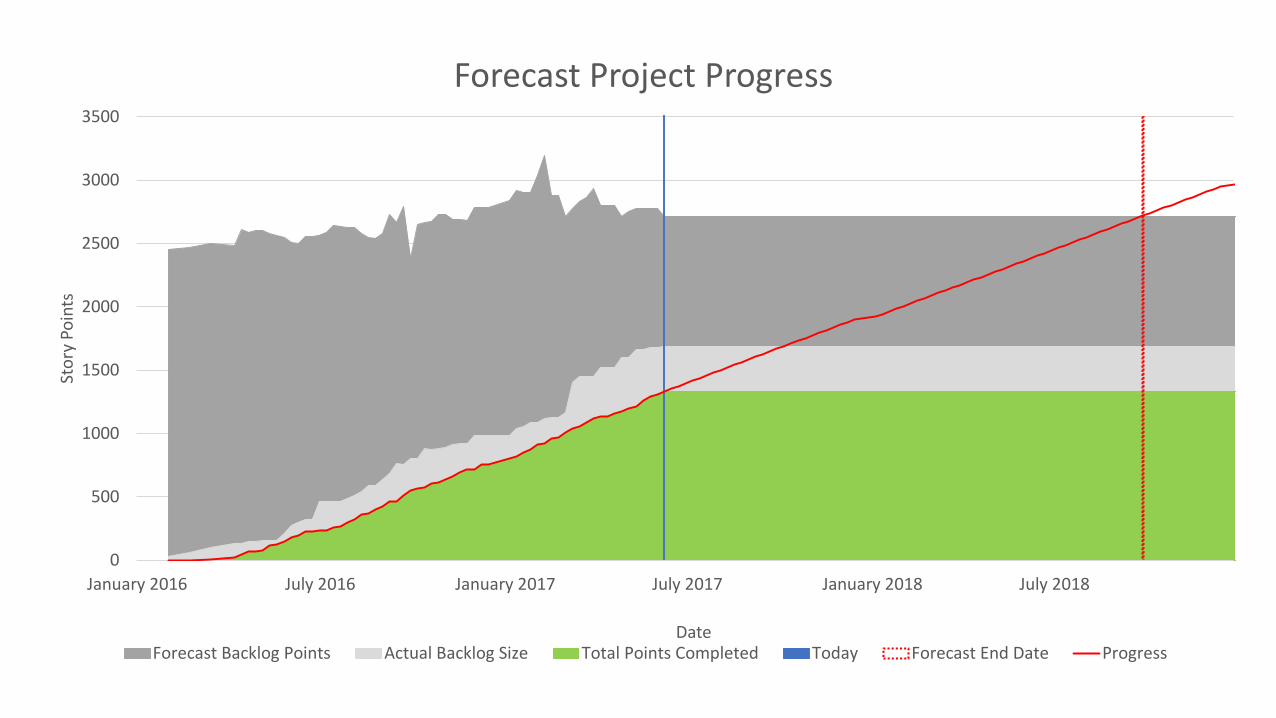
0
500
1000
1500
2000
2500
3000
3500
January 2016 July 2016 January 2017 July 2017 January 2018 July 2018
Sto
ry P
oin
ts
Date
Forecast Project Progress
Forecast Backlog Points Actual Backlog Size Total Points Completed Today Forecast End Date Progress

Velocity Control Charts
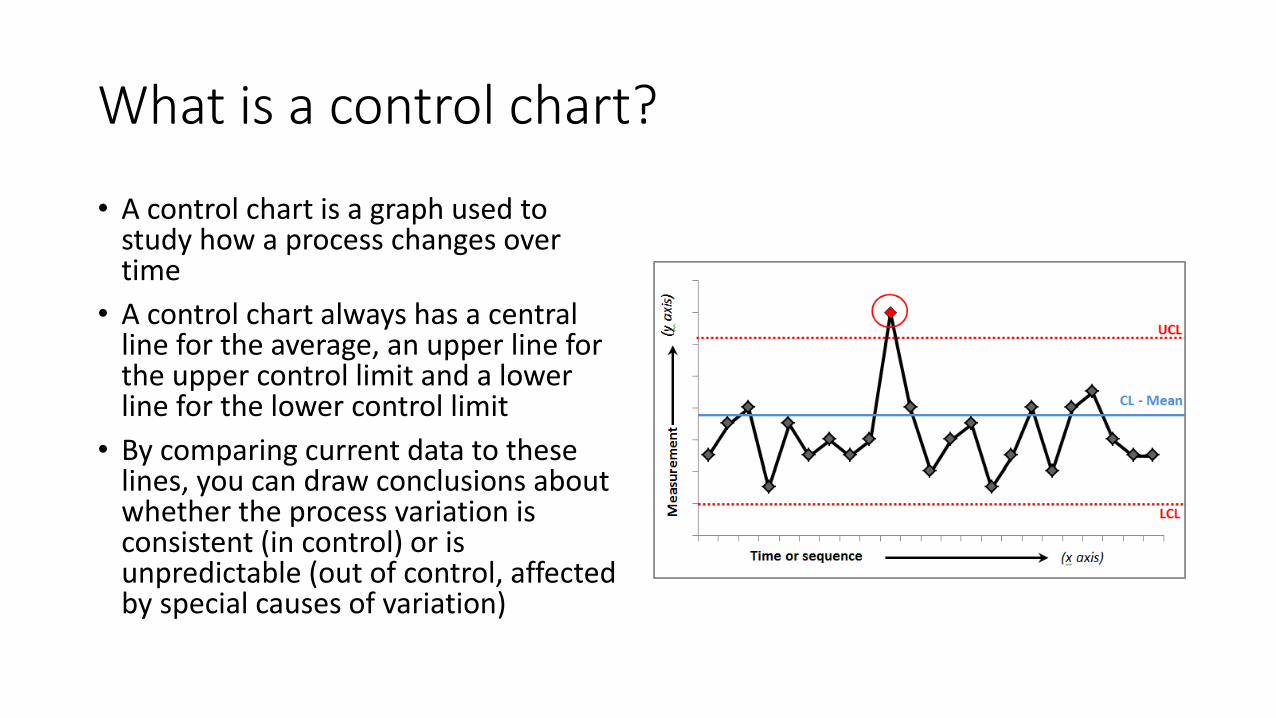
What is a control chart?
• A control chart is a graph used to study how a process changes over time
• A control chart always has a central line for the average, an upper line for the upper control limit and a lower line for the lower control limit
• By comparing current data to these lines, you can draw conclusions about whether the process variation is consistent (in control) or is unpredictable (out of control, affected by special causes of variation)
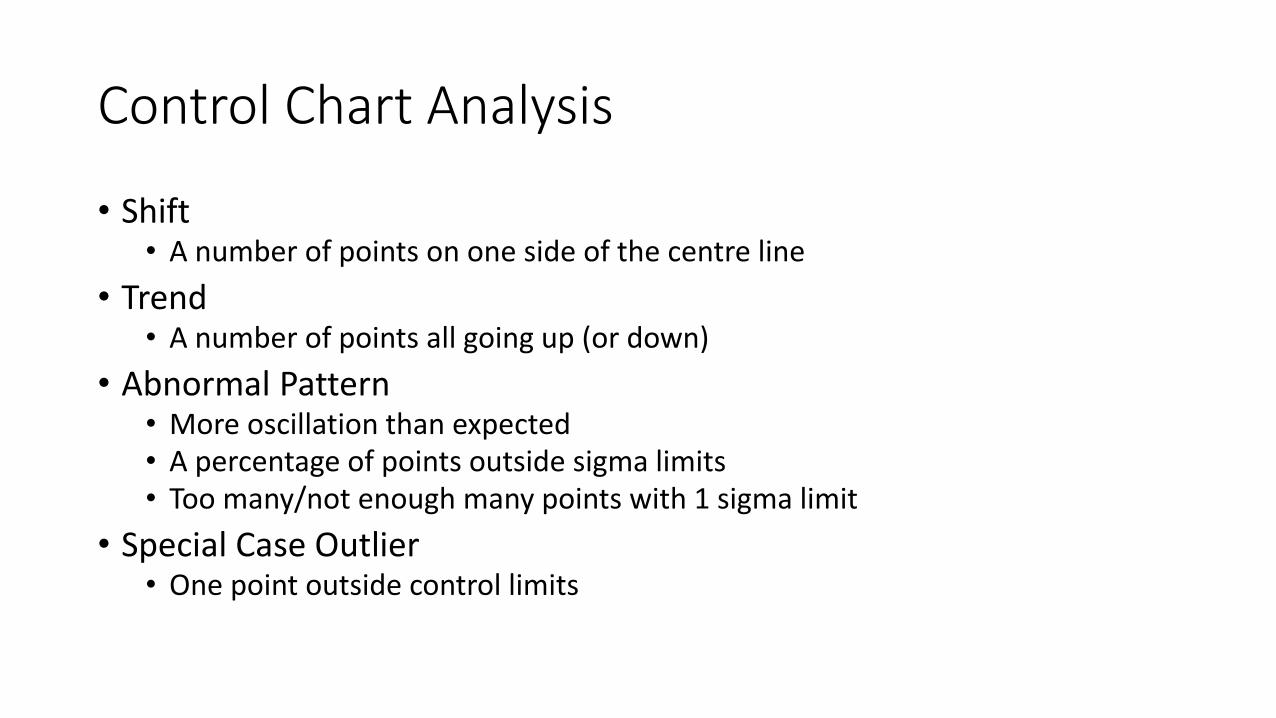
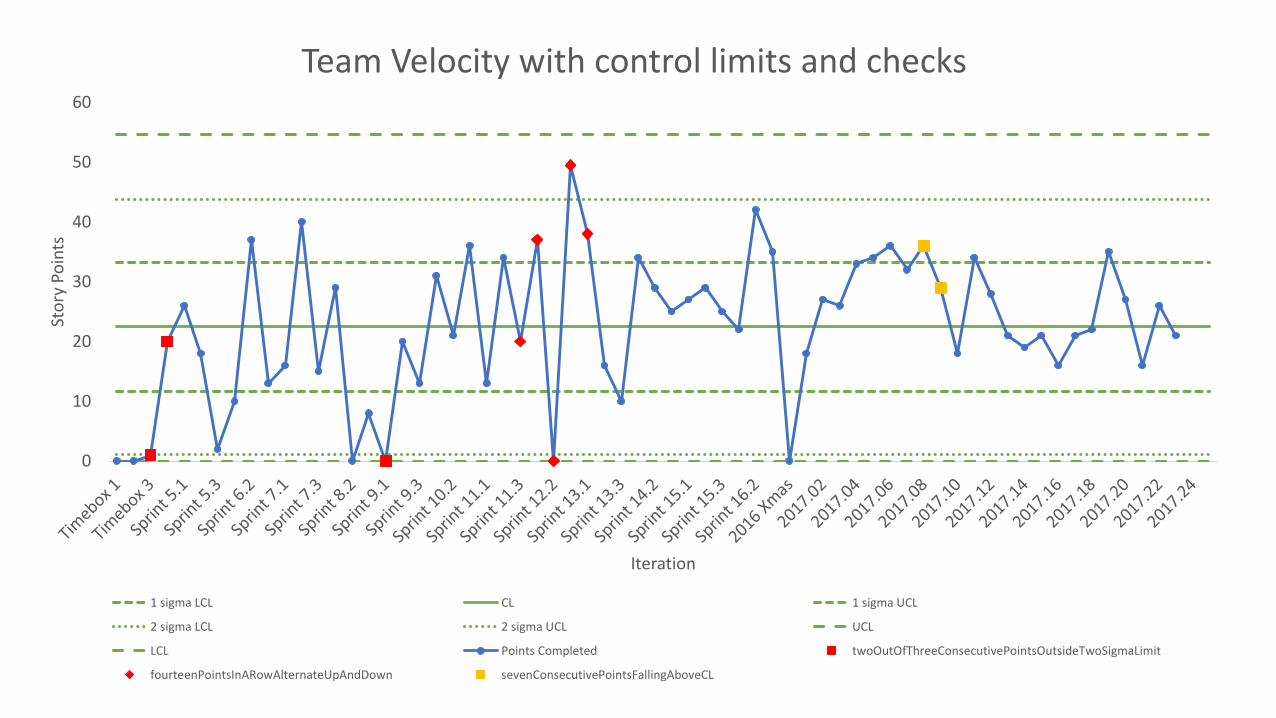
Control Chart Analysis
• Shift• A number of points on one side of the centre line
• Trend• A number of points all going up (or down)
• Abnormal Pattern• More oscillation than expected• A percentage of points outside sigma limits• Too many/not enough many points with 1 sigma limit
• Special Case Outlier• One point outside control limits
How is this useful?
Require.js module to calculate control limits and apply checks available on GitHub https://github.com/dlongman/SixSigma
0
10
20
30
40
50
60
Sto
ry P
oin
ts
Iteration
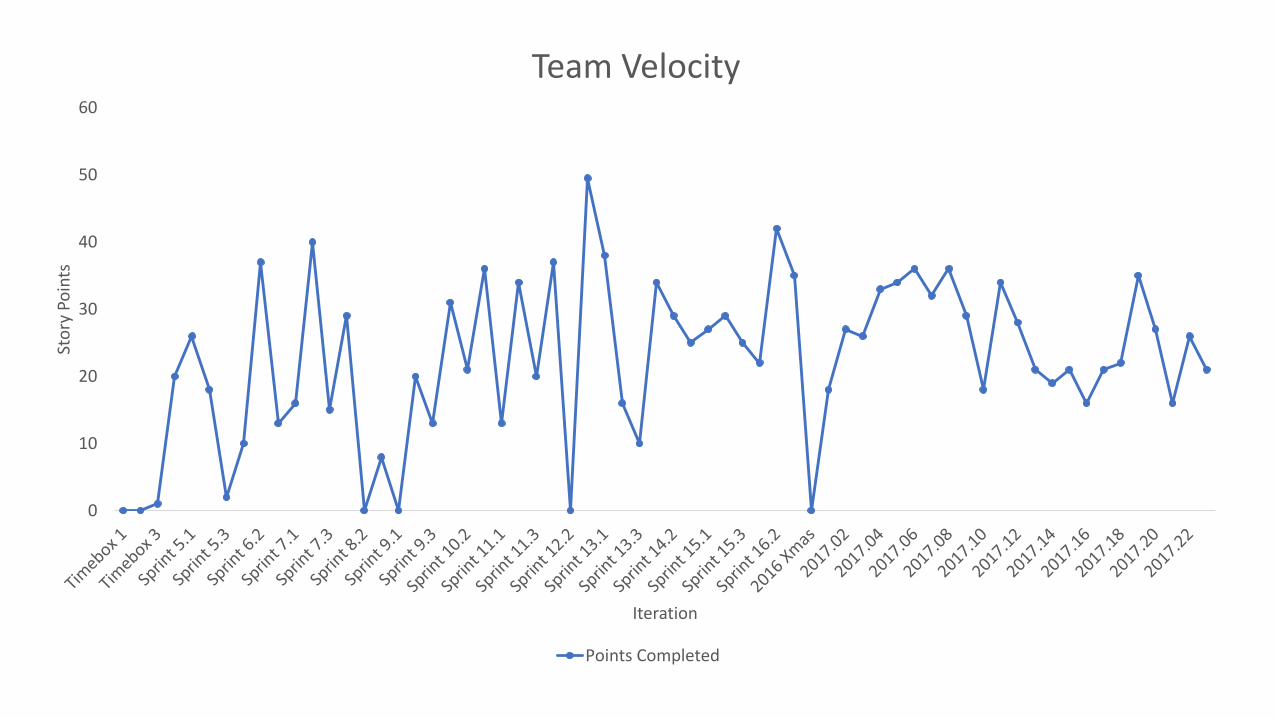
Team Velocity
Points Completed
0
10
20
30
40
50
60
Sto
ry P
oin
ts
Iteration
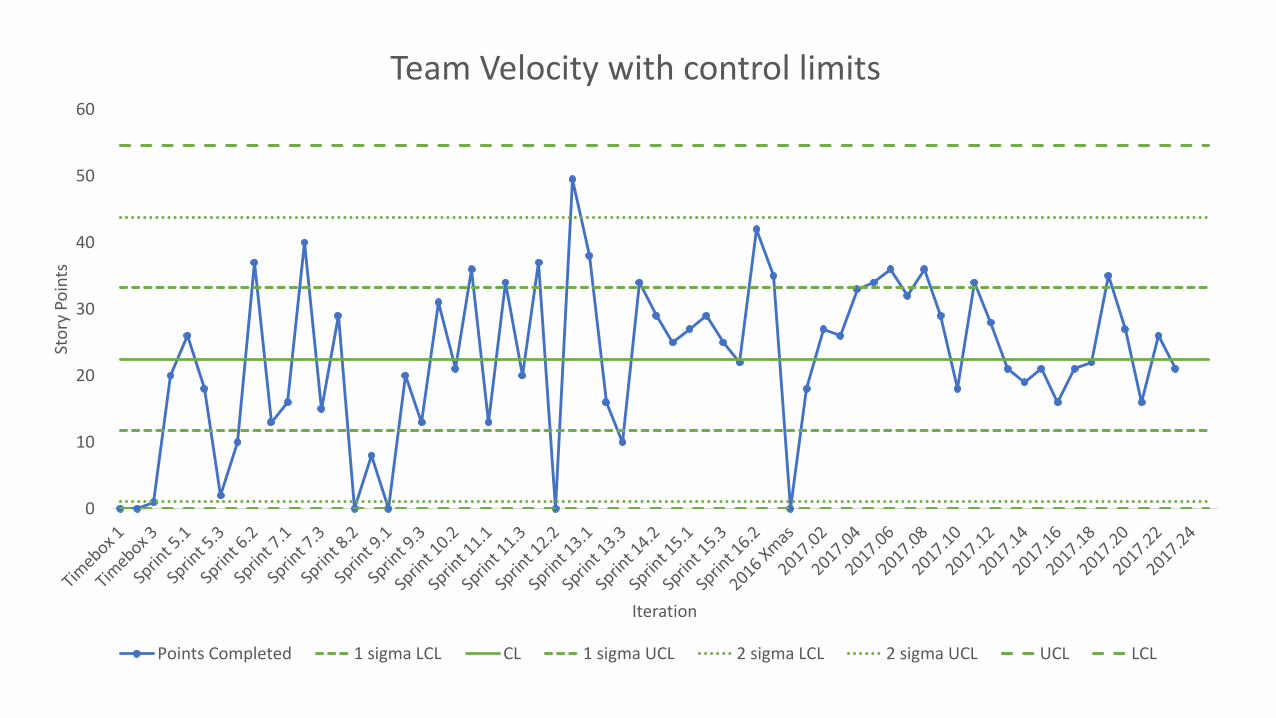
Team Velocity with control limits
Points Completed 1 sigma LCL CL 1 sigma UCL 2 sigma LCL 2 sigma UCL UCL LCL
0
10
20
30
40
50
60
Sto
ry P
oin
ts
Iteration
Team Velocity with control limits and checks
1 sigma LCL CL 1 sigma UCL
2 sigma LCL 2 sigma UCL UCL
LCL Points Completed twoOutOfThreeConsecutivePointsOutsideTwoSigmaLimit
fourteenPointsInARowAlternateUpAndDown sevenConsecutivePointsFallingAboveCL

0
500
1000
1500
2000
2500
3000
3500
January 2016 July 2016 January 2017 July 2017 January 2018 July 2018
Sto
ry P
oin
ts
Date
Forecast Project Progress
Forecast Backlog Points Actual Backlog Size Total Points Completed Today Forecast End Date Progress

Agile Earned Value
What is Earned Value Analysis
• Used to measure project performance and progress in an objective manner
• Compares a baseline measure of the work required in the project to the current deliverables
• Provides consistent metrics (SPI, CPI) allow objective comparisons between projects
• Predicts the remaining cost to complete all the work in the backlog
$-
$100,000.00
$200,000.00
$300,000.00
$400,000.00
$500,000.00
$600,000.00
$700,000.00
Jul 2013 Oct 2013 Jan 2014 Apr 2014 Jul 2014
Val
ue
(USD
)
Date
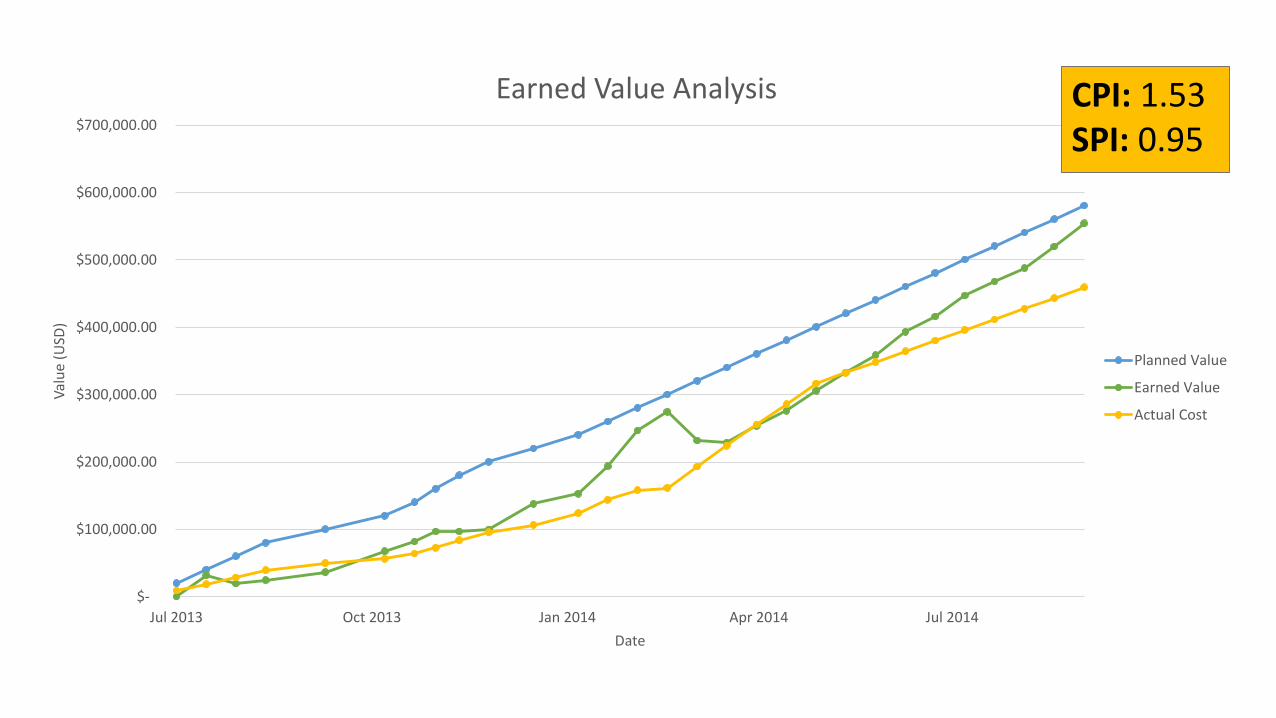
Earned Value Analysis
Planned Value
Earned Value
Actual Cost
CPI: 1.53SPI: 0.95

How does it work?

Project Budget Estimate $1,000,000.00
Planned Total # Sprints 30
Backlog Size 2000
Last Sprint # 15
Points Completed 1000
Backlog Size 2000
Spend ($) $500,000.00
Schedule Performance Index 1.0
Cost Performance Index 1.0
Planned % Complete 50%
Actual % Complete 50%
Cost Variance $-
Schedule Variance $-
Estimate to Complete $500,000.00
Estimate at Completion $1,000,000.00
Earned Value $500,000.00
Planned Value $500,000.00
At the start of the project
Every sprint
Earned Value Metrics
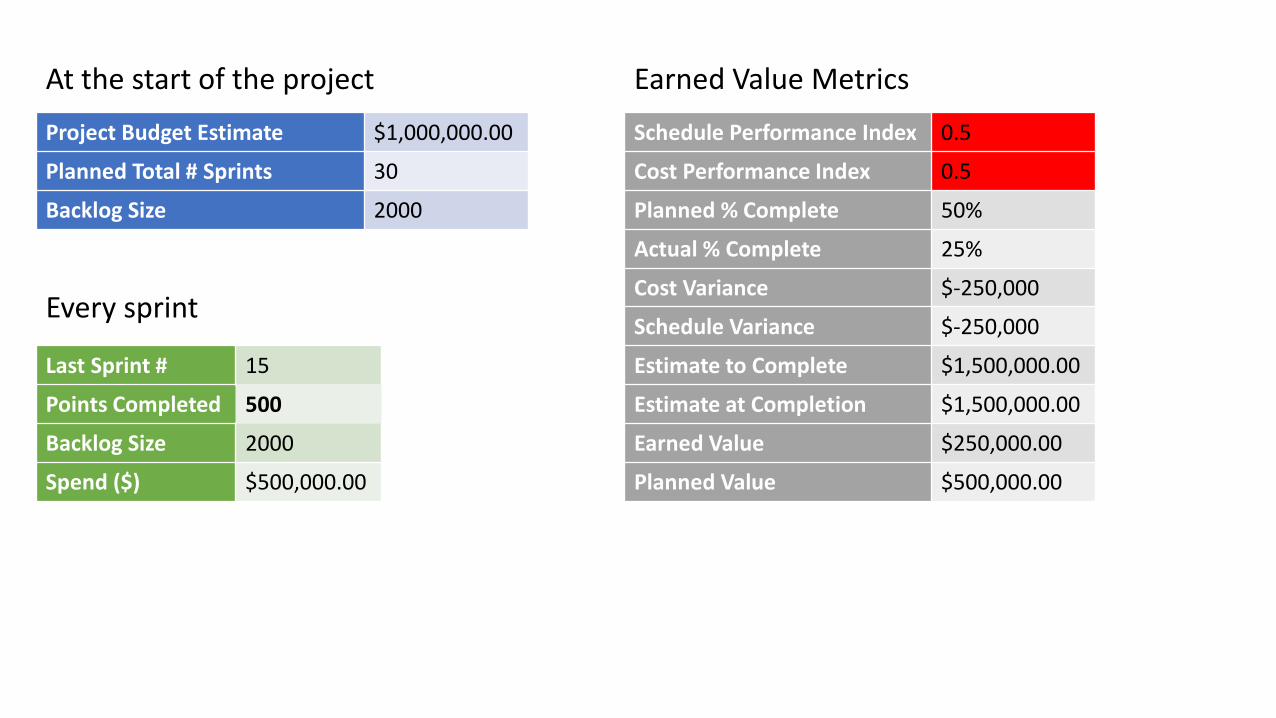
Project Budget Estimate $1,000,000.00
Planned Total # Sprints 30
Backlog Size 2000
Last Sprint # 15
Points Completed 500
Backlog Size 2000
Spend ($) $500,000.00
Schedule Performance Index 0.5
Cost Performance Index 0.5
Planned % Complete 50%
Actual % Complete 25%
Cost Variance $-250,000
Schedule Variance $-250,000
Estimate to Complete $1,500,000.00
Estimate at Completion $1,500,000.00
Earned Value $250,000.00
Planned Value $500,000.00
At the start of the project
Every sprint
Earned Value Metrics
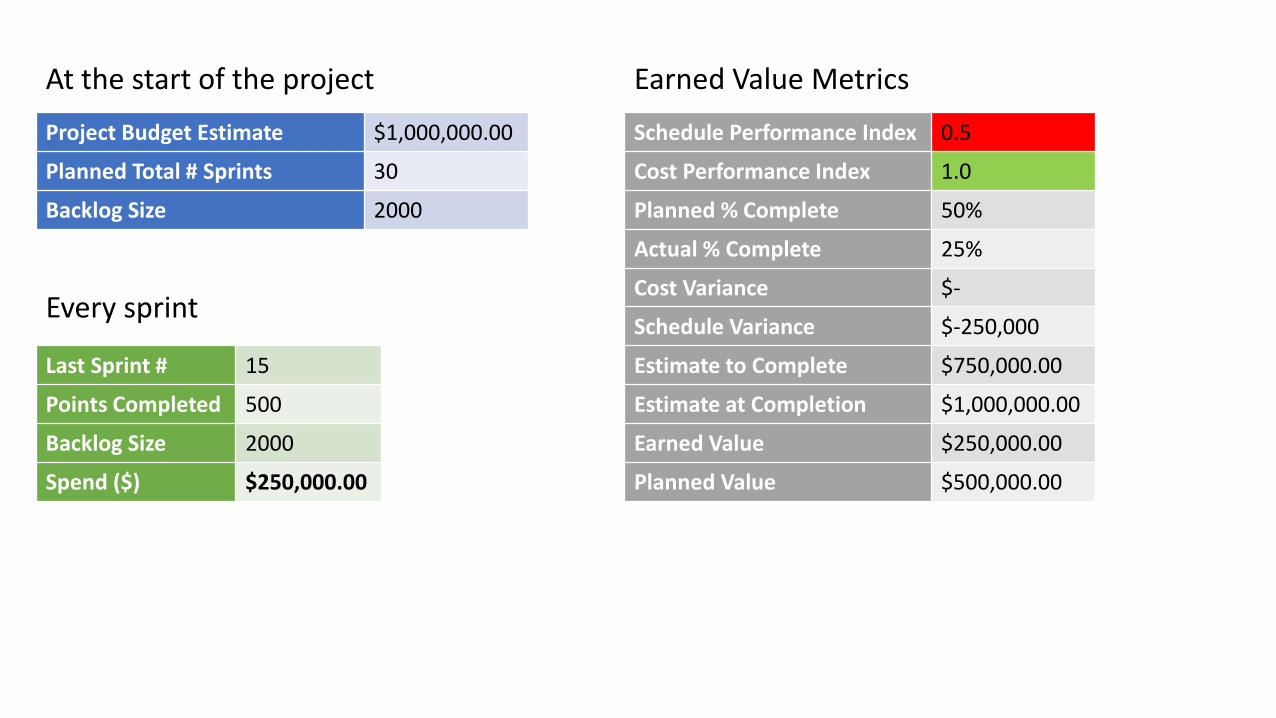
Project Budget Estimate $1,000,000.00
Planned Total # Sprints 30
Backlog Size 2000
Last Sprint # 15
Points Completed 500
Backlog Size 2000
Spend ($) $250,000.00
Schedule Performance Index 0.5
Cost Performance Index 1.0
Planned % Complete 50%
Actual % Complete 25%
Cost Variance $-
Schedule Variance $-250,000
Estimate to Complete $750,000.00
Estimate at Completion $1,000,000.00
Earned Value $250,000.00
Planned Value $500,000.00
At the start of the project
Every sprint
Earned Value Metrics
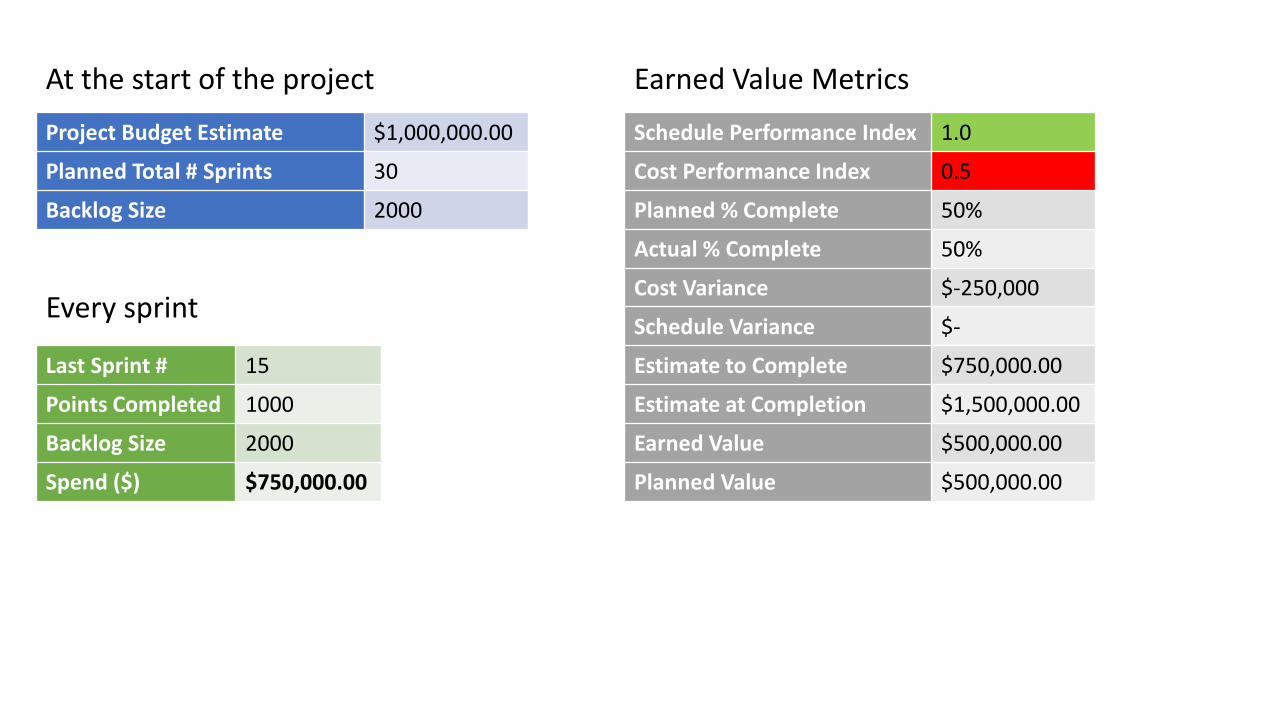
Project Budget Estimate $1,000,000.00
Planned Total # Sprints 30
Backlog Size 2000
Last Sprint # 15
Points Completed 1000
Backlog Size 2000
Spend ($) $750,000.00
Schedule Performance Index 1.0
Cost Performance Index 0.5
Planned % Complete 50%
Actual % Complete 50%
Cost Variance $-250,000
Schedule Variance $-
Estimate to Complete $750,000.00
Estimate at Completion $1,500,000.00
Earned Value $500,000.00
Planned Value $500,000.00
At the start of the project
Every sprint
Earned Value Metrics
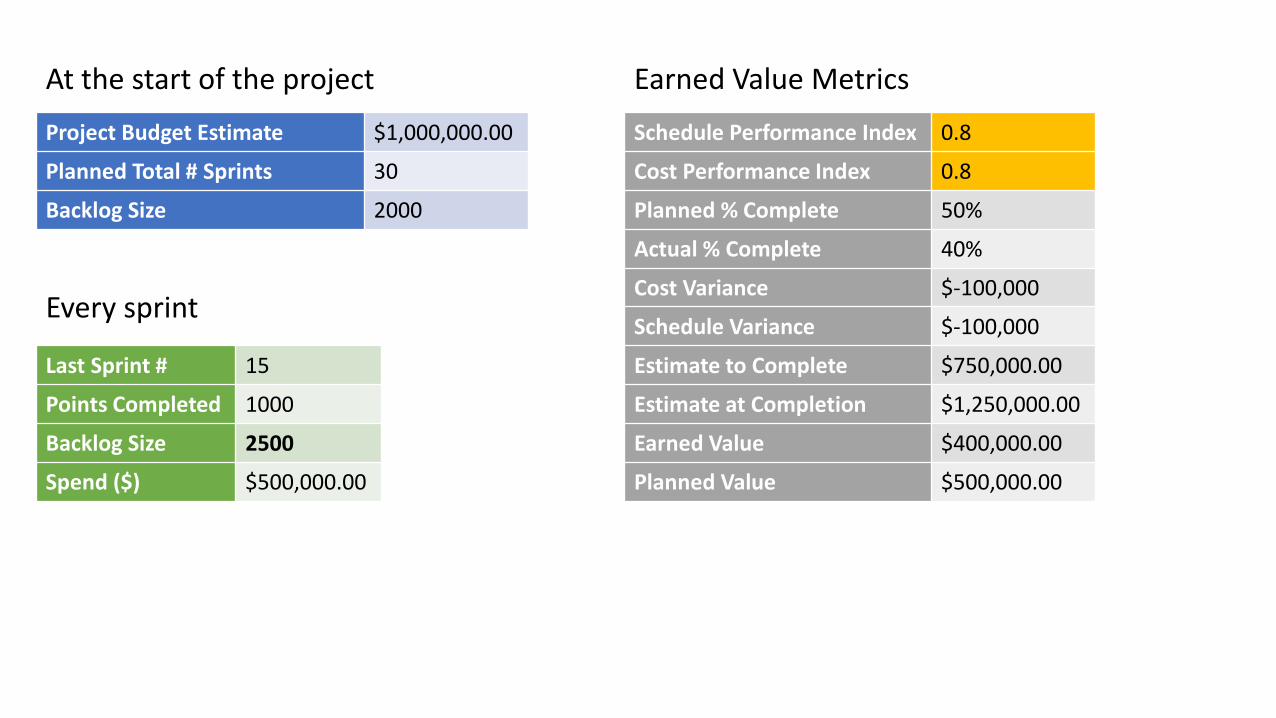
Project Budget Estimate $1,000,000.00
Planned Total # Sprints 30
Backlog Size 2000
Last Sprint # 15
Points Completed 1000
Backlog Size 2500
Spend ($) $500,000.00
Schedule Performance Index 0.8
Cost Performance Index 0.8
Planned % Complete 50%
Actual % Complete 40%
Cost Variance $-100,000
Schedule Variance $-100,000
Estimate to Complete $750,000.00
Estimate at Completion $1,250,000.00
Earned Value $400,000.00
Planned Value $500,000.00
At the start of the project
Every sprint
Earned Value Metrics
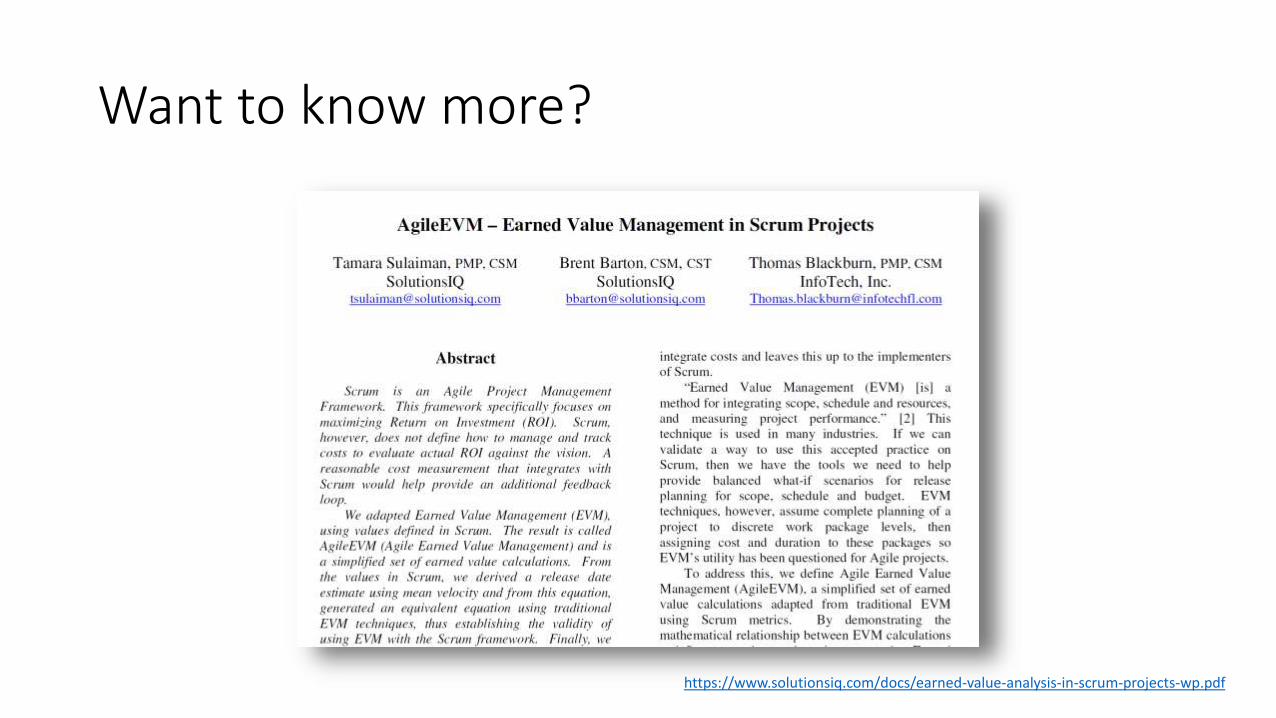
Want to know more?
https://www.solutionsiq.com/docs/earned-value-analysis-in-scrum-projects-wp.pdf
• Evidence Based Forecasting• Minimises upfront planning• Gets more accurate as the project
progresses• Simple to explain• Shows logical approach to
planning• Enables use of simple burn chart
to report status and forecast
• Velocity Control Charts• Provides indicators to highlight
potential issues• Provides input to retrospectives
for discussion• Provides additional layer of
control which can help stakeholder engagement
• Earned Value Analysis• Alternative reporting method to
burn charts• Provides more consistent
reporting between agile and waterfall projects
• Highlights delivery progress and cost separately