Embed Size (px)
Citation preview
The Problem
• There are application
• It doesn’t meat its SLA
• Users/client/stakeholders are unhappy
You are one to fix it!
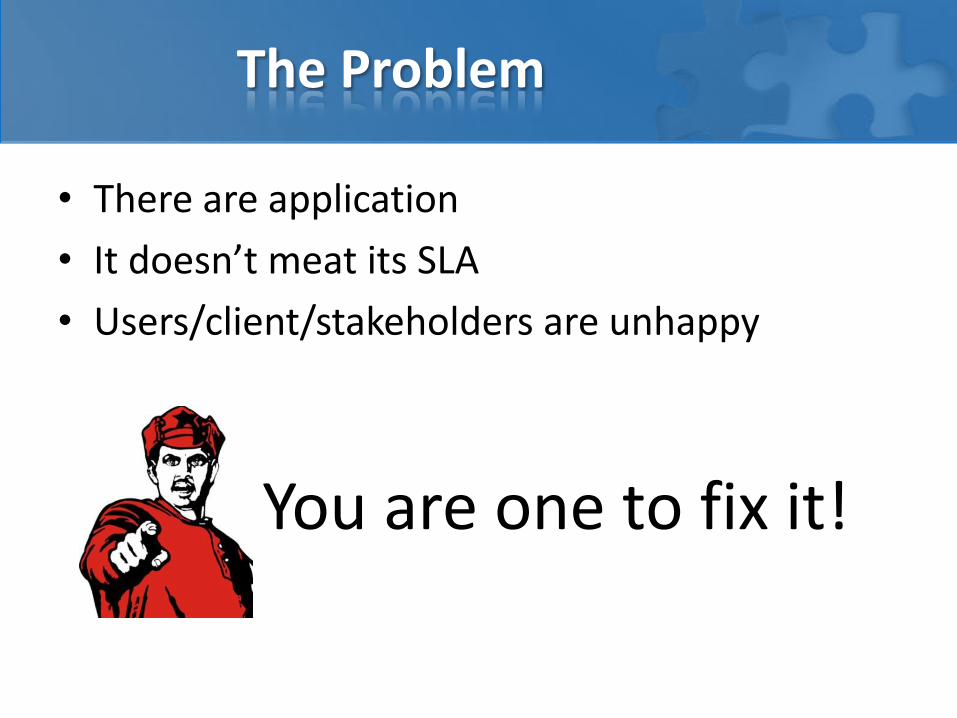
What to do?
• Do not panic!
• Elaborate acceptance criteria
• Make sure you understand KPI and SLA
• Write out all moving parts in system
• Is problem in Java application?
Yes - You are ready to start profiling
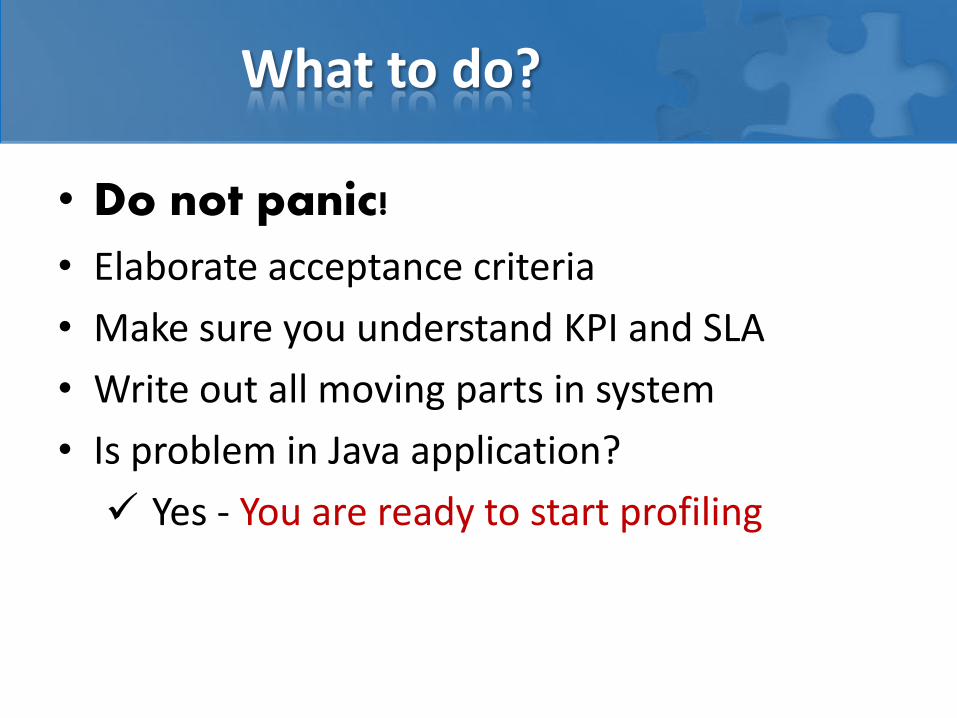
Moving parts
ServerBrowser
Application
Database
Caching
JavaScript
HTTP
Network Network
SQL performance
CPU Memory / Swapping
Disk IO Virtualization
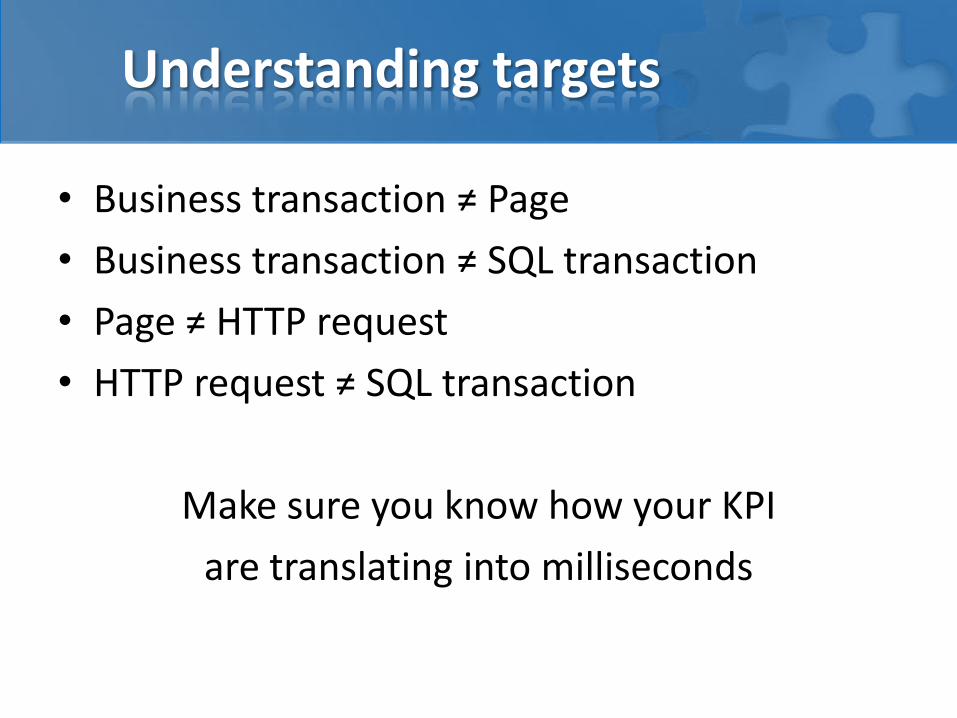
Understanding targets
• Business transaction ≠ Page
• Business transaction ≠ SQL transaction
• Page ≠ HTTP request
• HTTP request ≠ SQL transaction
Make sure you know how your KPI
are translating into milliseconds
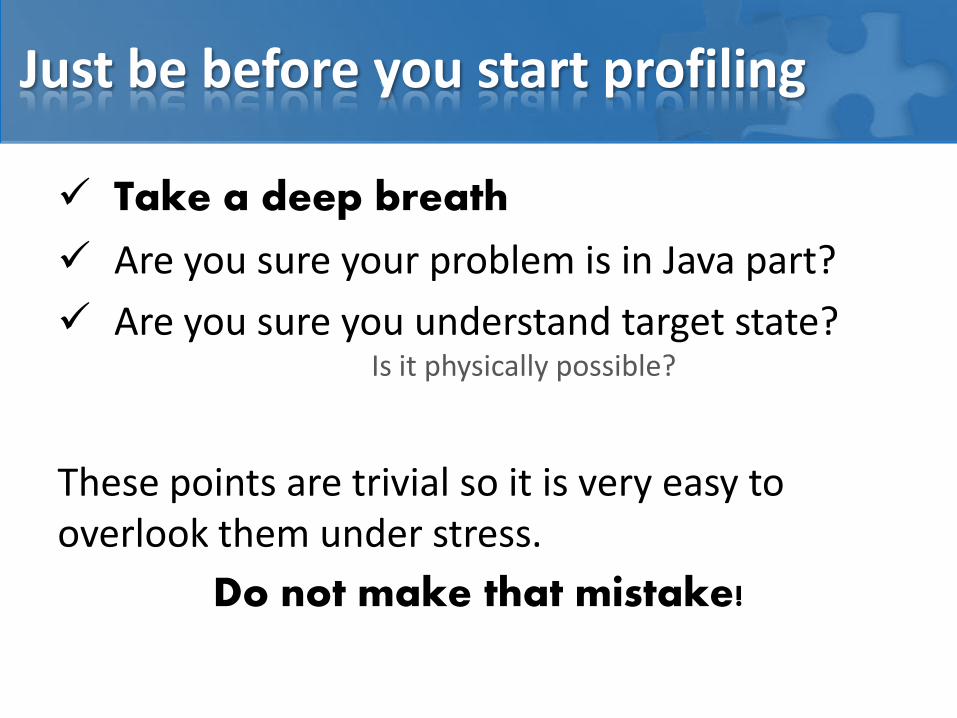
Just be before you start profiling
Take a deep breath
Are you sure your problem is in Java part?
Are you sure you understand target state? Is it physically possible?
These points are trivial so it is very easy to overlook them under stress.
Do not make that mistake!
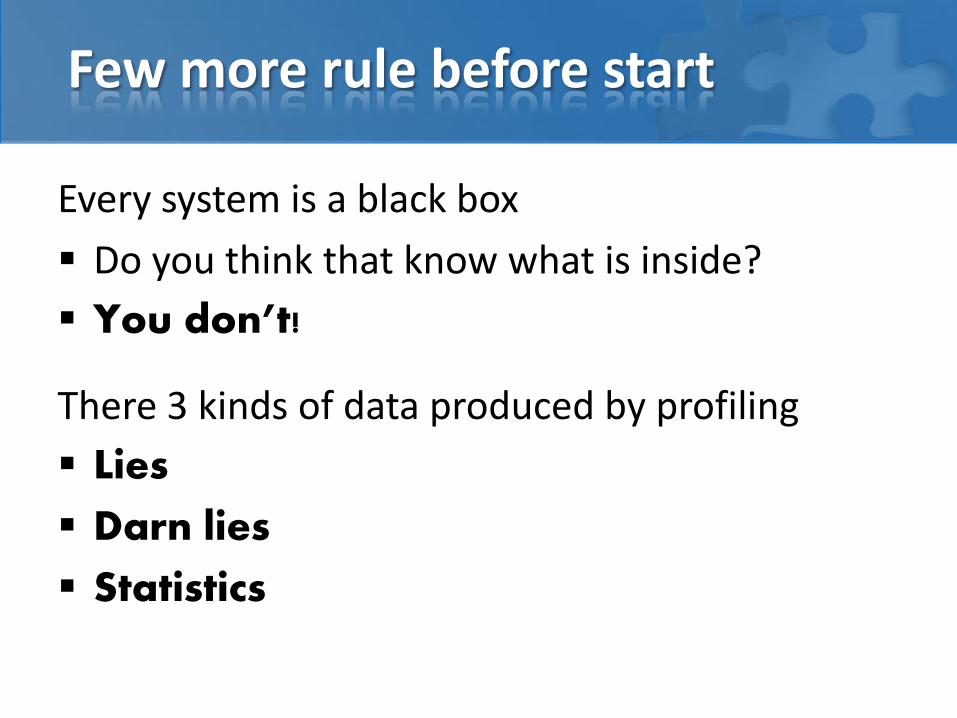
Few more rule before start
Every system is a black box
Do you think that know what is inside?
You don’t!
There 3 kinds of data produced by profiling
Lies
Darn lies
Statistics

Profiling your Java application
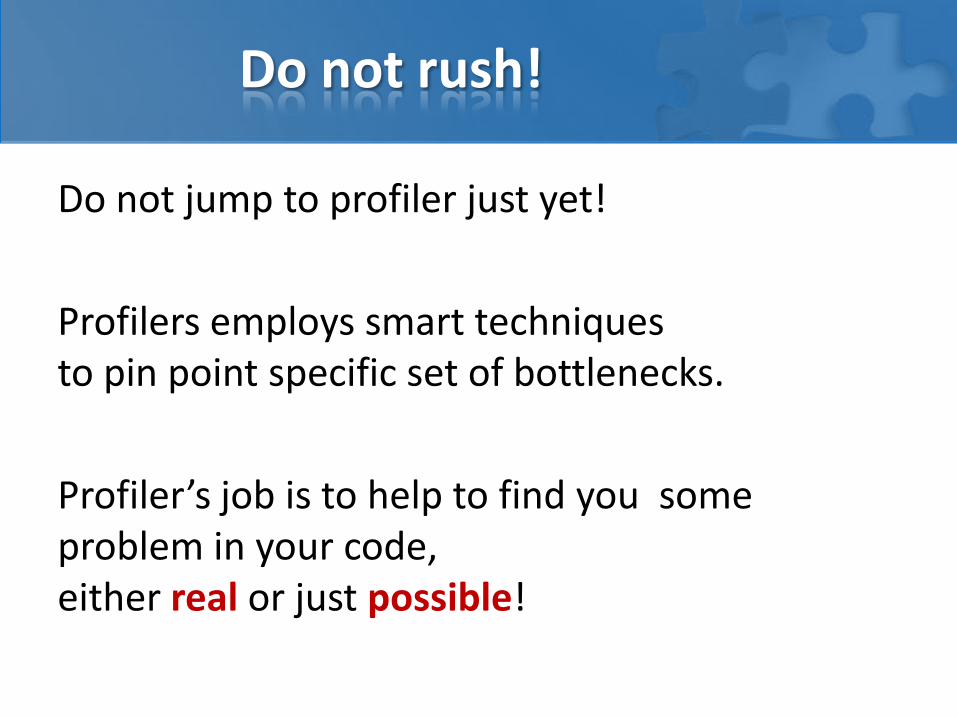
Do not rush!
Do not jump to profiler just yet!
Profilers employs smart techniques to pin point specific set of bottlenecks.
Profiler’s job is to help to find you some problem in your code, either real or just possible!
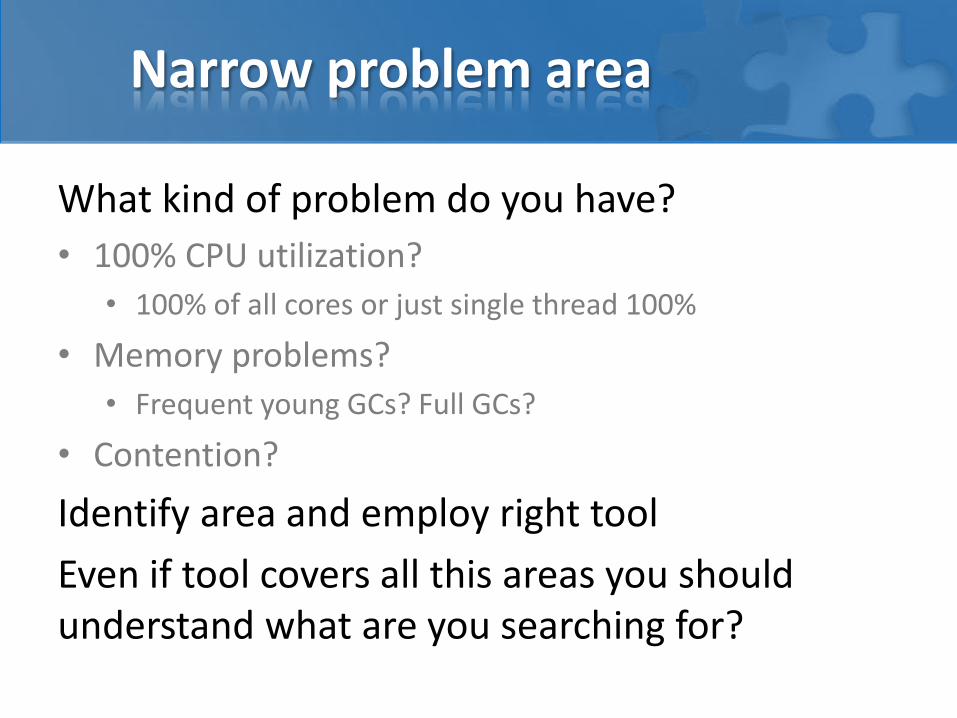
Narrow problem area
What kind of problem do you have?
• 100% CPU utilization?
• 100% of all cores or just single thread 100%
• Memory problems?
• Frequent young GCs? Full GCs?
• Contention?
Identify area and employ right tool
Even if tool covers all this areas you should understand what are you searching for?
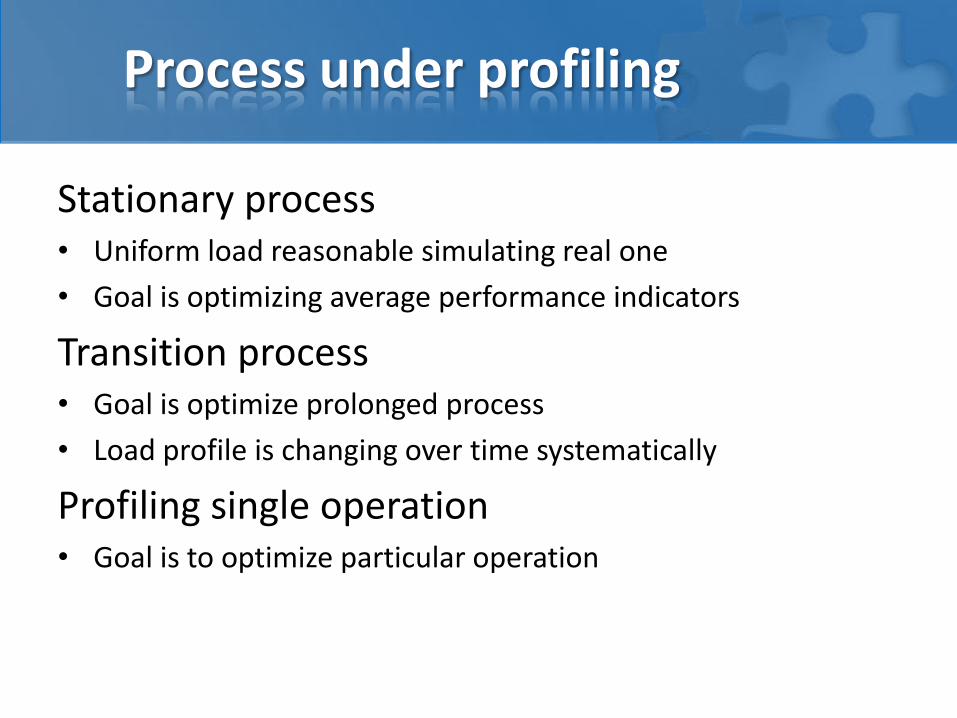
Process under profiling
Stationary process • Uniform load reasonable simulating real one
• Goal is optimizing average performance indicators
Transition process • Goal is optimize prolonged process
• Load profile is changing over time systematically
Profiling single operation • Goal is to optimize particular operation
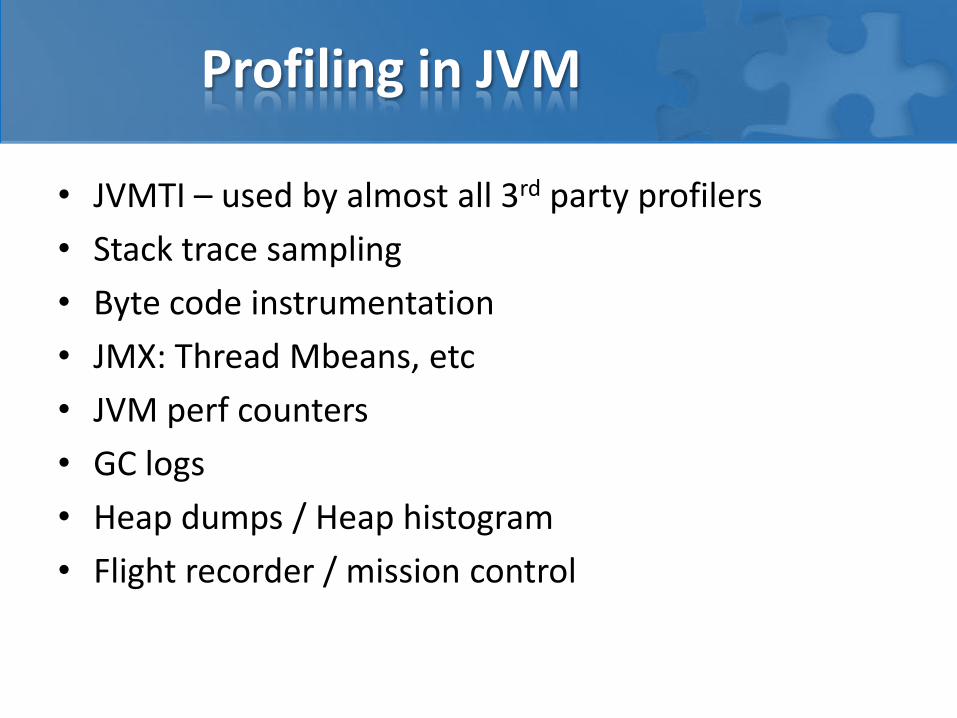
Profiling in JVM
• JVMTI – used by almost all 3rd party profilers
• Stack trace sampling
• Byte code instrumentation
• JMX: Thread Mbeans, etc
• JVM perf counters
• GC logs
• Heap dumps / Heap histogram
• Flight recorder / mission control
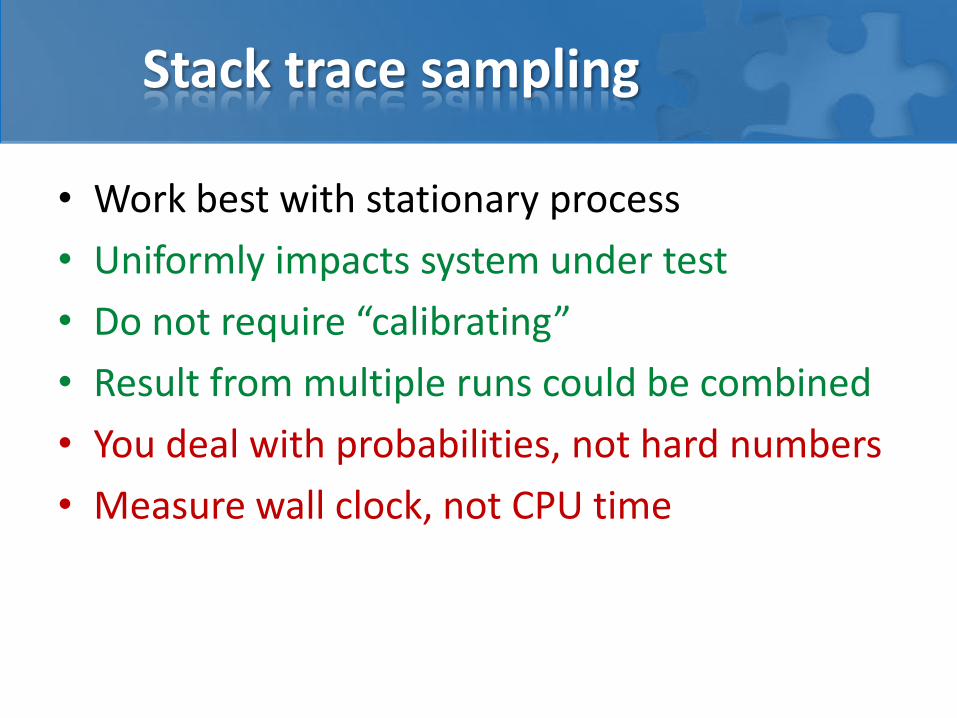
Stack trace sampling
• Work best with stationary process
• Uniformly impacts system under test
• Do not require “calibrating”
• Result from multiple runs could be combined
• You deal with probabilities, not hard numbers
• Measure wall clock, not CPU time
Byte code instrumentation
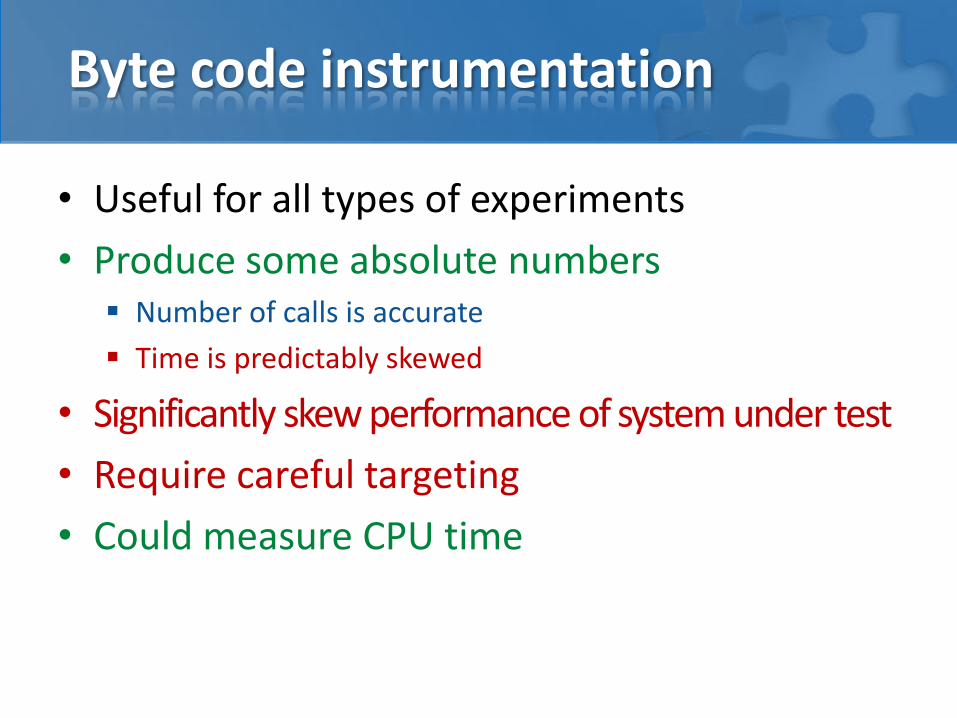
• Useful for all types of experiments
• Produce some absolute numbers Number of calls is accurate
Time is predictably skewed
• Significantly skew performance of system under test
• Require careful targeting
• Could measure CPU time
Flight recorder
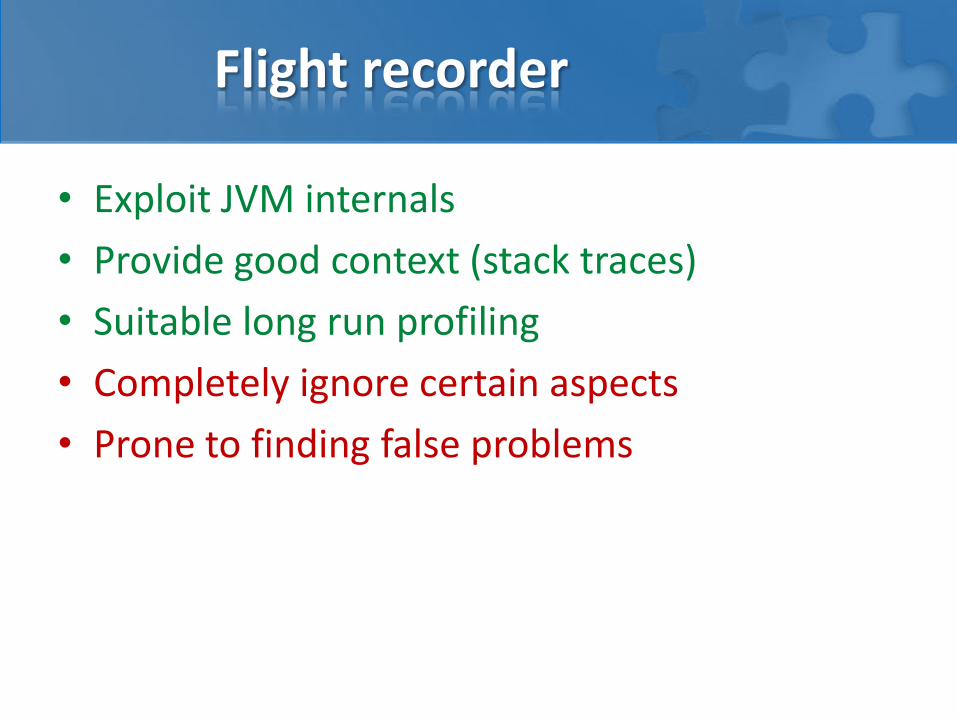
• Exploit JVM internals
• Provide good context (stack traces)
• Suitable long run profiling
• Completely ignore certain aspects
• Prone to finding false problems
Threading MBean
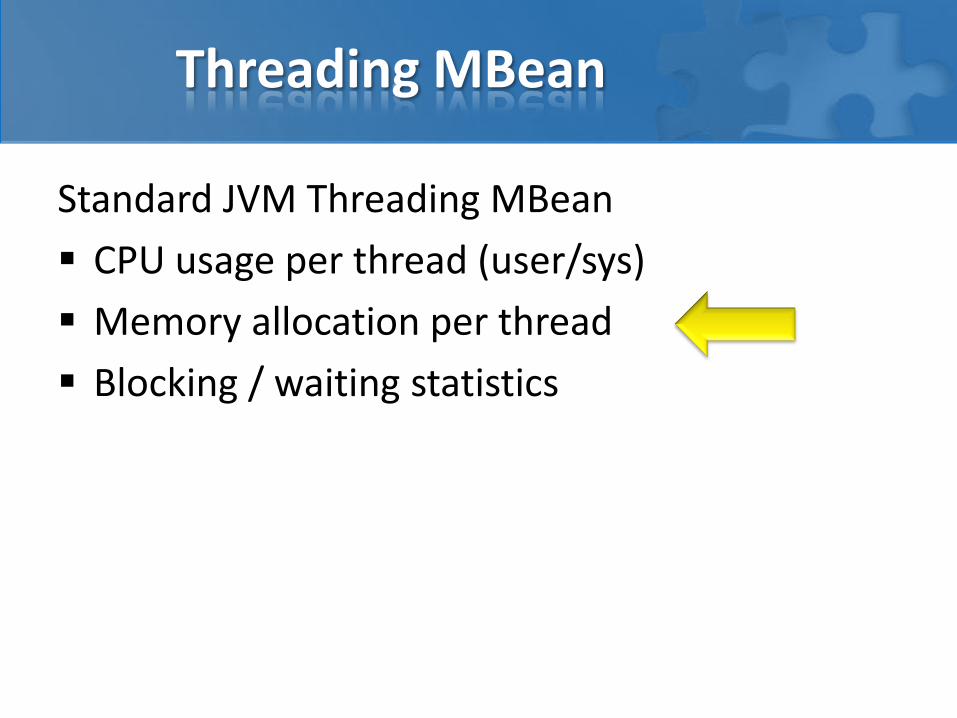
Standard JVM Threading MBean
CPU usage per thread (user/sys)
Memory allocation per thread
Blocking / waiting statistics
Start broad
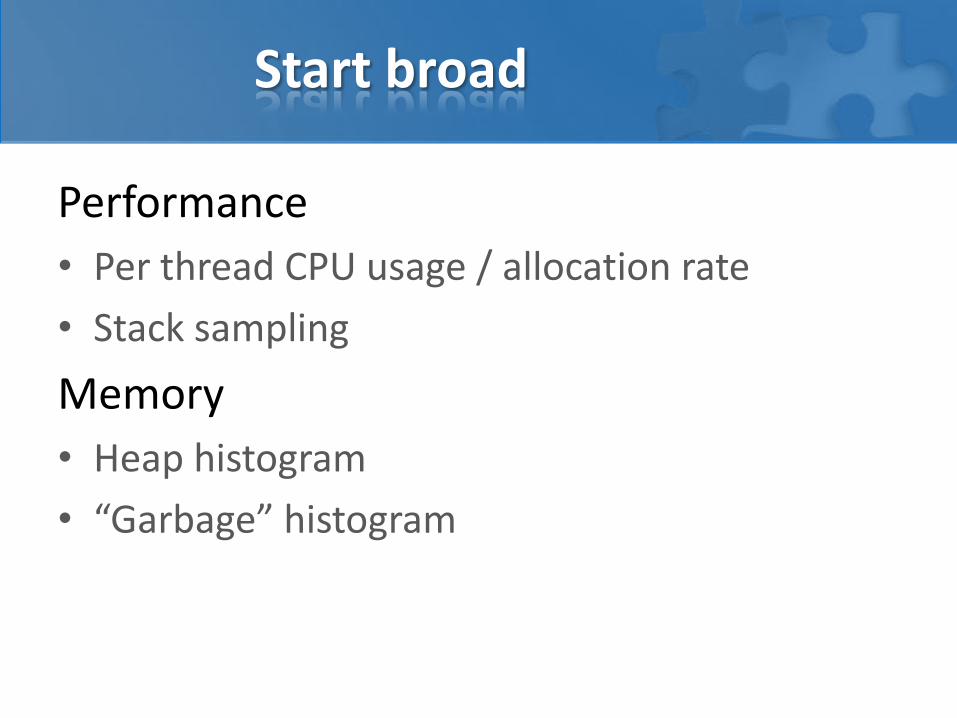
Performance
• Per thread CPU usage / allocation rate
• Stack sampling
Memory
• Heap histogram
• “Garbage” histogram
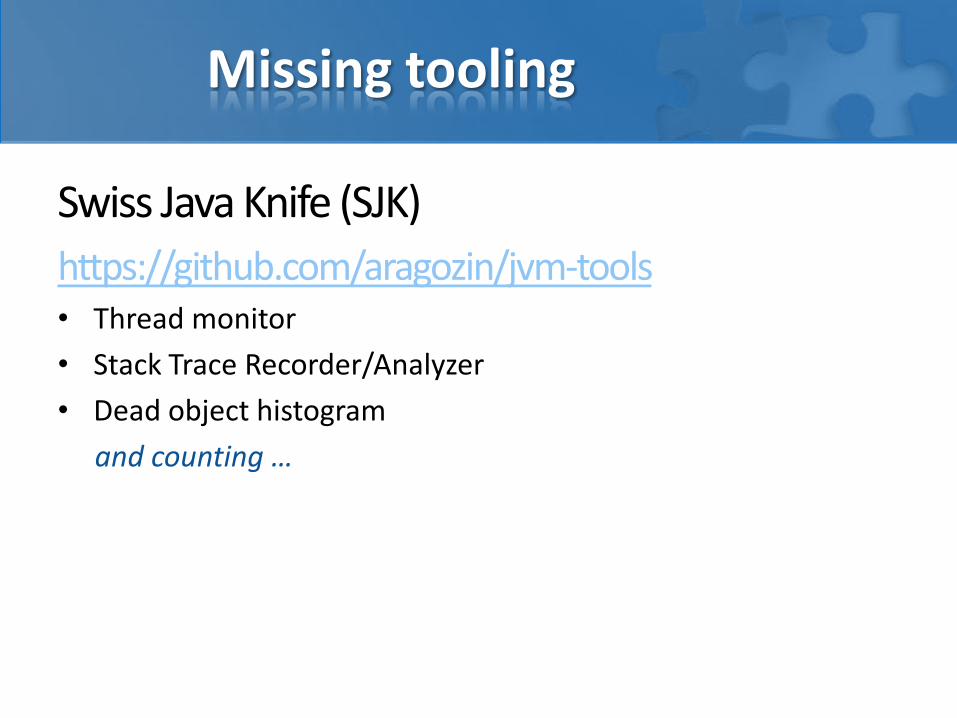
Missing tooling
Swiss Java Knife (SJK)
https://github.com/aragozin/jvm-tools • Thread monitor
• Stack Trace Recorder/Analyzer
• Dead object histogram
and counting …
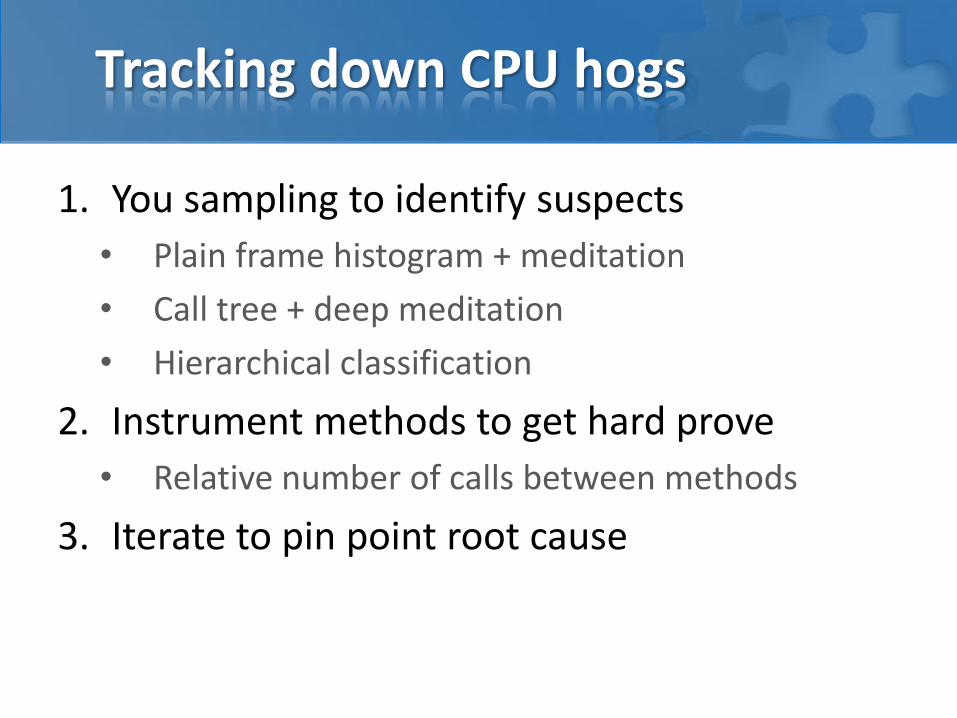
Tracking down CPU hogs
1. You sampling to identify suspects
• Plain frame histogram + meditation
• Call tree + deep meditation
• Hierarchical classification
2. Instrument methods to get hard prove
• Relative number of calls between methods
3. Iterate to pin point root cause
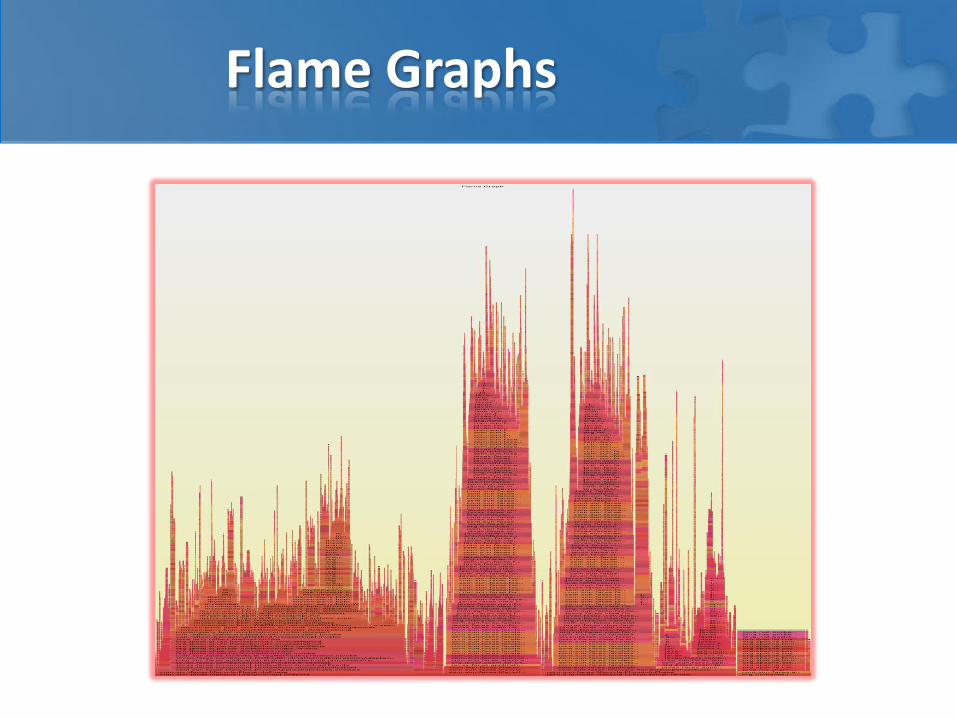
Flame Graphs
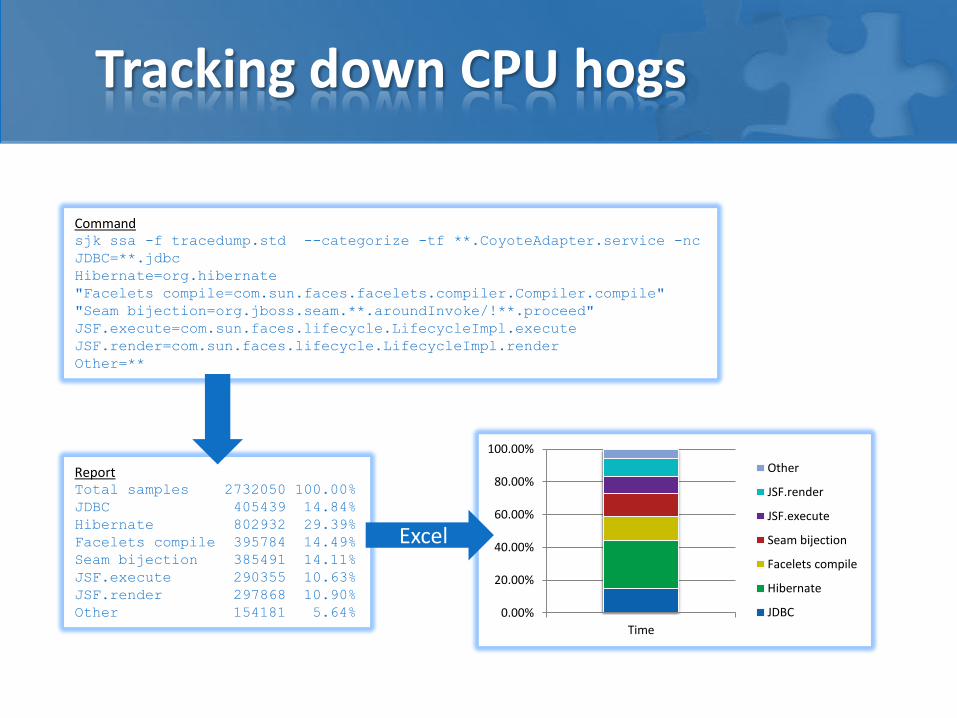
Tracking down CPU hogs
Command sjk ssa -f tracedump.std --categorize -tf **.CoyoteAdapter.service -nc
JDBC=**.jdbc
Hibernate=org.hibernate
"Facelets compile=com.sun.faces.facelets.compiler.Compiler.compile"
"Seam bijection=org.jboss.seam.**.aroundInvoke/!**.proceed"
JSF.execute=com.sun.faces.lifecycle.LifecycleImpl.execute
JSF.render=com.sun.faces.lifecycle.LifecycleImpl.render
Other=**
Report Total samples 2732050 100.00%
JDBC 405439 14.84%
Hibernate 802932 29.39%
Facelets compile 395784 14.49%
Seam bijection 385491 14.11%
JSF.execute 290355 10.63%
JSF.render 297868 10.90%
Other 154181 5.64% 0.00%
20.00%
40.00%
60.00%
80.00%
100.00%
Time
Other
JSF.render
JSF.execute
Seam bijection
Facelets compile
Hibernate
JDBC
Excel
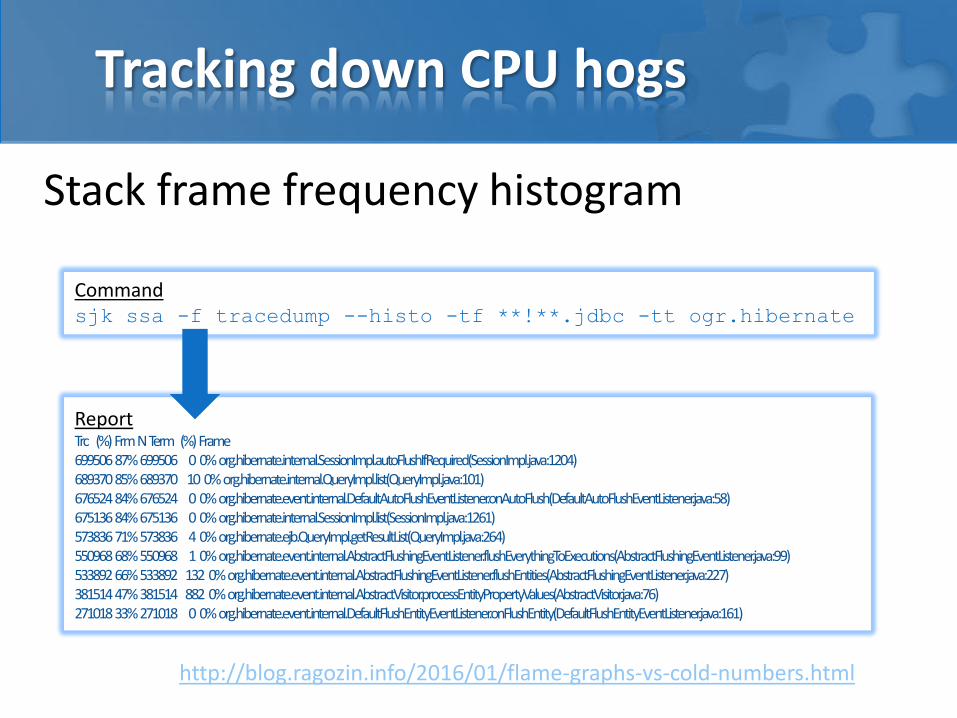
Tracking down CPU hogs
Stack frame frequency histogram
Command sjk ssa -f tracedump --histo -tf **!**.jdbc -tt ogr.hibernate
Report Trc (%) Frm N Term (%) Frame 699506 87% 699506 0 0% org.hibernate.internal.SessionImpl.autoFlushIfRequired(SessionImpl.java:1204) 689370 85% 689370 10 0% org.hibernate.internal.QueryImpl.list(QueryImpl.java:101) 676524 84% 676524 0 0% org.hibernate.event.internal.DefaultAutoFlushEventListener.onAutoFlush(DefaultAutoFlushEventListener.java:58) 675136 84% 675136 0 0% org.hibernate.internal.SessionImpl.list(SessionImpl.java:1261) 573836 71% 573836 4 0% org.hibernate.ejb.QueryImpl.getResultList(QueryImpl.java:264) 550968 68% 550968 1 0% org.hibernate.event.internal.AbstractFlushingEventListener.flushEverythingToExecutions(AbstractFlushingEventListener.java:99) 533892 66% 533892 132 0% org.hibernate.event.internal.AbstractFlushingEventListener.flushEntities(AbstractFlushingEventListener.java:227) 381514 47% 381514 882 0% org.hibernate.event.internal.AbstractVisitor.processEntityPropertyValues(AbstractVisitor.java:76) 271018 33% 271018 0 0% org.hibernate.event.internal.DefaultFlushEntityEventListener.onFlushEntity(DefaultFlushEntityEventListener.java:161)
http://blog.ragozin.info/2016/01/flame-graphs-vs-cold-numbers.html
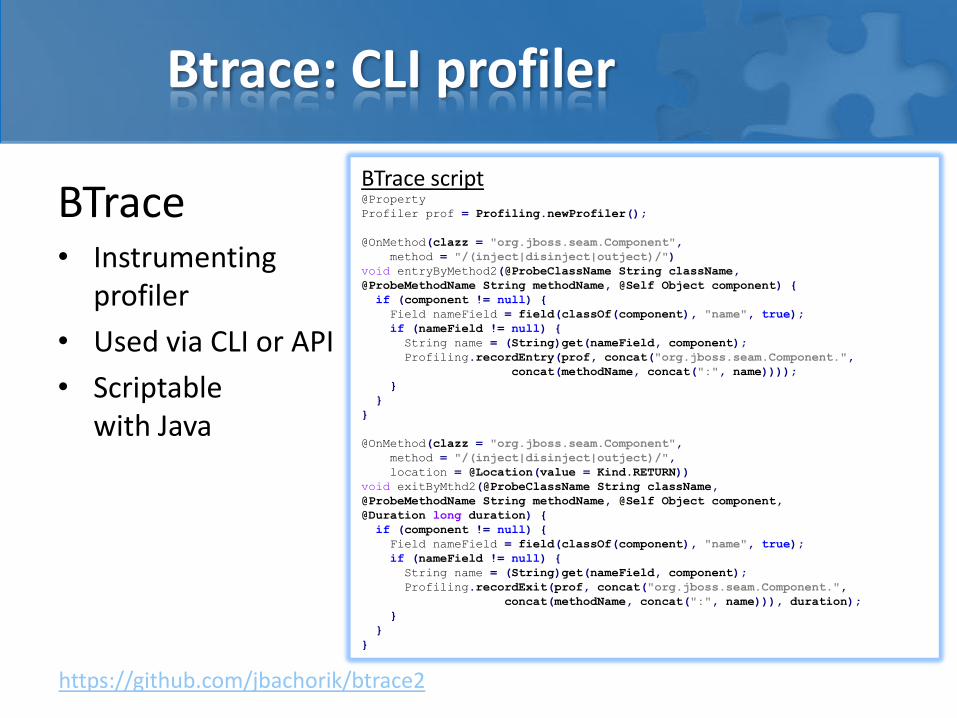
Btrace: CLI profiler
BTrace • Instrumenting
profiler
• Used via CLI or API
• Scriptable with Java
BTrace script @Property
Profiler prof = Profiling.newProfiler();
@OnMethod(clazz = "org.jboss.seam.Component",
method = "/(inject|disinject|outject)/")
void entryByMethod2(@ProbeClassName String className,
@ProbeMethodName String methodName, @Self Object component) {
if (component != null) {
Field nameField = field(classOf(component), "name", true);
if (nameField != null) {
String name = (String)get(nameField, component);
Profiling.recordEntry(prof, concat("org.jboss.seam.Component.",
concat(methodName, concat(":", name))));
}
}
}
@OnMethod(clazz = "org.jboss.seam.Component",
method = "/(inject|disinject|outject)/",
location = @Location(value = Kind.RETURN))
void exitByMthd2(@ProbeClassName String className,
@ProbeMethodName String methodName, @Self Object component,
@Duration long duration) {
if (component != null) {
Field nameField = field(classOf(component), "name", true);
if (nameField != null) {
String name = (String)get(nameField, component);
Profiling.recordExit(prof, concat("org.jboss.seam.Component.",
concat(methodName, concat(":", name))), duration);
}
}
}
https://github.com/jbachorik/btrace2
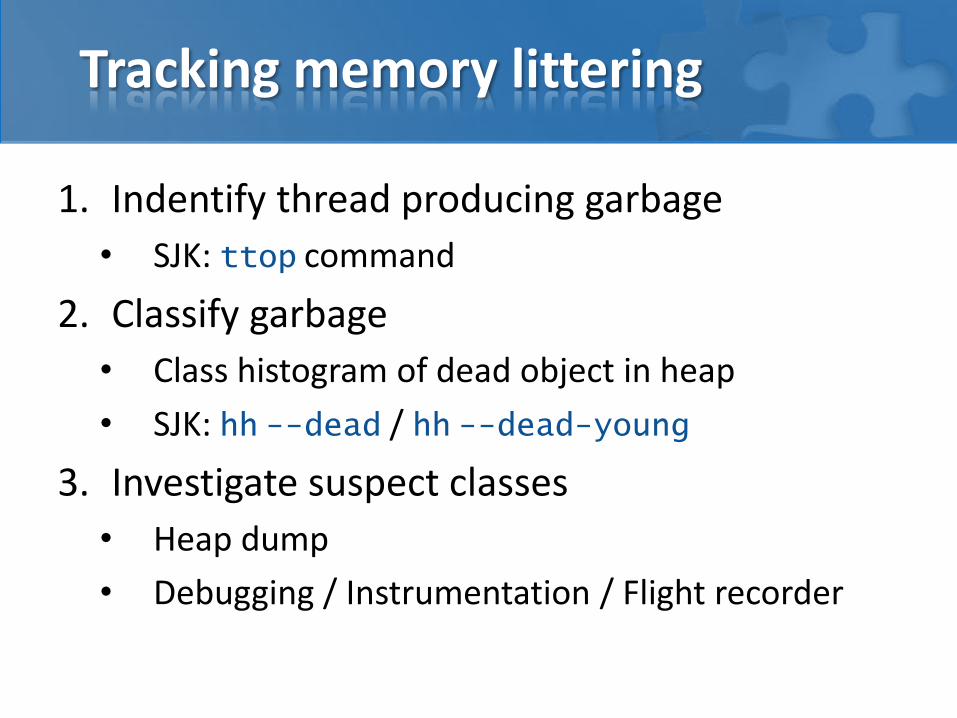
Tracking memory littering
1. Indentify thread producing garbage
• SJK: ttop command
2. Classify garbage
• Class histogram of dead object in heap
• SJK: hh --dead / hh --dead-young
3. Investigate suspect classes
• Heap dump
• Debugging / Instrumentation / Flight recorder
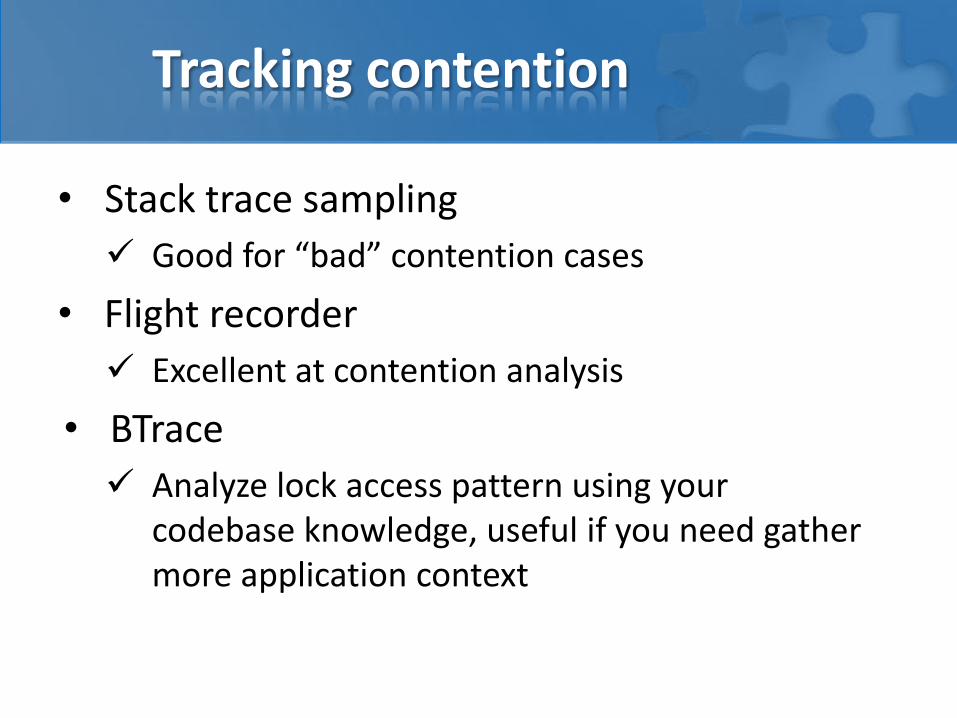
Tracking contention
• Stack trace sampling
Good for “bad” contention cases
• Flight recorder
Excellent at contention analysis
• BTrace
Analyze lock access pattern using your codebase knowledge, useful if you need gather more application context
Conclusion
Understand desired target state
Progress slow and steady • Do not get side tracked from real problem
Start from broad techniques • Stack trace sampling
• Garbage histogram
Dig deeper with more advanced tools • Targeted instrumentation
• Flight recorder metrics
KEEP CALM
AND CRACK YOUR JAVA PROBLEMS
Alexey Ragozin
http://blog.ragozin.info - my articles http://github.com/aragozin http://github.com/gridkit - my open source code