Embed Size (px)
Citation preview
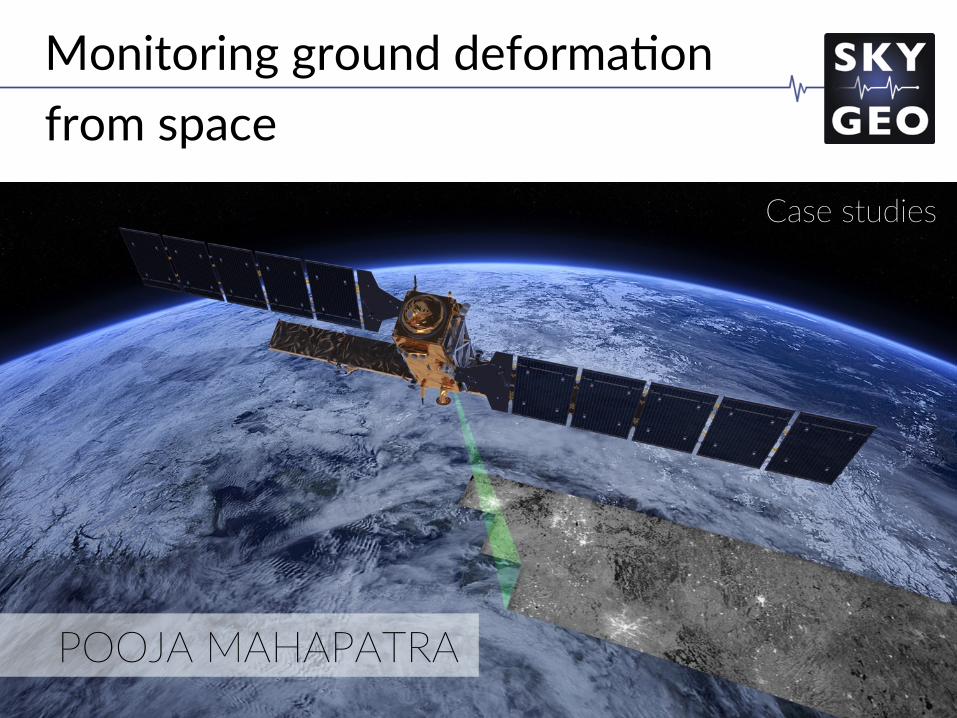
POOJA MAHAPATRA
Monitoring ground deforma/on from space
Case studies
Outline
• Why? • How? • When? And when not? • What do the results look like?
- Examples - Interac/ve demo
Ask ques/ons any/me!

Why?
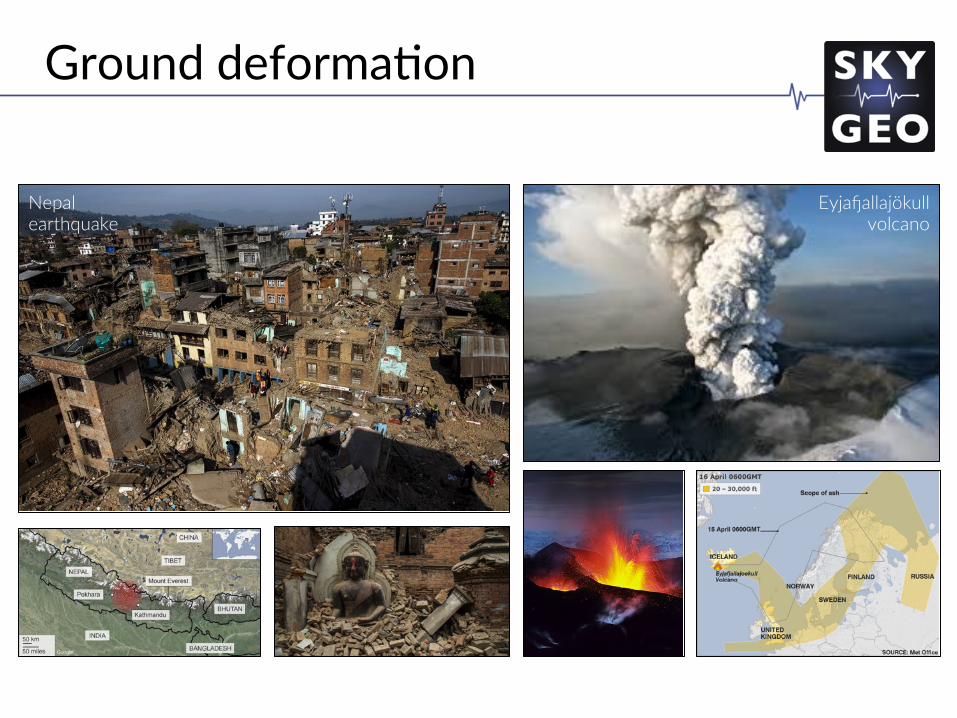
Nepal earthquake
Eyja0allajökull volcano
Ground deforma/on
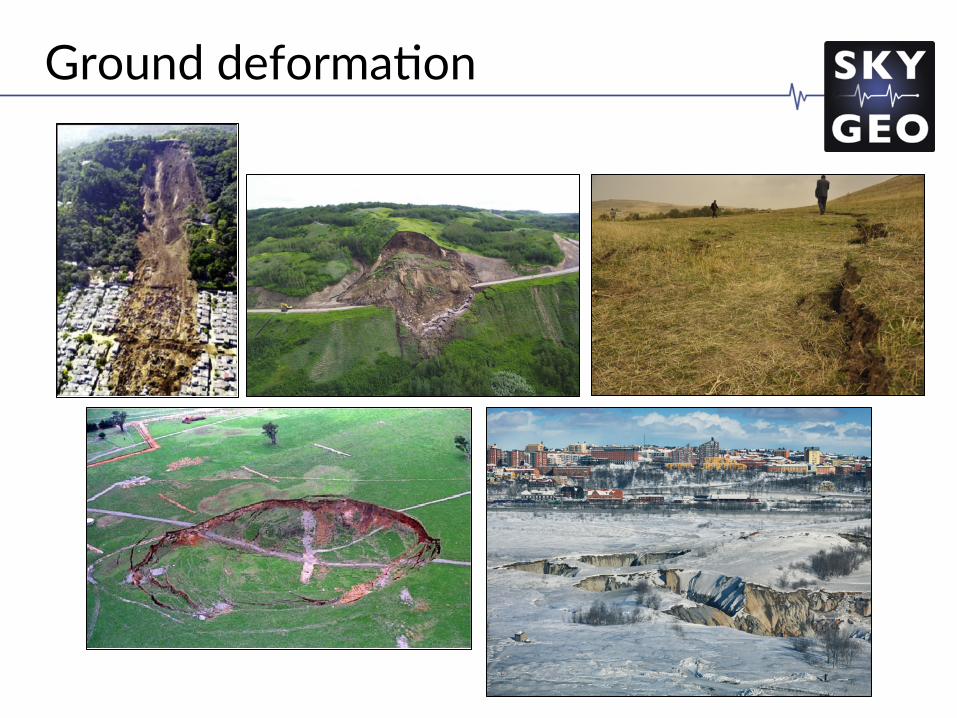
Ground deforma/on
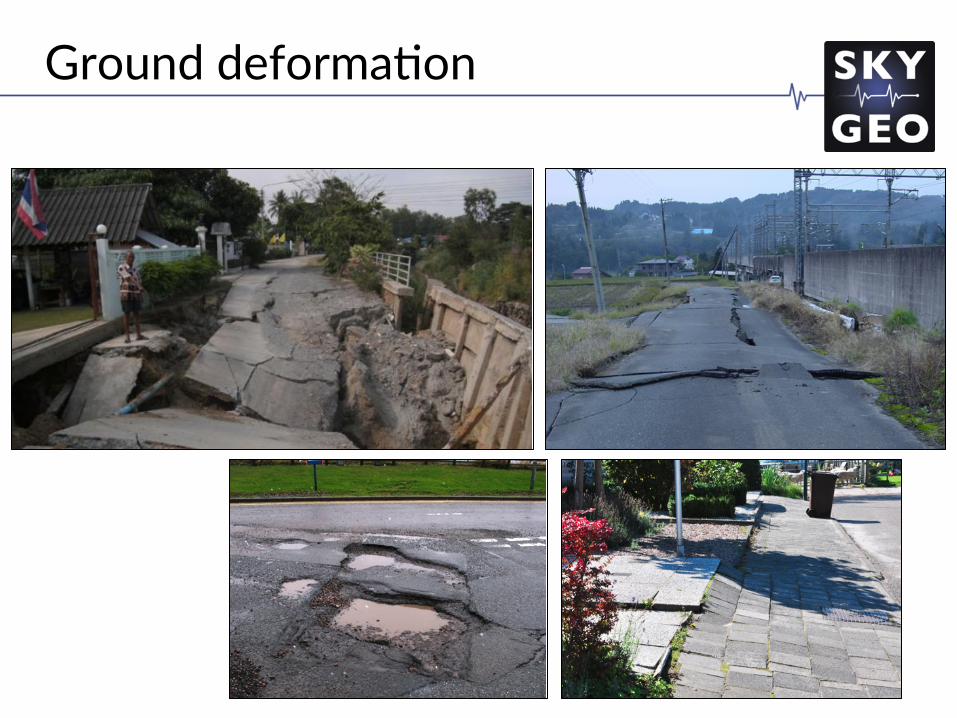
Ground deforma/on
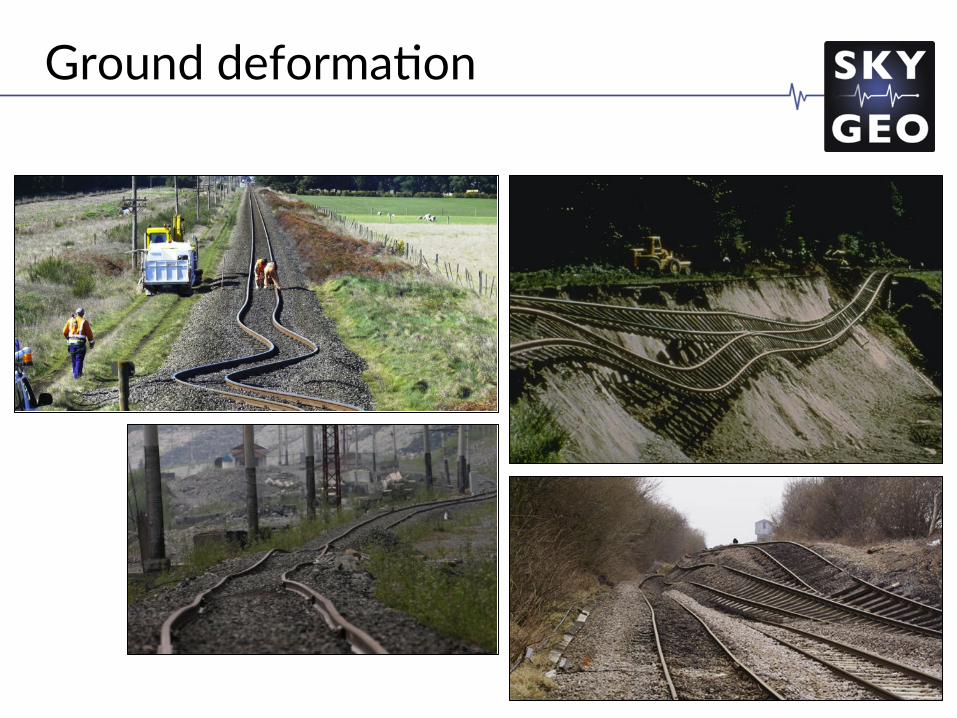
Ground deforma/on
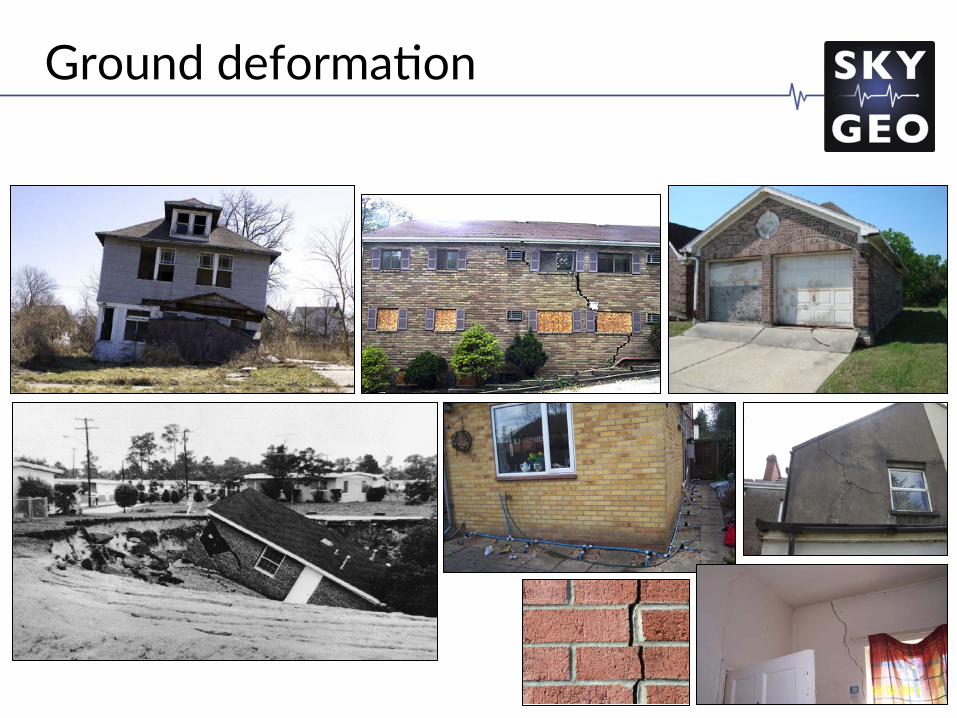
Ground deforma/on
How can we efficiently monitor large areas?
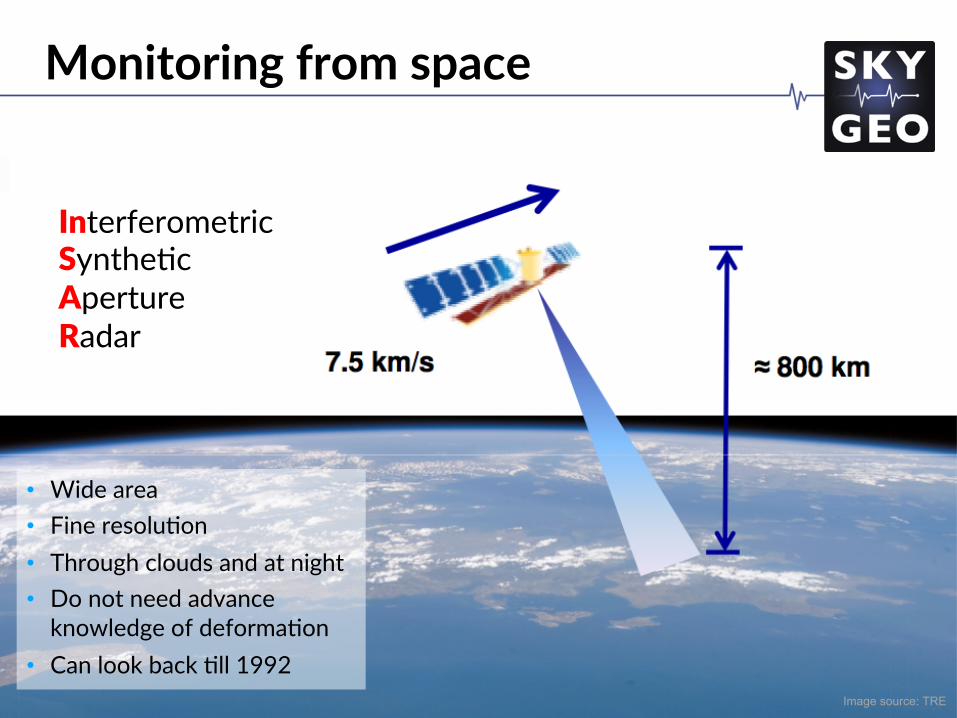
Monitoring from space
Interferometric Synthe/c Aperture Radar
• Wide area • Fine resolu/on • Through clouds and at night • Do not need advance
knowledge of deforma/on • Can look back /ll 1992
Image source: TRE
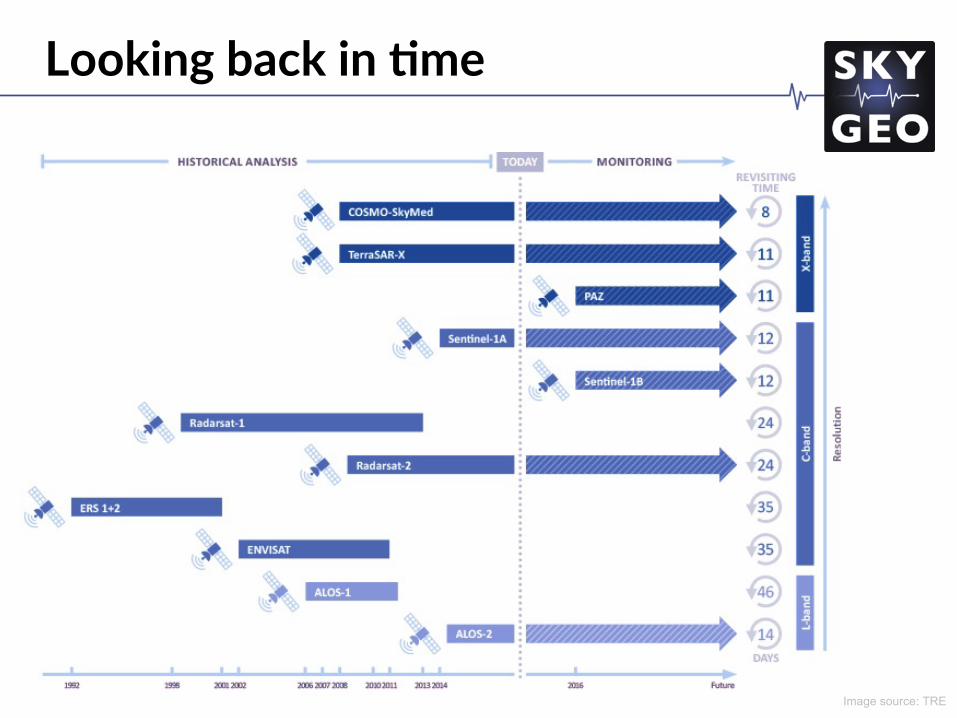
Looking back in =me
Image source: TRE
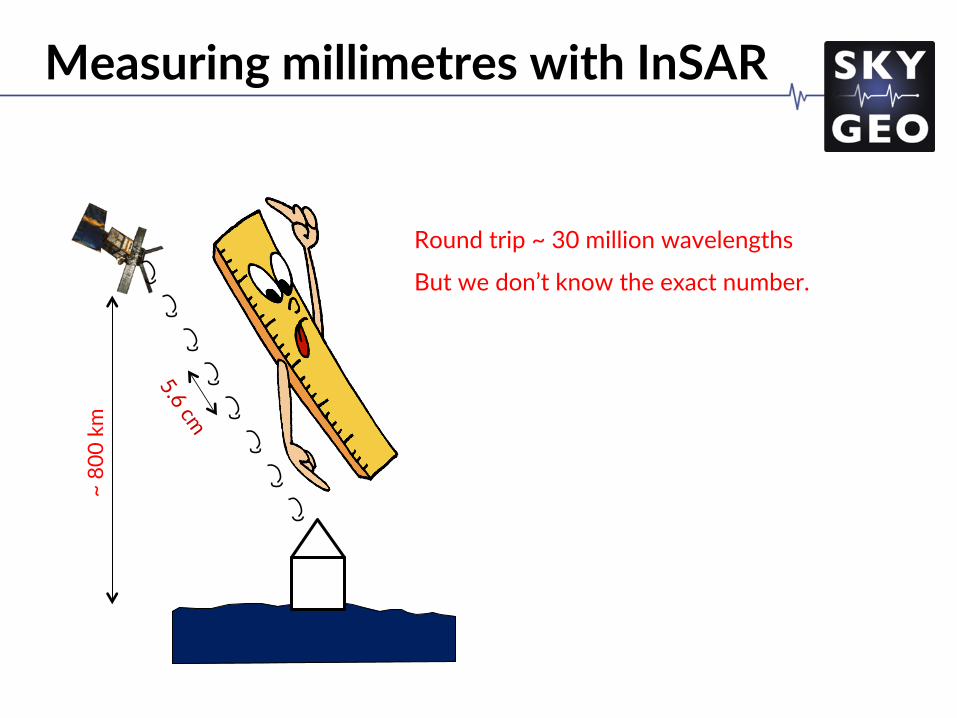
Measuring millimetres with InSAR
~ 80
0 km
Round trip ~ 30 million wavelengths
But we don’t know the exact number.
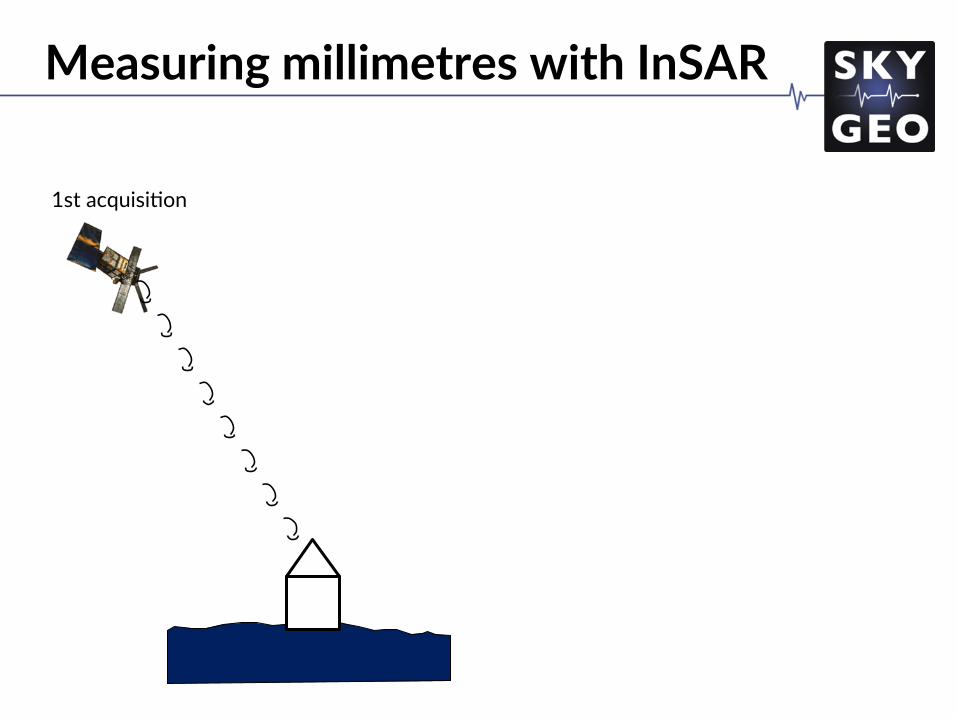
Measuring millimetres with InSAR
1st acquisi/on
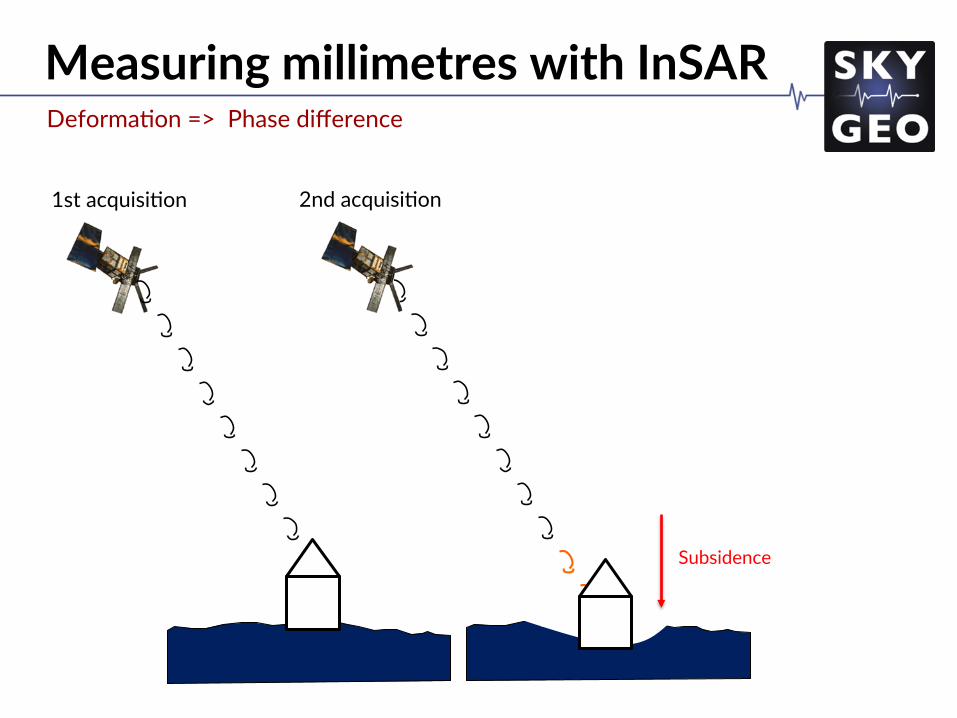
Measuring millimetres with InSAR
1st acquisi/on 2nd acquisi/on
Deforma/on => Phase difference
Subsidence
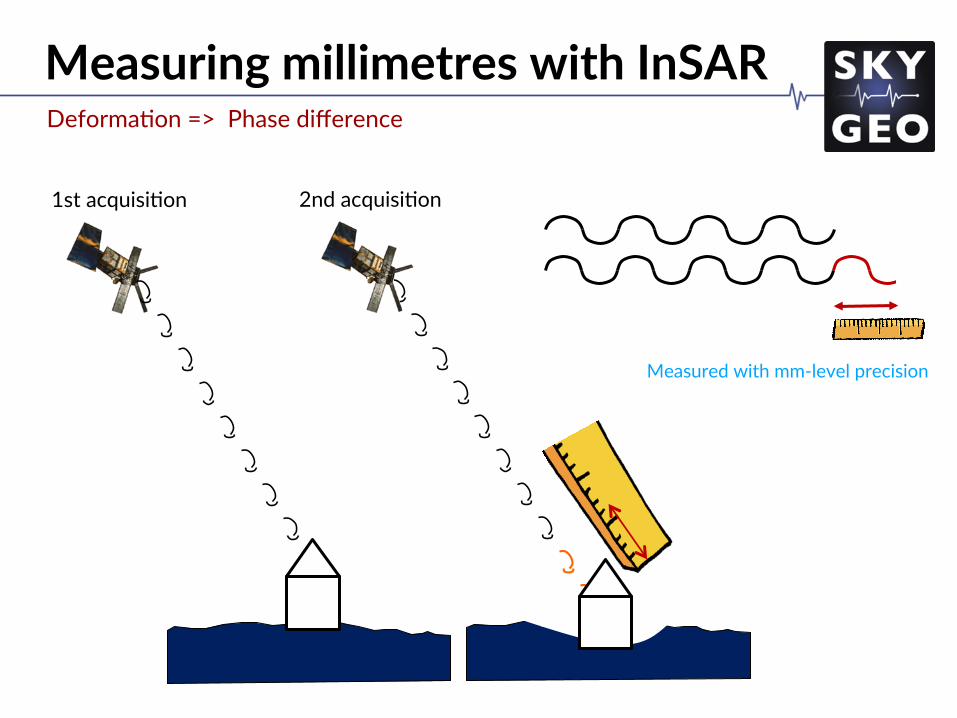
Measuring millimetres with InSAR
1st acquisi/on 2nd acquisi/on
Deforma/on => Phase difference
Measured with mm-level precision

OK, that’s easy. Where’s the catch?
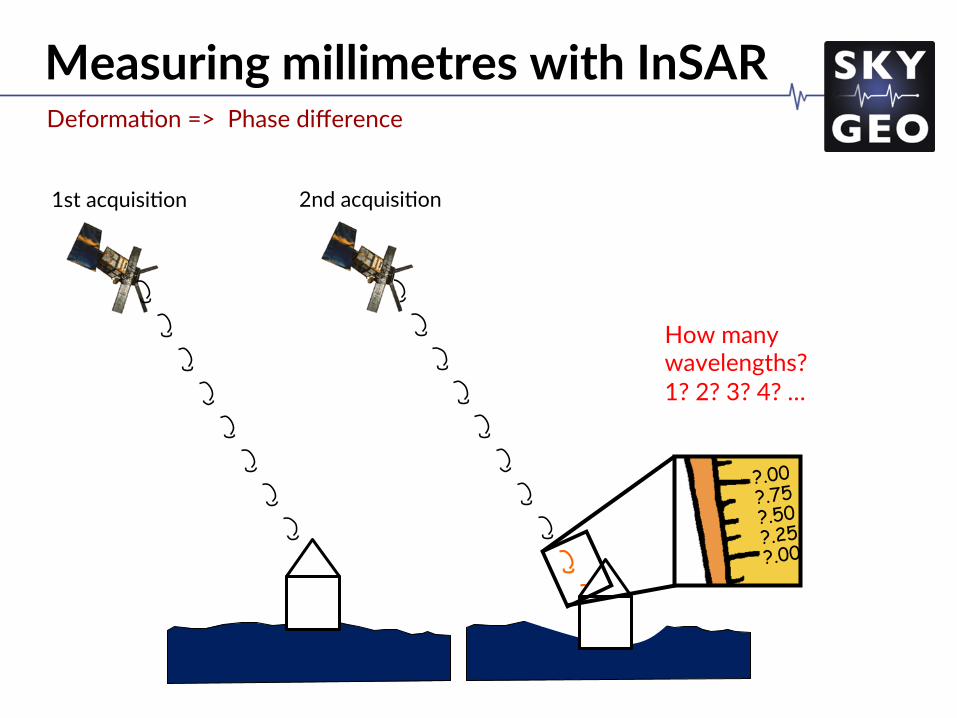
Measuring millimetres with InSAR
1st acquisi/on 2nd acquisi/on
Deforma/on => Phase difference
How many wavelengths? 1? 2? 3? 4? …
?.00
?.00 ?.75 ?.50 ?.25
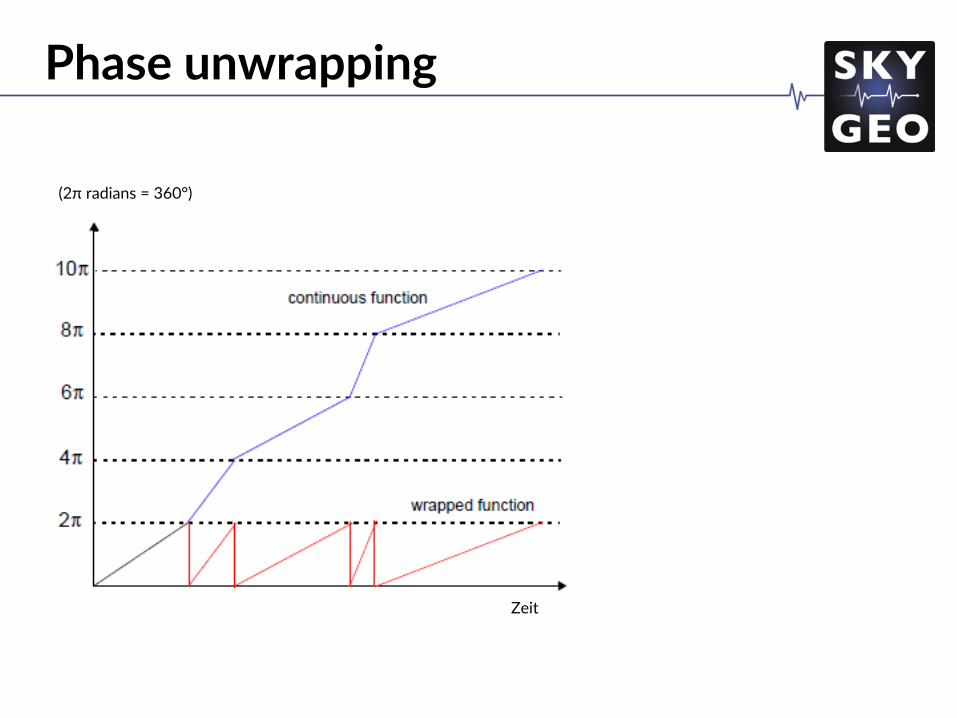
(2π radians = 360°)
Zeit
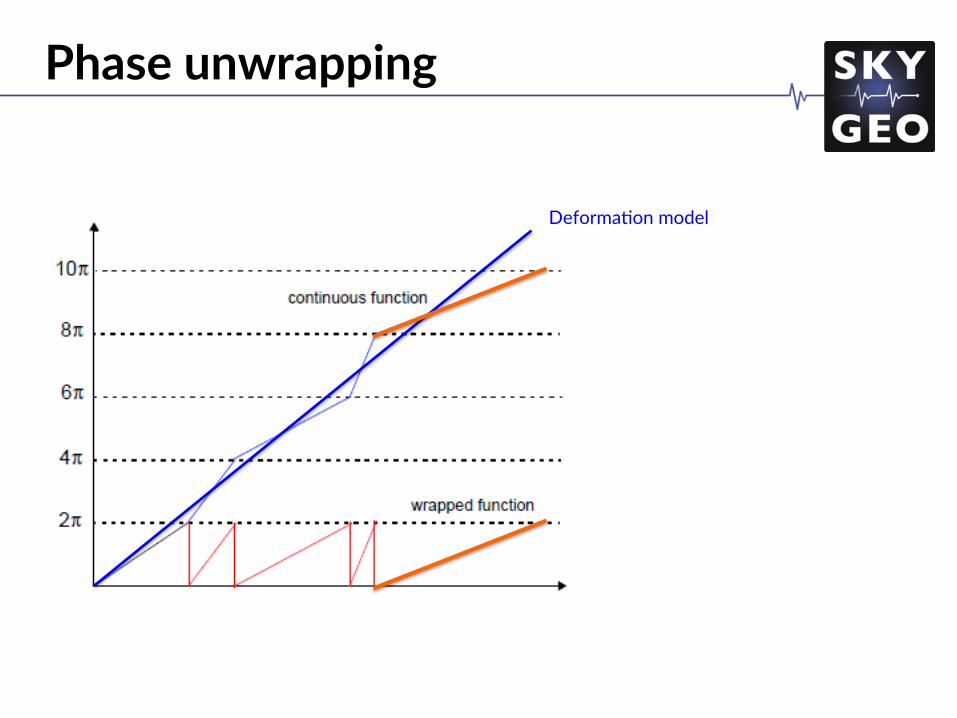
Phase unwrapping
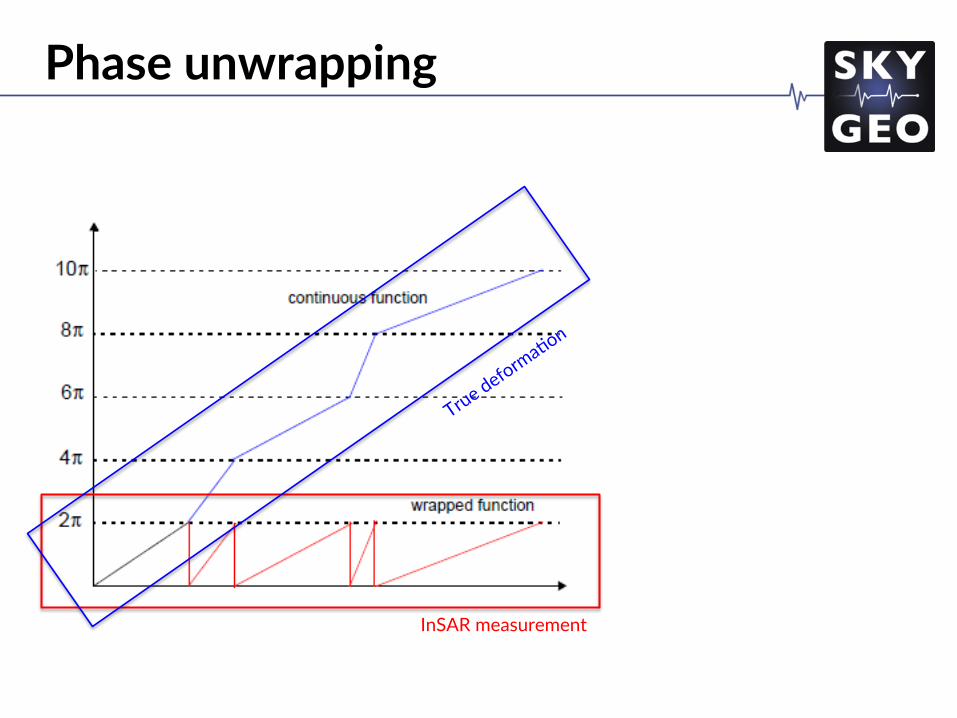
InSAR measurement
Phase unwrapping
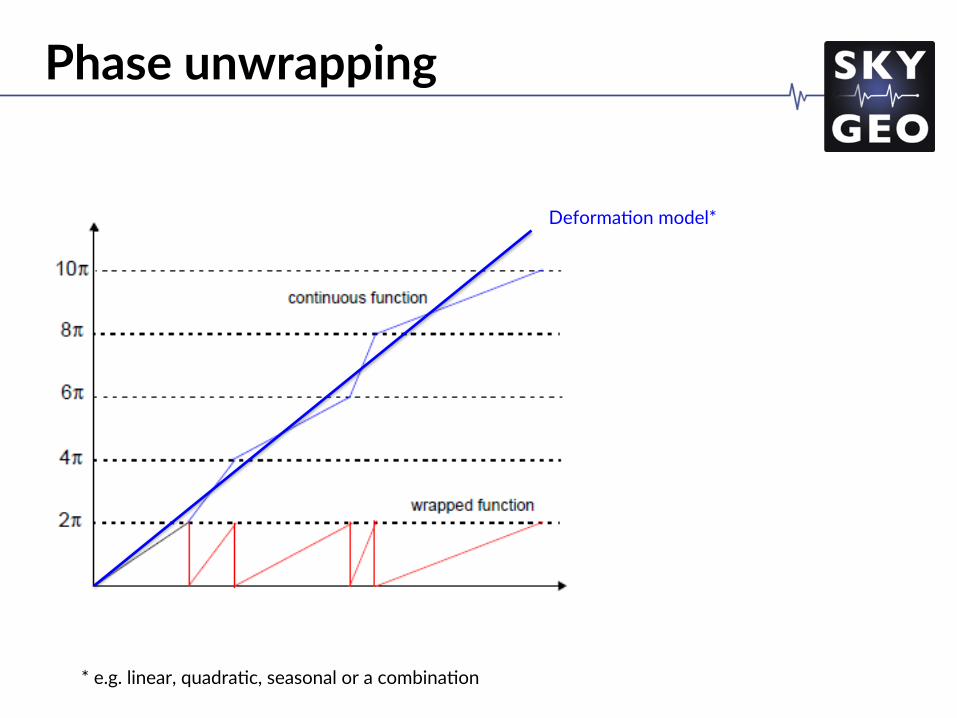
Deforma/on model*
* e.g. linear, quadra/c, seasonal or a combina/on
Phase unwrapping
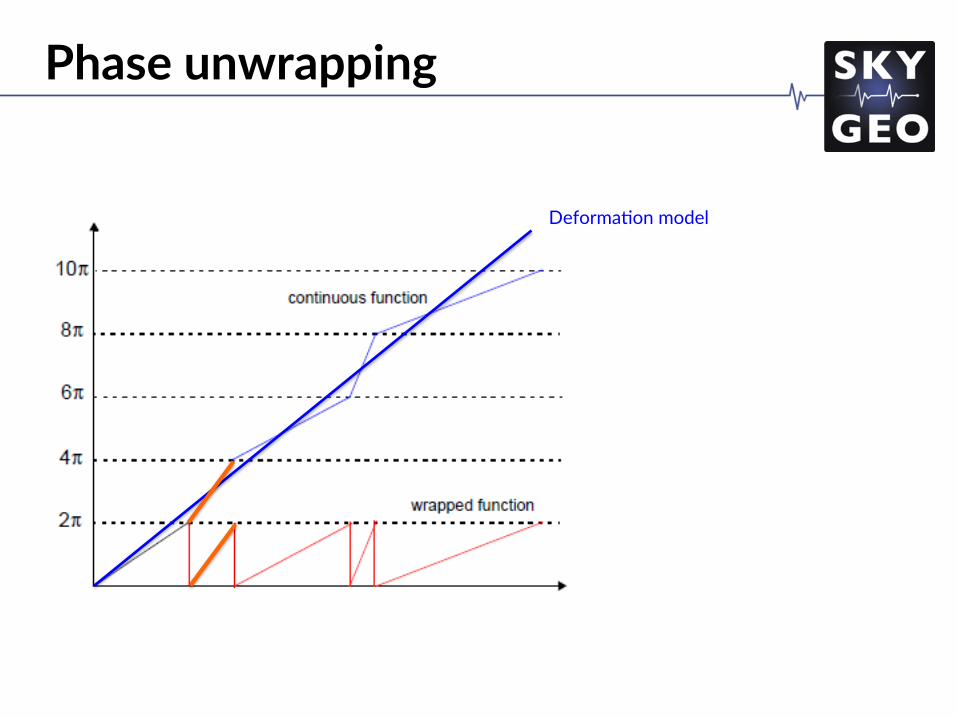
Deforma/on model
Phase unwrapping
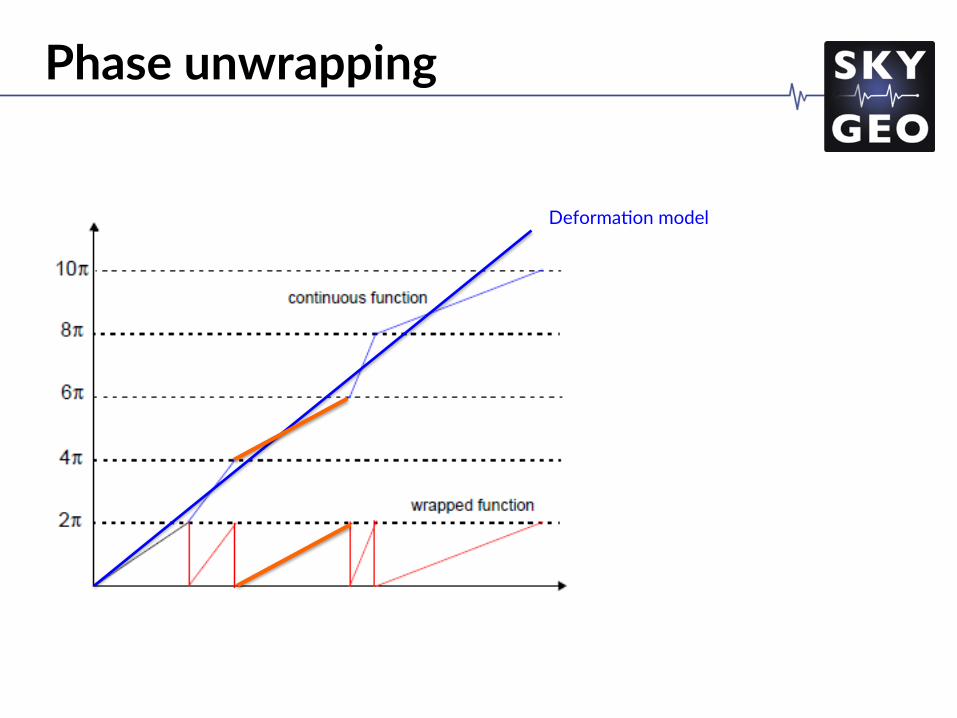
Deforma/on model
Phase unwrapping
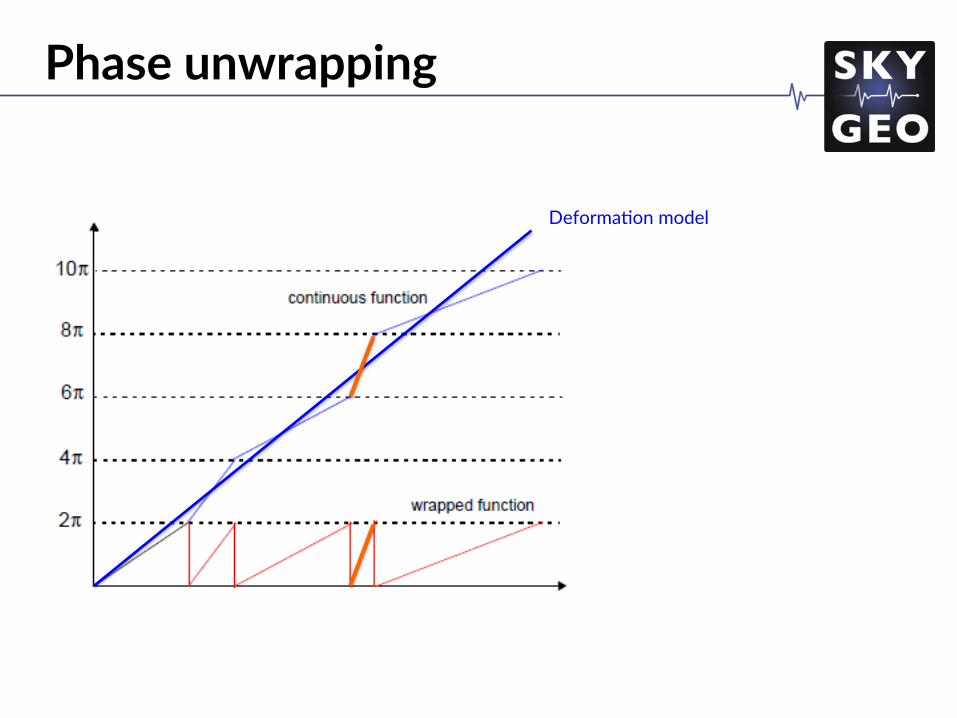
Deforma/on model
Phase unwrapping
Deforma/on model
Phase unwrapping

What does it look like?
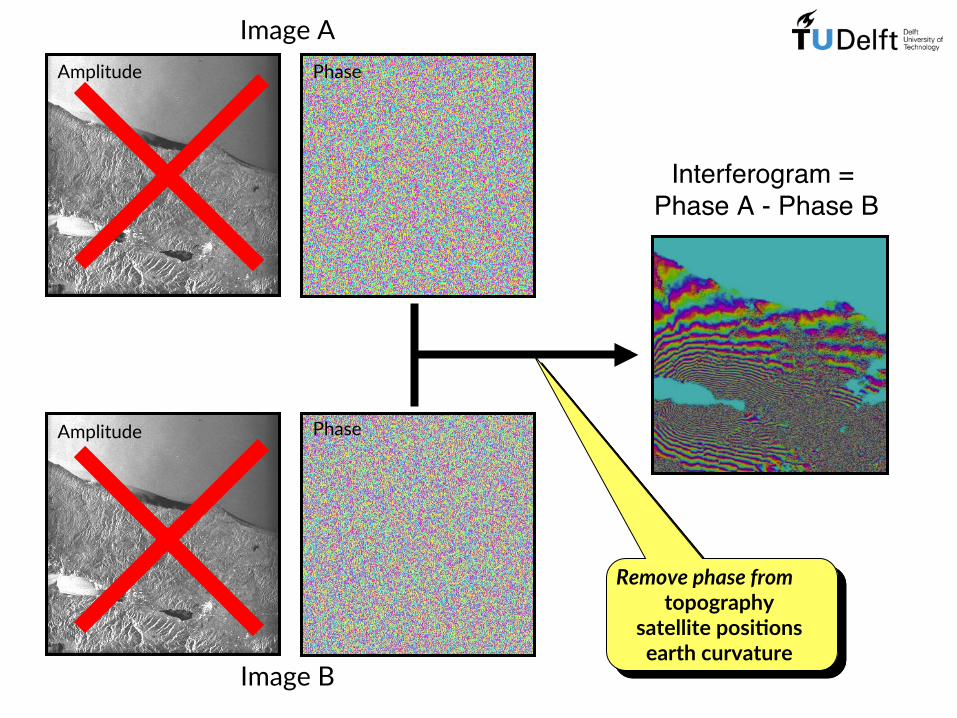
Image A
Image B
Interferogram = Phase A - Phase B
Remove phase from topography
satellite posi=ons earth curvature
Amplitude
Amplitude
Phase
Phase
Challenge the future 27/10/15
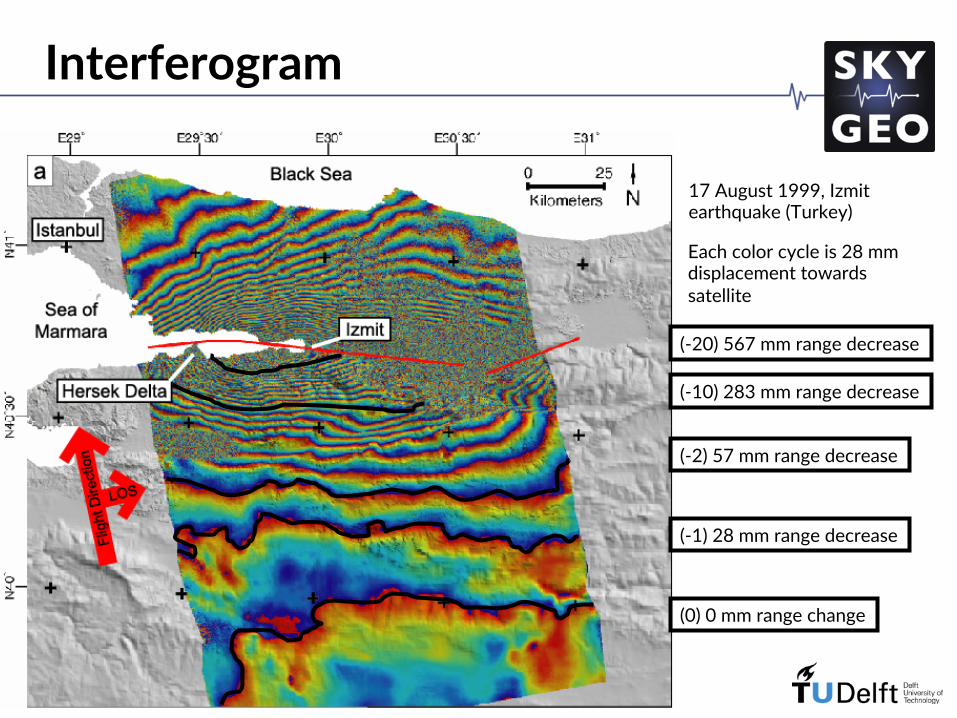
Each color cycle is 28 mm displacement towards satellite
(0) 0 mm range change
(-1) 28 mm range decrease
(-2) 57 mm range decrease
(-10) 283 mm range decrease
(-20) 567 mm range decrease
17 August 1999, Izmit earthquake (Turkey)
Interferogram
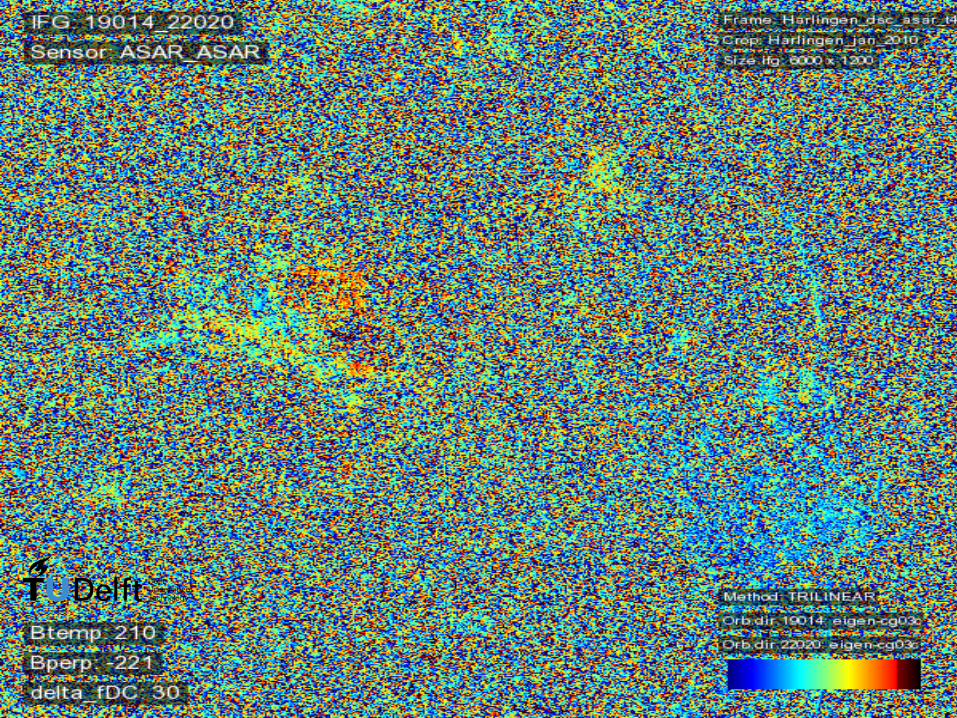
Majorlimitations
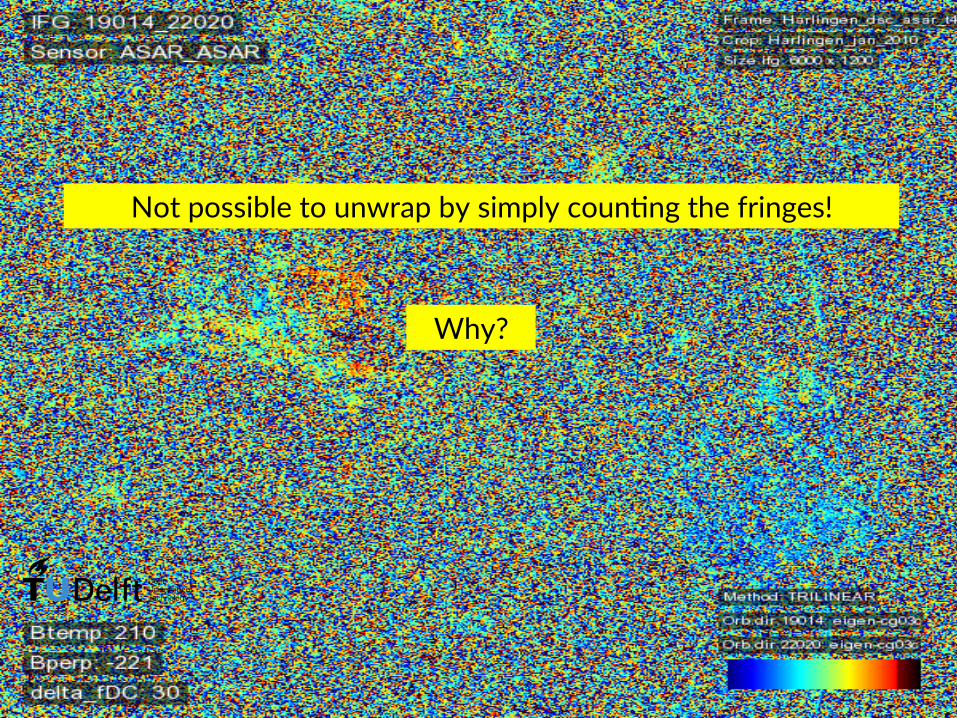
Majorlimitations
Not possible to unwrap by simply coun/ng the fringes!
Why?
1st acquisi9on 2nd acquisi9on
?
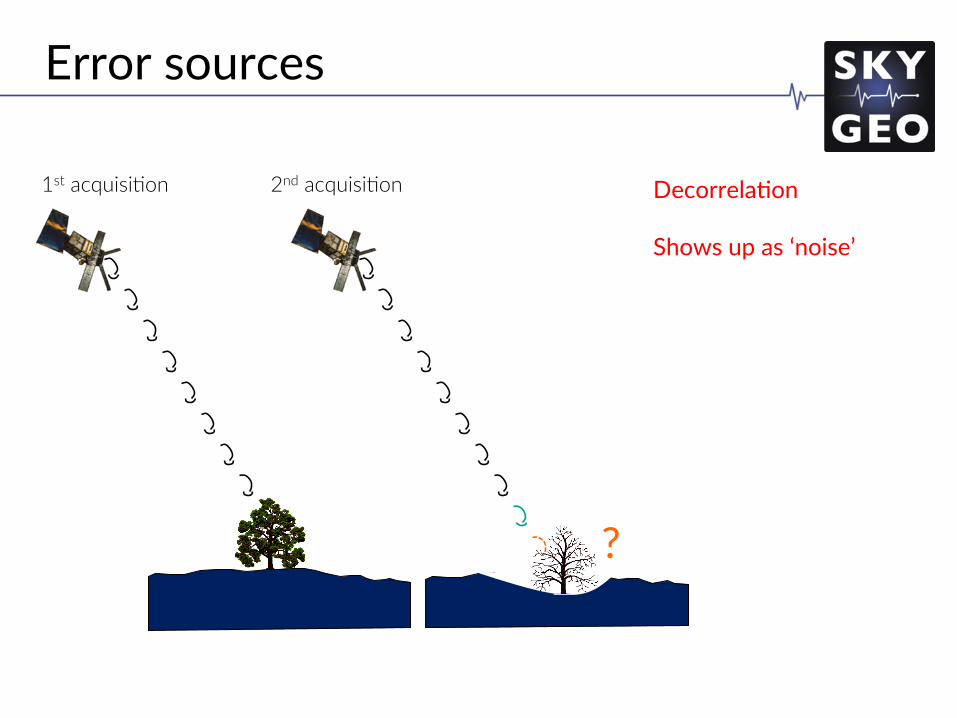
Error sources
Decorrela/on Shows up as ‘noise’
1st acquisi9on 2nd acquisi9on
?
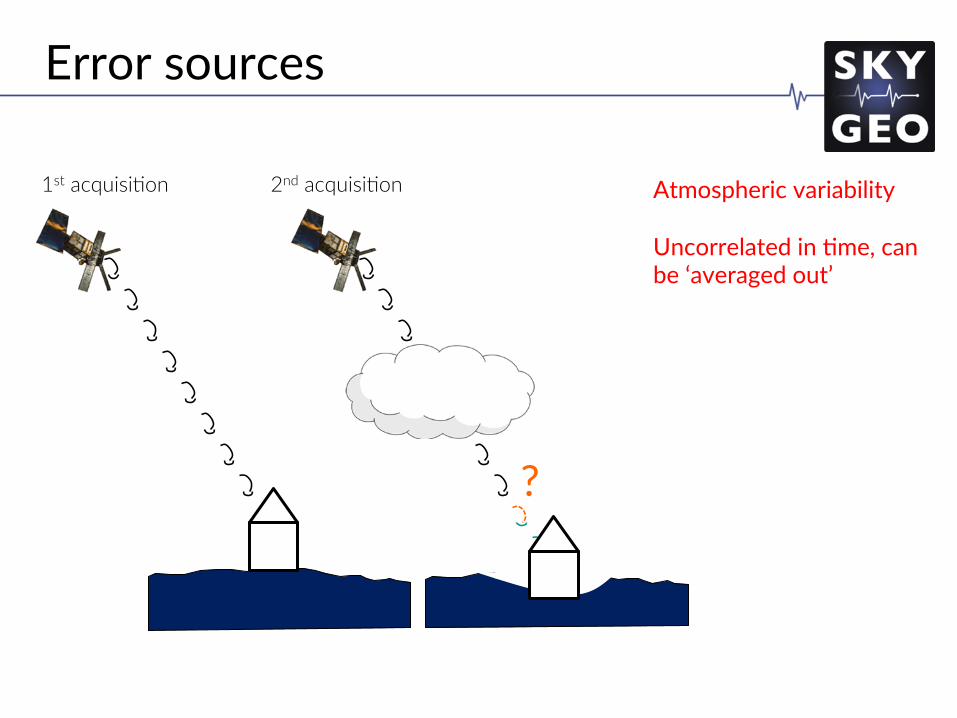
Error sources
Atmospheric variability Uncorrelated in /me, can be ‘averaged out’
Challenge the future
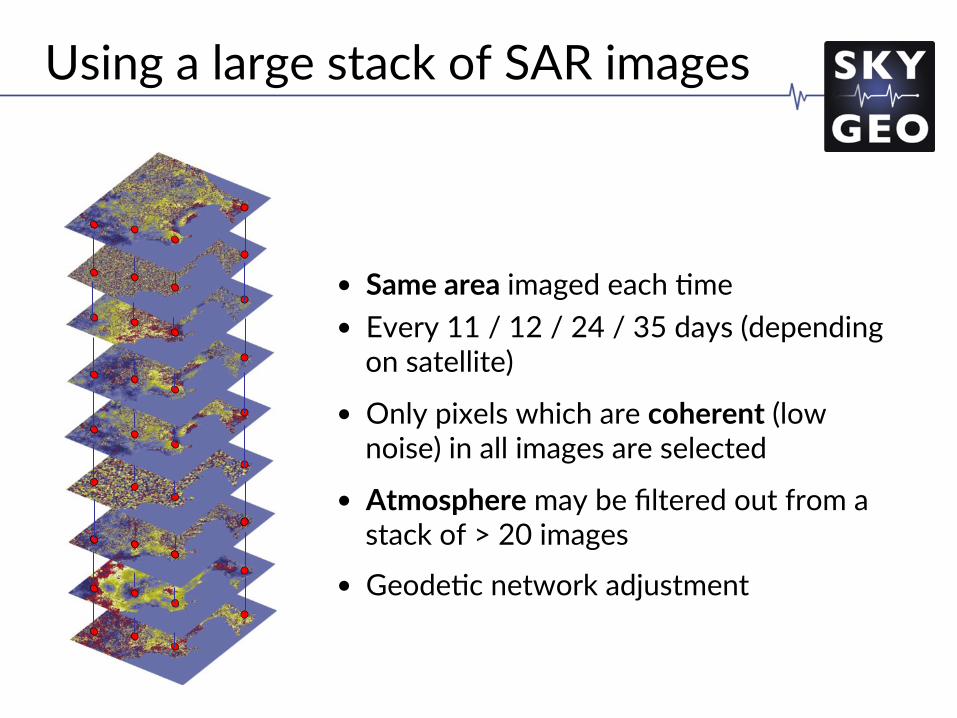
• Same area imaged each /me • Every 11 / 12 / 24 / 35 days (depending
on satellite)
• Only pixels which are coherent (low noise) in all images are selected
• Atmosphere may be filtered out from a stack of > 20 images
• Geode/c network adjustment
Using a large stack of SAR images
Challenge the future
When would you use InSAR?
• Over land? Water?
• Urban areas? Rural agricultural land?
• Dry rocky areas? Vegetated areas?
• Snow? Arc/c areas?
• Millimetre or cen/metre level deforma/on between images? Or metre level?
• Would 2 SAR images over a desert be enough? What about over Amsterdam? How does this relate to the /me-gap between images?
Quiz
Some results
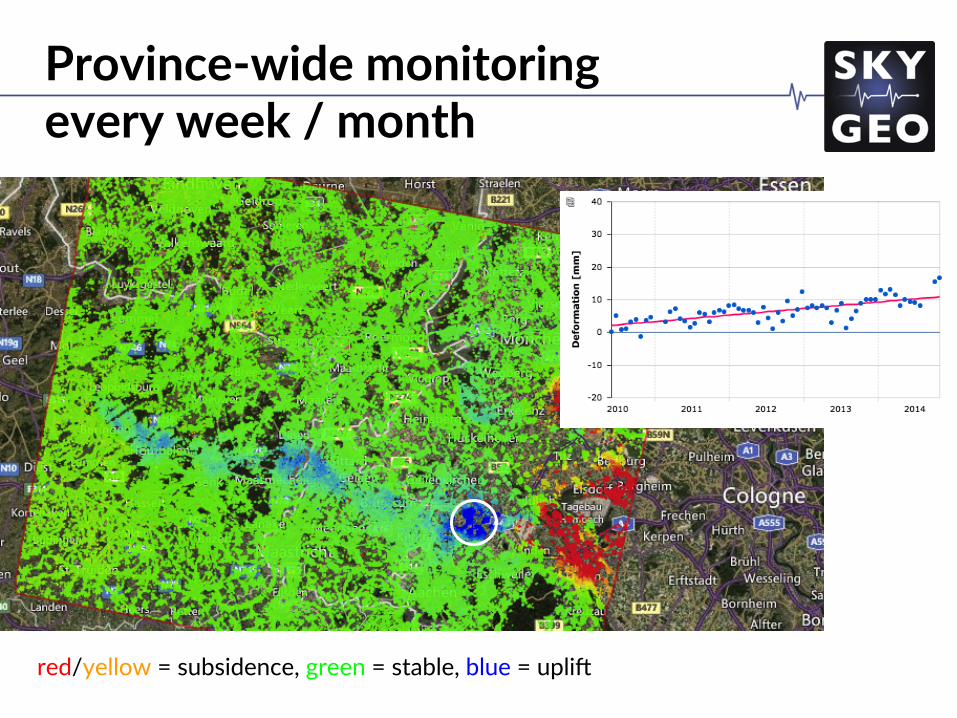
Province-wide monitoring every week / month
red/yellow = subsidence, green = stable, blue = uplio
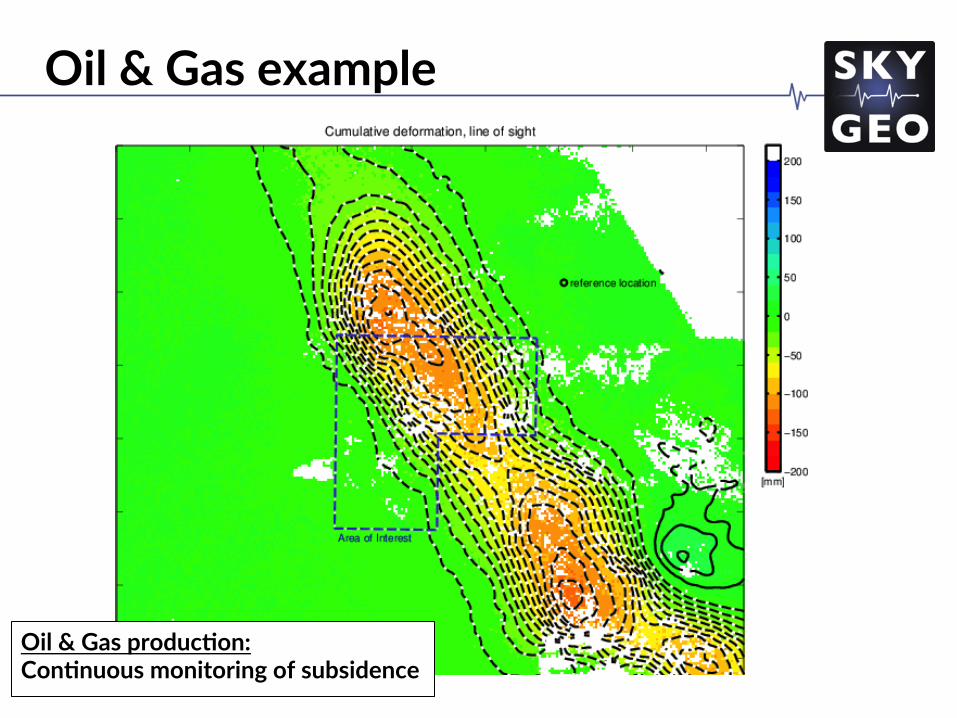
Oil & Gas produc=on: Con=nuous monitoring of subsidence
Oil & Gas example
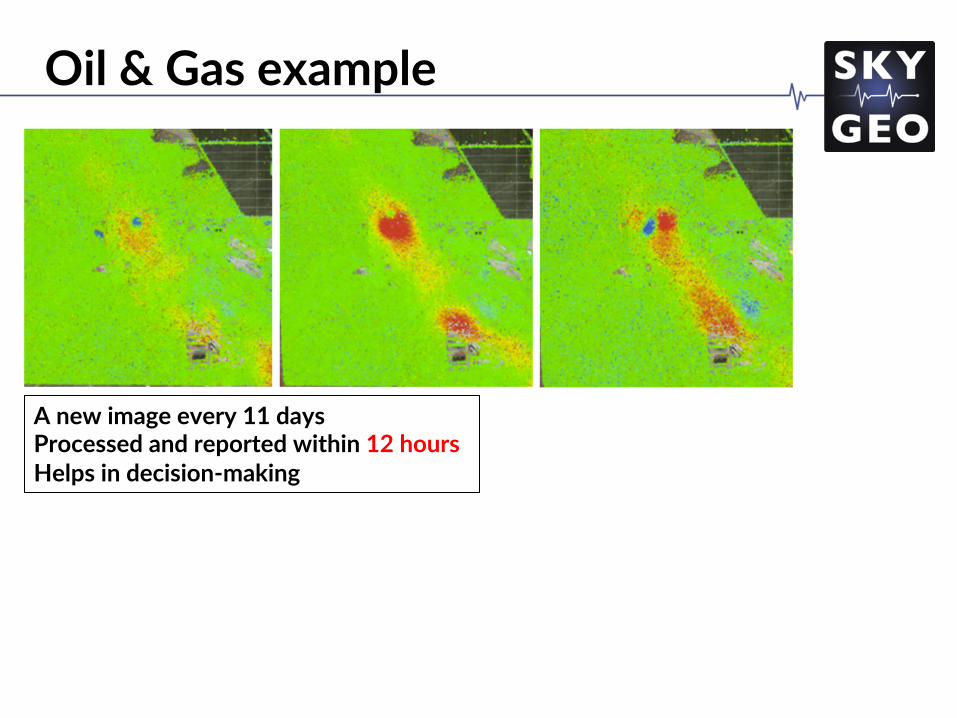
Oil & Gas example
A new image every 11 days Processed and reported within 12 hours Helps in decision-making
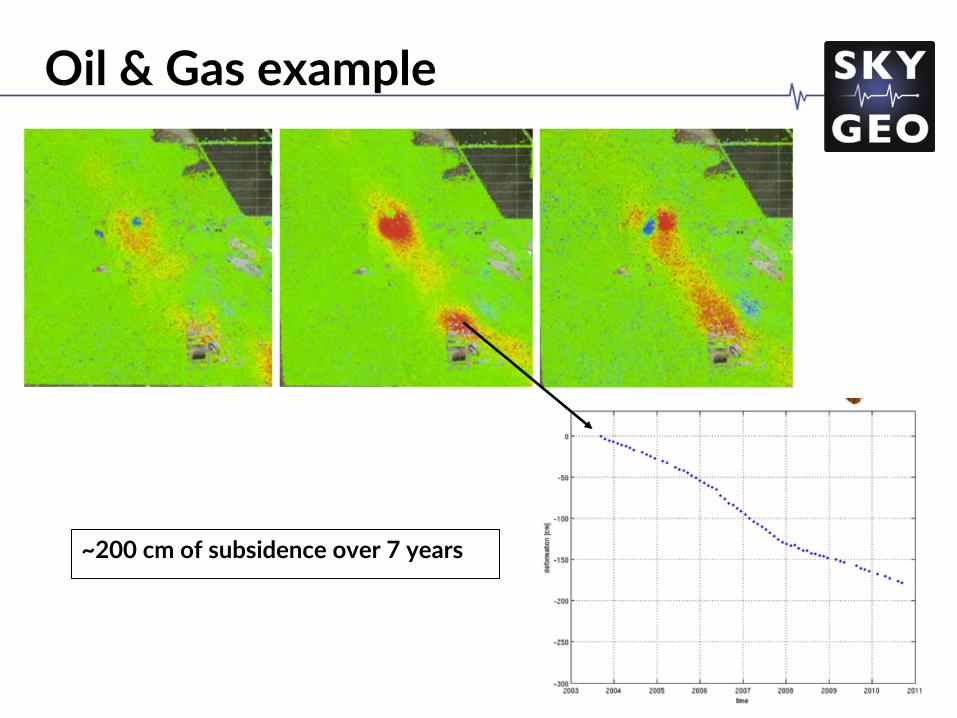
Oil & Gas example
~200 cm of subsidence over 7 years
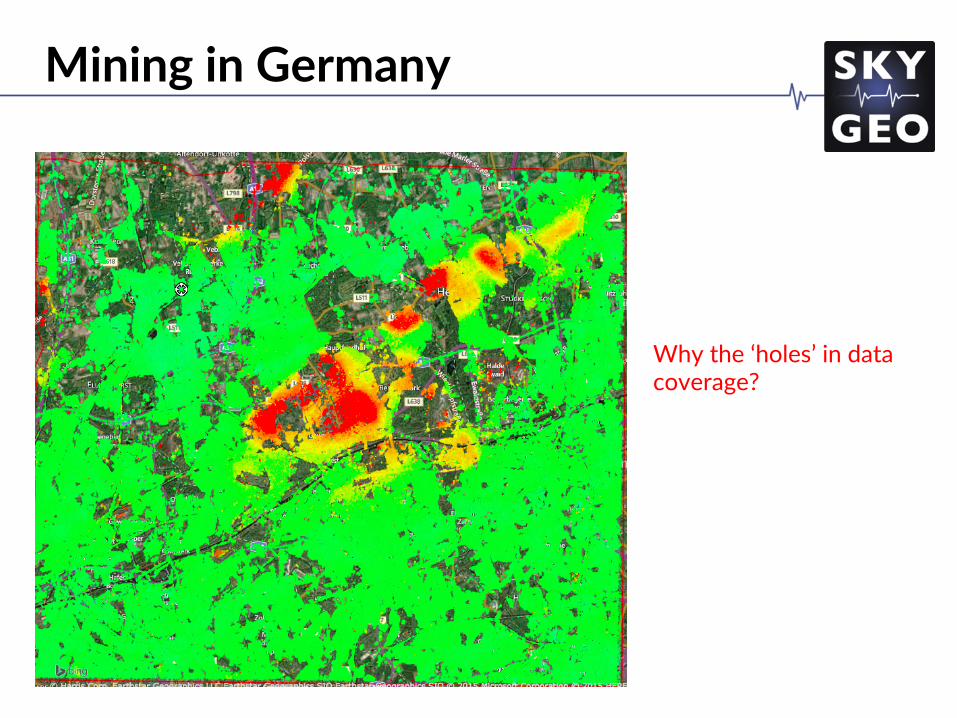
Mining in Germany
Why the ‘holes’ in data coverage?
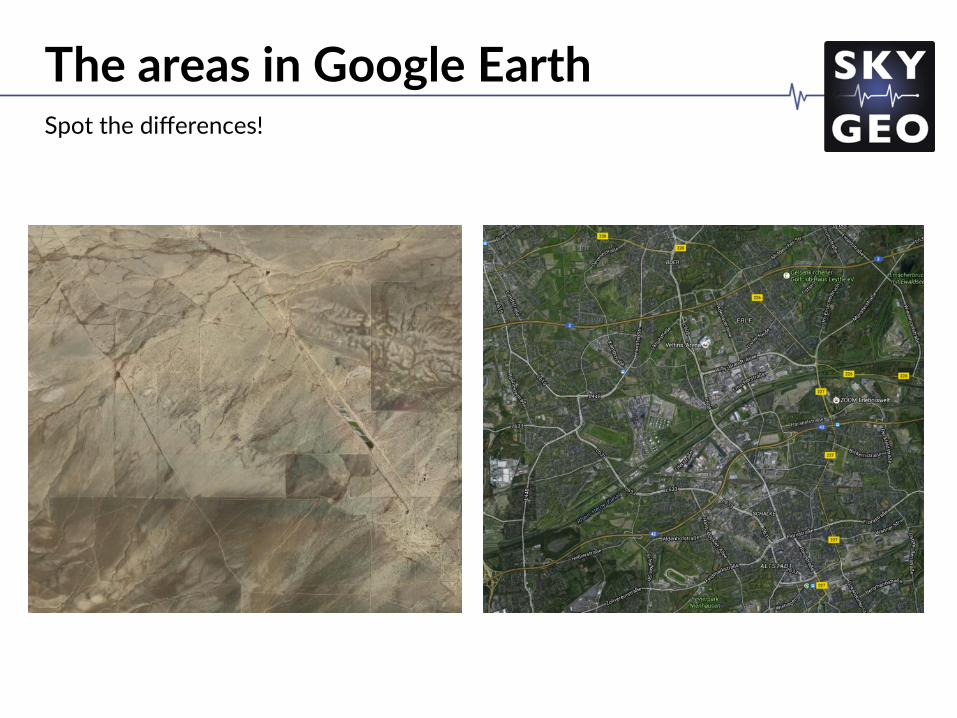
The areas in Google Earth Spot the differences!
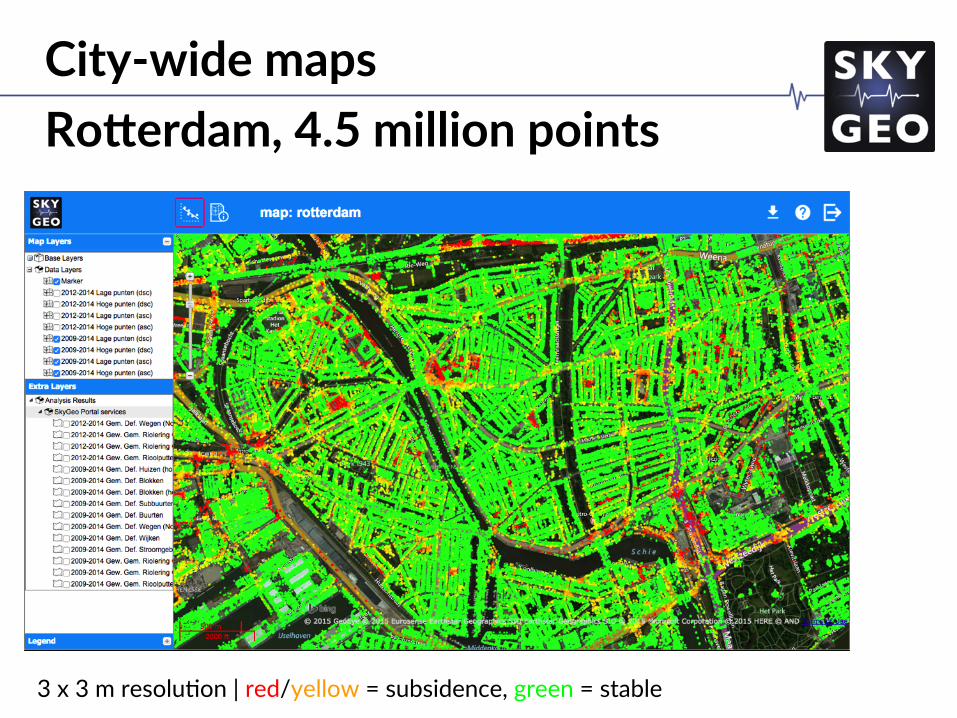
3 x 3 m resolu/on | red/yellow = subsidence, green = stable
City-wide maps RoWerdam, 4.5 million points
The image cannot be displayed. Your computer may not have enough memory to open the image, or the image may have been corrupted. Restart your computer, and then open the file again. If the red x still appears, you may have to delete the image and then insert it again.
The image cannot be displayed. Your computer may not have enough memory to open the image, or the image may have been corrupted. Restart your computer, and then open the file again. If the red x still appears, you may have to delete the image and then insert it again.
The image cannot be displayed. Your computer may not have enough memory to open the image, or the image may have been corrupted. Restart your computer, and then open the file again. If the red x still appears, you may have to delete the image and then insert it again.
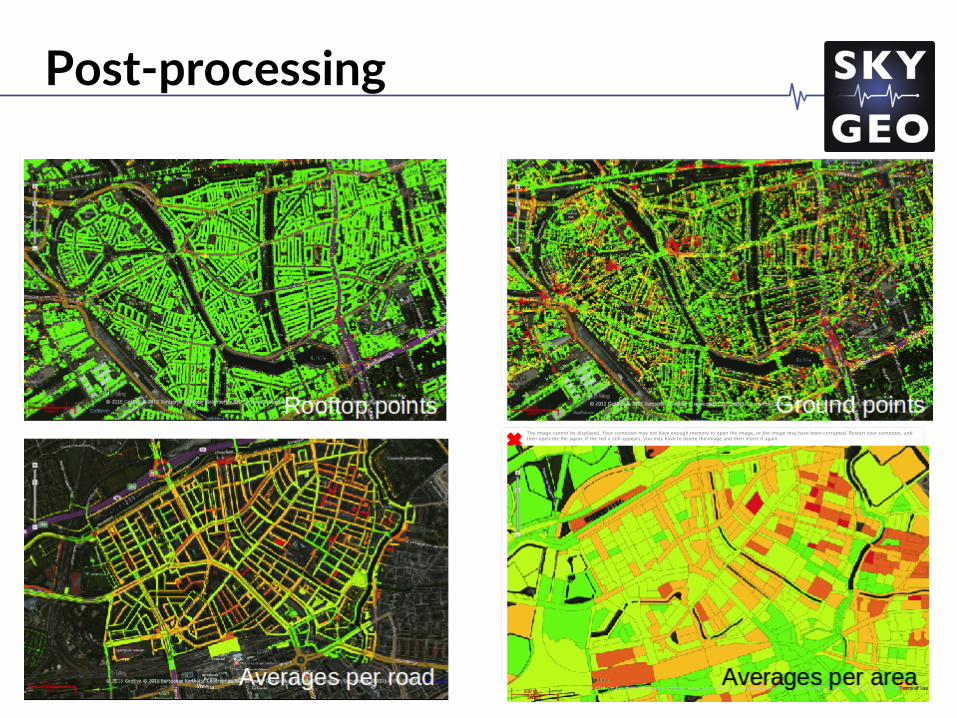
Post-processing
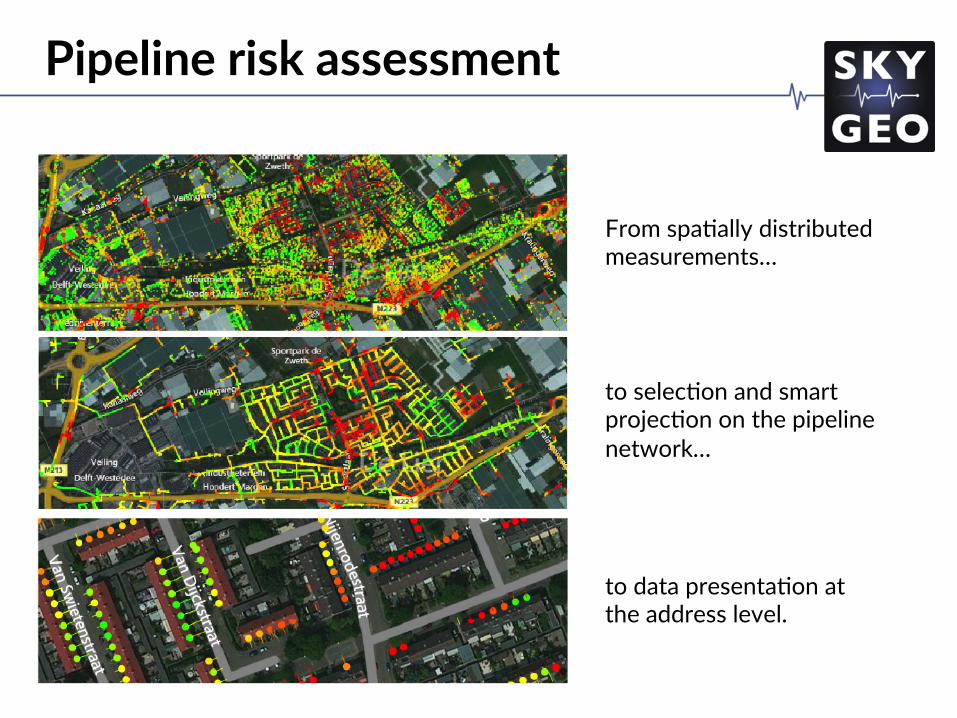
Pipeline risk assessment
to selec/on and smart projec/on on the pipeline network…
From spa/ally distributed measurements…
to data presenta/on at the address level.
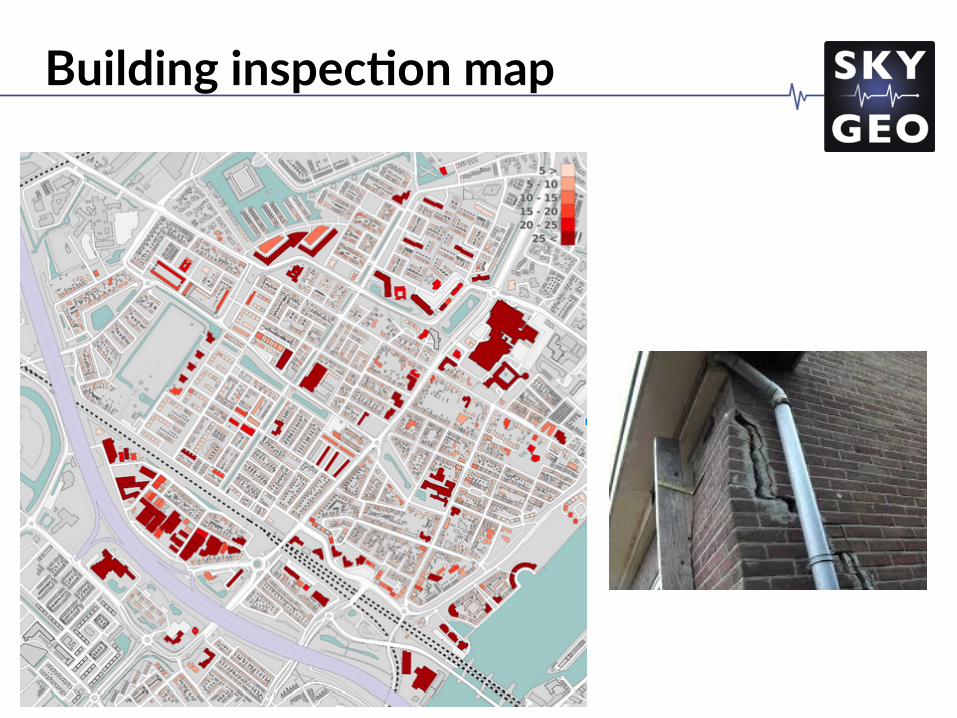
Building inspec=on map
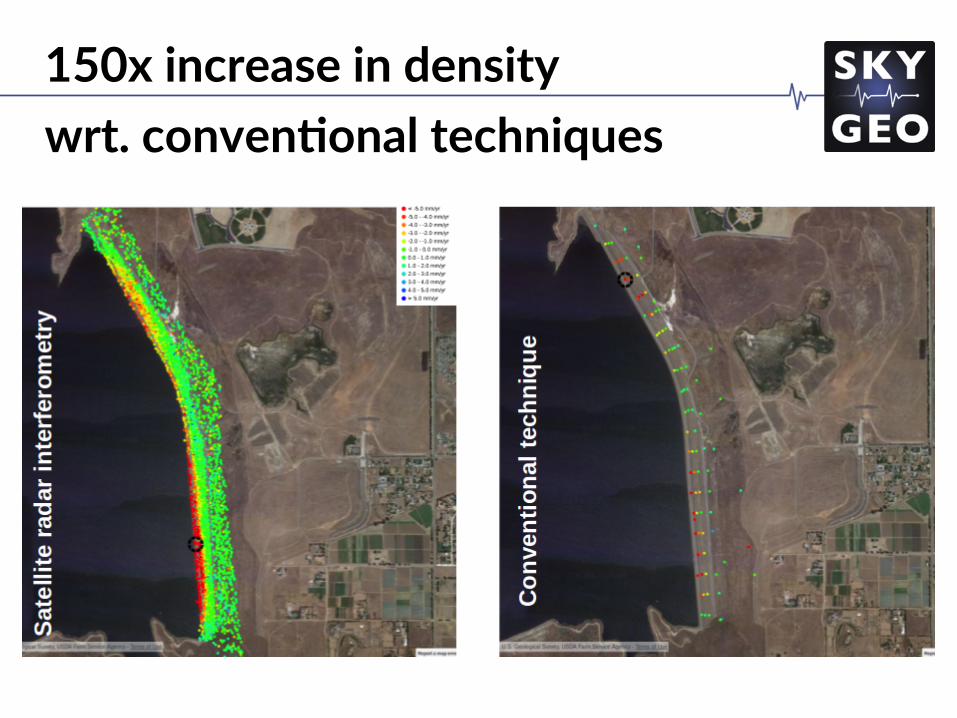
150x increase in density wrt. conven=onal techniques

Now it’s your turn.
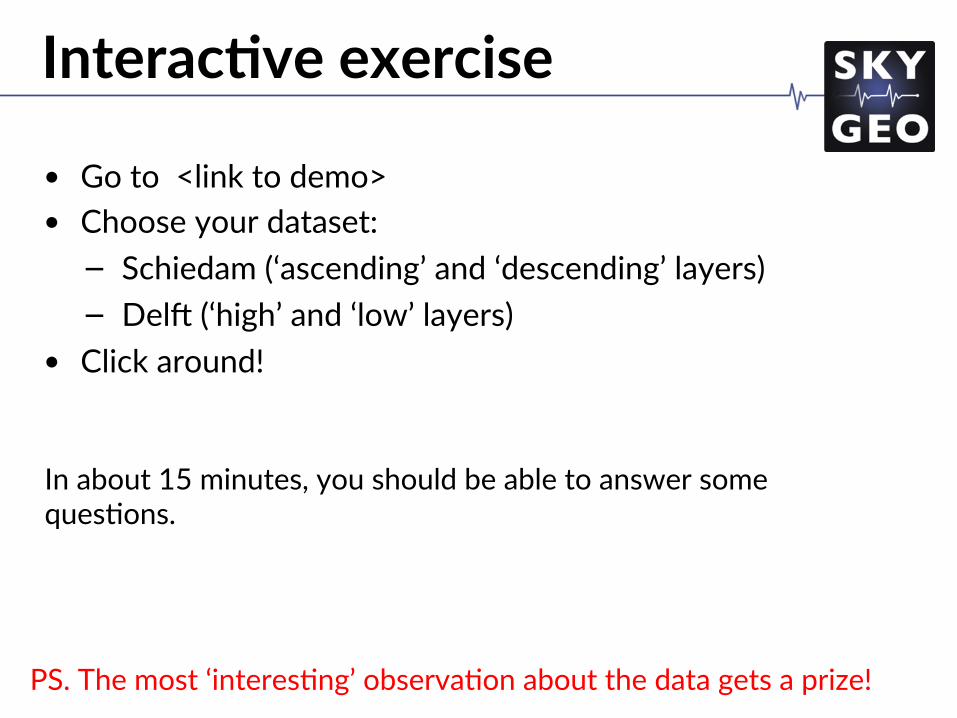
Interac=ve exercise • Go to <link to demo> • Choose your dataset:
– Schiedam (‘ascending’ and ‘descending’ layers) – Delo (‘high’ and ‘low’ layers)
• Click around!
In about 15 minutes, you should be able to answer some ques/ons.
PS. The most ‘interes/ng’ observa/on about the data gets a prize!
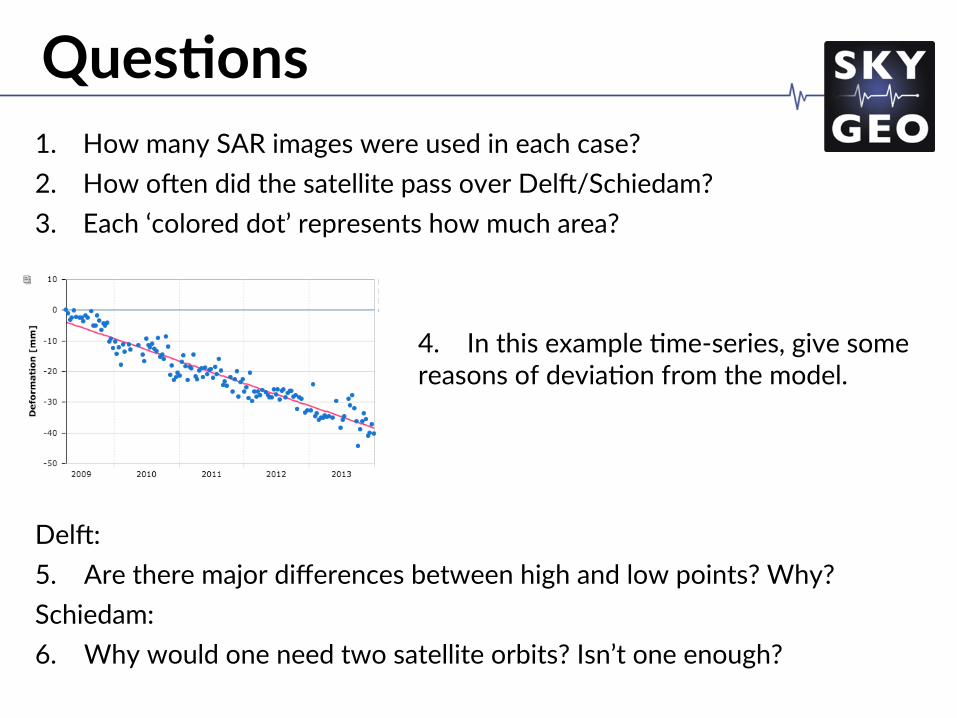
Ques=ons 1. How many SAR images were used in each case? 2. How ooen did the satellite pass over Delo/Schiedam? 3. Each ‘colored dot’ represents how much area?
4. In this example /me-series, give some reasons of devia/on from the model.
Delo: 5. Are there major differences between high and low points? Why? Schiedam: 6. Why would one need two satellite orbits? Isn’t one enough?
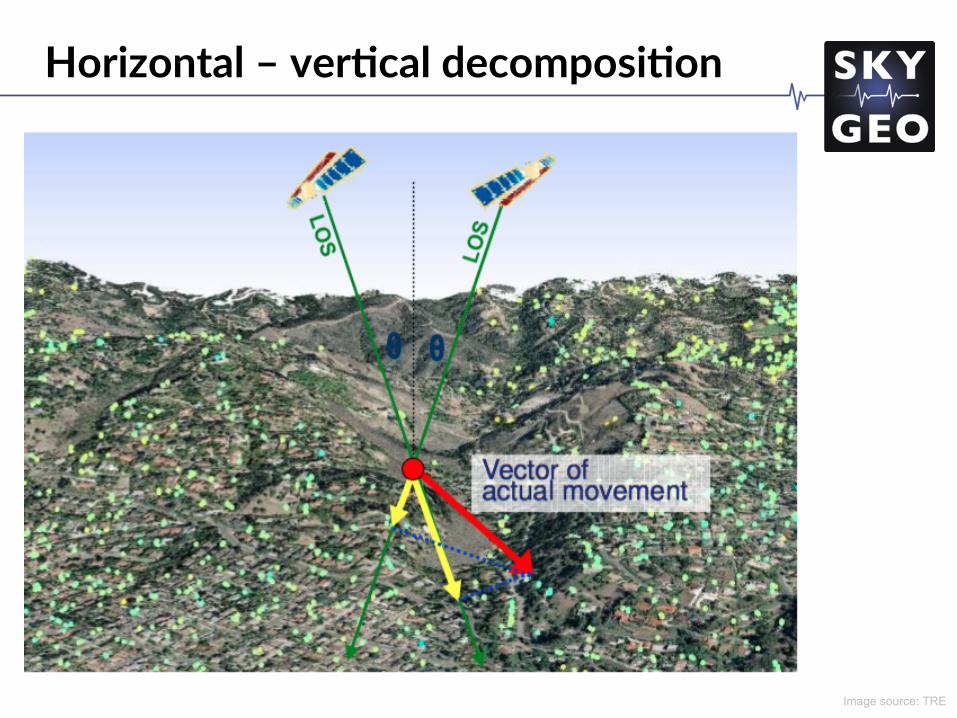
Horizontal – ver=cal decomposi=on
Image source: TRE