Embed Size (px)
Citation preview
T11 Metrics 5/5/16 11:15
Defect Metrics for Organization and Project Health
Presented by:
David Bialek
American Greetings
Brought to you by:
350 Corporate Way, Suite 400, Orange Park, FL 32073 888-‐-‐-‐268-‐-‐-‐8770 ·∙·∙ 904-‐-‐-‐278-‐-‐-‐0524 -‐ [email protected] -‐ http://www.stareast.techwell.com/

David Bialek American Greetings The manager of quality assurance engineering at American Greetings, David Bialek is responsible for directing the quality assurance effort for all software development. During his sixteen year IT career, he was a QA consultant for Compuware and senior QA/BA with the Regional Income Tax Agency. David is currently on the board of the Northern Ohio Software Quality Assurance Association and served on the board for the SID Network of Ohio. David lives in Ohio with his wife Kimberly and their two children.
Defect Metrics for Organization and Project Health
T11- Metrics
Thursday 11:15 AM

The Manager of Quality Assurance Engineering at American Greetings, David Bialek is responsible for directing the quality assurance effort for all software development. During his sixteen year IT career, he was a QA consultant for Compuware and senior QA/BA with the Regional Income Tax Agency. David is currently on the board of the Northern Ohio Software Quality Assurance Association and served on the board for the SID Network of Ohio. David lives in Ohio with his wife Kimberly and their two children.

Insert QA pic

Discussion • Need for Bug Metrics • Bug List • Root Cause Analysis • Resolution Analysis • Step by Step “How –To”
Why discuss bug metrics? • Track Progress • Show measure of work • Fragility • Strength • Disservice to business
Why discuss bug metrics? • Track Progress
Why discuss bug metrics? • Measure of work

Why discuss bug metrics? • Fragility
Why discuss bug metrics? • Strength
Why discuss bug metrics?
Disservice to business if you do nothing!

Pillar of our metrics
BUG LIST
• Why do we need these?
Bug List
These reports are one of the things that business people, users are interested in more so then our automation or test scripts
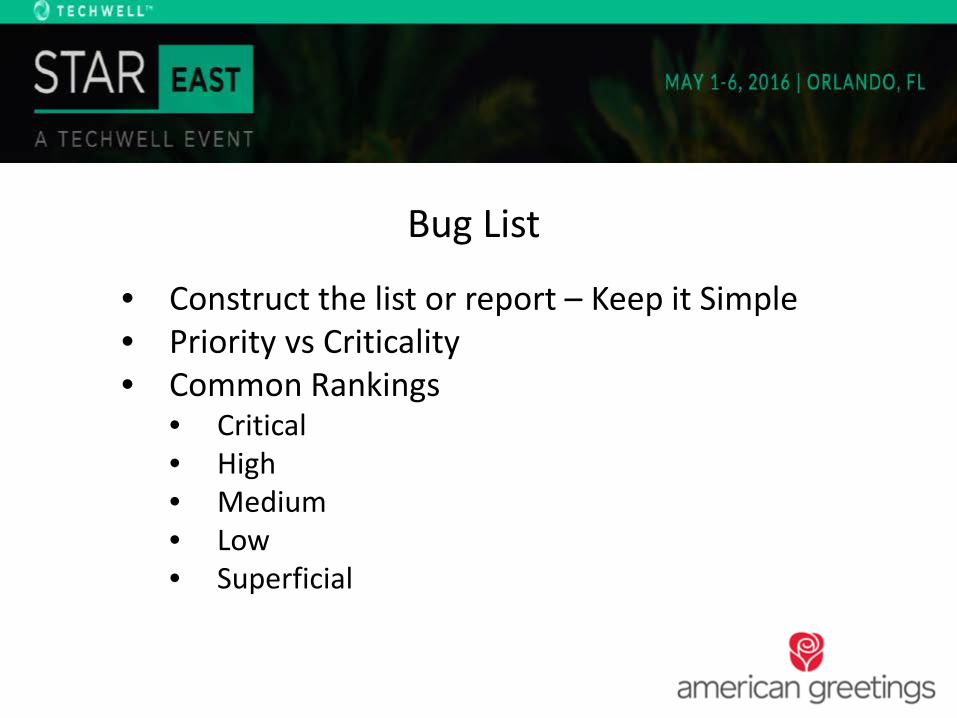
• Construct the list or report – Keep it Simple • Priority vs Criticality • Common Rankings
• Critical • High • Medium • Low • Superficial
Bug List
• Criticality is not indicative of priority • Think of these two items separately • Pre / Post Prod depending on your
methodology
Critical / High Priority
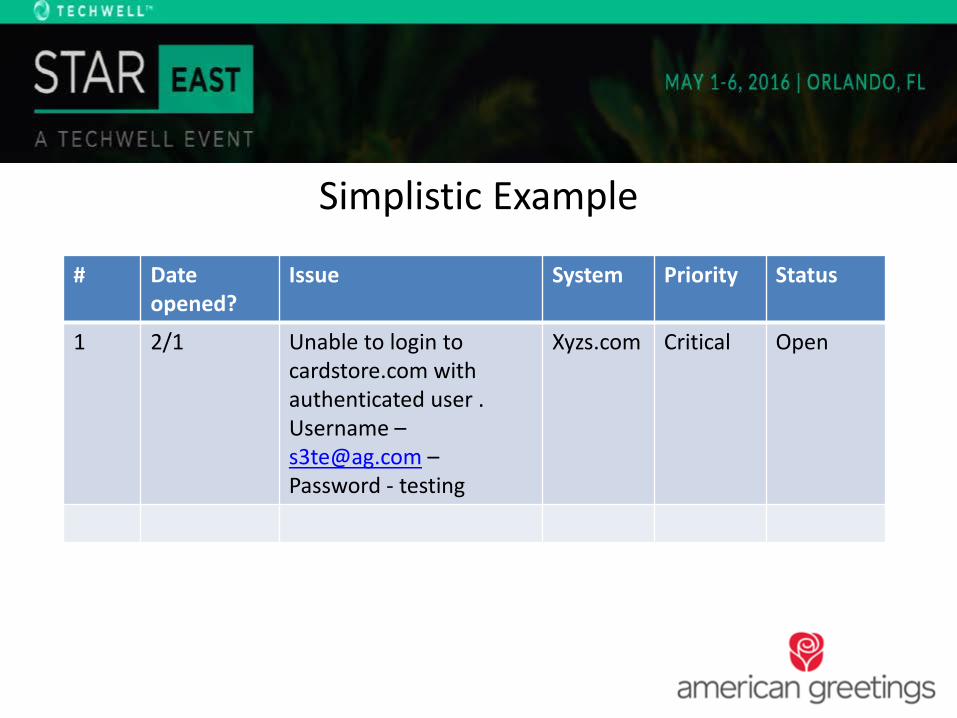
Simplistic Example
# Date opened?
Issue System Priority Status
1 2/1 Unable to login to cardstore.com with authenticated user . Username – [email protected] – Password - testing
Xyzs.com Critical Open

Pillar of our metrics
ROOT CAUSE
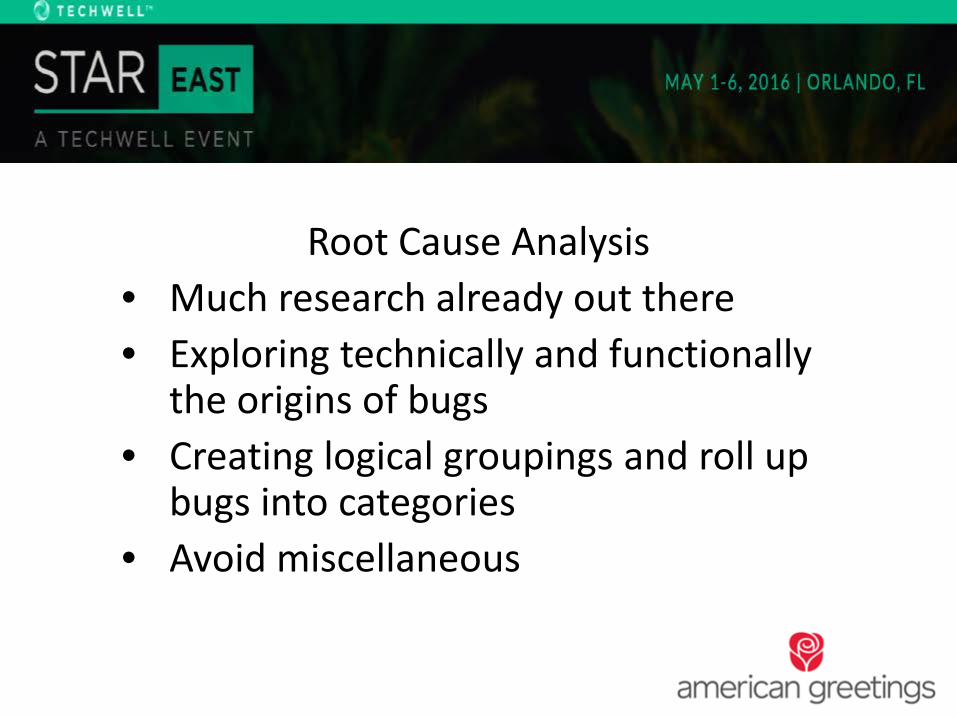
Root Cause Analysis • Much research already out there • Exploring technically and functionally
the origins of bugs • Creating logical groupings and roll up
bugs into categories • Avoid miscellaneous
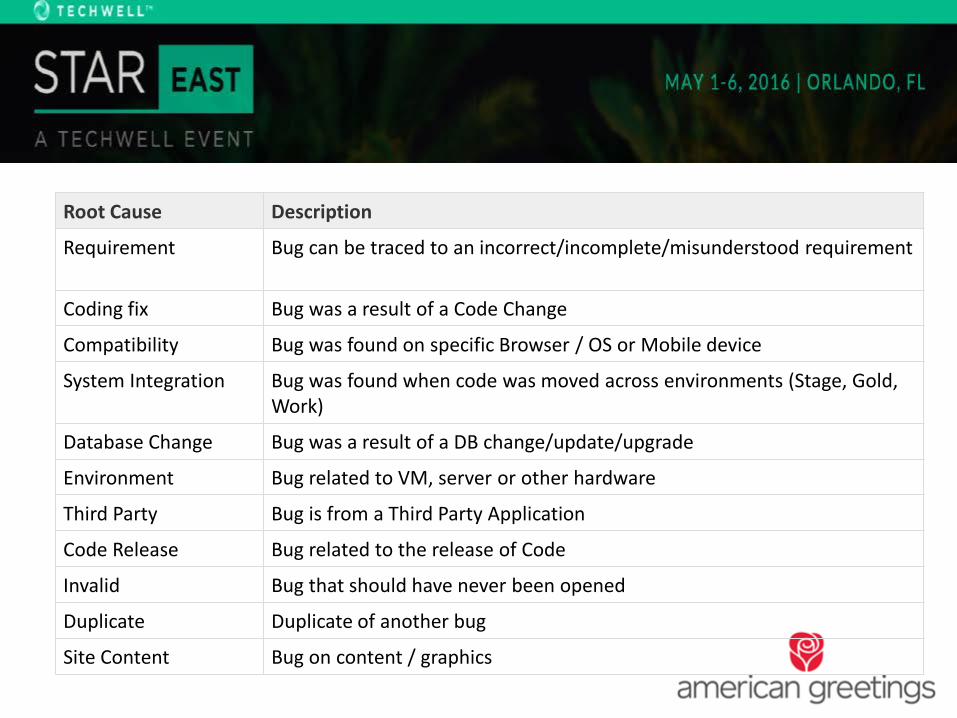
Root Cause Description
Requirement Bug can be traced to an incorrect/incomplete/misunderstood requirement
Coding fix Bug was a result of a Code Change
Compatibility Bug was found on specific Browser / OS or Mobile device
System Integration Bug was found when code was moved across environments (Stage, Gold, Work)
Database Change Bug was a result of a DB change/update/upgrade
Environment Bug related to VM, server or other hardware
Third Party Bug is from a Third Party Application
Code Release Bug related to the release of Code
Invalid Bug that should have never been opened
Duplicate Duplicate of another bug
Site Content Bug on content / graphics

Pillar of our metrics
RESOLUTION

Resolution Analysis
• Again, much research out there • Looking at how we resolve issues to
see bug scrub results and development fixes
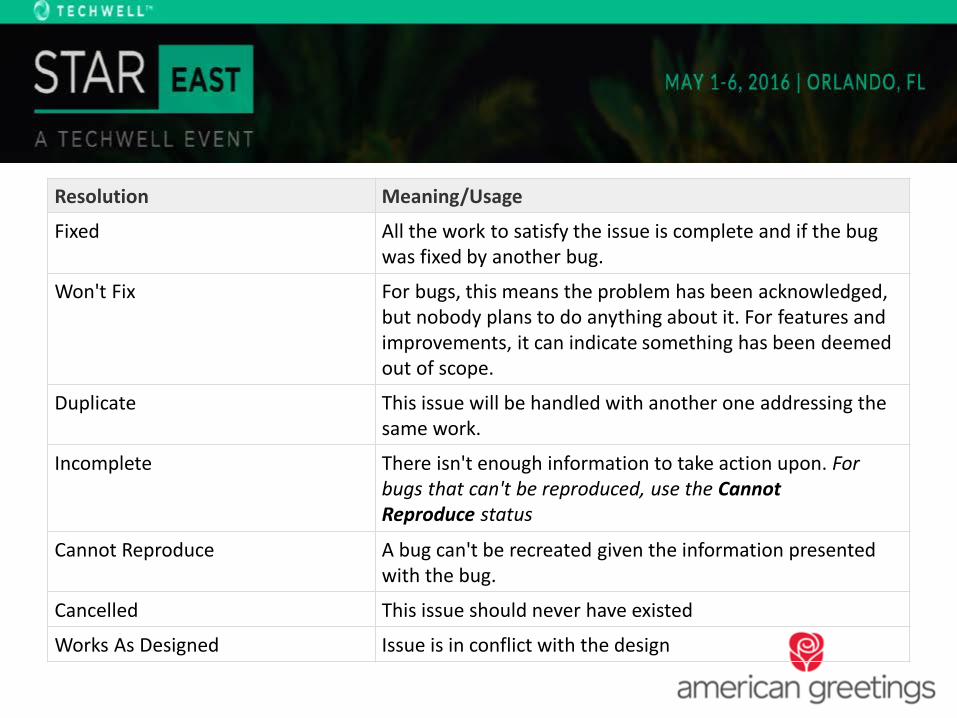
Resolution Meaning/Usage
Fixed All the work to satisfy the issue is complete and if the bug was fixed by another bug.
Won't Fix For bugs, this means the problem has been acknowledged, but nobody plans to do anything about it. For features and improvements, it can indicate something has been deemed out of scope.
Duplicate This issue will be handled with another one addressing the same work.
Incomplete There isn't enough information to take action upon. For bugs that can't be reproduced, use the Cannot Reproduce status
Cannot Reproduce A bug can't be recreated given the information presented with the bug.
Cancelled This issue should never have existed
Works As Designed Issue is in conflict with the design


Case Study
Needed to show value of QA to organization plus team velocity and
effectiveness
Quandary
Have a great tool for tracking bugs. But too many groups had
involvement in how issues were reported leading to disparate results
Data integrity did not seem to be a
requirement
No root cause or resolution analysis
existed

No bug reporting! Except for looking at
a super massive list of issues
that went back years……

Where to Start? • Step 1 – Create / Dissect Bug List
• Use Bugzilla, Jira or other product to sift • Quantifications:
• Total Bugs • Criticality • Cleaned and scrubbed • Removed dated ones
• This took a significant effort

Step 2 – Narrow Focus • Focus on
• Data Integrity • Open bugs to get them to Fixed • Closed for further analysis • Analysis began on the most critical/high
priority closed items
Step 3 – Group for Priority/Criticality
• Priority based grouping • Criticality as a secondary attribute
Step 4 – Think and Report • Think !! • You know the business you are in and use
those intrinsic heuristics to get to what is valuable and actionable
• Buy-in is everything • Construct reports – here are some examples
of ones that had the most impact and were easy to follow
2%
50%
37%
11%
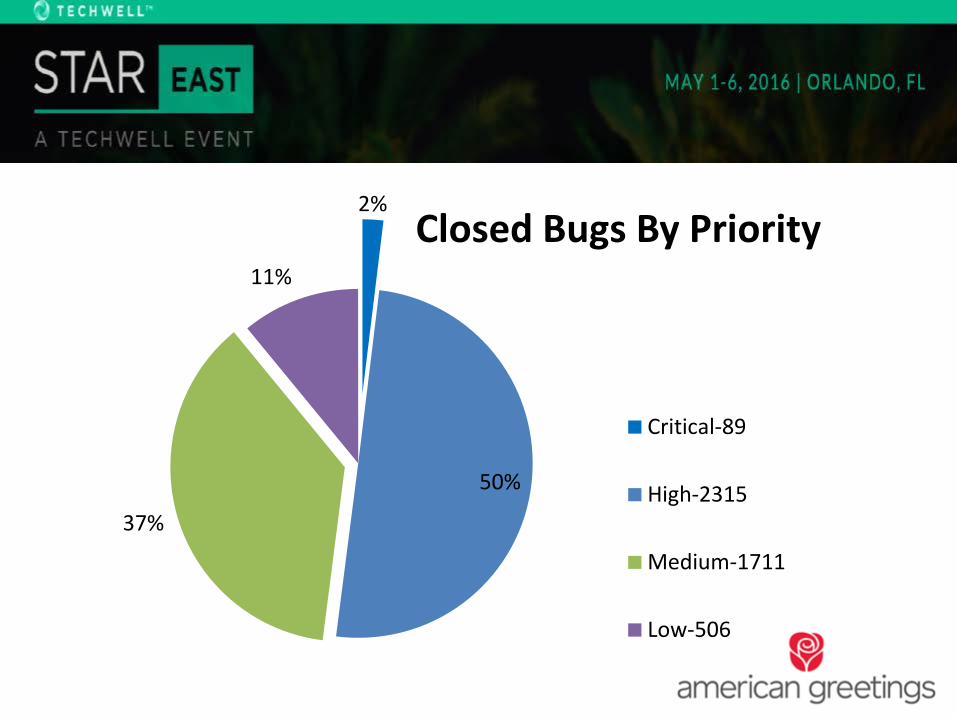
Closed Bugs By Priority
Critical-89
High-2315
Medium-1711
Low-506
4% 4% 4%
7%
11%
13%
57%
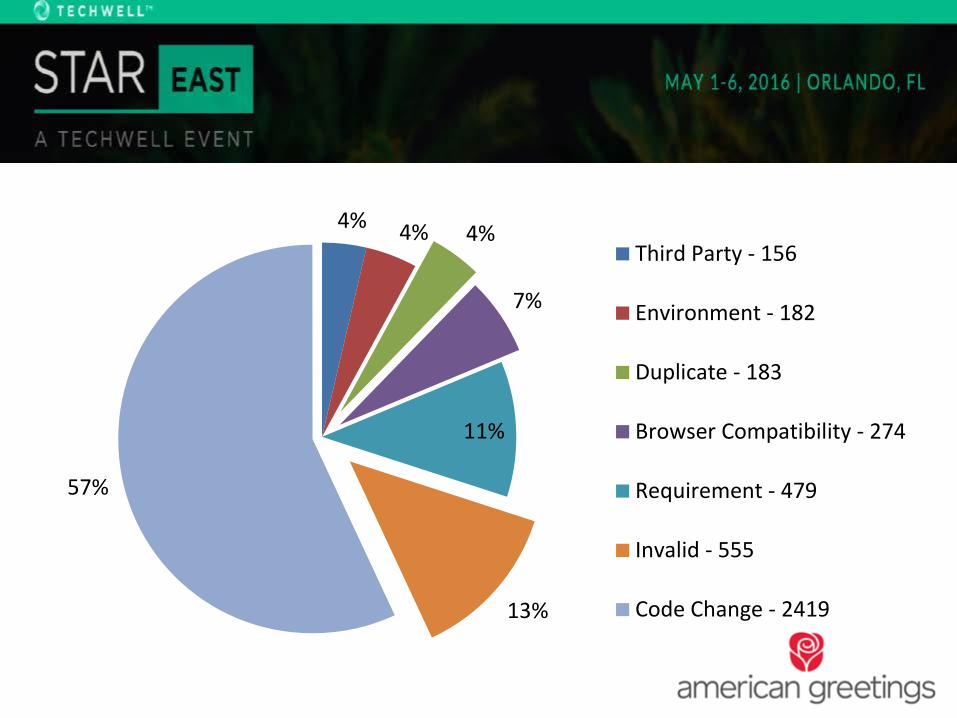
Third Party - 156
Environment - 182
Duplicate - 183
Browser Compatibility - 274
Requirement - 479
Invalid - 555
Code Change - 2419
Root Cause

4%
6% 5%
9%
62%
7%
7% Resolutions
Cannot Reproduce - 166Cancelled - 253Duplicate - 242Closed - 404Fixed - 2743Wont Fix - 301Works As Designed - 308

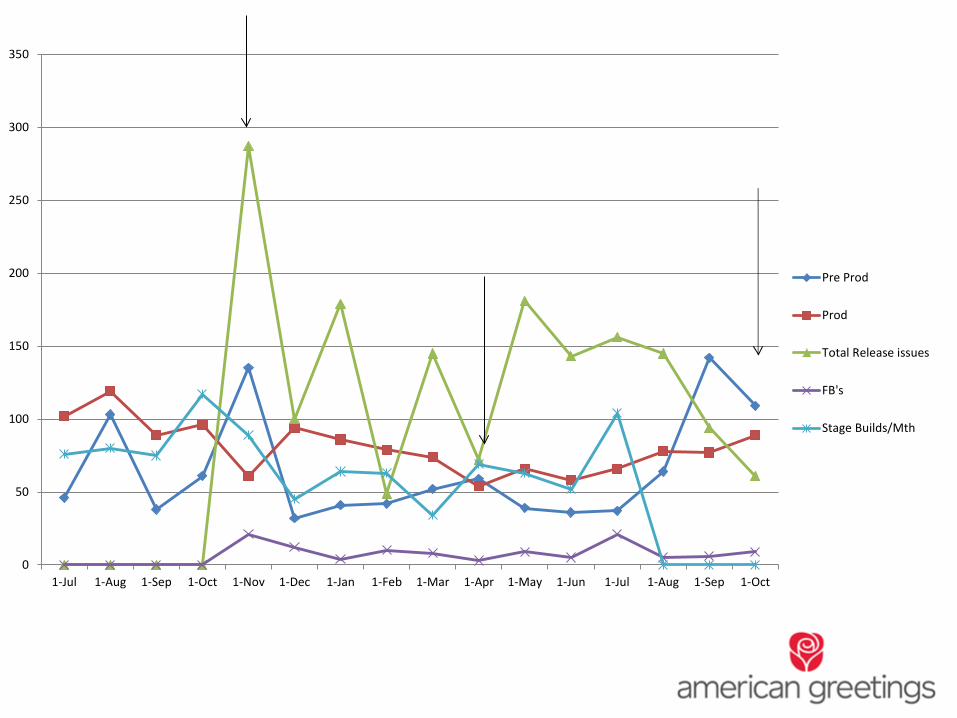
Step 5 – Expand to Release/Build
• With all the data organized analyze build / release information to find commonalities and start to see velocity

0
50
100
150
200
250
300
350
1-Jul 1-Aug 1-Sep 1-Oct 1-Nov 1-Dec 1-Jan 1-Feb 1-Mar 1-Apr 1-May 1-Jun 1-Jul 1-Aug 1-Sep 1-Oct
Pre Prod
Prod
Total Release issues
FB's
Stage Builds/Mth
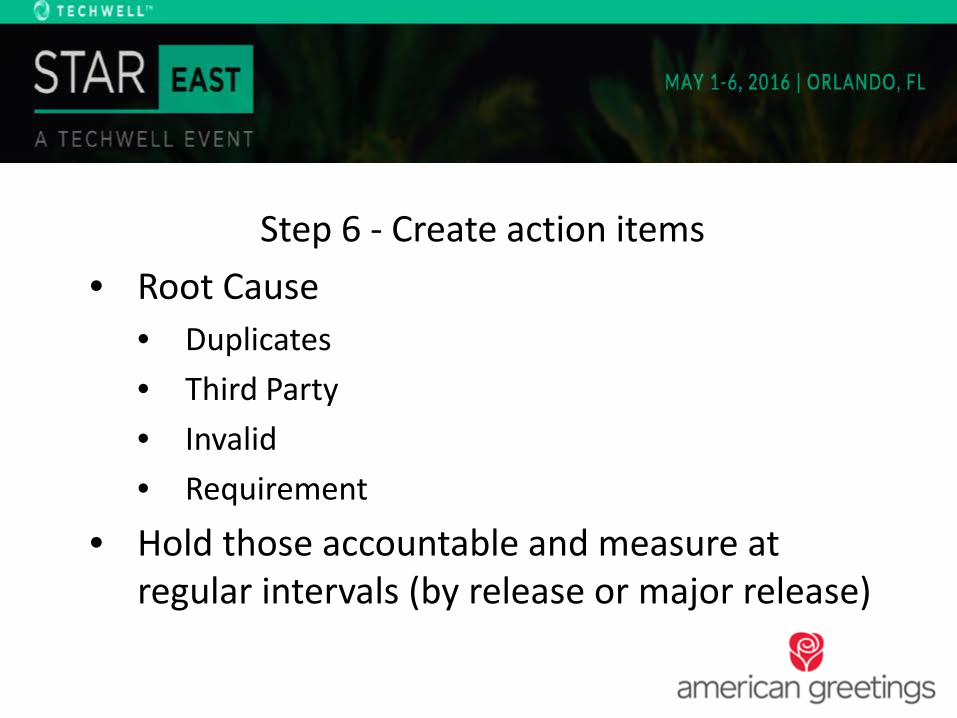
Step 6 - Create action items • Root Cause
• Duplicates • Third Party • Invalid • Requirement
• Hold those accountable and measure at regular intervals (by release or major release)
Step 7 – Establish Meters for measuring project and organizational wellness
• By Project • For Organizational health
Step 8 – Plan with predictive awareness
• This term is a marketing one, but applies in this situation
• We cannot assume that one release or one project is the exact same as another
• Plan with caution!
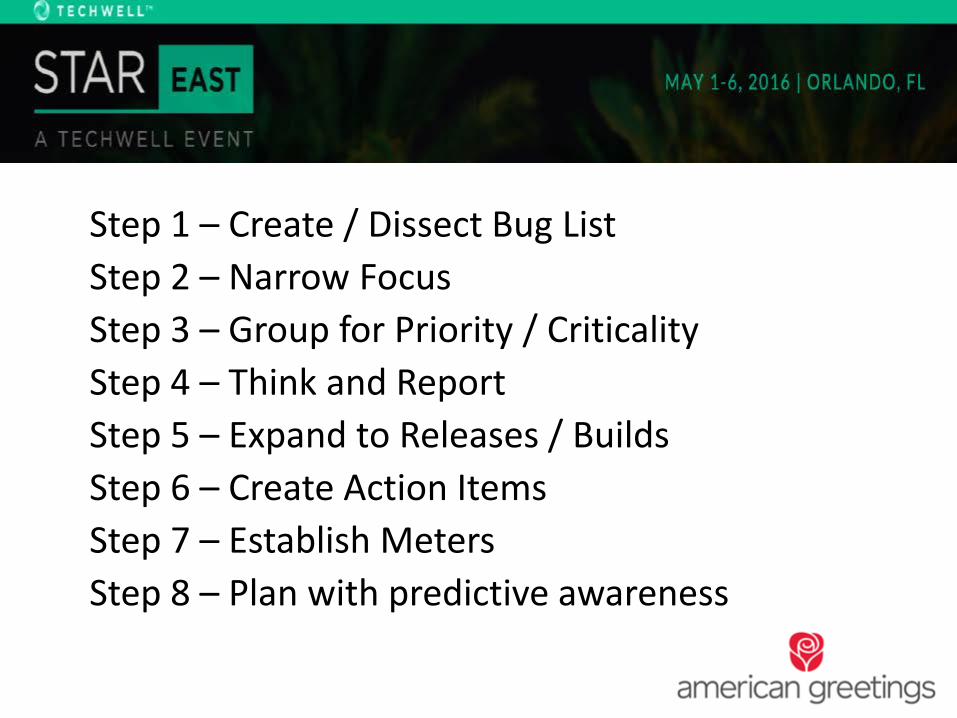
Step 1 – Create / Dissect Bug List Step 2 – Narrow Focus Step 3 – Group for Priority / Criticality Step 4 – Think and Report Step 5 – Expand to Releases / Builds Step 6 – Create Action Items Step 7 – Establish Meters Step 8 – Plan with predictive awareness


![Hryszko16 Defect Prediction with Bad Smells in Code · code smells metrics effectiveness in defect prediction process for Java pro-gramming language [7]. No code smells metrics for](https://img.pdfslide.us/doc/110x75/5f973522c7a749289f3ae87d/hryszko16-defect-prediction-with-bad-smells-in-code-code-smells-metrics-effectiveness.jpg)