Embed Size (px)
Citation preview
Security Visualization
… using Interactive
Data Visualization
and Predictive Modeling
to find the needle in the
haystack.
Copyright 2016
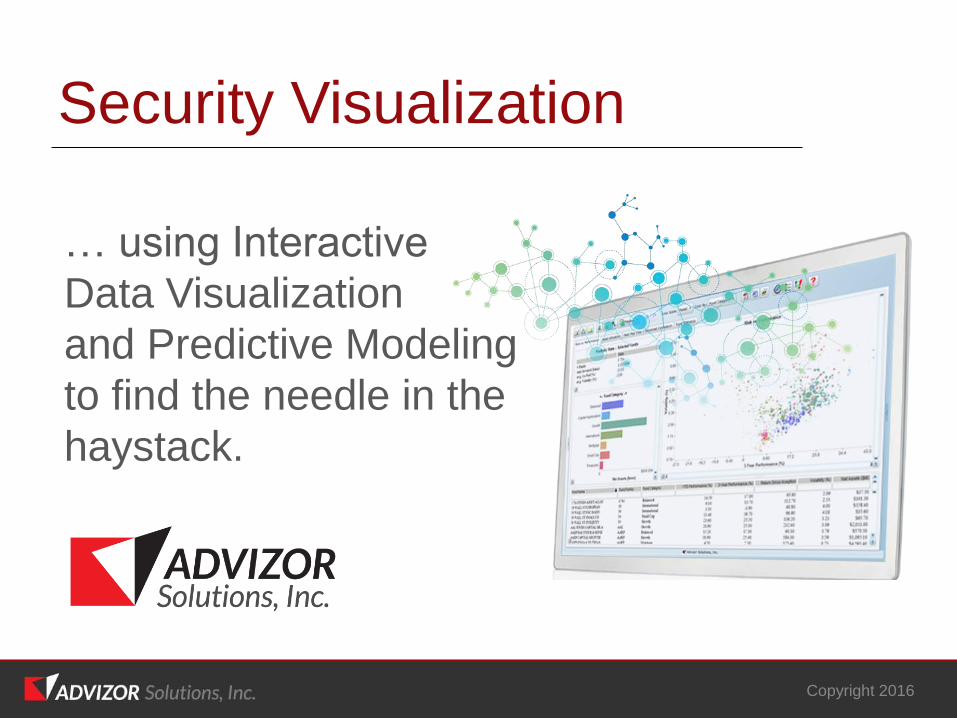
YOUR HOST
Doug Cogswell
o President & CEO, ADVIZOR Solutions
o 15 Years in the Business Intelligence Sector
o Extensive data analytics experience
o Over 10 years in Cyber Security
o Clients include:
Fortune 100 companies
Large government organizations
U.S. Military
Top SIEM vendors
WHO WE ARE
Copyright 2016
ADVZOR is a spinoff from Bell Labs. We offer a low cost and
extremely easy to use visual front-end to complex data systems. We blend, prep, and synthesize data from all kinds of
commercial and operational systems into an integrated in-memory data mart. That mart powers our easy-to-understand
interactive dashboards and ad hoc reports, which are designed for self-service business decision making. We are the only vendor
anywhere who has integrated no-coding predictive analytics into an end-user data discovery tool targeted at
people who don’t have degrees in statistics.
SMALLER FIRMS …
… TOP TIER BEST OF BREED
Copyright 2016
Security Visualization
WHAT’S THE PROBLEM?
Copyright 2016
• Threat teams and vulnerability teams often don’t talk to each other
• Multiple separate collection systems
• Systems create 100’s of pages of reports each day
• Analysts pull the data out and try to cross ruff, often in Excel
• Lack of context. Have to prioritize, but can only investigate some things, which are usually the “high priority threats”. When in reality there can be clusters of lower priority events that together make a difference.
• End up putting out fires, vs. taking a strategic approach
• Get distracted by all the noise and don’t find the needle in the haystack
GARTNER
“Analyzing large amounts of data to find interesting security events, such as undetected breaches or
rogue users, is a desired output for buyers. And visualization of that data will greatly affect
adoption of the technology. This presents an opportunity for security providers to
partner with proven large data visualization technologies to better increase the adoption of their
security analytics platforms.”
Copyright 2016
CASE STUDY –
FORTUNE 100 COMPANY
Copyright 2016
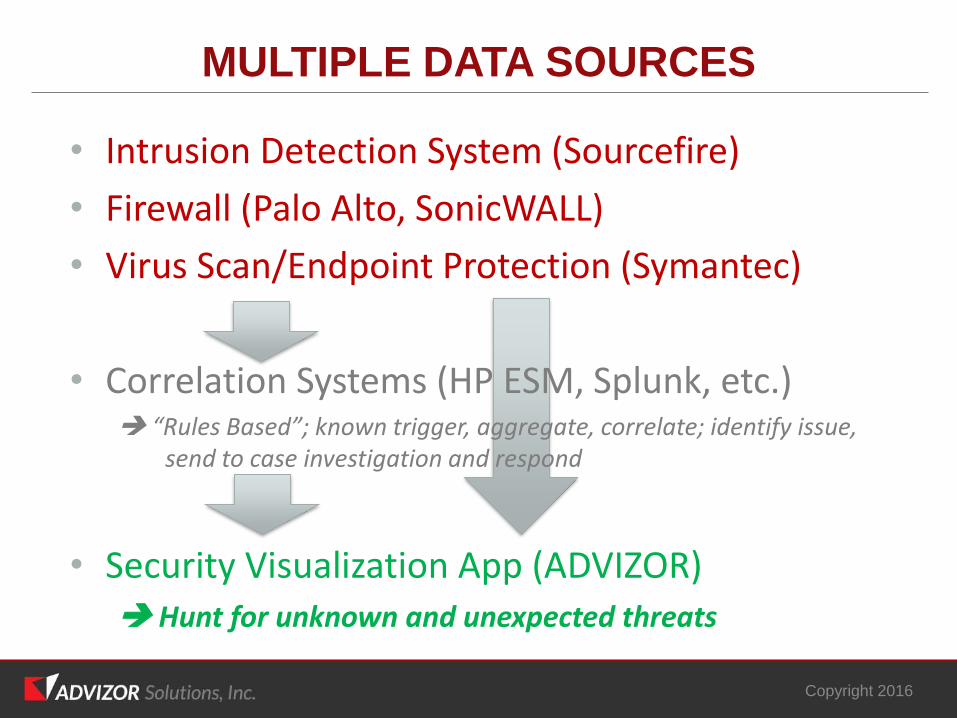
• Intrusion Detection System (Sourcefire)
• Firewall (Palo Alto, SonicWALL)
• Virus Scan/Endpoint Protection (Symantec)
• Correlation Systems (HP ESM, Splunk, etc.) “Rules Based”; known trigger, aggregate, correlate; identify issue,
send to case investigation and respond
MULTIPLE DATA SOURCES
Copyright 2016
• Security Visualization App (ADVIZOR) Hunt for unknown and unexpected threats
SECURITY VISUALIZATION
• Most people think of “presentation of output”
• We mean: “present raw data visually for human pattern recognition and analysis”
• Why?• 100’s of thousands of correlations / day
• Can’t process them all
• Need further and additional insights into log data
• Detect activity beyond traditional intrusion and event management
• Human visual perception automatically recognizes unusual patterns
• “We don’t know what we’re looking for”
• “Writing a rule to detect a ‘diagonal attack’ would be really hard and expensive”
• Need to get down to the underlying log data and attach to the case
• Must be proactive and real time analysis
Copyright 2016
SECURITY VISUALIZATION VALUE ADD
• Provide proactive and real time analysis
• Find anomalies that traditional systems don’t
• Find new attacks that were designed to avoid traditional signature based detection tools:• Time staged attacks
• Diagonal attacks
• Cluster attacks
• Octal jump attacks
• Embedded activity attacks
• Etc.
• Easily communicate & submit case detail for further investigation
Copyright 2016
Demo
Copyright 2016
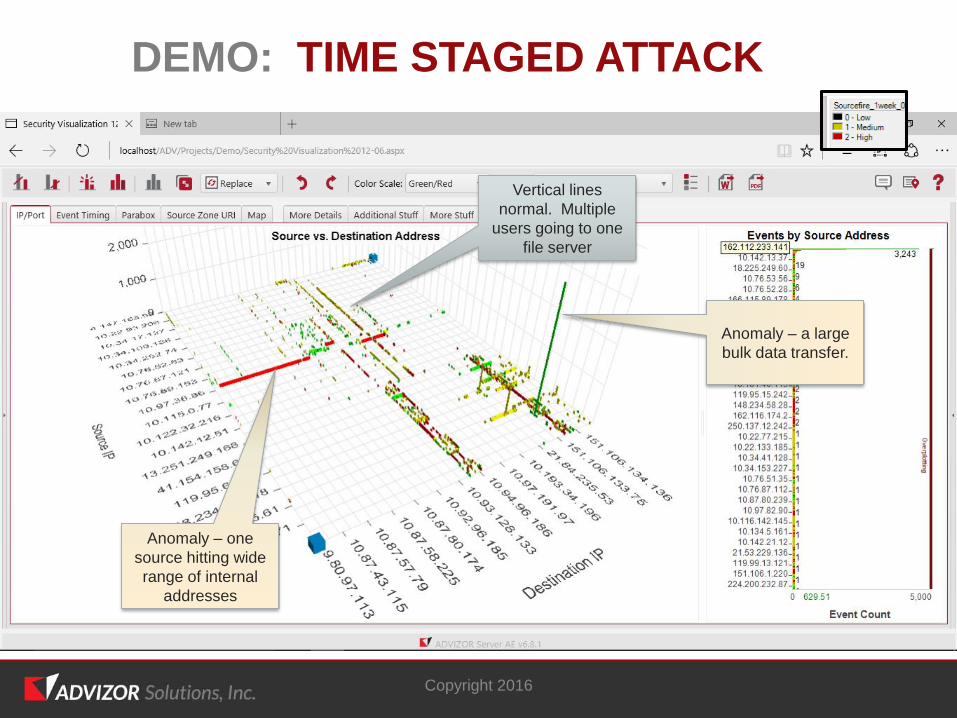
DEMO: TIME STAGED ATTACK
Vertical lines
normal. Multiple
users going to one
file server
Anomaly – a large
bulk data transfer.
Anomaly – one
source hitting wide
range of internal
addresses
Copyright 2016
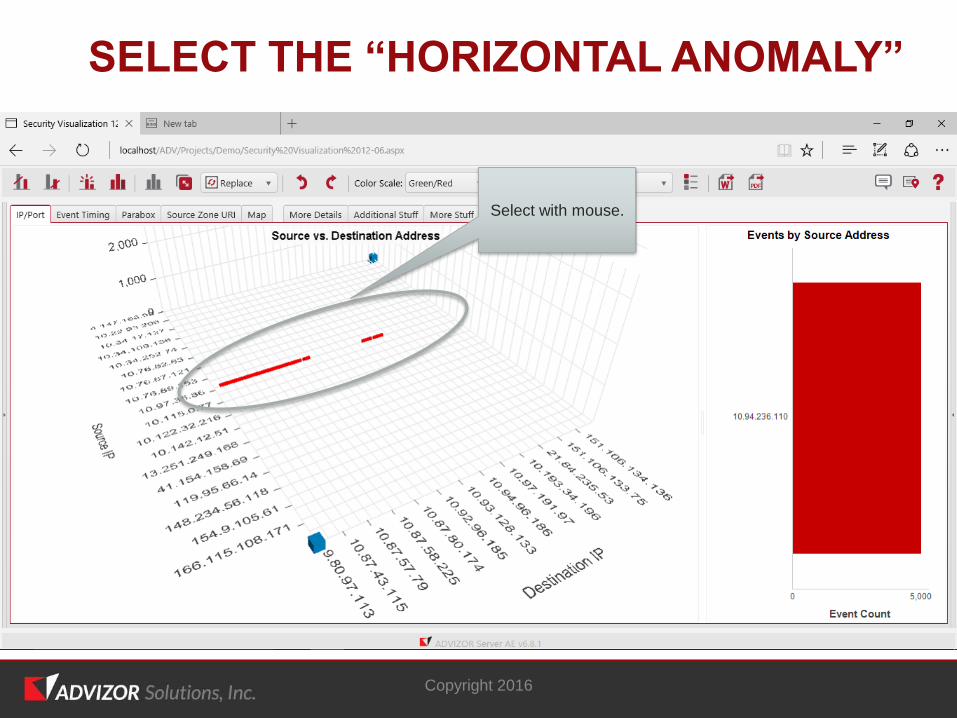
Select with mouse.
SELECT THE “HORIZONTAL ANOMALY”
Copyright 2016
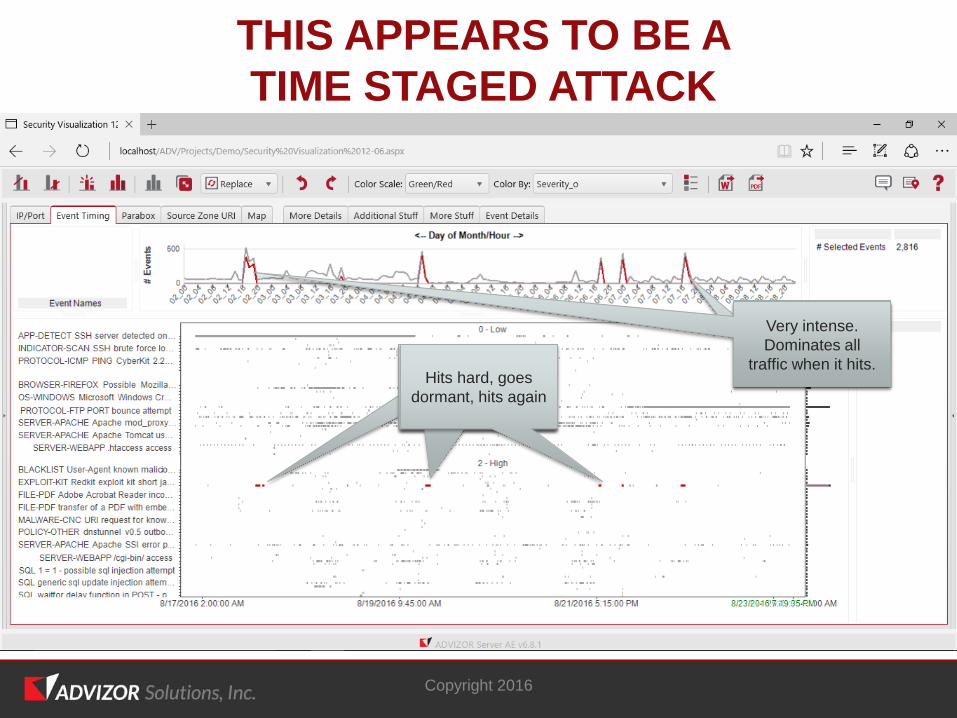
THIS APPEARS TO BE A
TIME STAGED ATTACK
Hits hard, goes
dormant, hits again
Hits hard, goes
dormant, hits again
Hits hard, goes
dormant, hits again
Hits hard, goes
dormant, hits again
Very intense.
Dominates all
traffic when it hits.
Copyright 2016
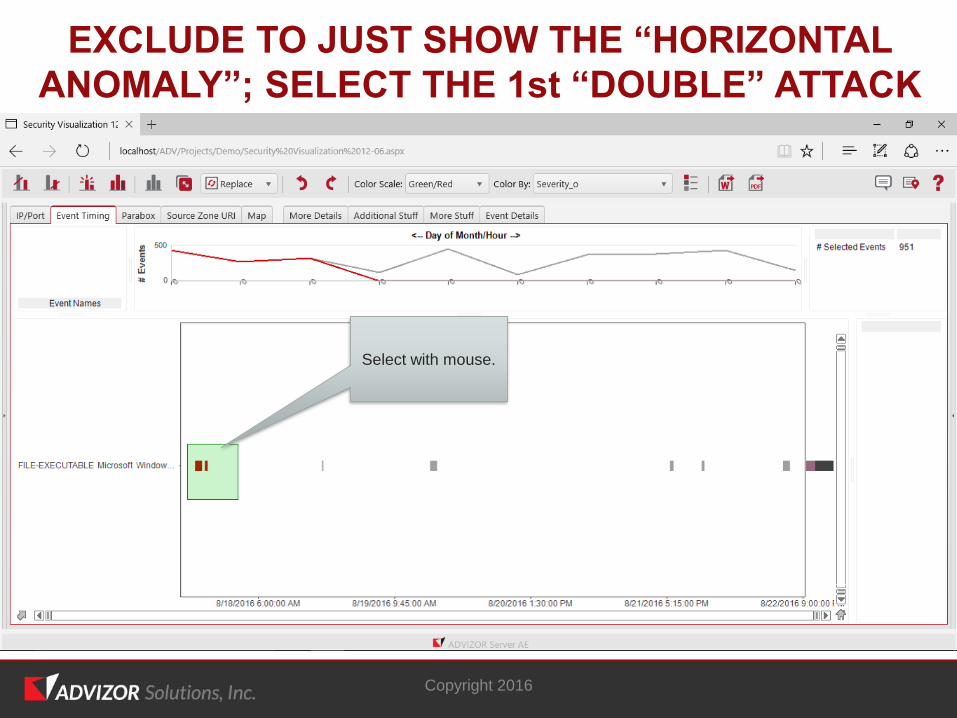
EXCLUDE TO JUST SHOW THE “HORIZONTAL
ANOMALY”; SELECT THE 1st “DOUBLE” ATTACK
Select with mouse.
Copyright 2016
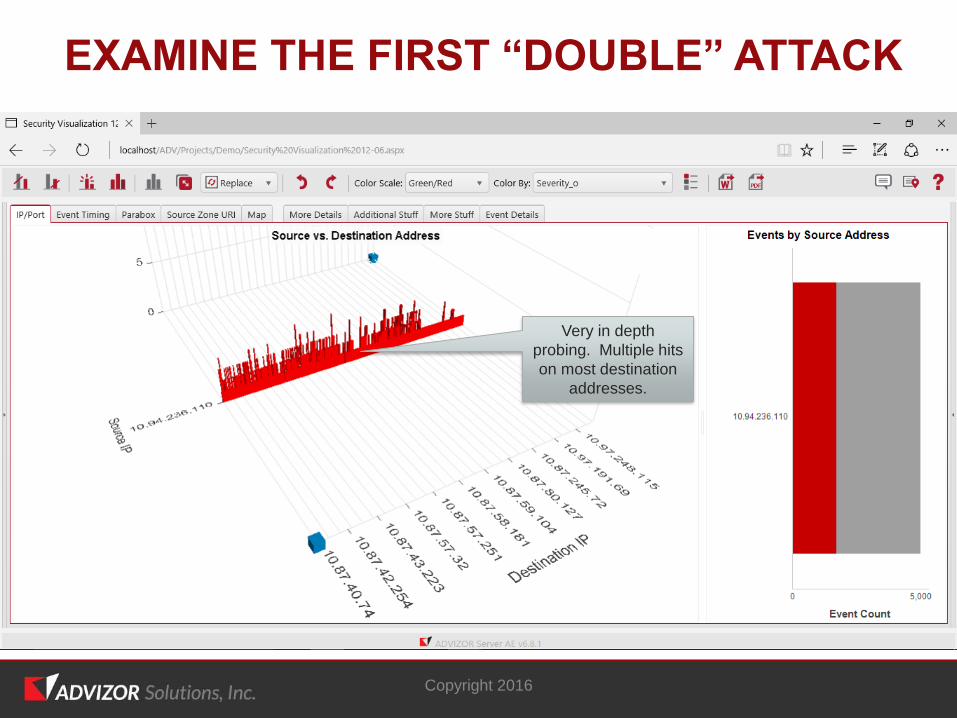
Very in depth
probing. Multiple hits
on most destination
addresses.
EXAMINE THE FIRST “DOUBLE” ATTACK
Copyright 2016
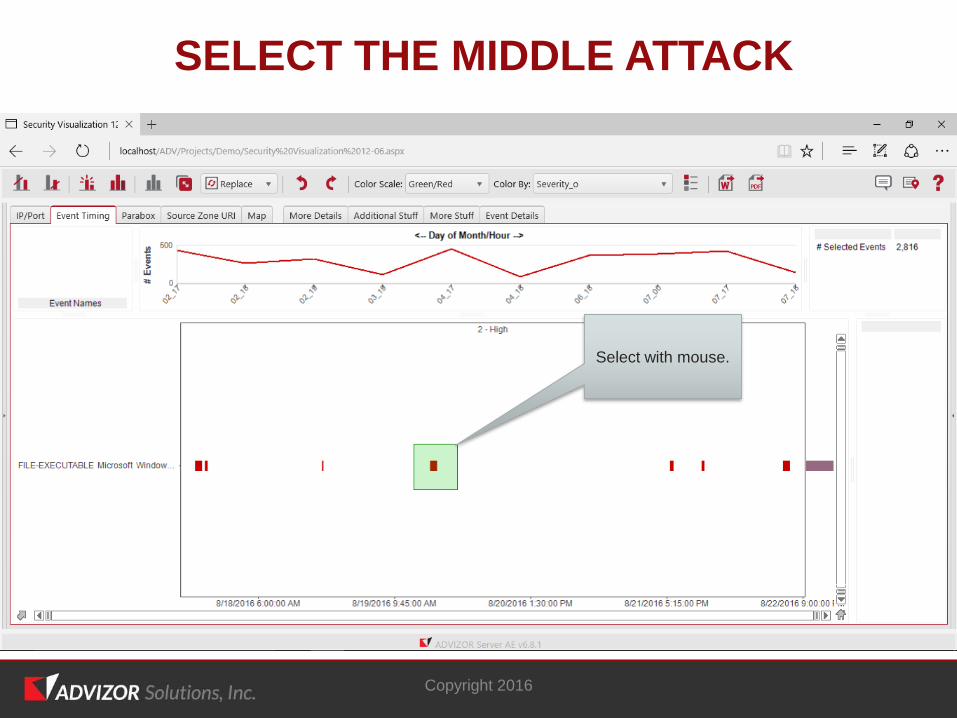
SELECT THE MIDDLE ATTACK
Select with mouse.
Copyright 2016
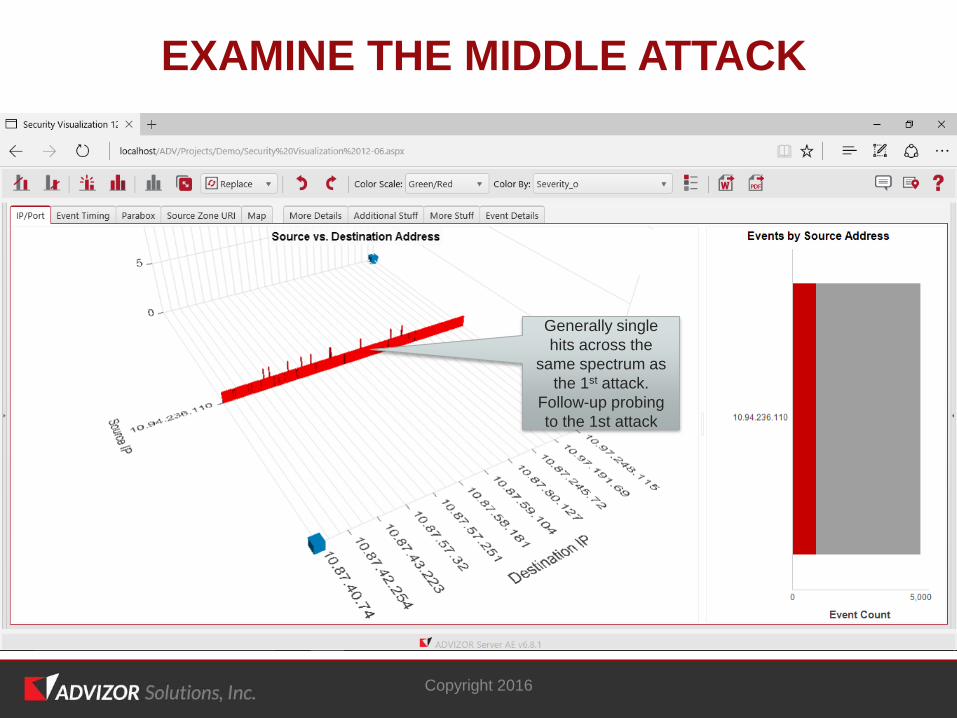
Generally single
hits across the
same spectrum as
the 1st attack.
Follow-up probing
to the 1st attack
EXAMINE THE MIDDLE ATTACK
THOUGHTS
• Strong evidence of something nefarious
• Close the loop with other context sensitive data. For example:o Research what the source IP address actually is
o Are there factors that might drive this timing?
o What other contextual information might there be?
• Lets look at a few other things …
Copyright 2016
Copyright 2016
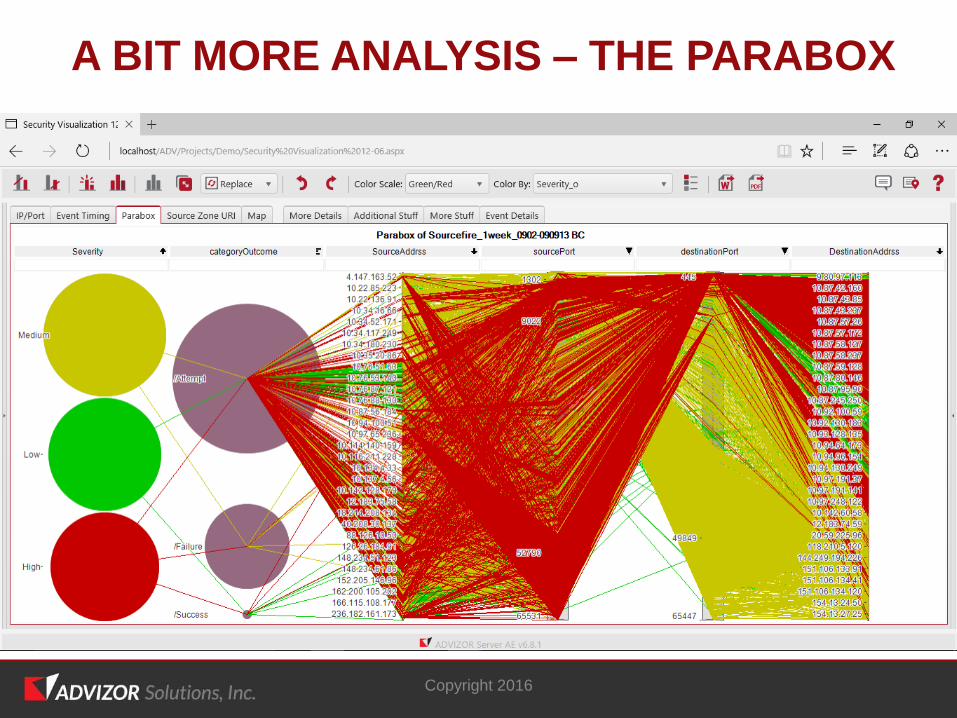
A BIT MORE ANALYSIS – THE PARABOX
Copyright 2016
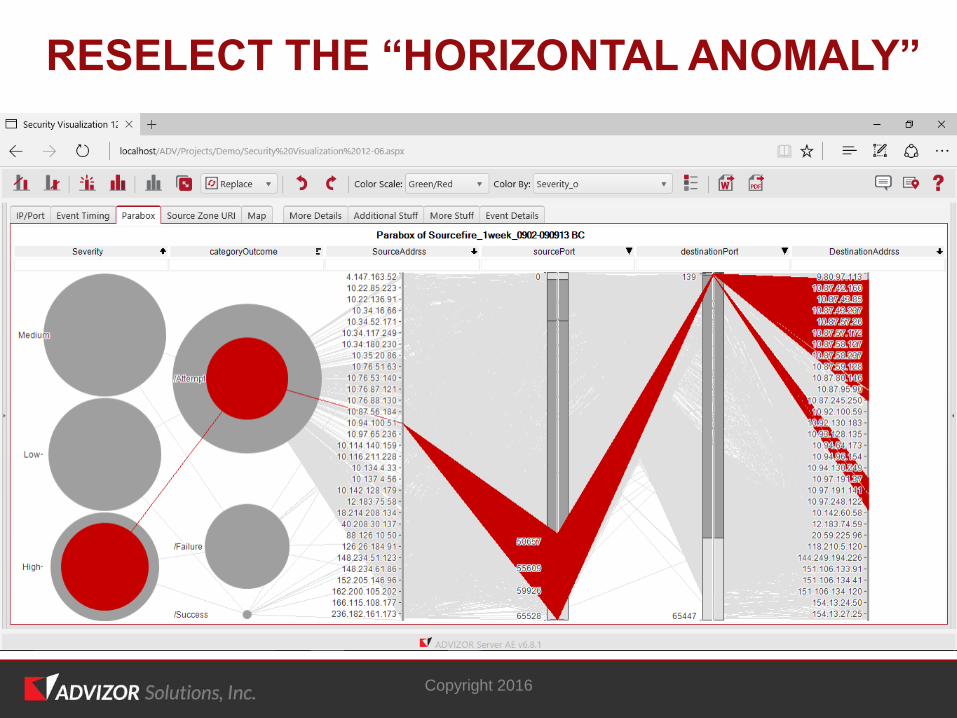
RESELECT THE “HORIZONTAL ANOMALY”
Copyright 2016
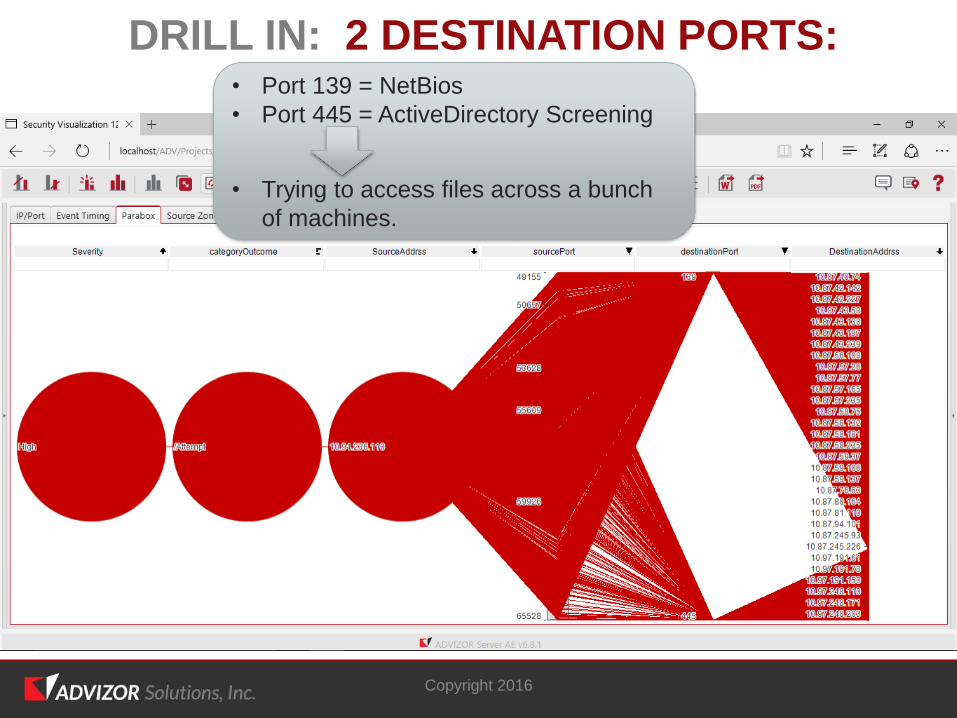
DRILL IN: 2 DESTINATION PORTS:• Port 139 = NetBios
• Port 445 = ActiveDirectory Screening
• Trying to access files across a bunch
of machines.
Copyright 2016
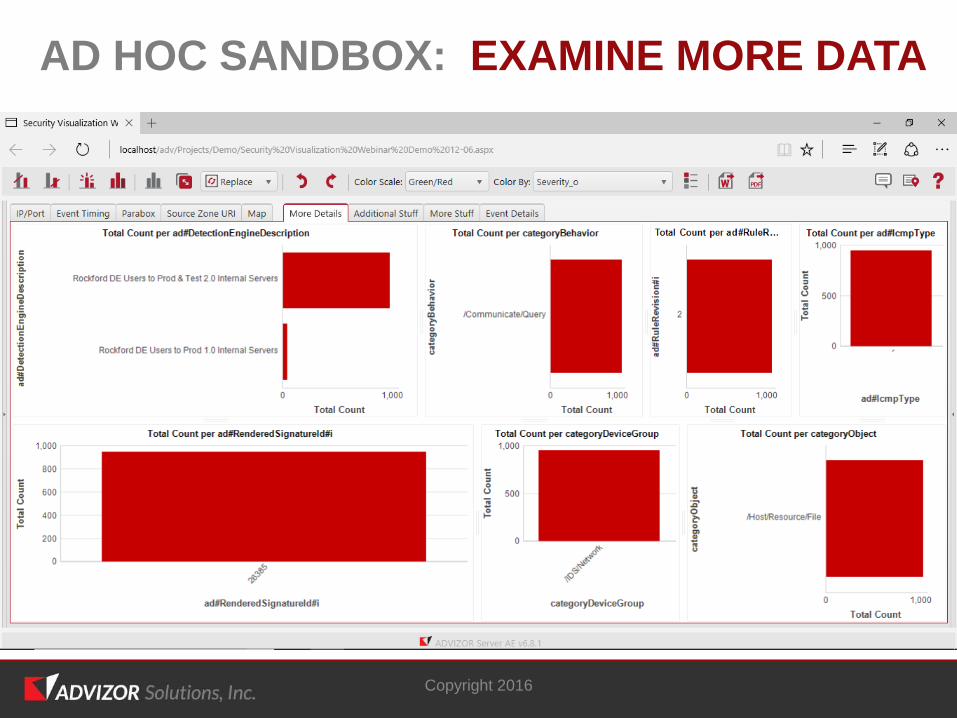
AD HOC SANDBOX: EXAMINE MORE DATA
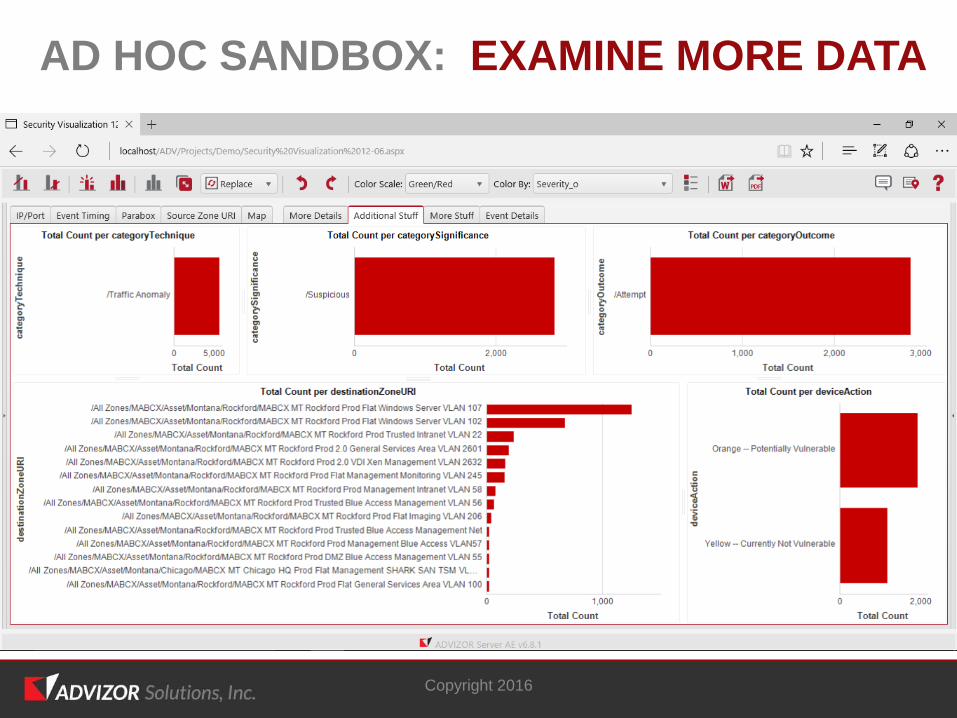
Copyright 2016
AD HOC SANDBOX: EXAMINE MORE DATA
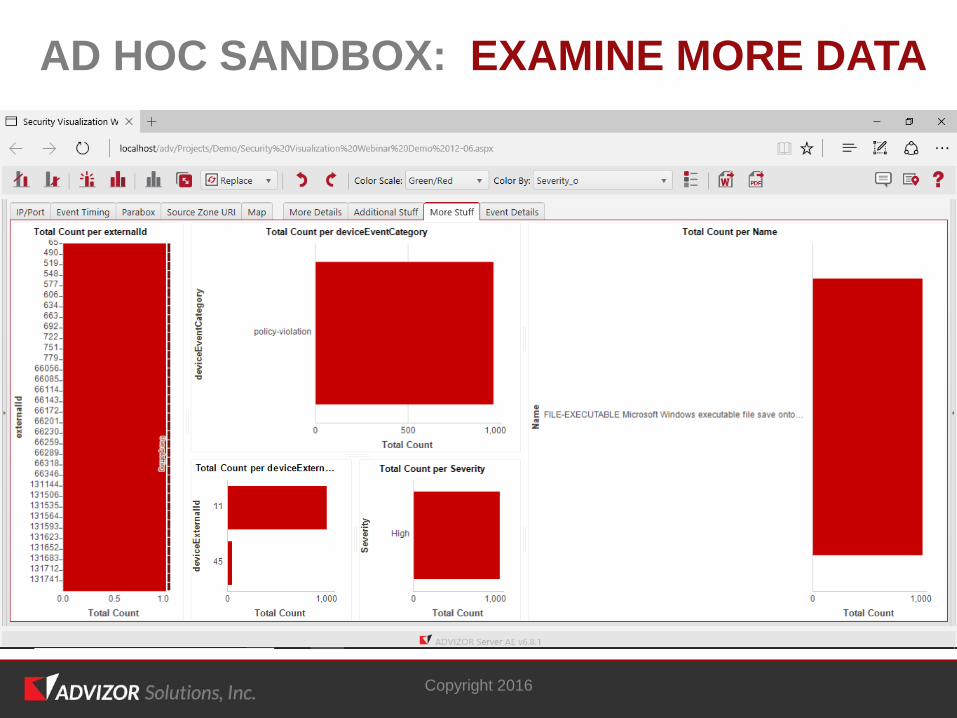
Copyright 2016
AD HOC SANDBOX: EXAMINE MORE DATA
Copyright 2016
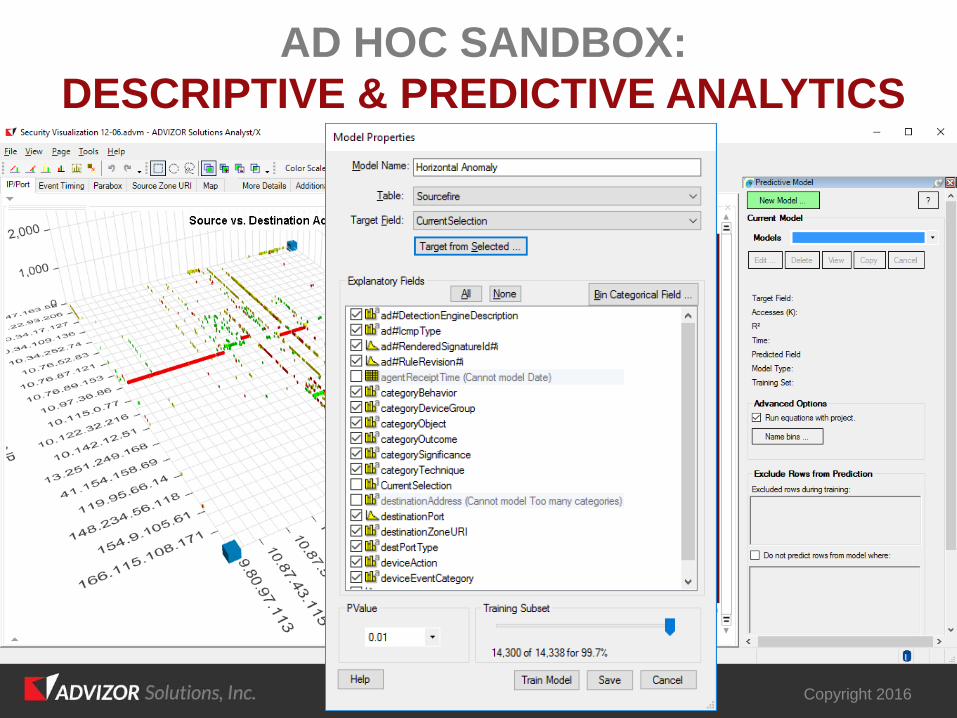
AD HOC SANDBOX:
DESCRIPTIVE & PREDICTIVE ANALYTICS
Copyright 2016
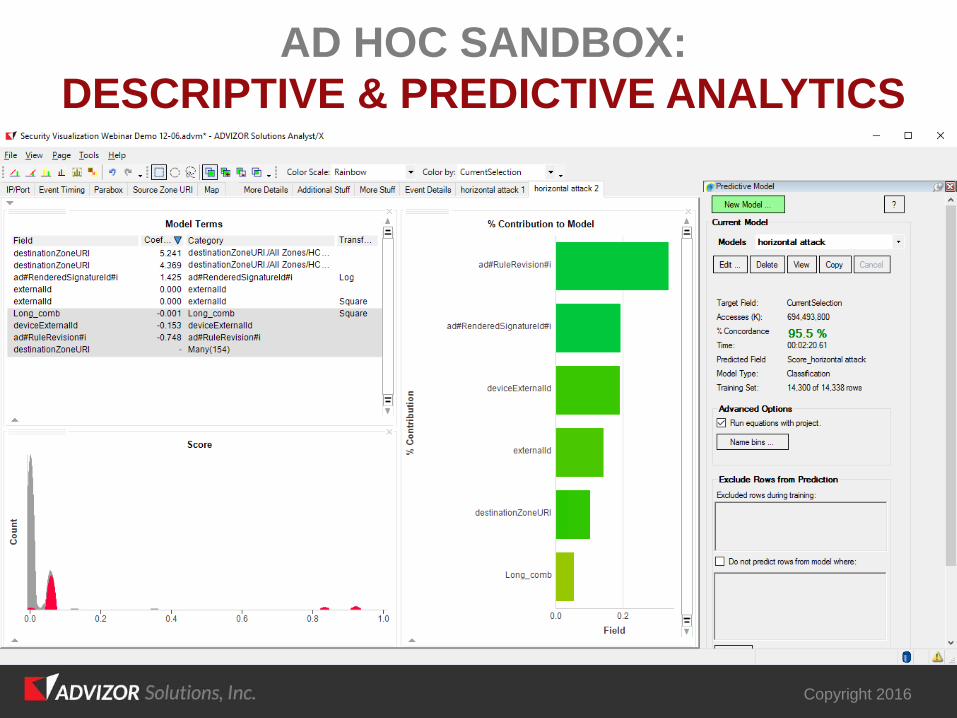
AD HOC SANDBOX:
DESCRIPTIVE & PREDICTIVE ANALYTICS
Copyright 2016
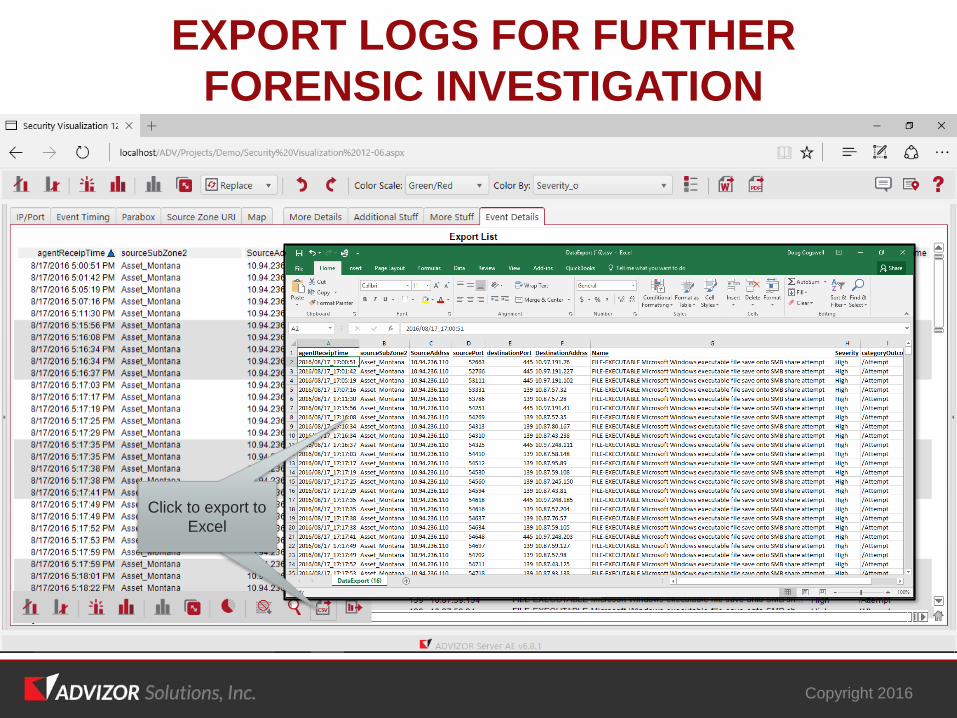
EXPORT LOGS FOR FURTHER
FORENSIC INVESTIGATION
Click to export to
Excel
Click to export to
Excel
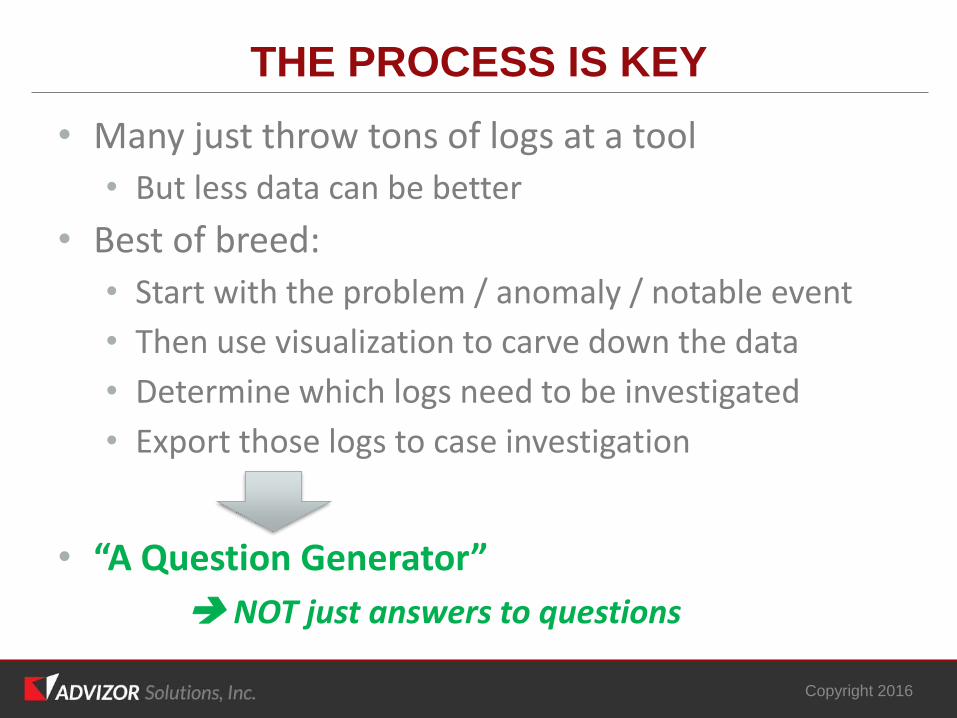
THE PROCESS IS KEY
• Many just throw tons of logs at a tool
• But less data can be better
• Best of breed:
• Start with the problem / anomaly / notable event
• Then use visualization to carve down the data
• Determine which logs need to be investigated
• Export those logs to case investigation
• “A Question Generator”
NOT just answers to questions
Copyright 2016
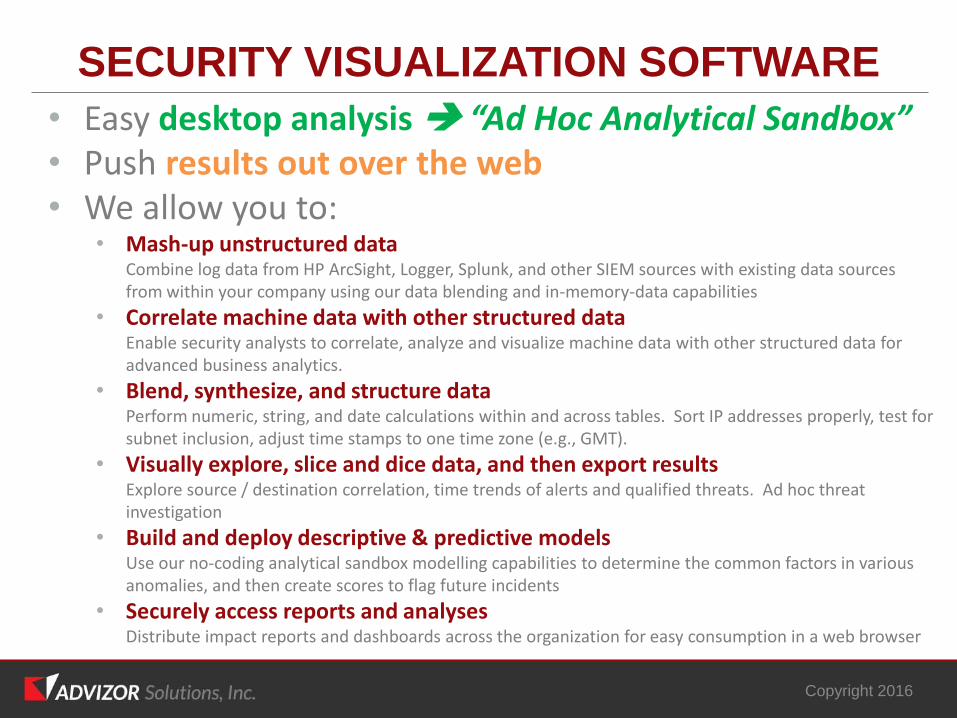
SECURITY VISUALIZATION SOFTWARE
• Easy desktop analysis “Ad Hoc Analytical Sandbox”• Push results out over the web• We allow you to:
• Mash-up unstructured dataCombine log data from HP ArcSight, Logger, Splunk, and other SIEM sources with existing data sources from within your company using our data blending and in-memory-data capabilities
• Correlate machine data with other structured dataEnable security analysts to correlate, analyze and visualize machine data with other structured data for advanced business analytics.
• Blend, synthesize, and structure dataPerform numeric, string, and date calculations within and across tables. Sort IP addresses properly, test for subnet inclusion, adjust time stamps to one time zone (e.g., GMT).
• Visually explore, slice and dice data, and then export resultsExplore source / destination correlation, time trends of alerts and qualified threats. Ad hoc threat investigation
• Build and deploy descriptive & predictive modelsUse our no-coding analytical sandbox modelling capabilities to determine the common factors in various anomalies, and then create scores to flag future incidents
• Securely access reports and analysesDistribute impact reports and dashboards across the organization for easy consumption in a web browser
Copyright 2016
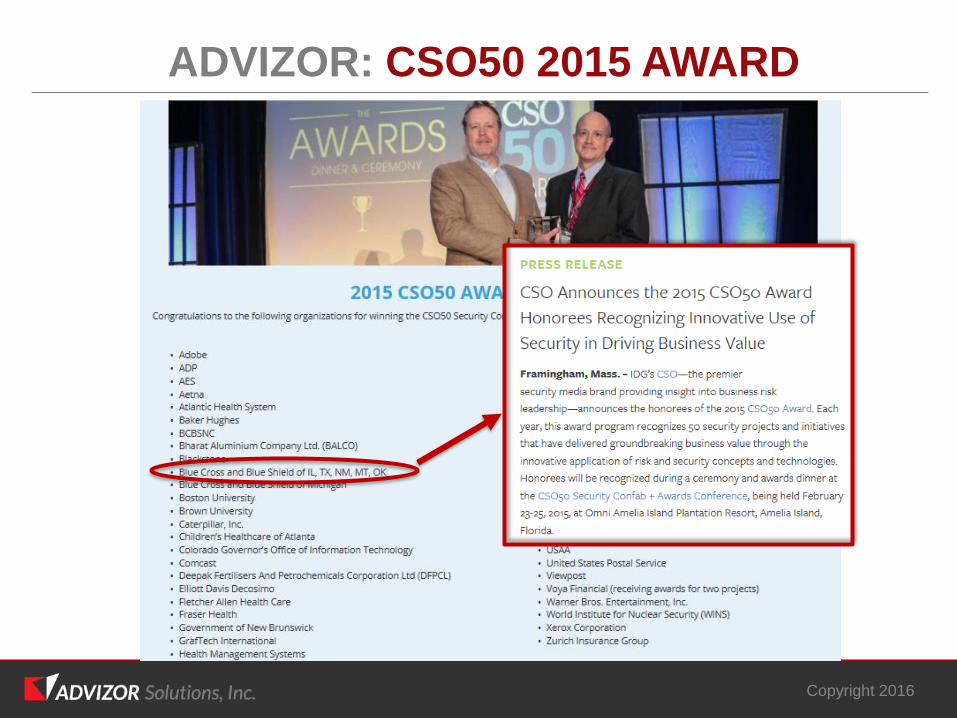
ADVIZOR: CSO50 2015 AWARD
Copyright 2016
Discussion, Q&A
Follow-up: [email protected], +1.630.971.5201
www.AdvizorSolutions.com
Copyright 2016
Find the needle in the haystack.