Embed Size (px)
Citation preview

Business Metrics for the AV Industry

“Knowledge isn’t
power…the right knowledge
at the right time is power.”

Overview
This presentation is targeted to financial
professionals
The focus is on metrics that help in
operations and strategic planning, not
valuation or financial ratios
We will discuss the current trends we are
seeing in the A/V space for metrics
Where we see the future for A/V metrics
The barrier to making the most of metrics

The Big Ten
Total Revenue
Net Profit / EBITDA
Gross Margin (Total and per project/line
of business)
Labor Utilization
Recurring Revenue (RMR)
The Big Ten Cont’d
Revenue / GM per employee
Backlog and it’s variations
Cost per Sale
Fixed Costs / Break Even Point
Cash Flow / Working Capital

1. Total Revenue
Although top line revenue is used as a
quick indicator of company size, it’s value
as a metric is limited.

2. Net Profit
The bottom line is still the end goal.

3. Gross Margin
Project
Service call
Maintenance agreement
Product or Service line of business
Market segment
Geographic territory
Customer or customer group
GM / Labor hour
Key Gross Margin Reports
WIP
Delta change reports
The 4 GP’s

The 4 GP’s for Projects
1. Budget
2. Current projection
3. Invoicing position (Accrued Actuals)
4. Earned (Income Statement)

4. Labor Utilization
Available time per employee
Booking percentage
– Time accounted for / available time
Billable percentage
– Time booked against customers vs
admin time

5. Recurring Revenue
Maintenance agreements
Monitoring, hosting, SaaS etc.
As a percentage of total revenue
Recurring GM as a percentage of
overall GM
6. Revenue/GM per Employee
Just like top line revenue, revenue per
employee is not nearly as important as
gross margin per employee
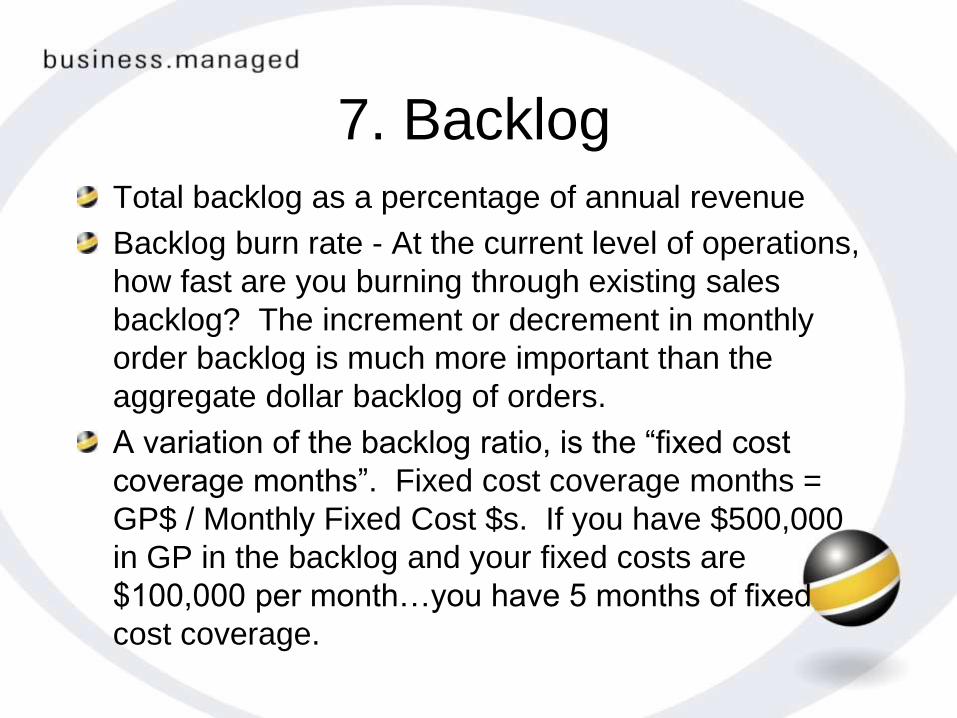
7. BacklogTotal backlog as a percentage of annual revenue
Backlog burn rate - At the current level of operations,
how fast are you burning through existing sales
backlog? The increment or decrement in monthly
order backlog is much more important than the
aggregate dollar backlog of orders.
A variation of the backlog ratio, is the “fixed cost
coverage months”. Fixed cost coverage months =
GP$ / Monthly Fixed Cost $s. If you have $500,000
in GP in the backlog and your fixed costs are
$100,000 per month…you have 5 months of fixed
cost coverage.

8. Cost per Sale
Sales and marketing costs / number of
new sales
Sales and marketing dollars / sales
dollars (new sales, excluding RMR
renewals etc.)

9. Fixed CostsAKA “the nut to crack” - What costs do we need to
overcome every month that are recurring?
“It is imperative that management knows what
contribution margin dollars they are accumulating
daily or monthly to crack the nut. In the short term, it
is nearly impossible to scale back the nut. For this
reason, you need to be able to project short-falls so
you can manage cash needs. Lack of cash flow kills
much faster, than does lack of profit.”
10. Cash Flow
Managing working capital
Days/Months of cash covering fixed
overhead

How are they used?
• Making business decisions (expansion,
contraction, new ventures etc.)
• Proposal generation based upon past
experience
• Labor force management – hiring and firing
• Reporting to banks and bonding companies
• Management and employee compensation
• Franchise model for expansion
Emerging Metrics
• Forecasting is becoming more important
than ever
• Monthly forecast of material, labor, cash
in / out

Emerging Metrics
1-Jan Jan Feb Mar Apr
Remai
nder
Orig Value Month 1 Month 2 Month 3 Month 4
Mat/Sub/Misc $100,000.00 10.00% 10.00% 30.00% 50.00% 0.00%
Labor $50,000.00 5.00% 40.00% 10.00% 45.00% 0.00%
Invoicing $200,000.00 20.00% 40.00% 20.00% 20.00% 0.00%

Emerging Metrics
• Bringing more costs above the line, true
cost of executing a project

Emerging Metrics
• Cost allocation methods - provide
allocations by cost factors
• finance charges
• PM time when direct booking is not
possible
• Supervisor / team leader
• other overheads
Emerging Metrics
• Material burden
• Budgeted and Actual
• Material burdens range from 2% – 5%
of cost
• Represent internal purchasing and
handling costs
Emerging Metrics
• Focus on customer profitability
• GM across projects, service,
maintenance agreements, brokerage
sales etc.
• Customer groups (individual customers
looked at as a whole)

“If you do what you've
always done... you'll get
what you always got.”
Eric Morris, CFO, Wayne Automatic Fire Sprinklers

The Missing Piece
Execution!

Barriers to Execution
1. Accurate tracking of labor hours and
costs
2. Disciplined job costing processes
3. Accountability at the correct
organizational levels
4. Formalized tracking of the sales
process
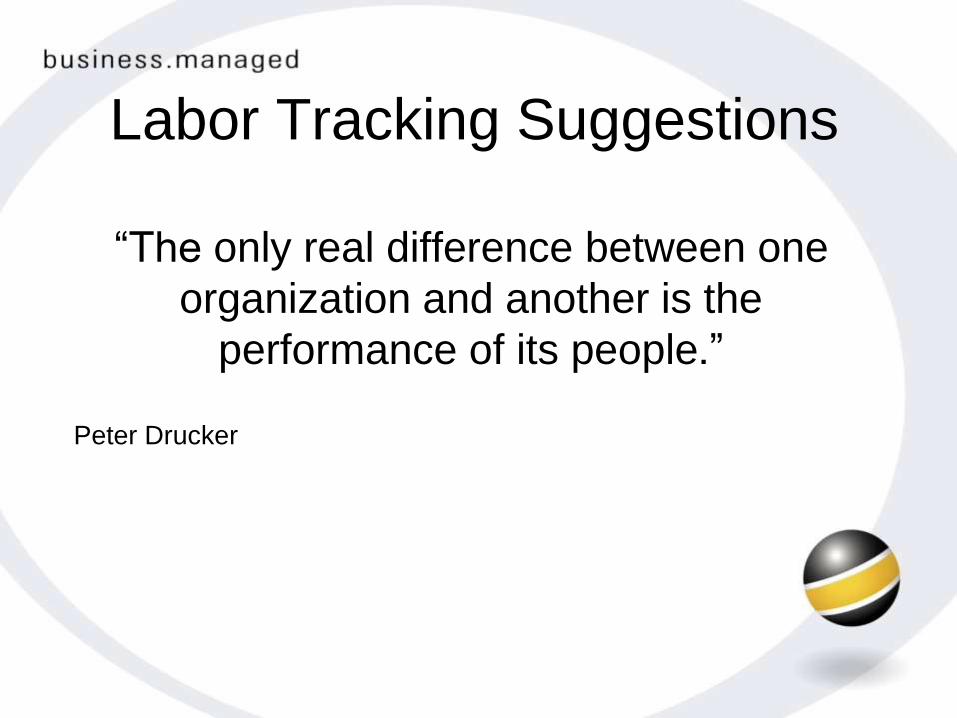
Labor Tracking Suggestions
“The only real difference between one
organization and another is the
performance of its people.”
Peter Drucker

Weekly ExampleUser ID Customer Avail Total Book Book % Billable Bill % NonBill Admin
AWONG ABC Company 0.5 0% 0.5 0% 0 0
AWONG ACME Inc. 31 0% 17.25 0% 13.75 0
AWONG XYZ Company 5 0% 0 0% 0 5
AWONG Total: AWONG 35 36.5 104.29% 17.75 48.63% 13.75 5
BHILL ABC Company 0.62 0% 0.62 0% 0 0
BHILL ACME Inc. 31.86 0% 0 0% 0 31.86
BHILL XYZ Company 2.47 0% 2.47 0% 0 0
BHILL Total: BHILL 40 34.95 87.38% 3.09 8.84% 0 31.86
BSTEFANIDIS ABC Company 7.54 0% 7.54 0% 0 0
BSTEFANIDIS ACME Inc. 31.06 0% 31.06 0% 0 0
BSTEFANIDIS XYZ Company 0.63 0% 0 0% 0 0.63
BSTEFANIDIS Total: BSTEFANIDIS 40 39.23 98.08% 38.6 98.39% 0 0.63
CFLANNIGAN ABC Company 0.89 0% 0.89 0% 0 0
CFLANNIGAN ACME Inc. 1.49 0% 1.49 0% 0 0
CFLANNIGAN XYZ Company 22.03 0% 0 0% 0 22.03
CFLANNIGAN AAA Inc. 0.53 0% 0.53 0% 0 0
CFLANNIGAN Total: CFLANNIGAN 40 24.94 62.35% 2.91 11.67% 0 22.03

Weekly Example

Weekly Example

Labor Tracking Suggestions
• Link time tracking to payroll (works for
hourly workers)
• Make it easy to track and link time
Labor Tracking Suggestions
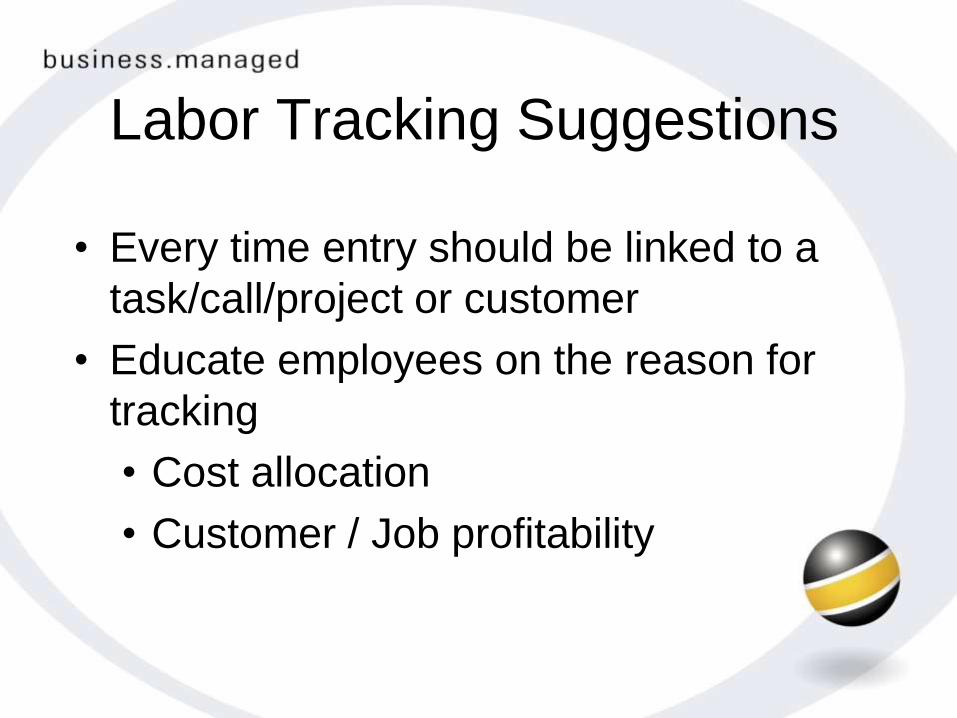
• Every time entry should be linked to a
task/call/project or customer
• Educate employees on the reason for
tracking
• Cost allocation
• Customer / Job profitability

Labor Tracking Suggestions
• Make it difficult to enter it late – possibly
extra approval steps, or a system block
• Daily review by management
• Follow up on daily review
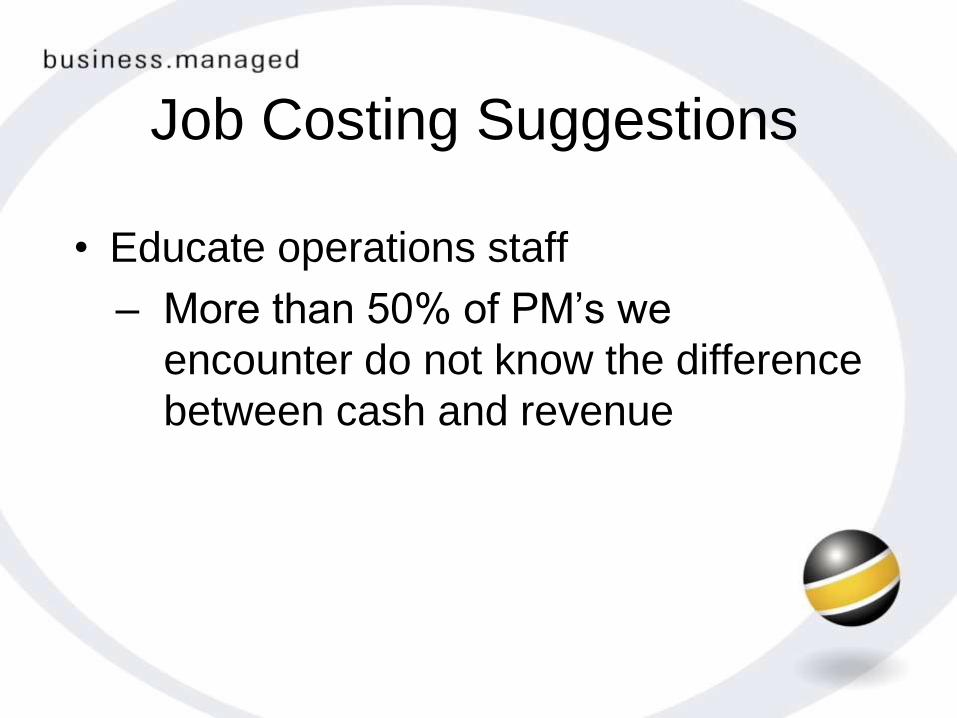
Job Costing Suggestions
• Educate operations staff
– More than 50% of PM’s we
encounter do not know the difference
between cash and revenue

Job Costing Suggestions
• Incent profitability
– Teams, bonus program etc.
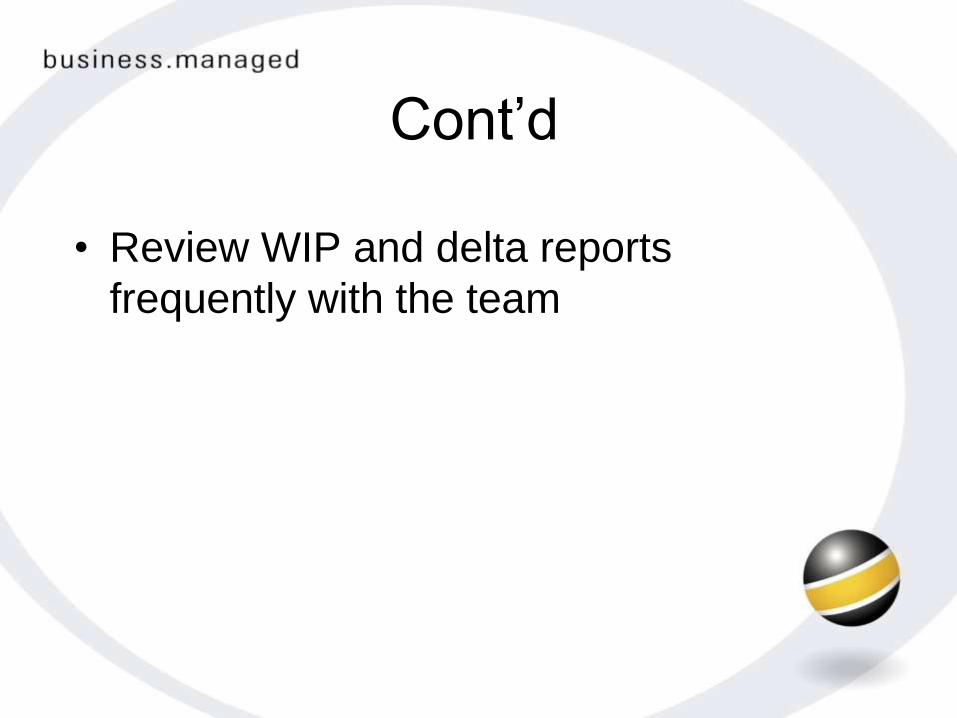
Cont’d
• Review WIP and delta reports
frequently with the team

Job Costing Course Overview
• Optionally at end of presentation

Accountability
“No snowflake in an avalanche ever feels
responsible.”
Anon.

Accountability Suggestions
• Make the project team responsible for
profitability, and grant the appropriate
authority
• Have the PM’s review WIP and delta
reports
• Have PM’s do a budget approval
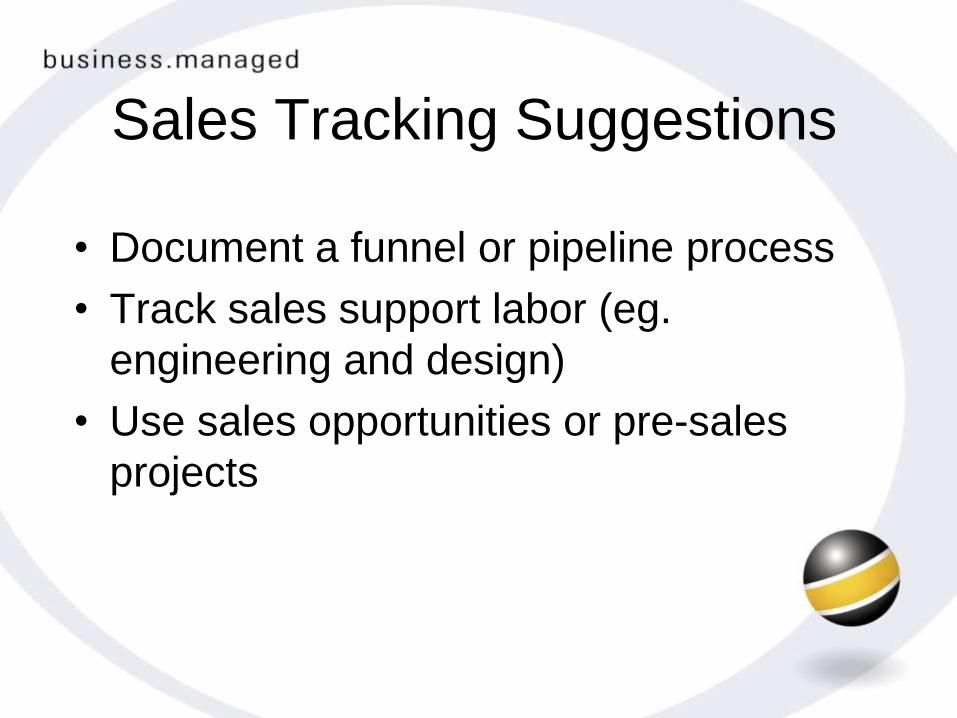
Sales Tracking Suggestions
• Document a funnel or pipeline process
• Track sales support labor (eg.
engineering and design)
• Use sales opportunities or pre-sales
projects

Sales Tracking Suggestions
• Measure forecast vs actual sales
• Pre-sales projects can flow in to final
project

“The time to repair the roof is when
the sun is shining.”
John F. Kennedy

Summary
Execution of the drivers is critical
Educated operations staff make
profitable decisions
Daily follow up by management is
mandatory
The changes required are cultural and
process based

In Closing
“Even if you're on track, you'll get run
over if you just sit there.”
Will Rogers.

I went to a bookstore and asked the
saleswoman, “Where’s the self-help
section?”
She said if she told me, it would defeat
the purpose.
Steven Wright