Embed Size (px)
Citation preview
Burndown Chart How-to
Quick guide to the JIRA add-on https://marketplace.atlassian.com/plugins/com.nomtek.BurndownChart
Goals• Flexible iteration management
• Pace of work monitoring
• Finish date prediction
• Early learning of failure causes to fix them
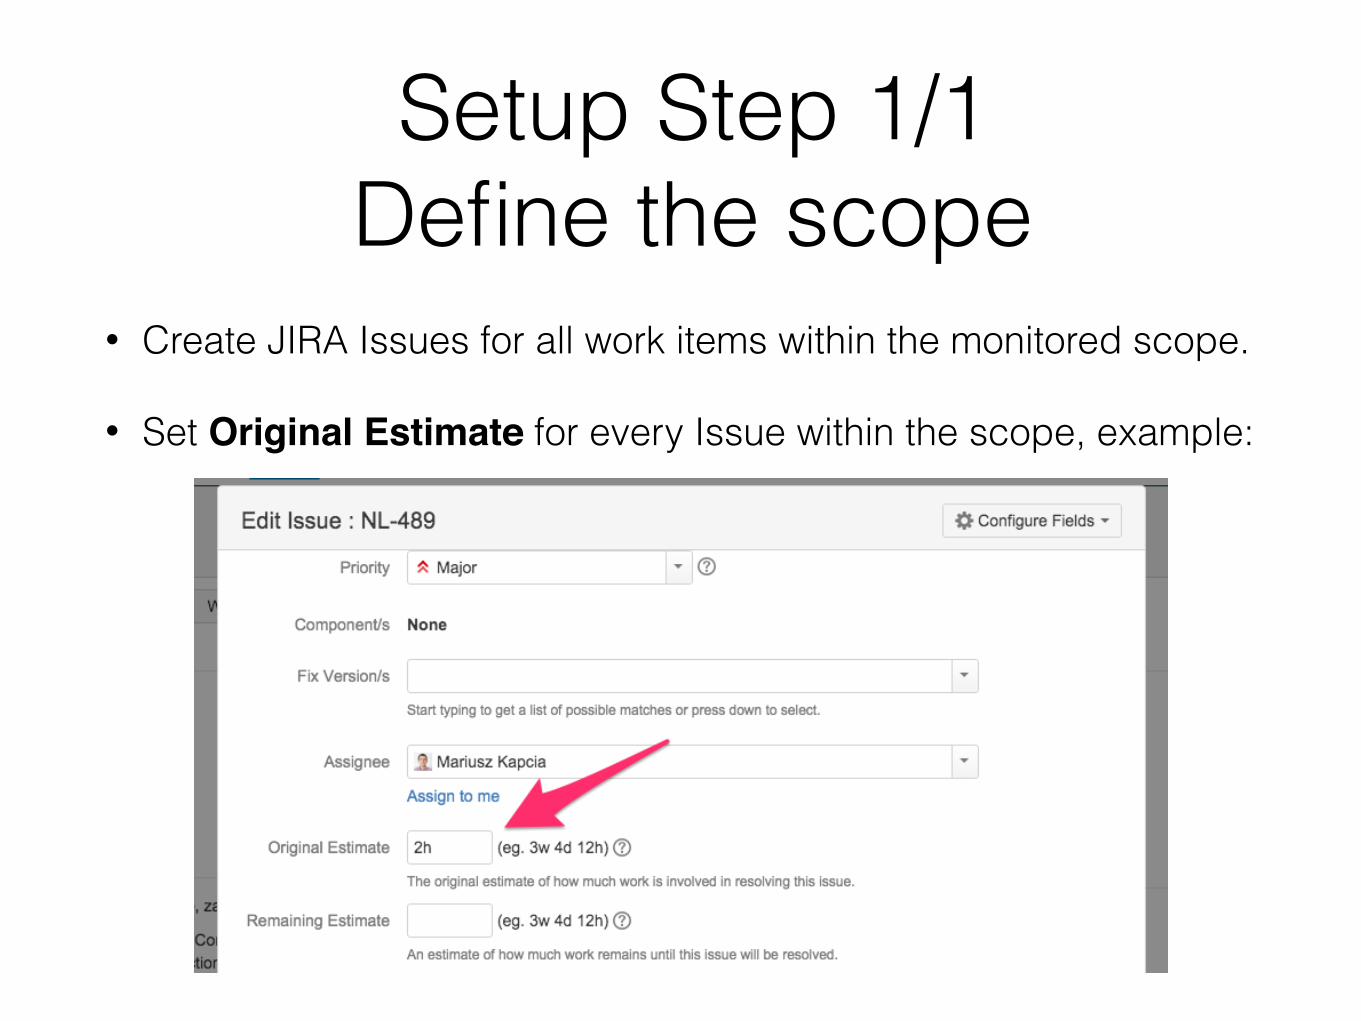
Setup Step 1/1 Define the scope
• Create JIRA Issues for all work items within the monitored scope.
• Set Original Estimate for every Issue within the scope, example:
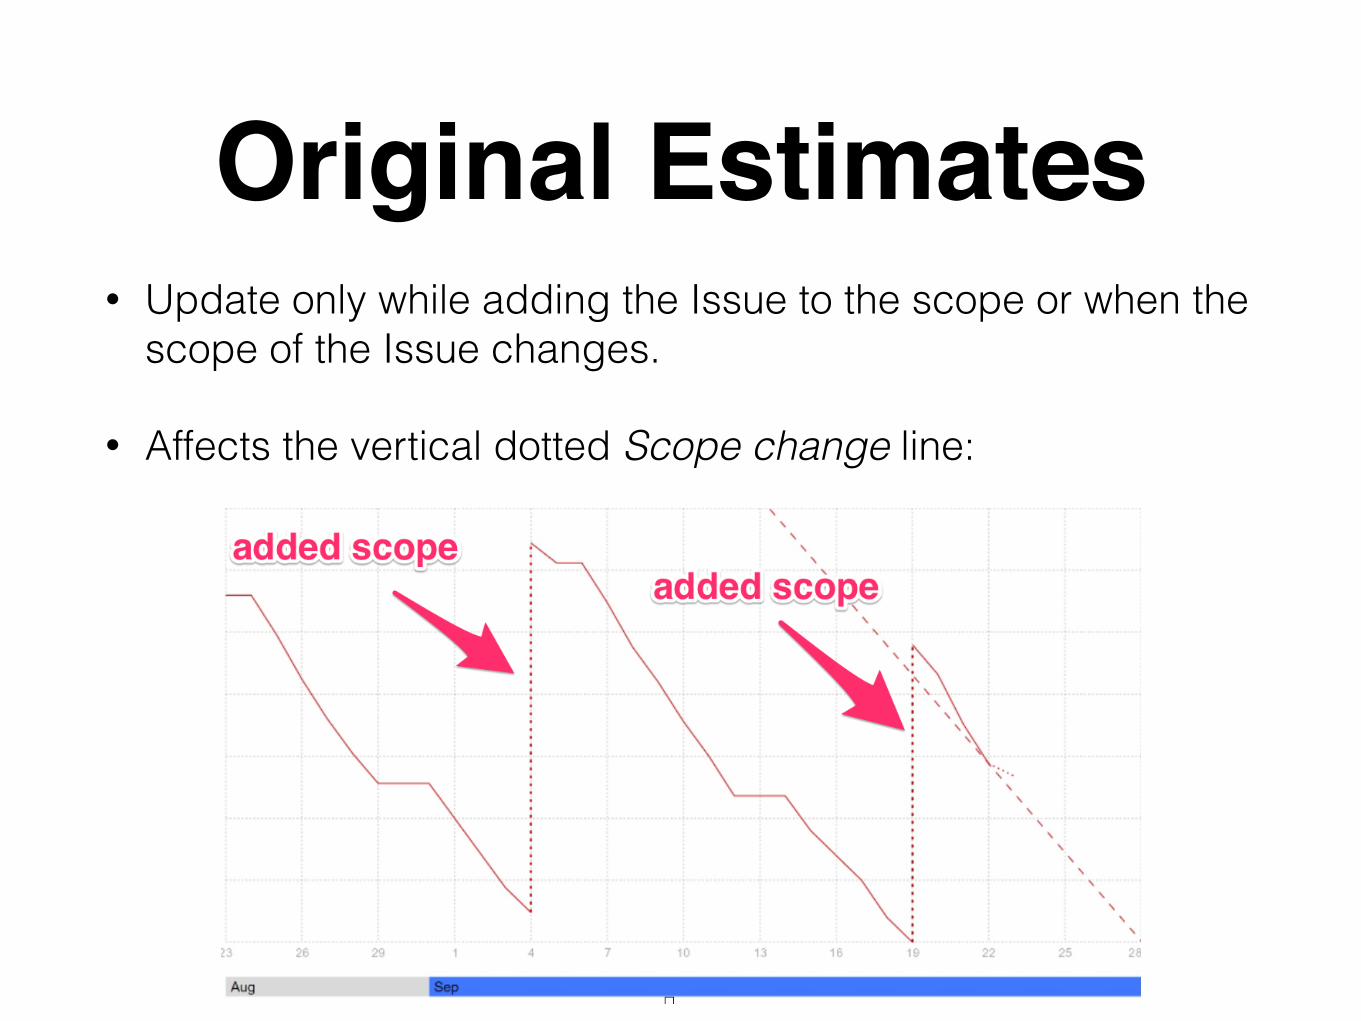
Original Estimates• Update only while adding the Issue to the scope or when the
scope of the Issue changes.
• Affects the vertical dotted Scope change line:
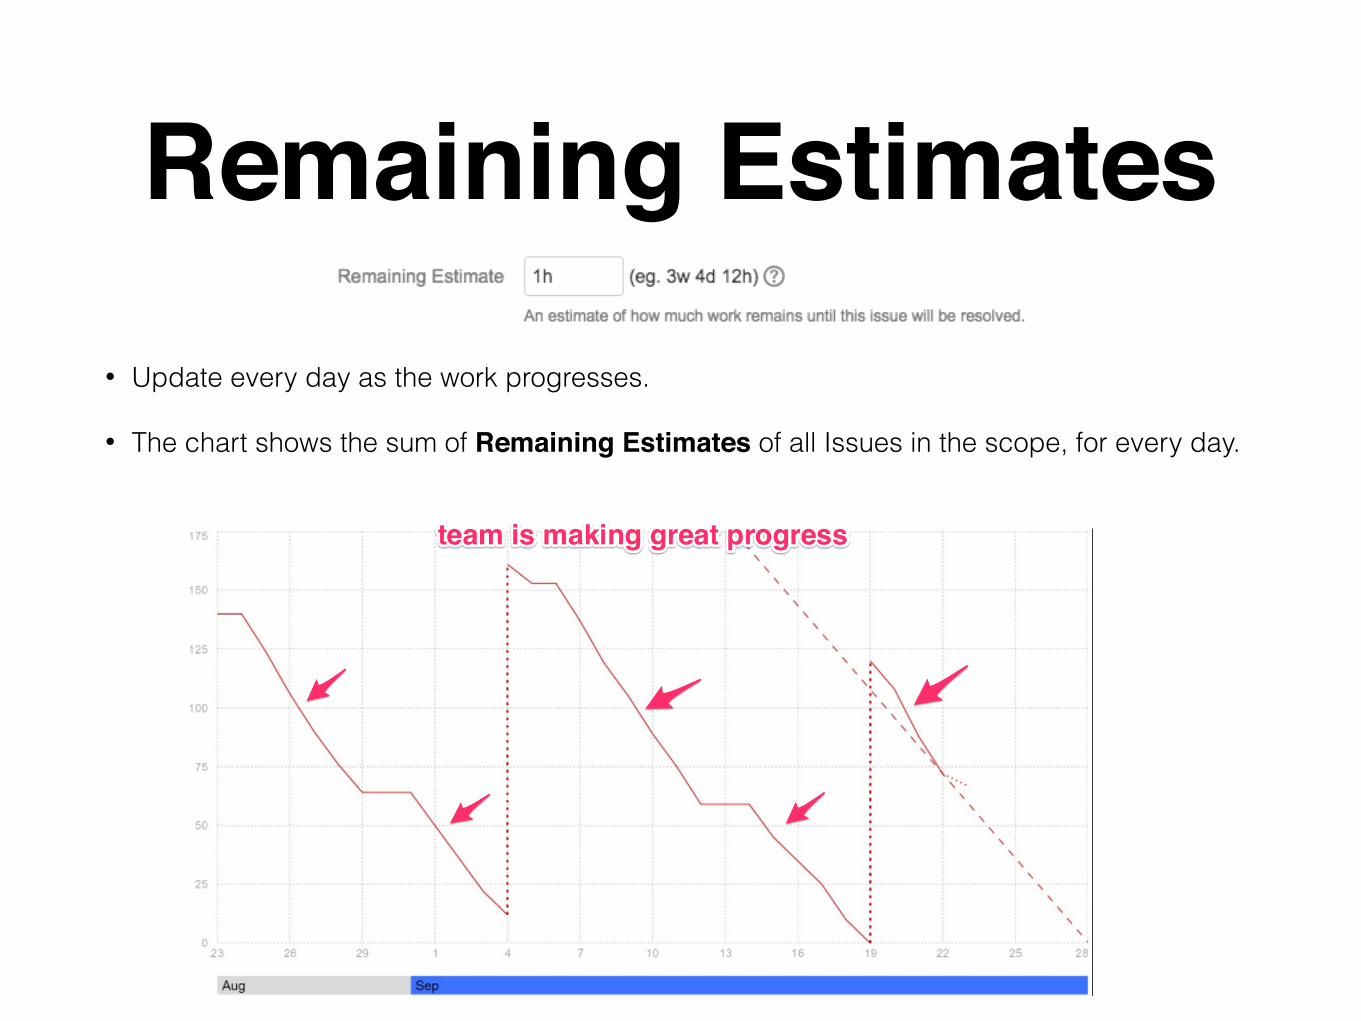
Remaining Estimates• Update every day as the work progresses.
• The chart shows the sum of Remaining Estimates of all Issues in the scope, for every day.
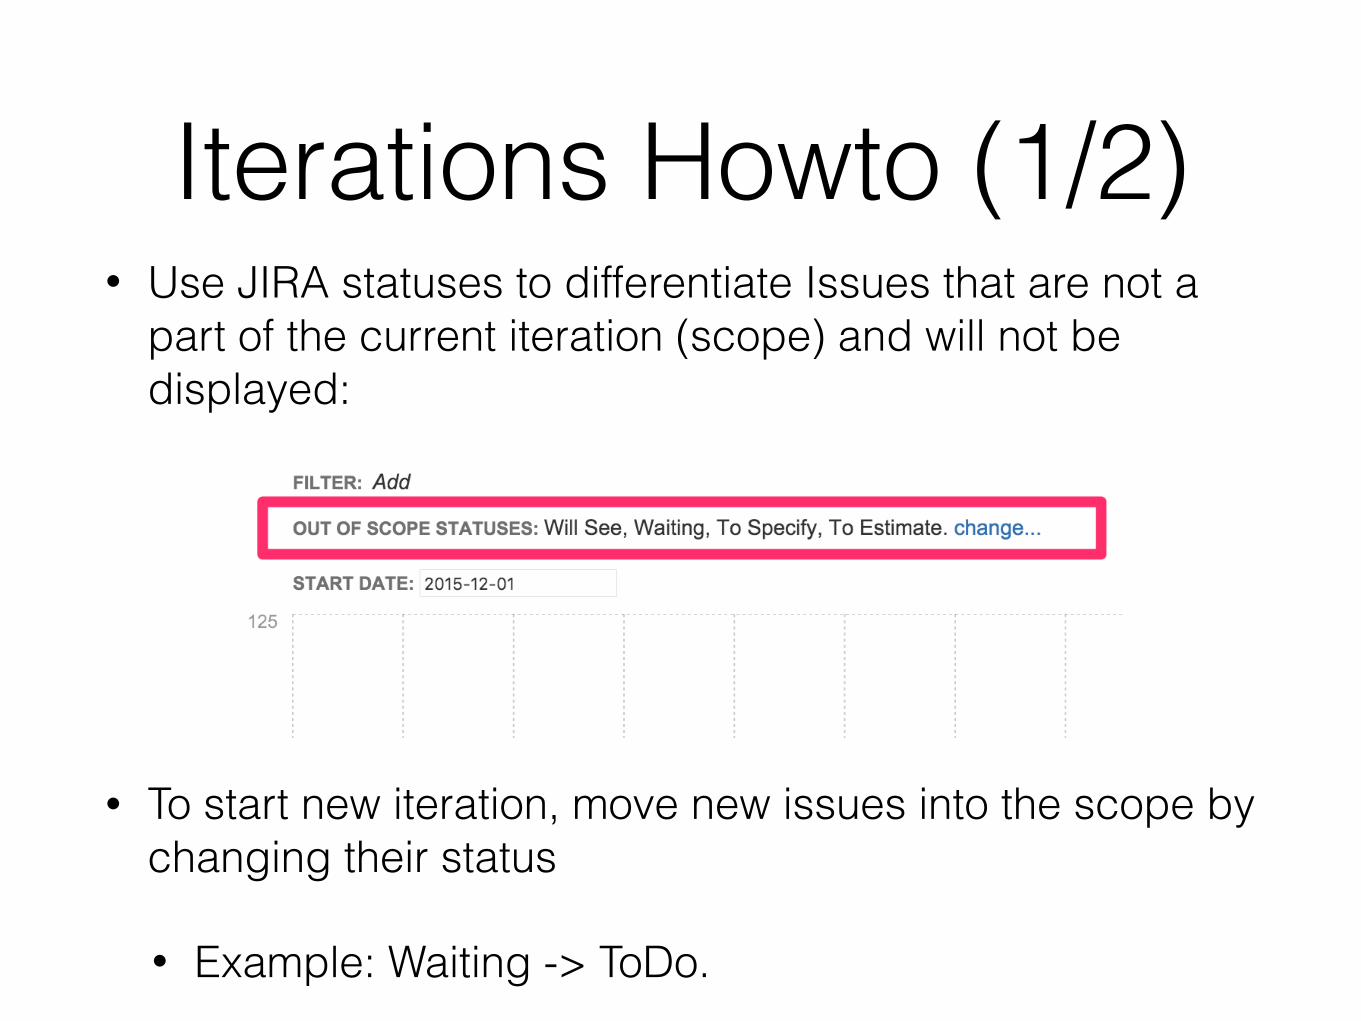
Iterations Howto (1/2)• Use JIRA statuses to differentiate Issues that are not a
part of the current iteration (scope) and will not be displayed:
• To start new iteration, move new issues into the scope by changing their status
• Example: Waiting -> ToDo.
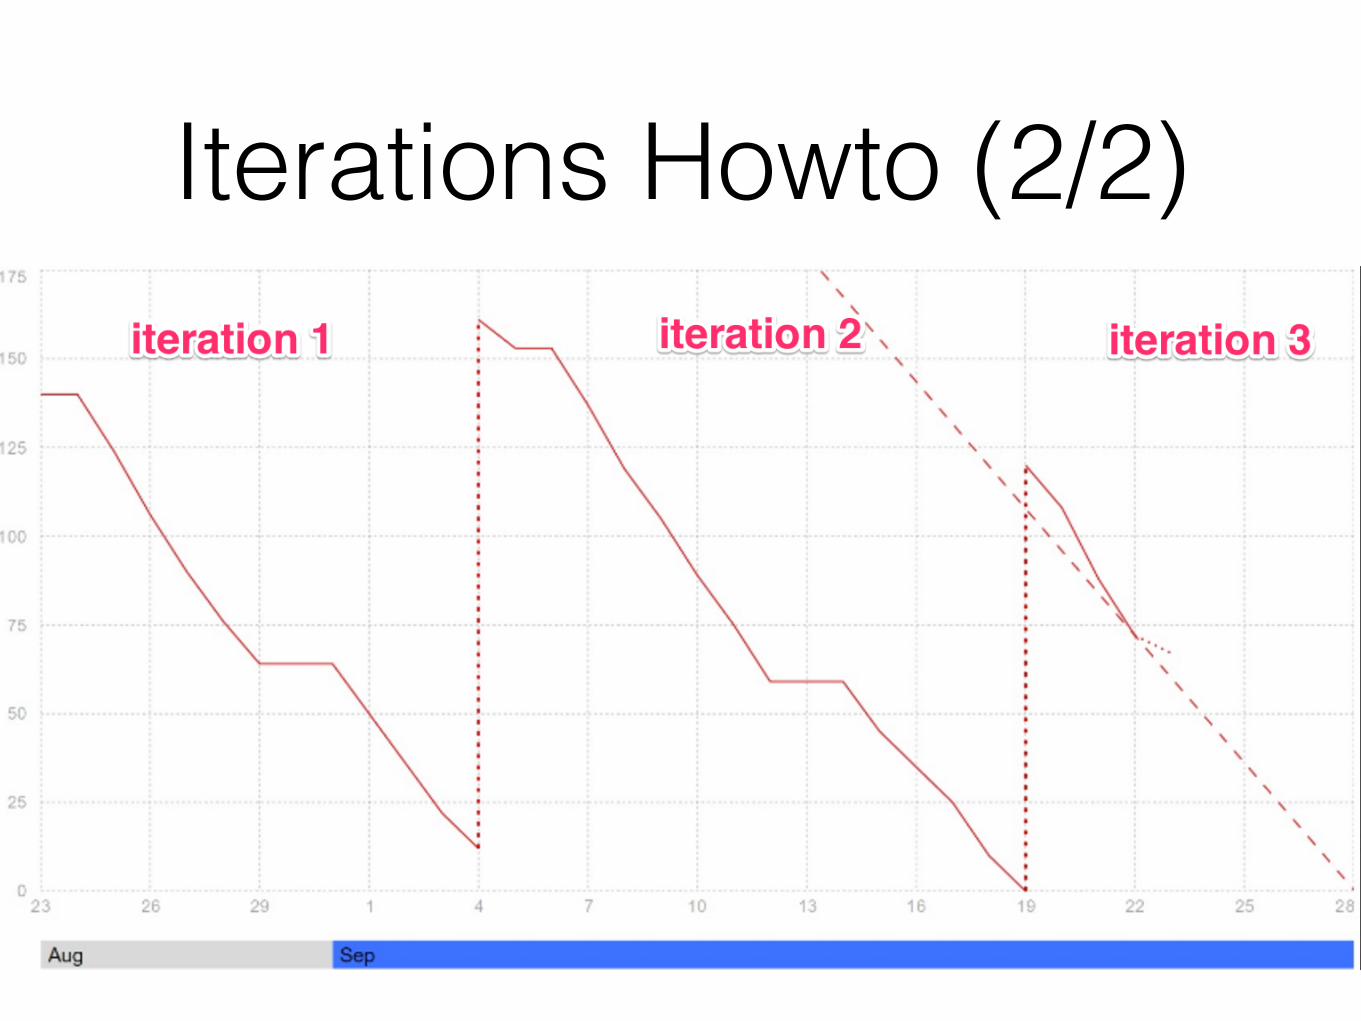
Iterations Howto (2/2)
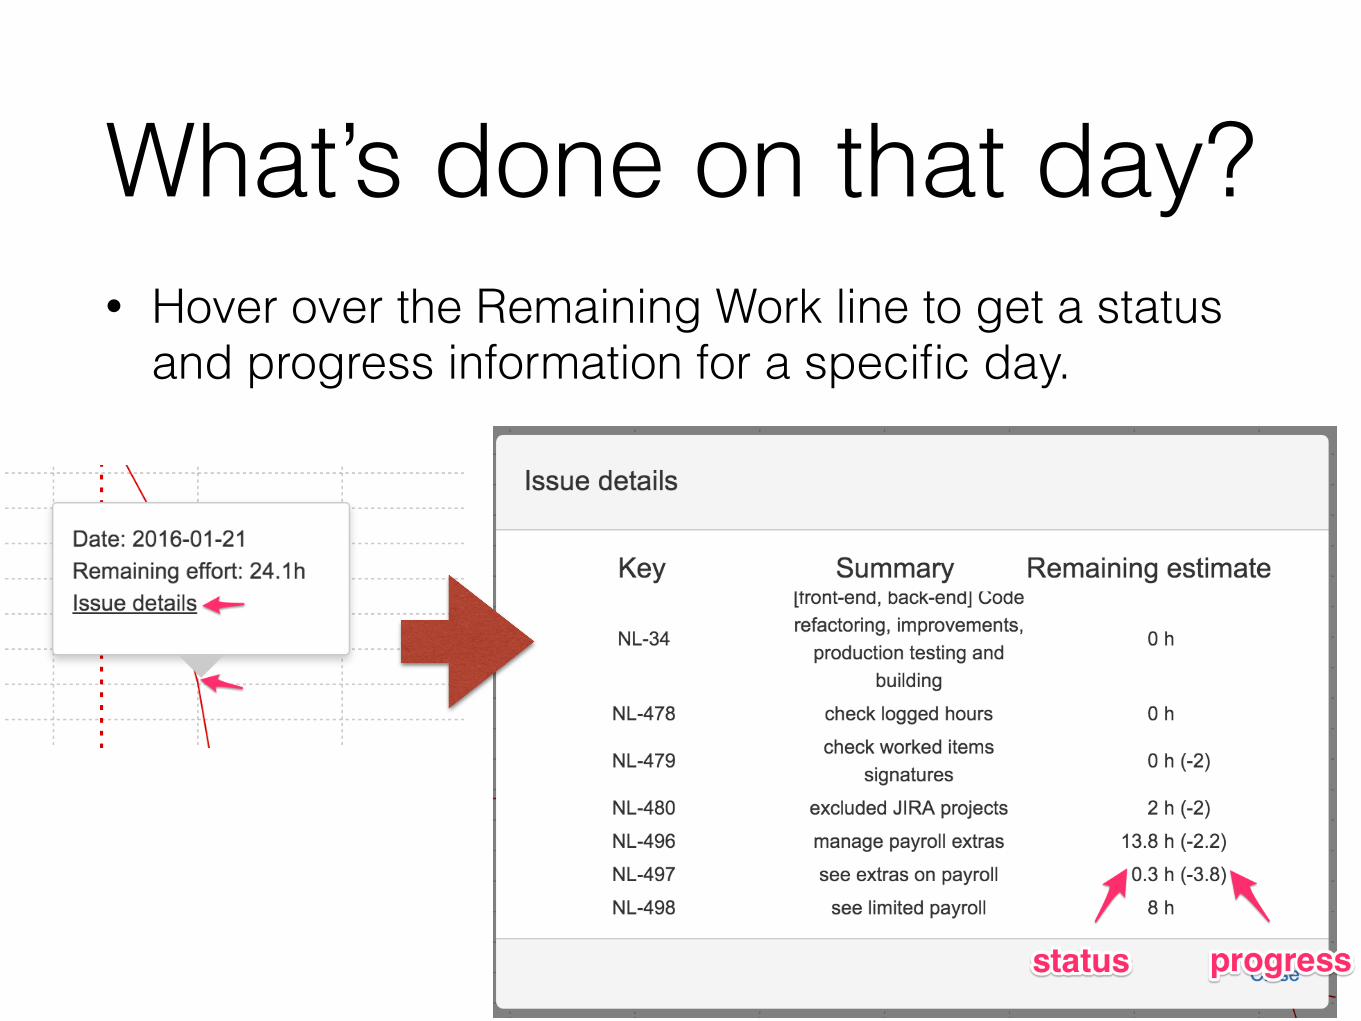
What’s done on that day?• Hover over the Remaining Work line to get a status
and progress information for a specific day.
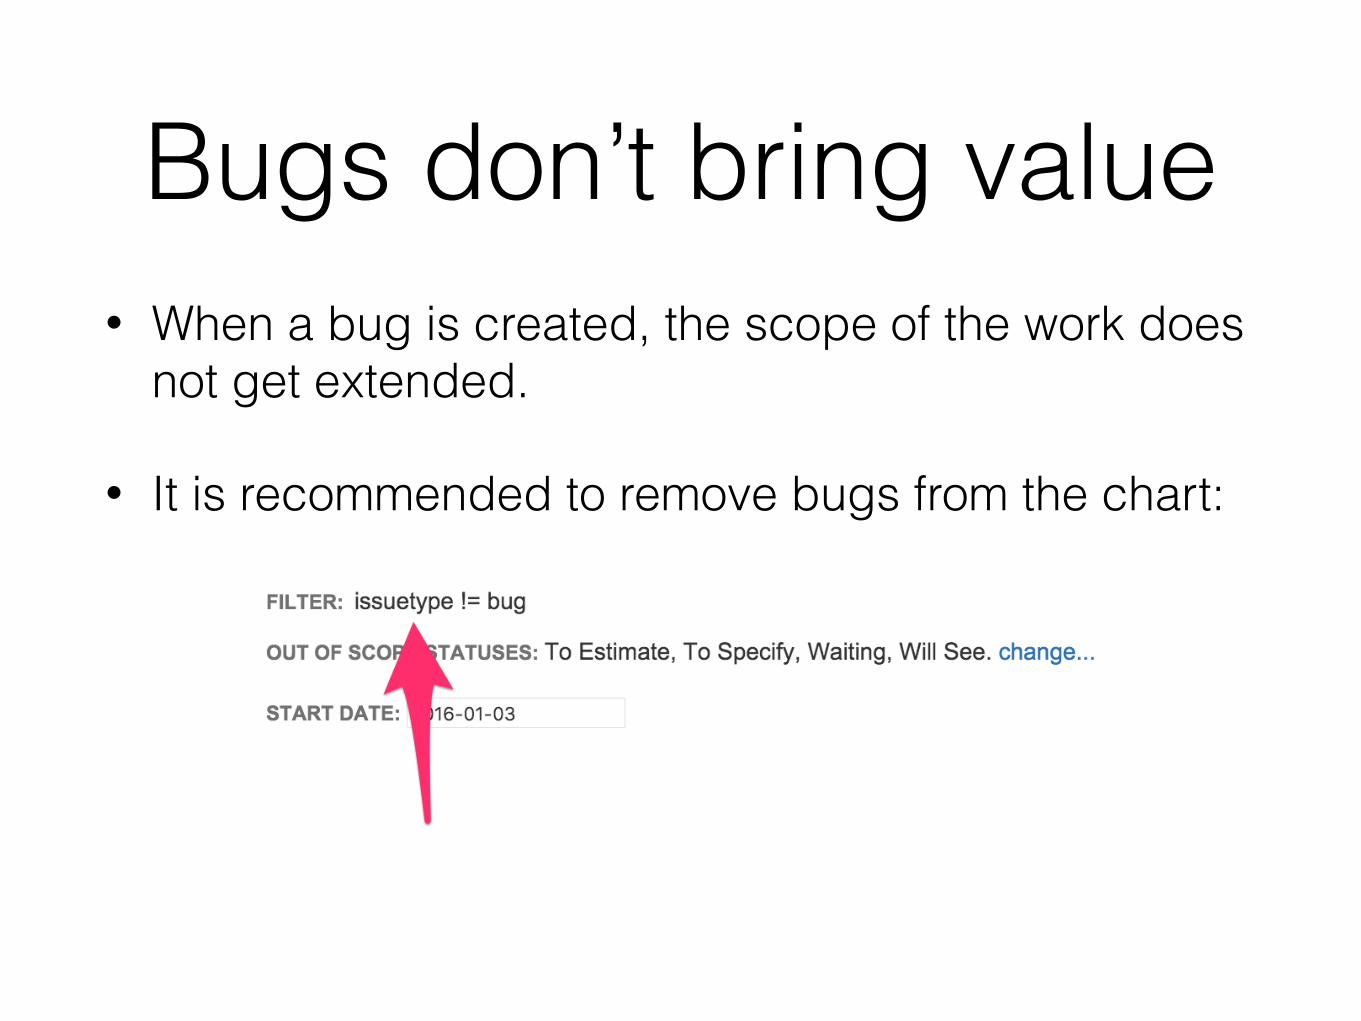
Bugs don’t bring value• When a bug is created, the scope of the work does
not get extended.
• It is recommended to remove bugs from the chart:
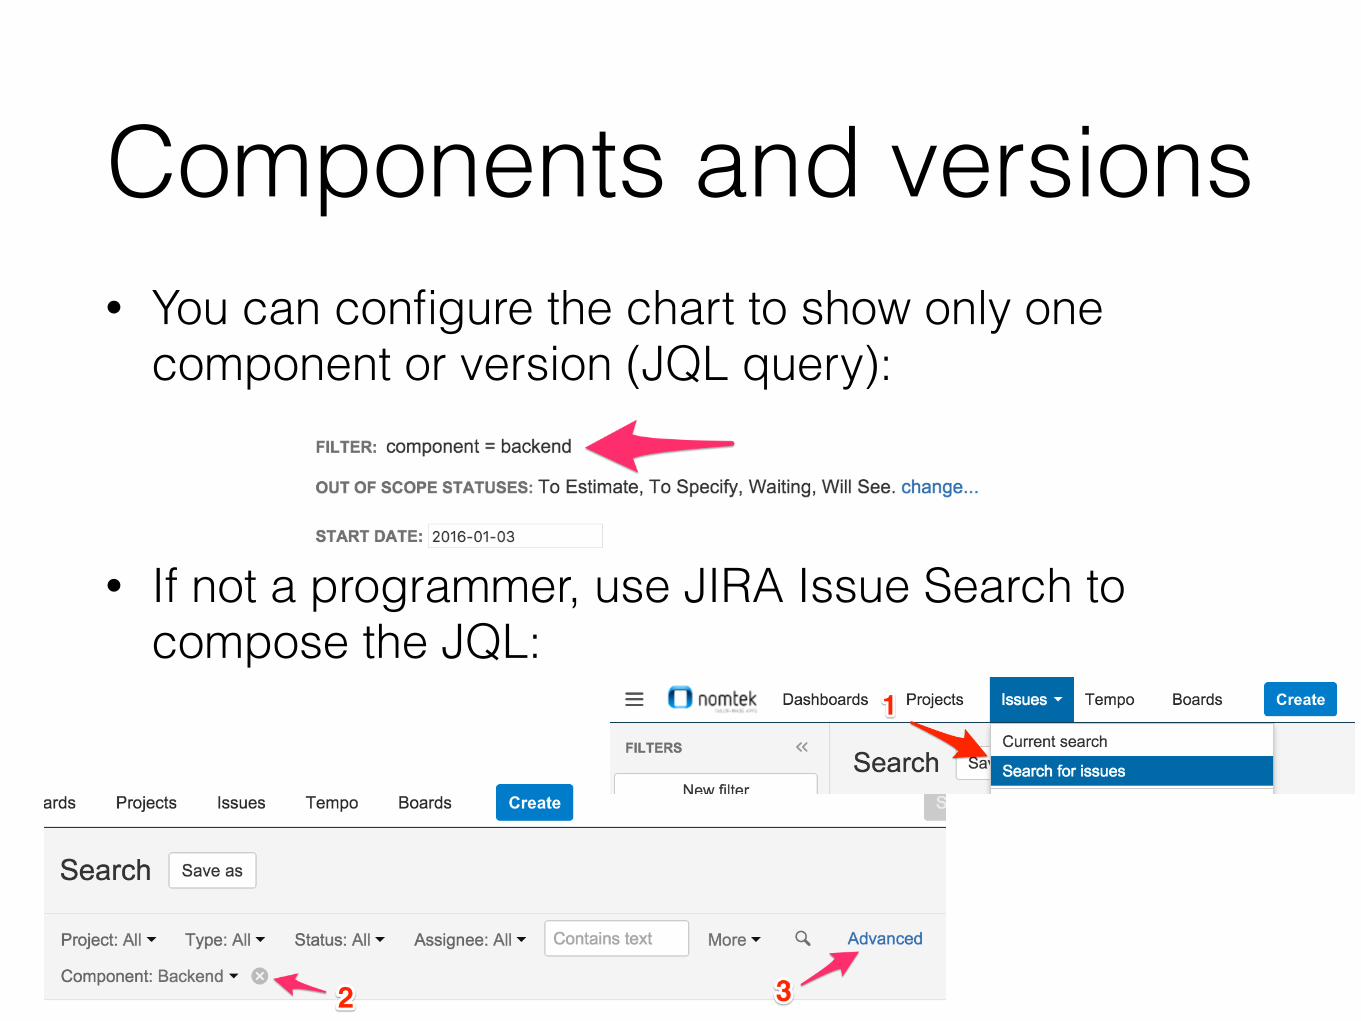
Components and versions• You can configure the chart to show only one
component or version (JQL query):
• If not a programmer, use JIRA Issue Search to compose the JQL: