Embed Size (px)
Citation preview

TOP US BRANDS

About Unmetric Providing data powered insights for human powered brands, Unmetric provides an
unparalleled platform for data analytics and benchmarking your brand’s content marketing
efforts on Facebook, Twitter, YouTube, Instagram, LinkedIn and Pinterest.
We’ve processed more than 100,000,000 pieces of micro-content over the 6 biggest social
networks for 20,000+ brands from 30+ sectors, just for you.
Unmetric is proud to be a
Twitter Certified Product
Some of our Clients:
Crafting content that not only meets business objectives, but also appeals to their
target audiences has become a compelling strategy for brands across social media
platforms. Be it product showcases like Neutrogena’s skin care products for men or
Tony Burch’s pre-fall collection or like how Bacardi and Adidas Football leveraged
the FIFA World Cup, this report helps in understanding how brands are employing
the strategy of increasingly matching business objectives with content that
resonates with their social audiences.
In this report, Unmetric also takes a look at how the social media efforts of each of these brands
paid off, while also offering insights from the best of these sectors.
All data and insights were gathered from the month of July. Look out for August’s report in early
September.

All images in this report are hyperlinked
to their original post but if you want
to find out in detail what brands did to
meet their business objectives


All data for the time period: July 1st – 31st 2014
Uncovering the best of the Personal Care Sector
Among the top Personal Care
brands, on an average, 21% of
content posted by admins was ‘brand
related’.
3,457 new posts were written across
the ‘brand walls’ of top brands. That’s
an average of 7.4 posts per day –
per wall!
With the growth rate of 4.6%, Rexona
enjoyed the highest fan growth rate
among the top Personal Care brands.
Among all Personal Care brands from
North America, Pantene North America
talked the most about themselves.
Among the top Personal Care
brands, Dove posted the most ‘non
brand related’ content on their wall.
Among, all Personal Care pages from
North America, Zoom Whitening was
engaging the best with its fans.
To see more comparative data on these brands, send us an email
and we’ll get you started on a free trial of Unmetric.

All data for the time period: July 1st – 31st 2014
Uncovering the best of Alcohol Sector
4,007 new posts were written across
the ‘brand walls ‘ of top brands.
That’s an average of 8.6 posts per
day – per wall!
Among all Alcohol brands from North
America, Michelob ULTRA talked the
least about themselves.
With a growth rate of 2.1%, Malibu
Rum enjoyed the highest fan growth
rate among the top Alcohol brands.
Among the top Alcohol brands, Patron
Tequila was engaging the best with
their fans.
Among the top brands, on an
average, 21% of content posted by
admins was ‘brand related’.
Among all Alcohol brands from North
America, Budweiser talked the most
about themselves.
To see more comparative data on these brands, send us an email
and we’ll get you started on a free trial of Unmetric.

Understanding Selected Top Brands

Neutrogena – #RespectYourFace
Neutrogena’s posts around its skincare product for men resonated well with its fans.
The #RespectYourFace campaign was the most engaging out of the two campaigns
run by Neutrogena in July with an average engagement score of 158.
*Please see the Appendix of this report for a complete
explanation of the Engagement Score.

Bacardi (United States) – Content Strategy
Bacardi (United States) leveraged the FIFA World Cup for its content on its Facebook
page and the posts around the event garnered an average engagement score of 766,
which is more than 4 times the overall average engagement score of 164.
*Please see the Appendix of this report for a complete
explanation of the Engagement Score.

All data for the time period: July 1st – 31st 2014
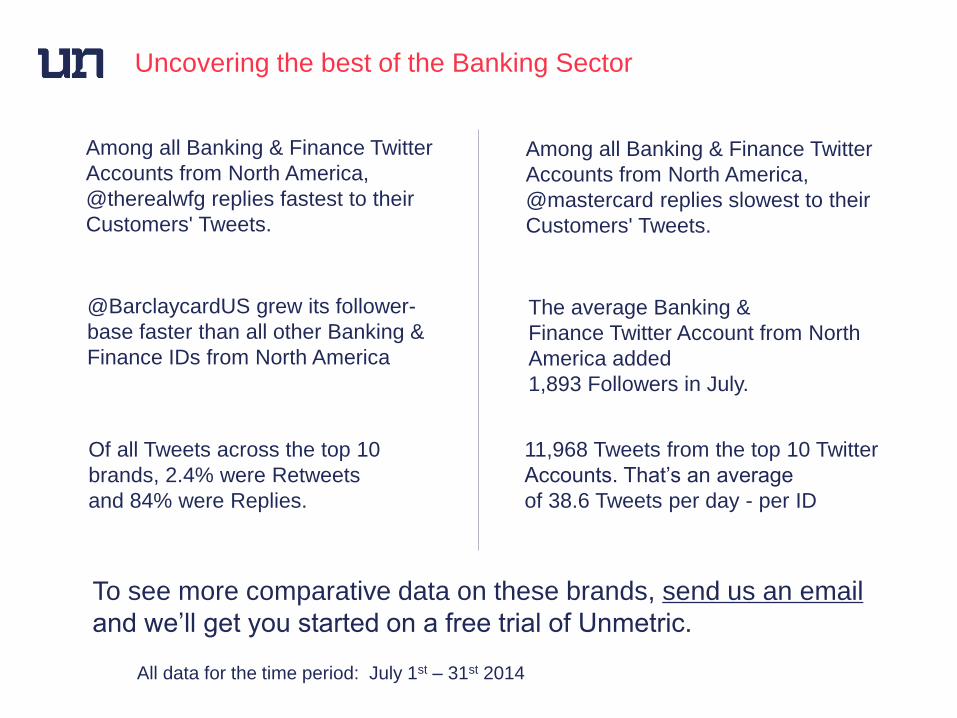
Uncovering the best of the Banking Sector
Among all Banking & Finance Twitter
Accounts from North America,
@therealwfg replies fastest to their
Customers' Tweets.
Among all Banking & Finance Twitter
Accounts from North America,
@mastercard replies slowest to their
Customers' Tweets.
@BarclaycardUS grew its follower-
base faster than all other Banking &
Finance IDs from North America
The average Banking &
Finance Twitter Account from North
America added
1,893 Followers in July.
Of all Tweets across the top 10
brands, 2.4% were Retweets
and 84% were Replies.
11,968 Tweets from the top 10 Twitter
Accounts. That’s an average
of 38.6 Tweets per day - per ID
To see more comparative data on these brands, send us an email
and we’ll get you started on a free trial of Unmetric.

All data for the time period: July 1st – 31st 2014
Uncovering the best of the Restaurant Sector
Among all Restaurant & Cafe Twitter
IDs from North America,
@DominosJamaica replies fastest to
their customers' Tweets.
Among all Restaurant &
Cafe Twitter
IDs from North America,
@SeattlesBestreplies slowest to
their customers' Tweets.
@awrestaurants grew its follower-
base faster than all other Restaurant
& Cafe IDs from North America.
The average Restaurant & Cafe Twitter
ID from North America added 2,447
followers in July.
On an average, the top 10 brands
take 412 minutes to Reply to
Customer Tweets.
23,300 Tweets from the top 10 Twitter
Accounts. That’s an average
of 75.2 Tweets per day - per ID
To see more comparative data on these brands, send us an email
and we’ll get you started on a free trial of Unmetric.

Understanding Selected Top Brands

TD BANK – Customer Service
TD Bank was mindful of its customers’ needs and replied to mentions in an average of
an hour and 15 minutes. The brand also replied to a lager part of mentions than the
average brand from the sector.

The Cheesecake Factory - Hashtag
The Cheesecake factory halved the prices of its slices on National Cheese cake day. Their
38 tweets with the hashtag #NationalCheesecakeDay got them over 14,000 mentions in
return.

All data for the time period: July 1st – 31st 2014
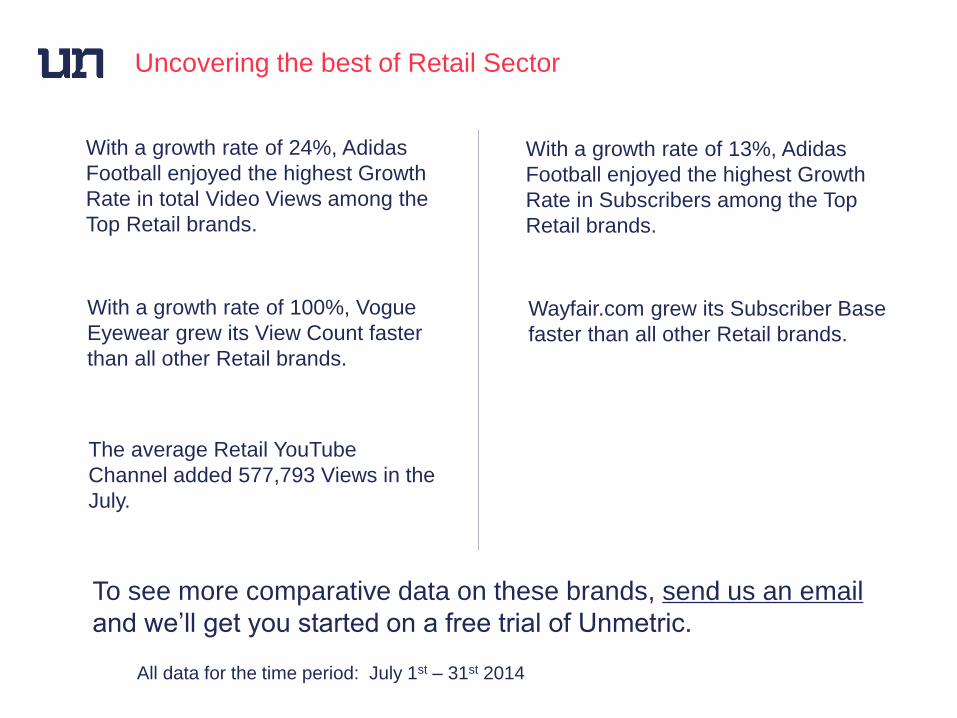
Uncovering the best of Retail Sector
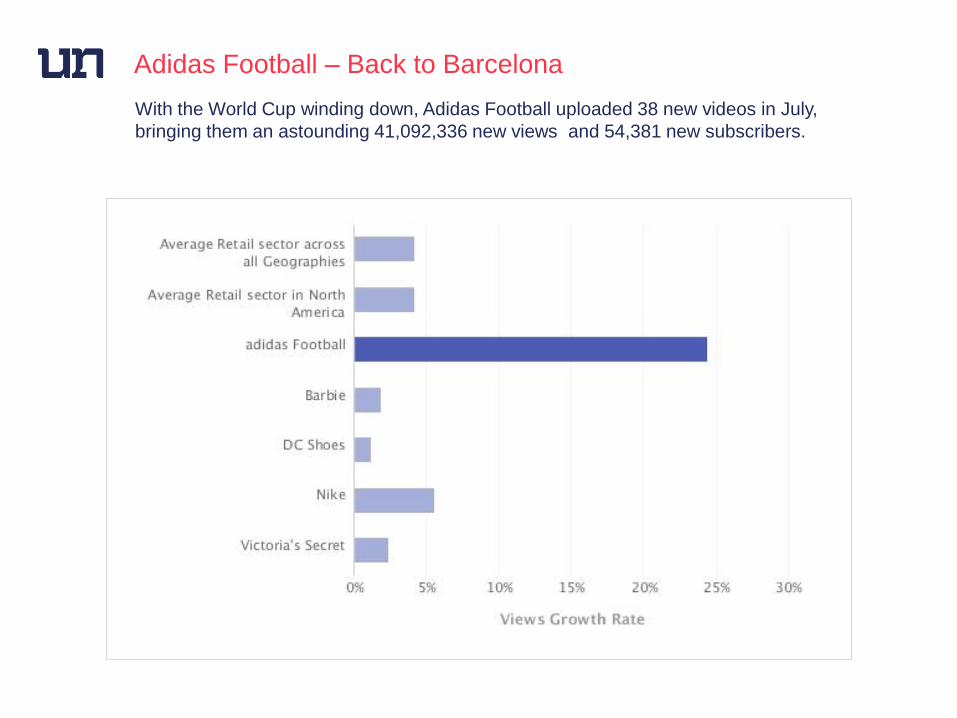
With a growth rate of 24%, Adidas
Football enjoyed the highest Growth
Rate in total Video Views among the
Top Retail brands.
With a growth rate of 13%, Adidas
Football enjoyed the highest Growth
Rate in Subscribers among the Top
Retail brands.
With a growth rate of 100%, Vogue
Eyewear grew its View Count faster
than all other Retail brands.
Wayfair.com grew its Subscriber Base
faster than all other Retail brands.
The average Retail YouTube
Channel added 577,793 Views in the
July.
To see more comparative data on these brands, send us an email
and we’ll get you started on a free trial of Unmetric.

All data for the time period: July 1st – 31st 2014
Uncovering the best of Automotive Sector
With a growth rate of 7%, Honda
enjoyed the highest Growth Rate in
total Video Views among the Top
brands in the sector.
With a growth rate of 3.2%, Jaguar
USA enjoyed the highest Growth
Rate in Subscribers.
The average Automotive YouTube
Channel added 483 subscribers. The average Automotive YouTube
channel added 234,512 views in the
last month.
The average length of a video of
Automotive YouTube Channels was
2mins, 19secs
To see more comparative data on these brands, send us an email
and we’ll get you started on a free trial of Unmetric.
Understanding Selected Top Brands
1
2
1
2
With the World Cup winding down, Adidas Football uploaded 38 new videos in July,
bringing them an astounding 41,092,336 new views and 54,381 new subscribers.
Adidas Football – Back to Barcelona

1
2
1
2
Of the four new videos uploaded in June, the most popular video was the “A Villain
Never Rests – Part 5”, continuing their successful #GoodToBeBad campaign.
Jaguar USA – A Villain Never Rests
The automobile
brand had a
growth rate of
3.2%, which
was higher than
the sector
average of
2.6%.
All data for the time period: July 1st – 31st 2014
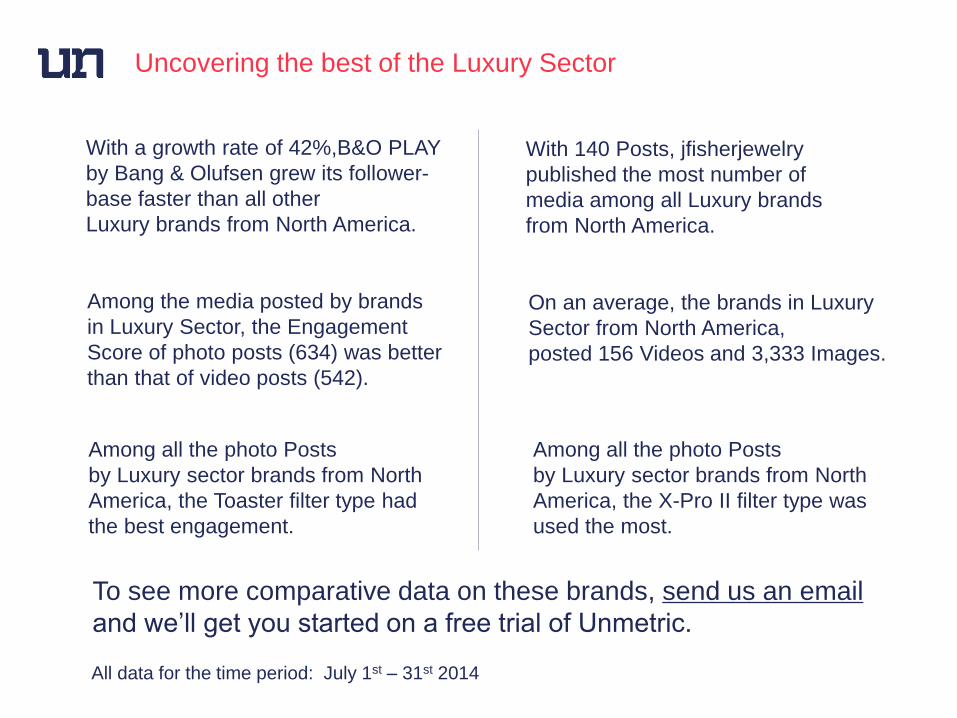
Uncovering the best of the Luxury Sector
With a growth rate of 42%,B&O PLAY
by Bang & Olufsen grew its follower-
base faster than all other
Luxury brands from North America.
With 140 Posts, jfisherjewelry
published the most number of
media among all Luxury brands
from North America.
Among the media posted by brands
in Luxury Sector, the Engagement
Score of photo posts (634) was better
than that of video posts (542).
On an average, the brands in Luxury
Sector from North America,
posted 156 Videos and 3,333 Images.
Among all the photo Posts
by Luxury sector brands from North
America, the Toaster filter type had
the best engagement.
Among all the photo Posts
by Luxury sector brands from North
America, the X-Pro II filter type was
used the most.
To see more comparative data on these brands, send us an email
and we’ll get you started on a free trial of Unmetric.

All data for the time period: July 1st – 31st 2014
Uncovering the best of the F&B Sector
With a growth rate of 140%,Skinny
Cow grew its follower-base faster
than all other Food/Beverage brands
from North America.
With 439 posts, Nudges Dog
Treats published the most number
of media among
all Food/Beverage brands from
North America.
Among the media posted by brands
in Food/Beverage Sector, the
engagement score of photo posts
(771) was better than that of video
posts (682).
On an average, the brands
in Food/Beverage Sector from North
America, posted 136 videos
and 3,076images.
Among all the photo posts
by Food/Beverage sector brands
from North America,
the Brannan filter type had the best
engagement.
Among all the photo posts
by Food/Beverage sector brands
from North America,
the Valencia filter type was used the
most.
To see more comparative data on these brands, send us an email
and we’ll get you started on a free trial of Unmetric.

Understanding Selected Top Brands

1
2
1
2
This content piece from Tory Burch that showcases its pre-fall collection received
the highest engagement in the month. The Luxury brand posted 26 content pieces
in the month and received an engagement score* of 748 on this post while it
received an average score of 600 on the rest.
Tory Burch - Content
*Please see the Appendix to this report for a complete
explanation of the Engagement Score.

1
2
1
2
Photos performed better than videos for M&M’s. The Food and Beverage brand
was mindful of this and posted more photos than videos.
M&M’s – Content Strategy

All data for the time period: July 1st – 31st 2014
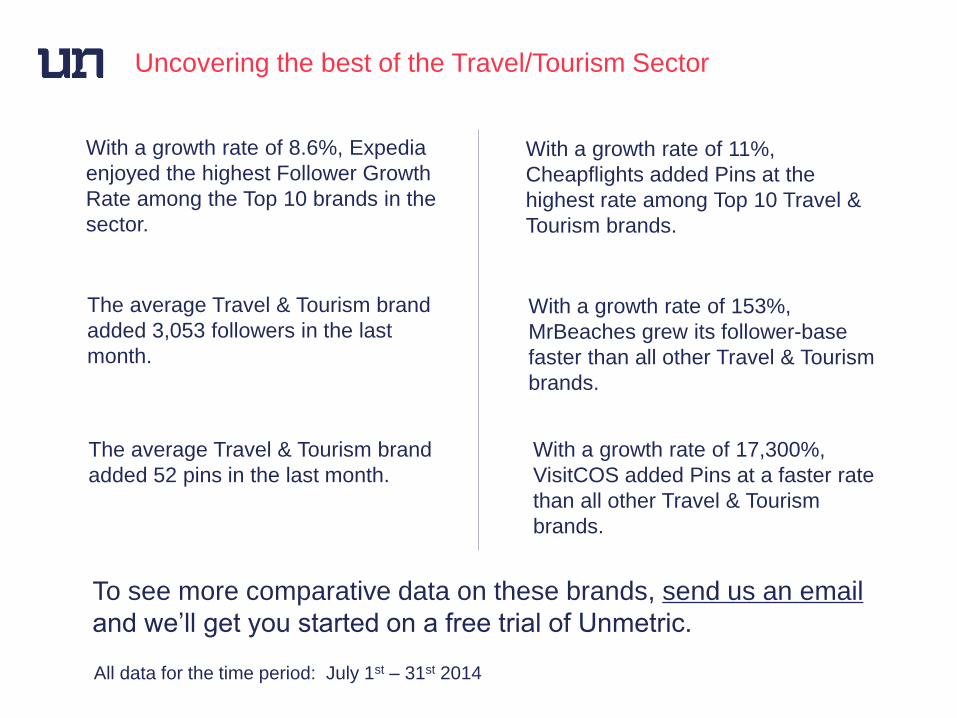
Uncovering the best of the Travel/Tourism Sector
With a growth rate of 8.6%, Expedia
enjoyed the highest Follower Growth
Rate among the Top 10 brands in the
sector.
With a growth rate of 11%,
Cheapflights added Pins at the
highest rate among Top 10 Travel &
Tourism brands.
The average Travel & Tourism brand
added 3,053 followers in the last
month.
With a growth rate of 153%,
MrBeaches grew its follower-base
faster than all other Travel & Tourism
brands.
The average Travel & Tourism brand
added 52 pins in the last month.
With a growth rate of 17,300%,
VisitCOS added Pins at a faster rate
than all other Travel & Tourism
brands.
To see more comparative data on these brands, send us an email
and we’ll get you started on a free trial of Unmetric.

All data for the time period: July 1st – 31st 2014
Uncovering the best of Retail Chain Sector
With a growth rate of 70%, Staples
grew its follower-base faster than all
other Retail Chains brands.
With a growth rate of 154%, Target
has added Pins at a faster rate than
all other Retail Chains brands.
The average Retail Chain brand
added 783 followers in July. The average Retail Chains brand
added 160 pins in July.
The average Retail Chains brand
added 783 followers in the last
month.
With a growth rate of 7.7%, Home
Goods added Pins at the highest rate
among the Top brands in the sector.
To see more comparative data on these brands, send us an email
and we’ll get you started on a free trial of Unmetric.

Understanding Selected Top Brands

1
2
1
2
The online travel agency is a member of multiple groups, ensuring regular activity
across its profile. Amongst its owned boards, the temporary “Promoted Pins” board
accounted for the most Repins (2,987) for the brand in July.
Expedia
In July, Expedia saw a Repins Growth Rate of 84%, on its Owned
Boards, which was 12x the sector average of 6.5%.
*Owned boards are boards where only the brand has permission to upload
pins

1
2
1
2
The two most popular boards for the brand – “Yoga Inspiration” and “Women’s
Workout Essentials” target the ‘ideal Pinterest user’ , and received higher Growth
Rate of subscribers (3.5%), than the sector average - (1.1%).
Sports Authority
On its owned Boards, Sports Authority had a higher Repins Growth
Rate (7.3%) than the sector average (6.0%)
*Owned boards are boards where only the brand has permission to upload
pins

Appendix

The Unmetric Score has two components - the Audience Strength and
the Engagement Score. The Audience strength represents the size
(share of market, presence) of the brand within the social network, and
the Engagement score represents the brand’s engagement with
customers (interaction, velocity). These components are built from a
number of underlying metrics including (but not limited to) Total Fans,
People Talking About, Engagement of brand, Sentiment of posts,
Number of Admin Posts, Fan Growth rate for Facebook. These metrics
are run through a number of statistical filters (normalizing across the
sector, normalizing variances between metrics, outlier filtering, weighted
averaging etc) to produce a single benchmarkable score.
The number is normalized to give brands a score between 0 and 100.
Hypothetically, the best performing brand within the sector is assigned
a score of 100. All other brands within the sector are scored relative to
this. The scores are unique to each sector and cannot be compared. A
Score Of 80 in the Aviation industry is different from a score of 80 in the
Banking industry.
Unmetric Score

Formula Facebook Engagement Score Formula ( No. of Likes + x × No. of Comments + y × No. of Shares ) × 10000 ____________________________________________________________ Audience Reception Rate Twitter Engagement Score Formula ( No. of Favorites + x × No. of Replies + y × No. of Retweets ) × 10000 ____________________________________________________________ Audience Reception Rate LinkedIn Engagement Score Formula ( No. of Likes + x × No. of Comments ) × 10000 ____________________________________________________________ Audience Reception Rate
Engagement is the measure of audience responses to a brand's content and
activity on a social network.
To calculate the engagement score, we weigh audience interactions on brand
content such as Likes, Comments, Shares or Favorites, Replies and Retweets
based on their importance. We then divide their weighted sum by our estimate of
the number of brand fans and followers who actively receive and view such
content.
The default Unmetric values for x and y are 5 and 10 respectively.
Engagement Score

Audience Reception Rate = (Fans or Followers) 0.8
Audience Reception Rate
The Audience Reception Rate (ARR) is the Unmetric estimate of the
number of brand fans/followers who stand to actively receive and view a
brand's content.. The formula you see below calculates the Audience
Reception Rate as a function of the number of brand fans/followers
raised to a fixed power value of 0.8.

Thank You
Please contact us at [email protected] for more information
Click here if you’d like to use Unmetric to better understand what
your competitors are doing, uncover compelling insights and
unlock new strategies for success by claiming a free 6 day trial.