Embed Size (px)
Citation preview
For info about the proprietary technology used in comScore products, refer to http://comscore.com/About_comScore/Patents
Relevancia y Alcance Medir lo que importa en Social Media
• Marcos Christensen • Director, Latam South Cone • [email protected]
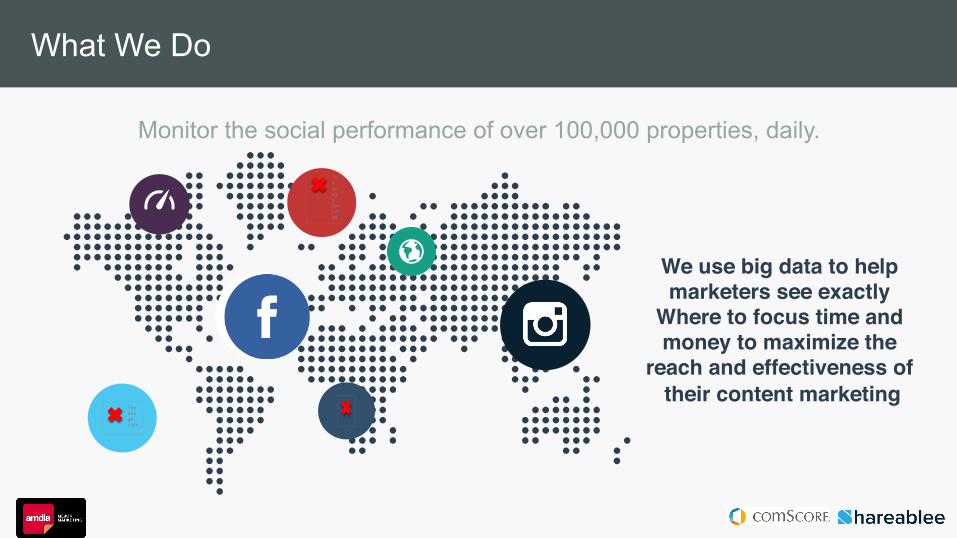
What We Do
Monitor the social performance of over 100,000 properties, daily.
We use big data to help marketers see exactly
Where to focus time and money to maximize the
reach and effectiveness of their content marketing
The image cannot be
The image cann
…......................................................................................
..........................................................................................
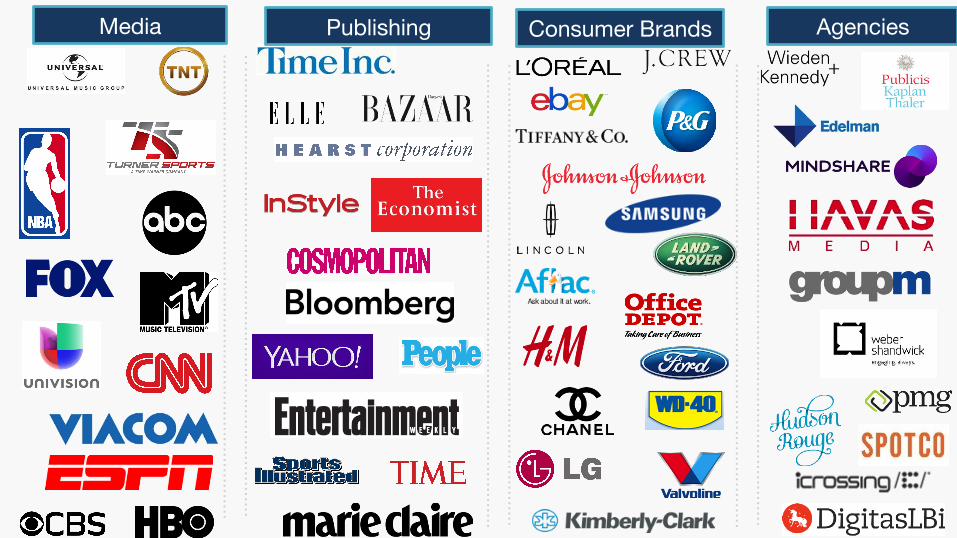
Publishing Consumer Brands Media Agencies
…......................................................................................
..........................................................................................
…......................................................................................
..........................................................................................
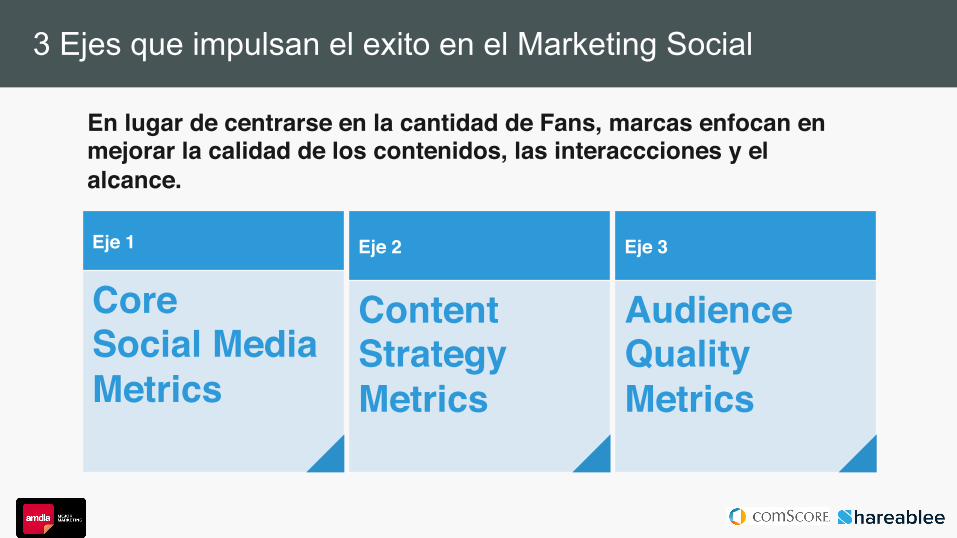
3 Ejes que impulsan el exito en el Marketing Social
Eje 1
Core Social MediaMetrics
Eje 2
ContentStrategyMetrics
Eje 3
AudienceQualityMetrics
En lugar de centrarse en la cantidad de Fans, marcas enfocan en mejorar la calidad de los contenidos, las interaccciones y el alcance.

Eje 1:
Core Social Media Metrics
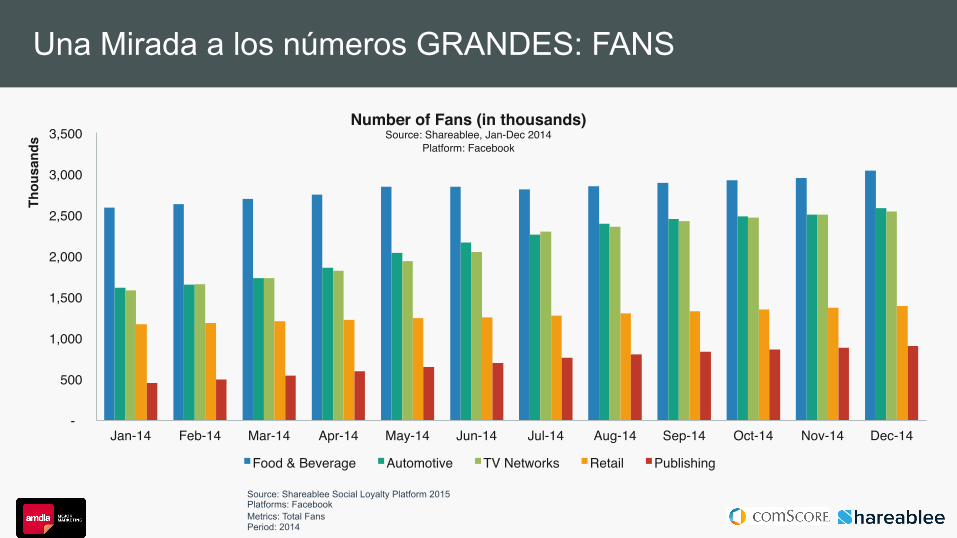
Una Mirada a los números GRANDES: FANS
-
500
1,000
1,500
2,000
2,500
3,000
3,500
Jan-14 Feb-14 Mar-14 Apr-14 May-14 Jun-14 Jul-14 Aug-14 Sep-14 Oct-14 Nov-14 Dec-14
Thou
sand
s
Number of Fans (in thousands)Source: Shareablee, Jan-Dec 2014
Platform: Facebook
Food & Beverage Automotive TV Networks Retail Publishing
Source: Shareablee Social Loyalty Platform 2015 Platforms: Facebook Metrics: Total Fans Period: 2014
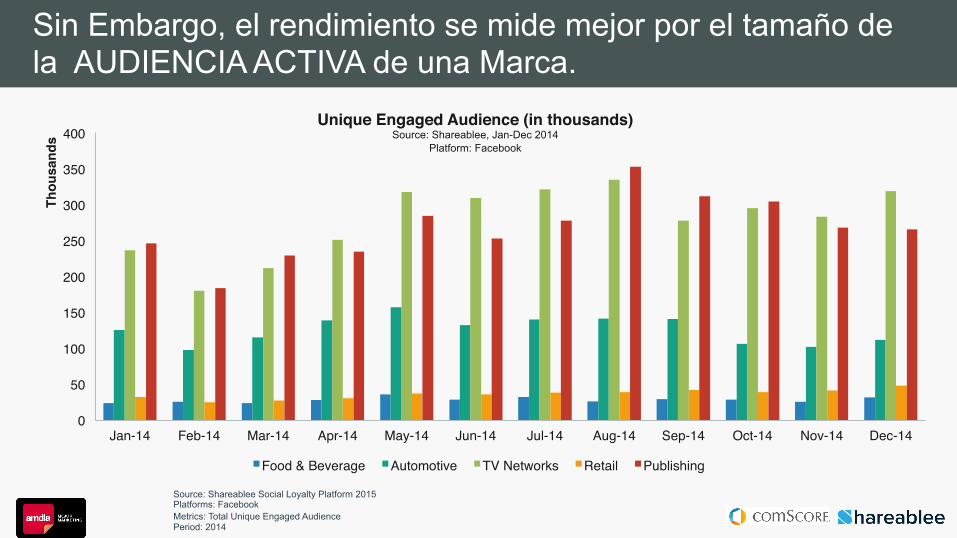
Sin Embargo, el rendimiento se mide mejor por el tamaño de la AUDIENCIA ACTIVA de una Marca.
0
50
100
150
200
250
300
350
400
Jan-14 Feb-14 Mar-14 Apr-14 May-14 Jun-14 Jul-14 Aug-14 Sep-14 Oct-14 Nov-14 Dec-14
Thou
sand
s
Unique Engaged Audience (in thousands)Source: Shareablee, Jan-Dec 2014
Platform: Facebook
Food & Beverage Automotive TV Networks Retail Publishing
Source: Shareablee Social Loyalty Platform 2015 Platforms: Facebook Metrics: Total Unique Engaged Audience Period: 2014
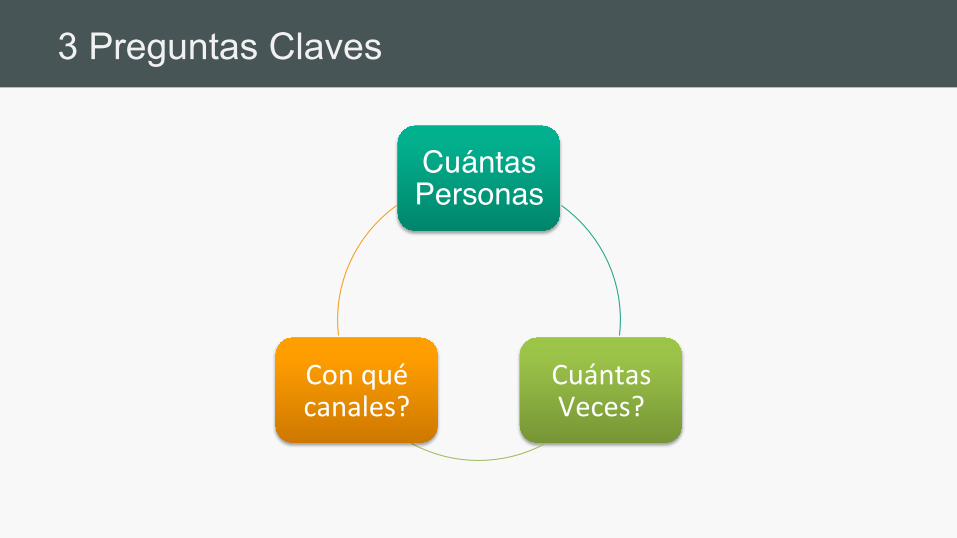
3 Preguntas Claves
Cuántas Personas
Cuántas Veces?
Con qué canales?
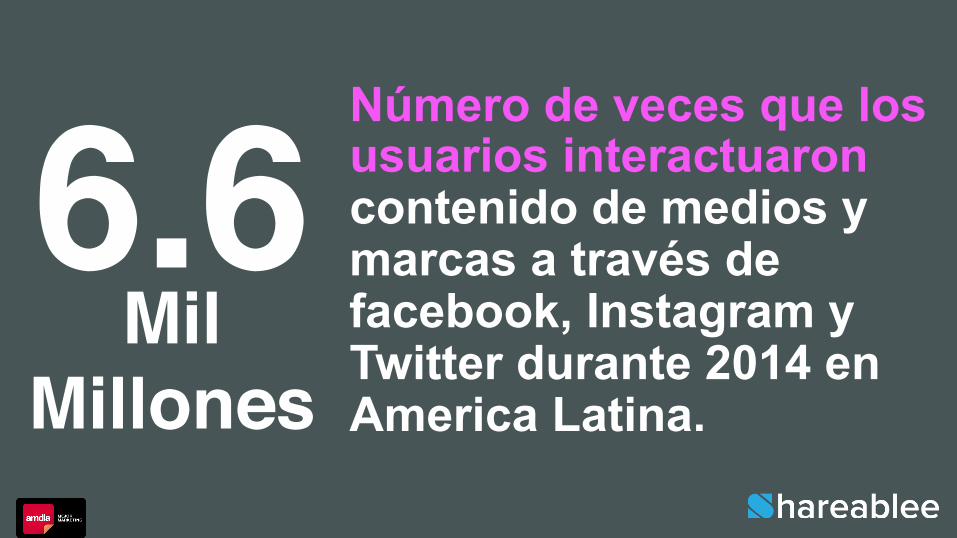
Número de veces que los usuarios interactuaron contenido de medios y marcas a través de facebook, Instagram y Twitter durante 2014 en America Latina.
6.6Mil
Millones
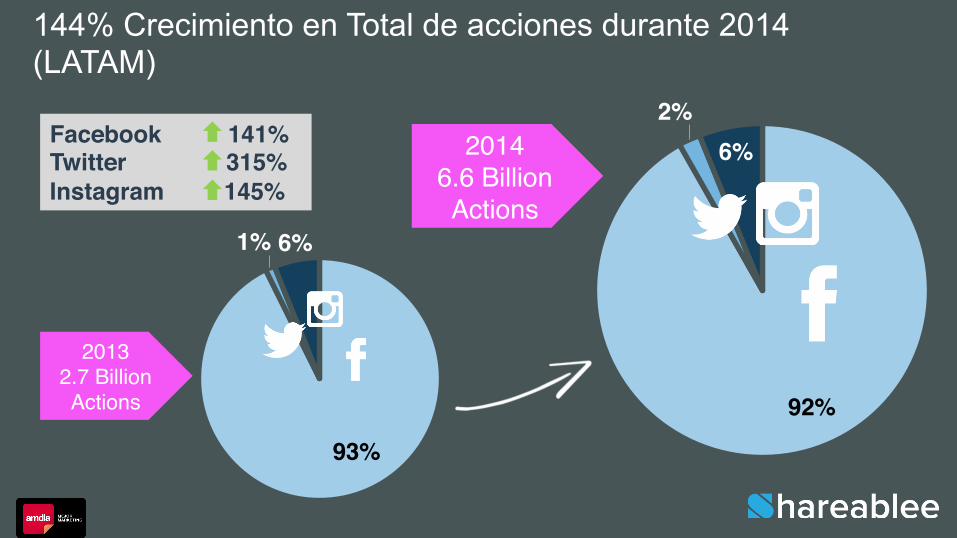
20146.6 Billion Actions
20132.7 Billion Actions 92%
2%6%
93%
1% 6%
Facebook 141%Twitter 315%Instagram 145%
144% Crecimiento en Total de acciones durante 2014 (LATAM)
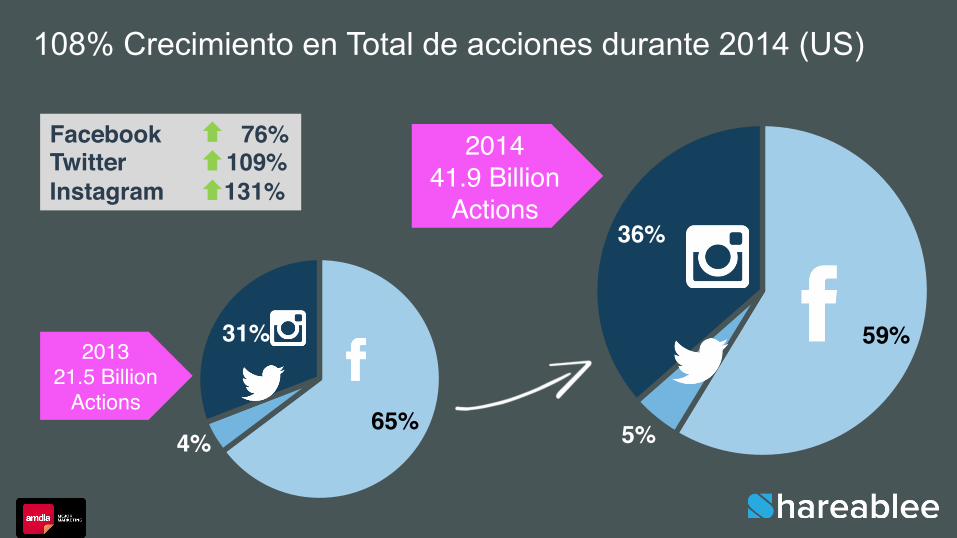
201441.9 Billion
Actions
201321.5 Billion
Actions
59%
5%
36%
65%4%
31%
Facebook 76%Twitter 109%Instagram 131%
108% Crecimiento en Total de acciones durante 2014 (US)
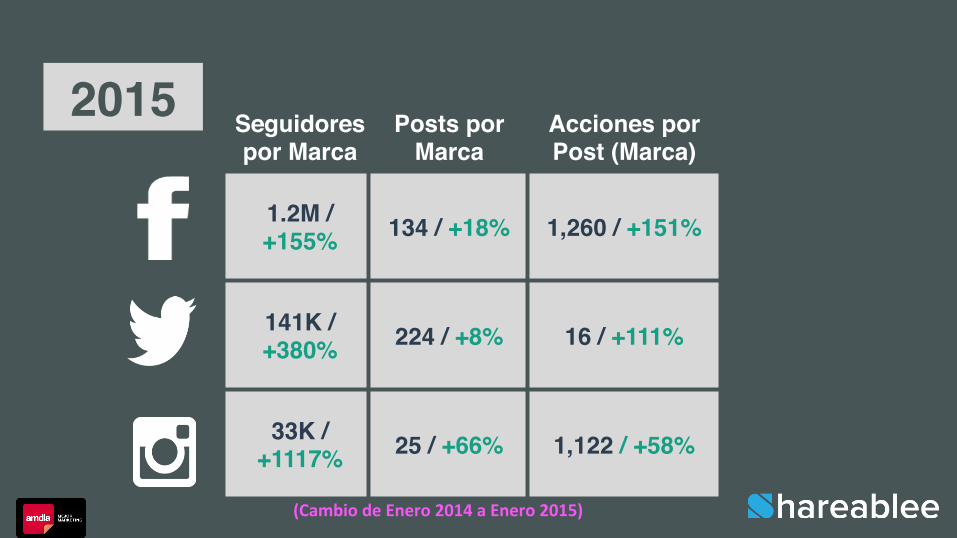
2015 Seguidores por Marca
1.2M / +155%
141K / +380%
33K / +1117%
Posts porMarca
134 / +18%
224 / +8%
25 / +66%
Acciones por Post (Marca)
1,260 / +151%
16 / +111%
1,122 / +58%
(Cambio de Enero 2014 a Enero 2015)
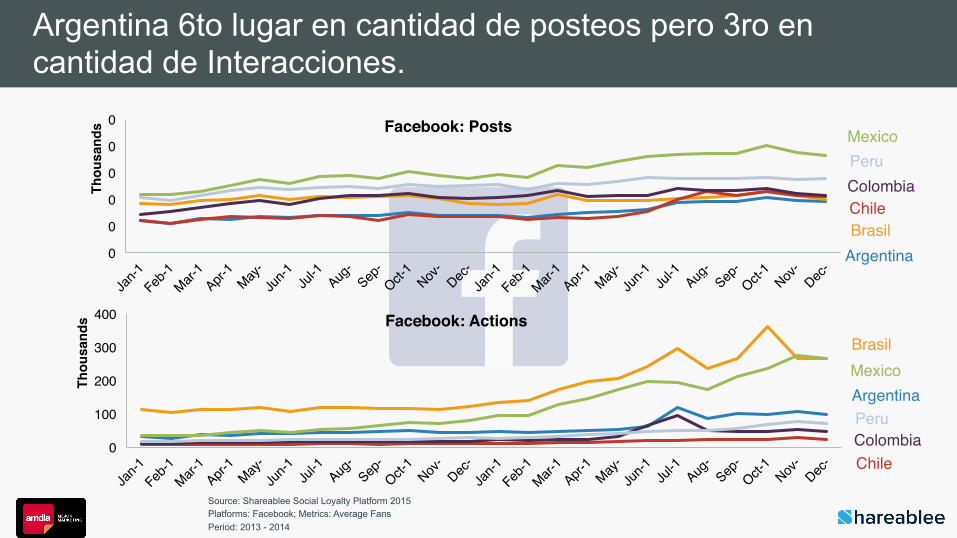
Argentina 6to lugar en cantidad de posteos pero 3ro en cantidad de Interacciones.
Source: Shareablee Social Loyalty Platform 2015 Platforms: Facebook; Metrics: Average Fans Period: 2013 - 2014
Argentina
MexicoPeruColombiaChile
0
0
0
0
0
0
Thou
sand
s Facebook: Posts
Brasil
0
100
200
300
400
Thou
sand
s Facebook: Actions
ArgentinaMexico
PeruColombiaChile
Brasil
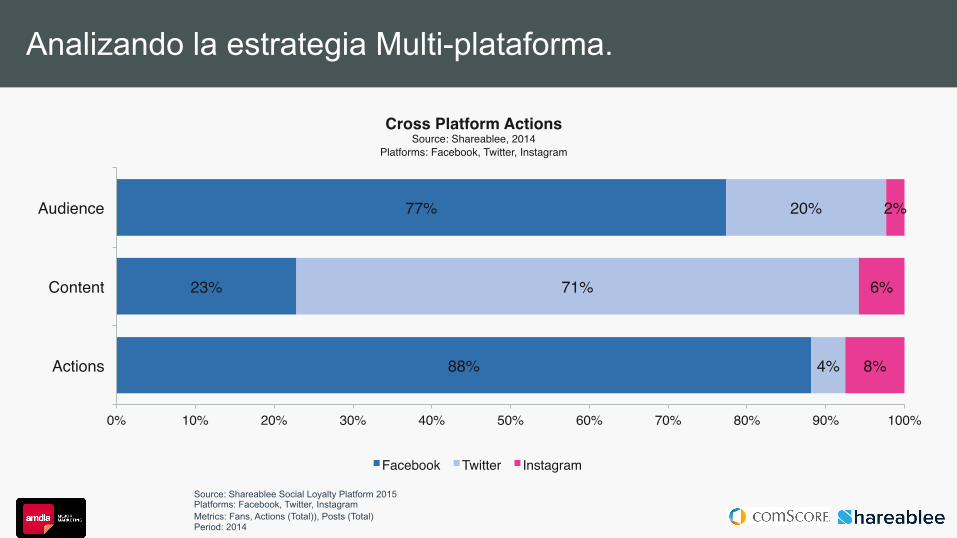
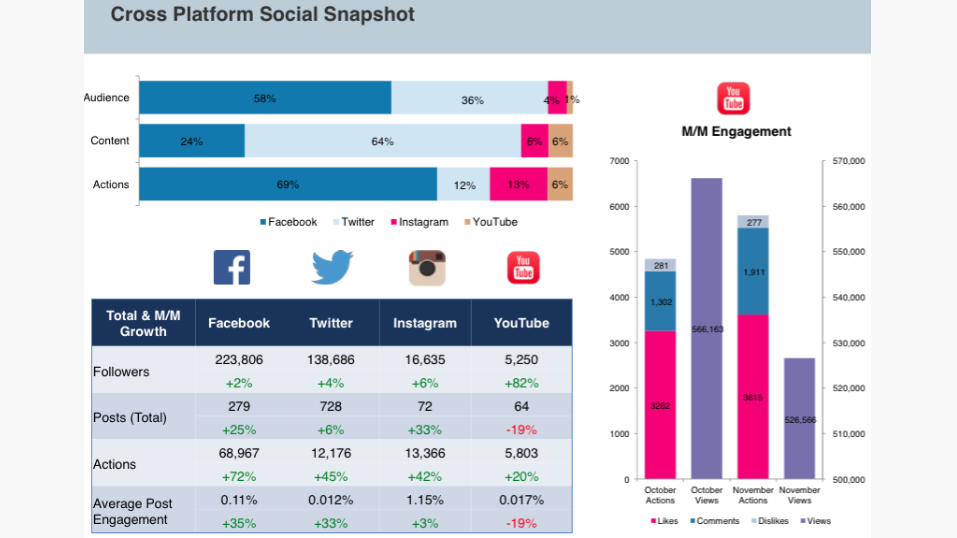
Analizando la estrategia Multi-plataforma.
Source: Shareablee Social Loyalty Platform 2015 Platforms: Facebook, Twitter, Instagram Metrics: Fans, Actions (Total)), Posts (Total) Period: 2014
88%
23%
77%
4%
71%
20%
8%
6%
2%
0% 10% 20% 30% 40% 50% 60% 70% 80% 90% 100%
Actions
Content
Audience
Cross Platform ActionsSource: Shareablee, 2014
Platforms: Facebook, Twitter, Instagram
Facebook Twitter Instagram
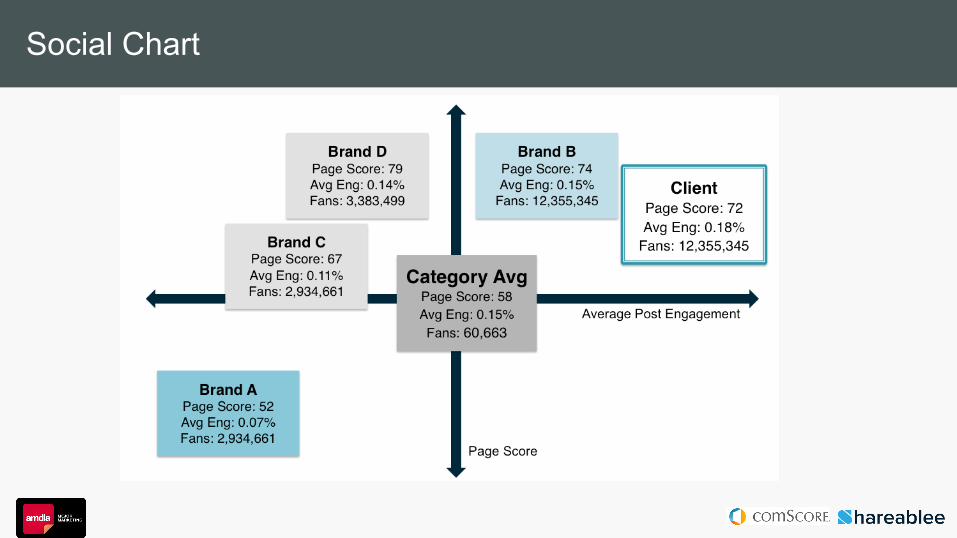
Social Chart
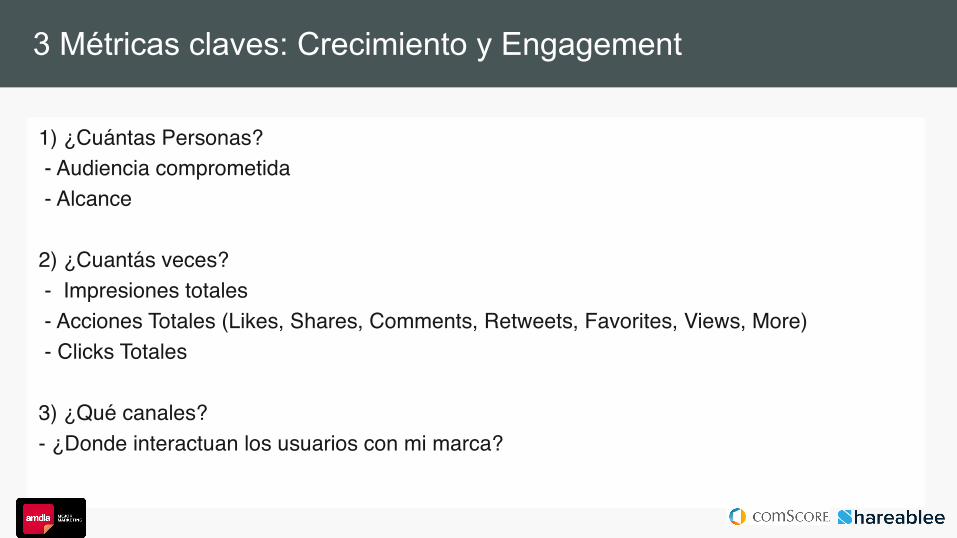
3 Métricas claves: Crecimiento y Engagement
1) ¿Cuántas Personas? - Audiencia comprometida - Alcance
2) ¿Cuantás veces? - Impresiones totales - Acciones Totales (Likes, Shares, Comments, Retweets, Favorites, Views, More) - Clicks Totales
3) ¿Qué canales?- ¿Donde interactuan los usuarios con mi marca?
Eje 2:
Content Strategy Metrics
What makes content Shareable?
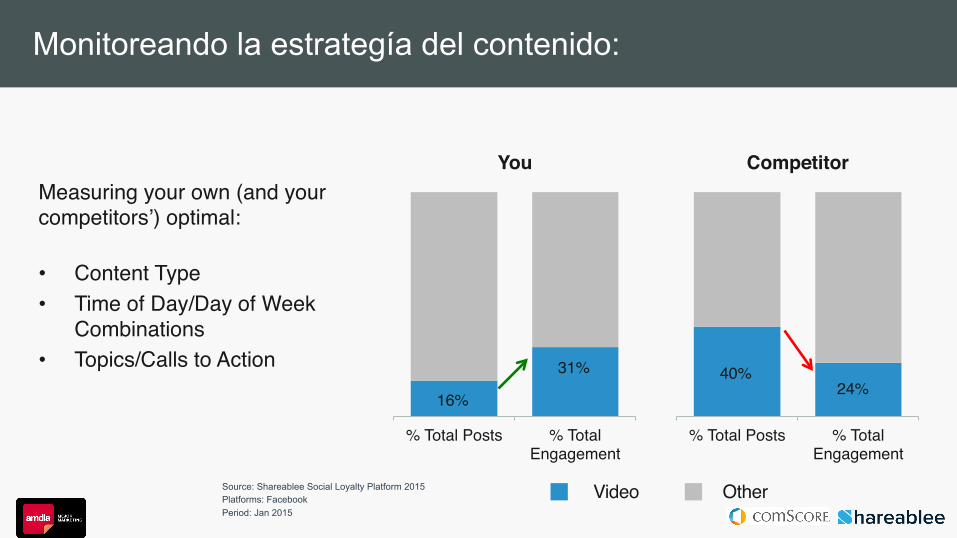
Monitoreando la estrategía del contenido:
Source: Shareablee Social Loyalty Platform 2015 Platforms: Facebook Period: Jan 2015
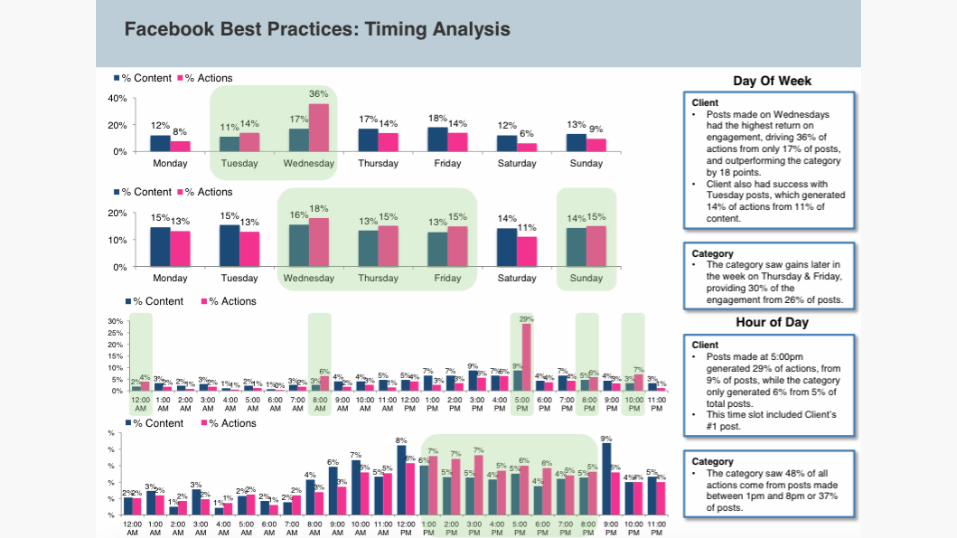
Measuring your own (and your competitors’) optimal:
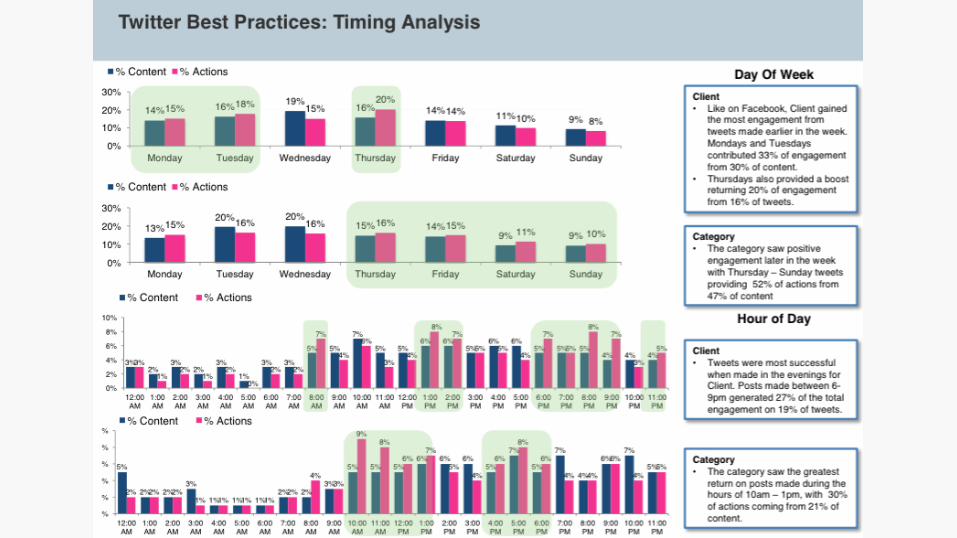
• Content Type• Time of Day/Day of Week
Combinations• Topics/Calls to Action 31%
16%
% Total Engagement
% Total Posts
You
24%40%
% Total Engagement
% Total Posts
Competitor
Video Other
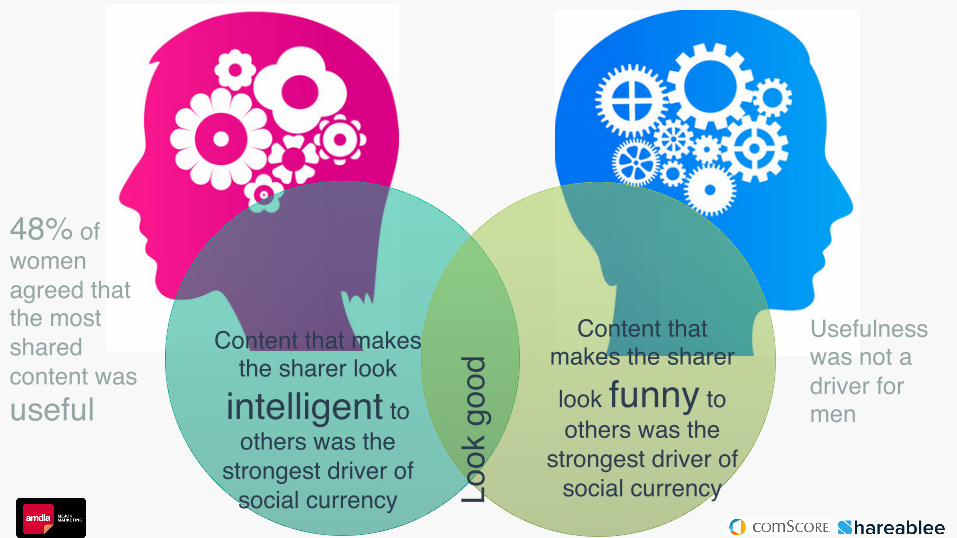
Content that makes the sharer look funny to others was the
strongest driver of social currency
Content that makes the sharer look
intelligent to others was the
strongest driver of social currency Lo
ok g
ood
48% of women agreed that the most shared content was useful
Usefulness was not a driver for men
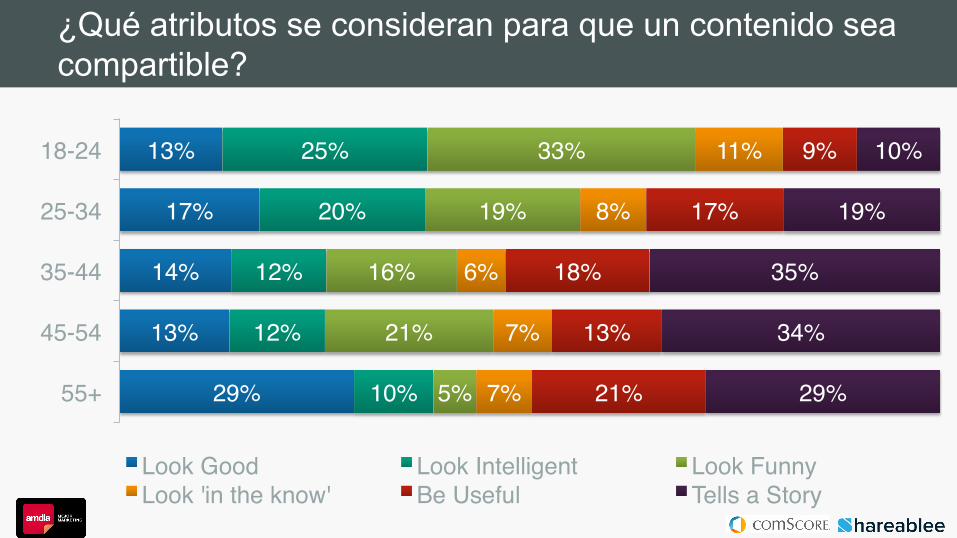
¿Qué atributos se consideran para que un contenido sea compartible?
29%
13%
14%
17%
13%
10%
12%
12%
20%
25%
5%
21%
16%
19%
33%
7%
7%
6%
8%
11%
21%
13%
18%
17%
9%
29%
34%
35%
19%
10%
55+
45-54
35-44
25-34
18-24
Look Good Look Intelligent Look FunnyLook 'in the know' Be Useful Tells a Story
22
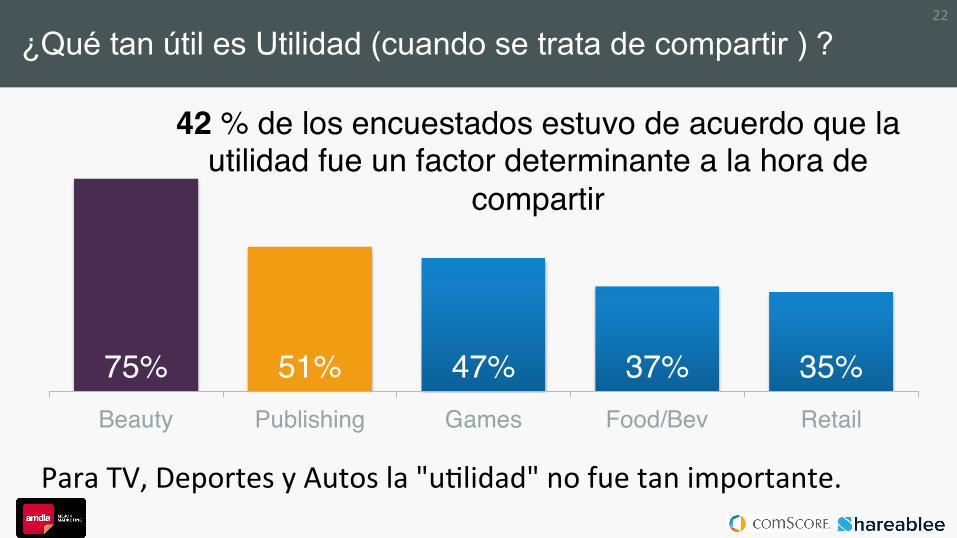
75% 51% 47% 37% 35%Beauty Publishing Games Food/Bev Retail
¿Qué tan útil es Utilidad (cuando se trata de compartir ) ?
42 % de los encuestados estuvo de acuerdo que la utilidad fue un factor determinante a la hora de
compartir
Para TV, Deportes y Autos la "u;lidad" no fue tan importante.
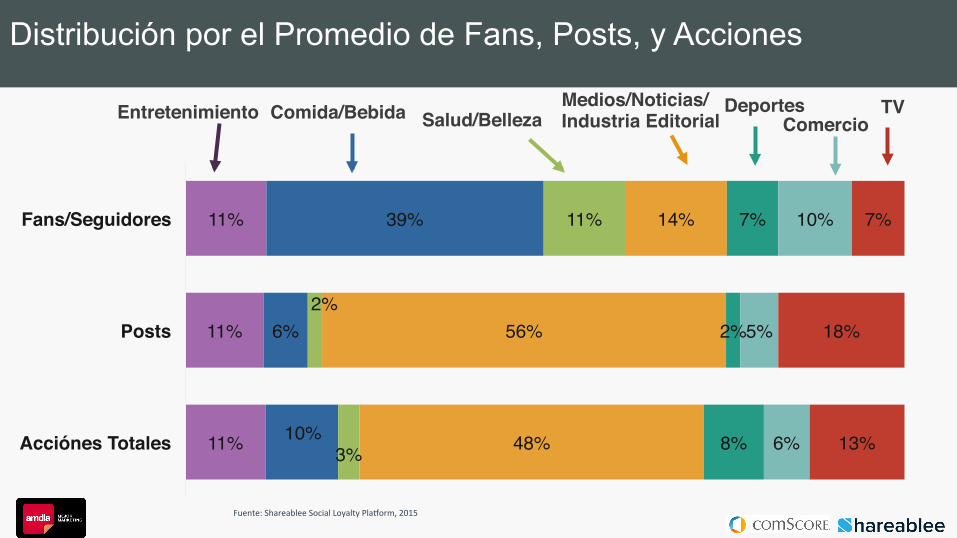
Distribución por el Promedio de Fans, Posts, y Acciones
11%
11%
11%
10%
6%
39%
3%
2%
11%
48%
56%
14%
8%
2%
7%
6%
5%
10%
13%
18%
7%
Acciónes Totales
Posts
Fans/Seguidores
Comida/Bebida DeportesSalud/Belleza TVMedios/Noticias/
Industria EditorialEntretenimiento Comercio
Fuente: Shareablee Social Loyalty PlaGorm, 2015
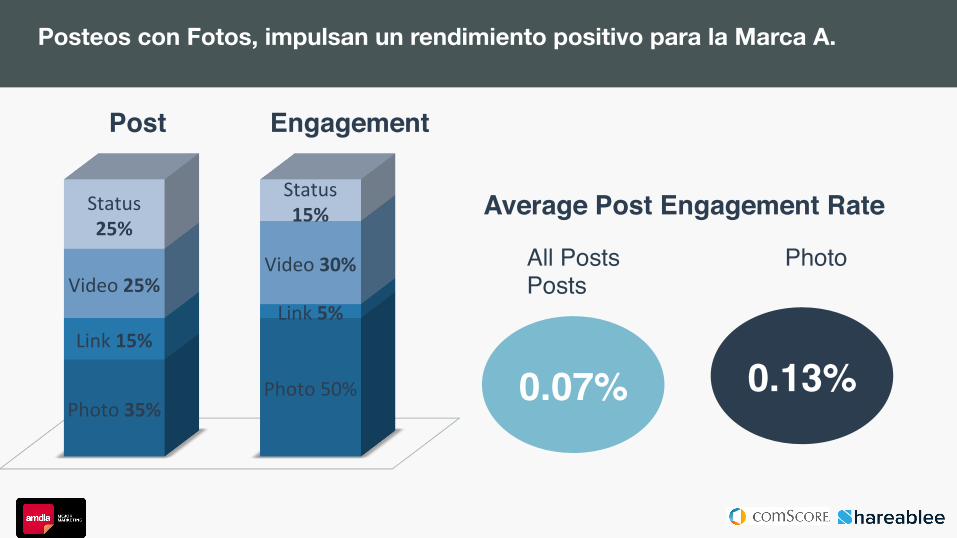
Posteos con Fotos, impulsan un rendimiento positivo para la Marca A.
Photo 35% Photo 50%
Link 15% Link 5%
Video 25% Video 30%
Status 25%
Status 15%
Post Engagement
0.07% 0.13%
All Posts Photo Posts
Average Post Engagement Rate
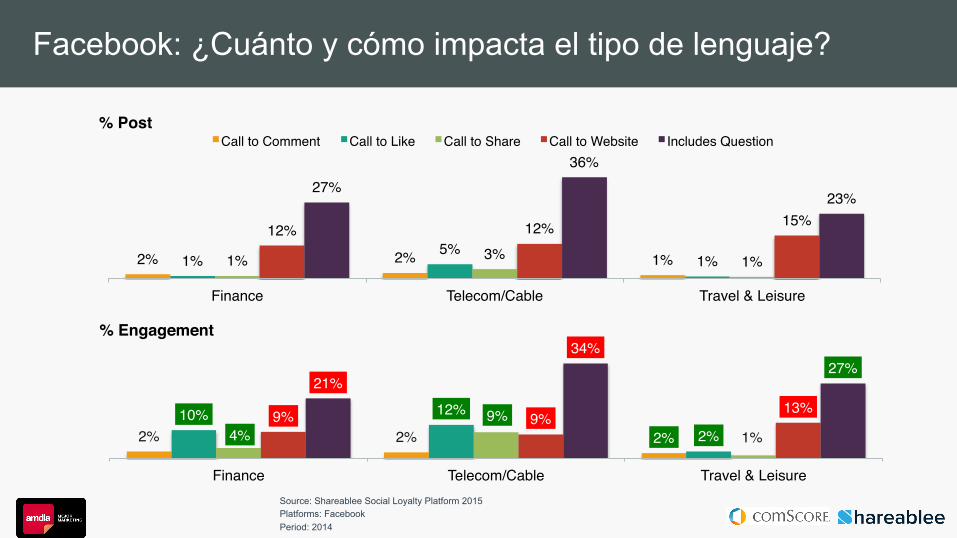
2% 2% 1%1%5%
1%1% 3% 1%
12% 12% 15%
27%36%
23%
Finance Telecom/Cable Travel & Leisure
% PostCall to Comment Call to Like Call to Share Call to Website Includes Question
2% 2% 2%10% 12%
2%4%9%
1%9% 9%
13%21%
34%27%
Finance Telecom/Cable Travel & Leisure
% Engagement
Facebook: ¿Cuánto y cómo impacta el tipo de lenguaje?
Source: Shareablee Social Loyalty Platform 2015 Platforms: Facebook Period: 2014
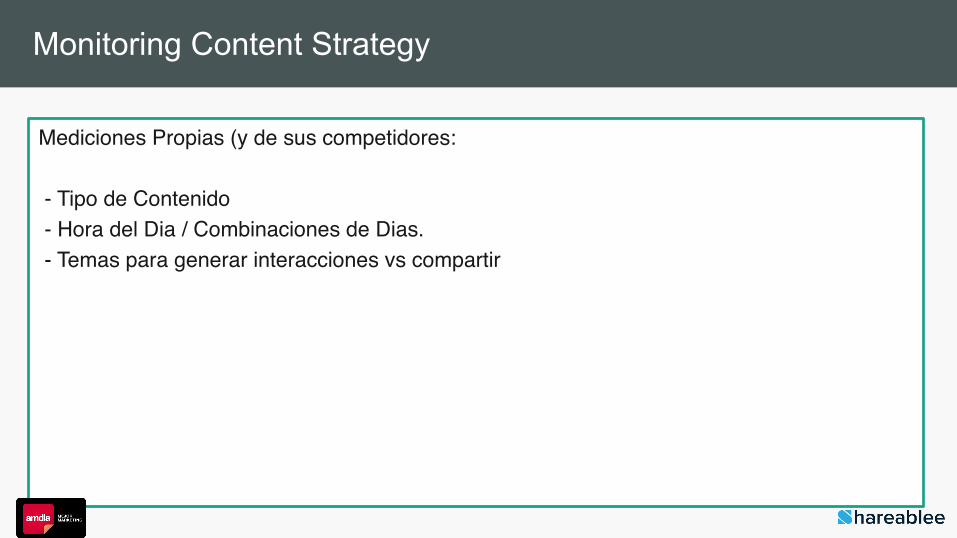
Monitoring Content Strategy
Mediciones Propias (y de sus competidores:
- Tipo de Contenido - Hora del Dia / Combinaciones de Dias. - Temas para generar interacciones vs compartir

Eje 3:
Audience Quality Metrics
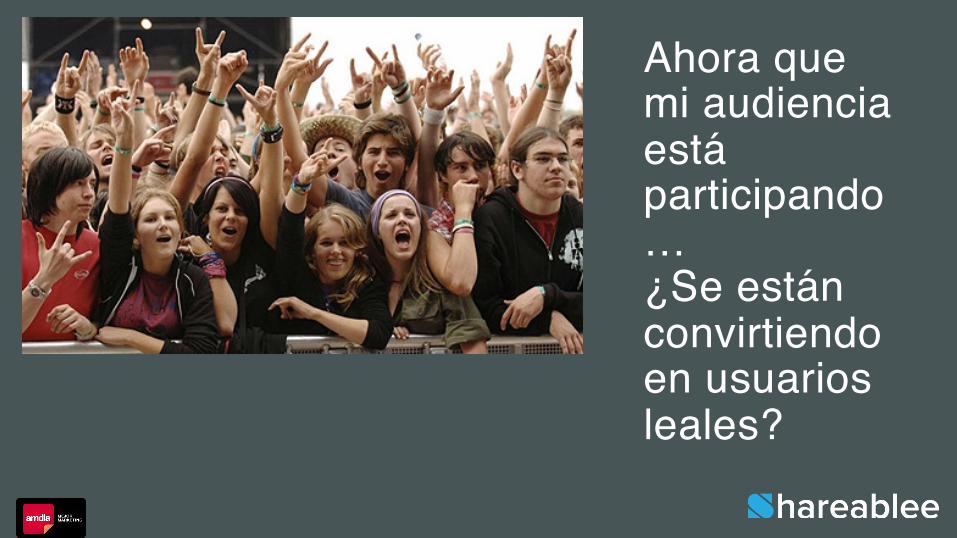
Ahora que mi audiencia está participando…¿Se están convirtiendo en usuarios leales?
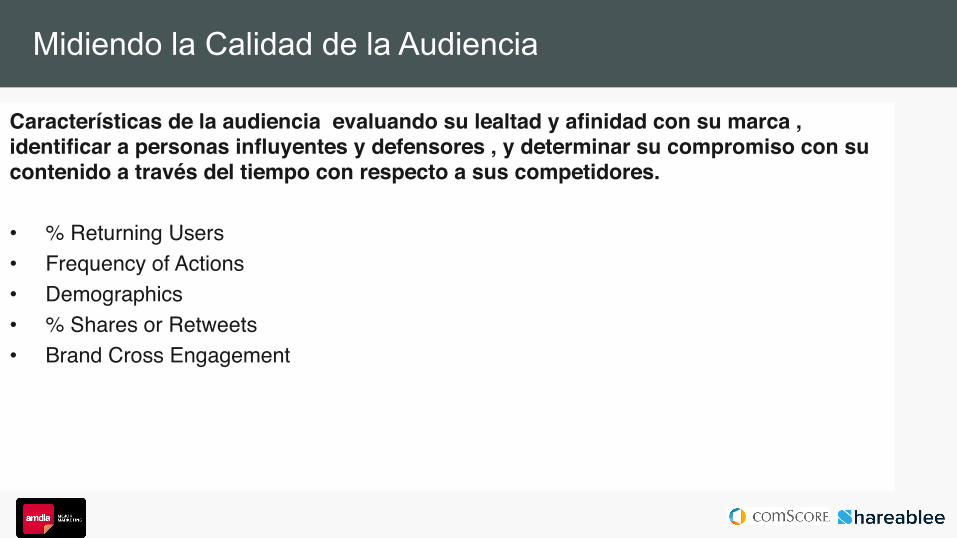
Midiendo la Calidad de la Audiencia
Características de la audiencia evaluando su lealtad y afinidad con su marca , identificar a personas influyentes y defensores , y determinar su compromiso con su contenido a través del tiempo con respecto a sus competidores.
• % Returning Users• Frequency of Actions• Demographics• % Shares or Retweets• Brand Cross Engagement
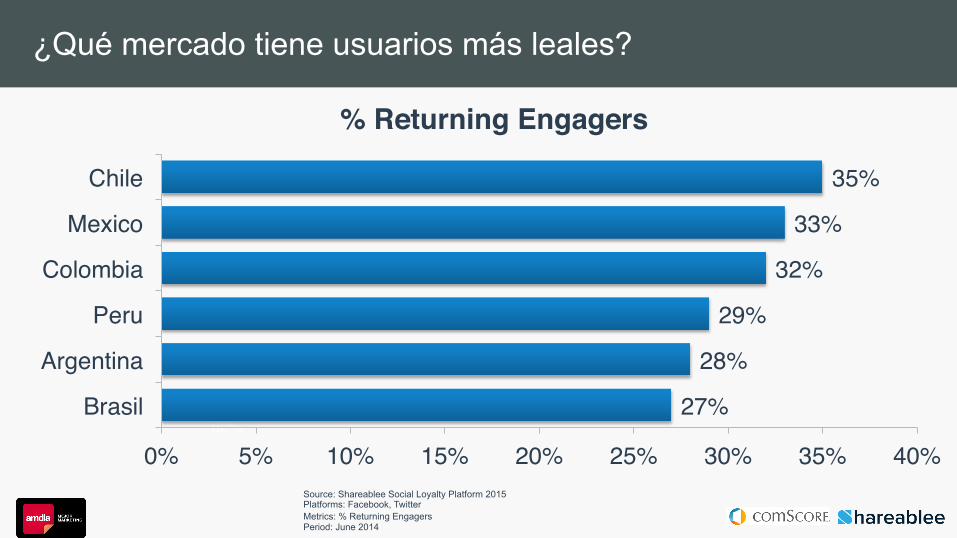
¿Qué mercado tiene usuarios más leales?
62%
Source: Shareablee Social Loyalty Platform 2015 Platforms: Facebook, Twitter Metrics: % Returning Engagers Period: June 2014
27%
28%
29%
32%
33%
35%
0% 5% 10% 15% 20% 25% 30% 35% 40%
Brasil
Argentina
Peru
Colombia
Mexico
Chile
% Returning Engagers
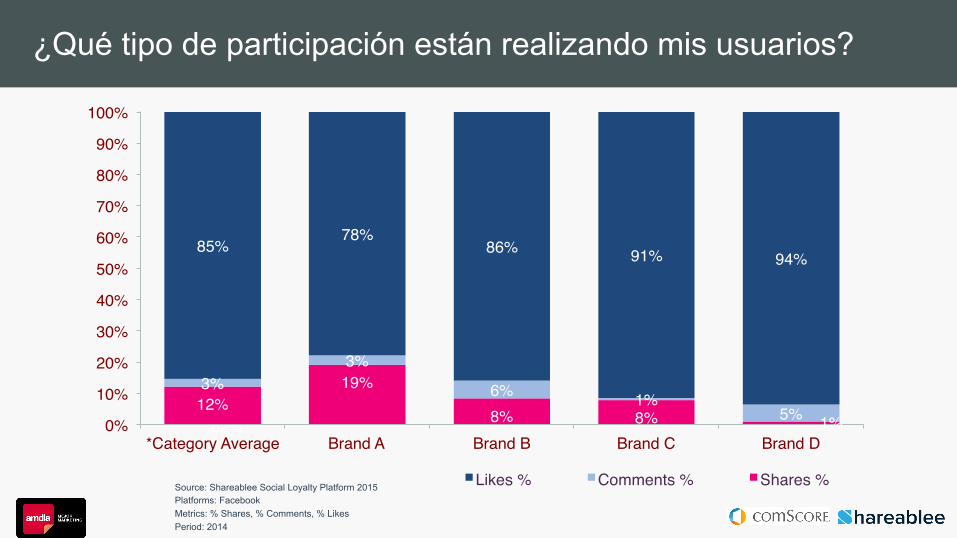
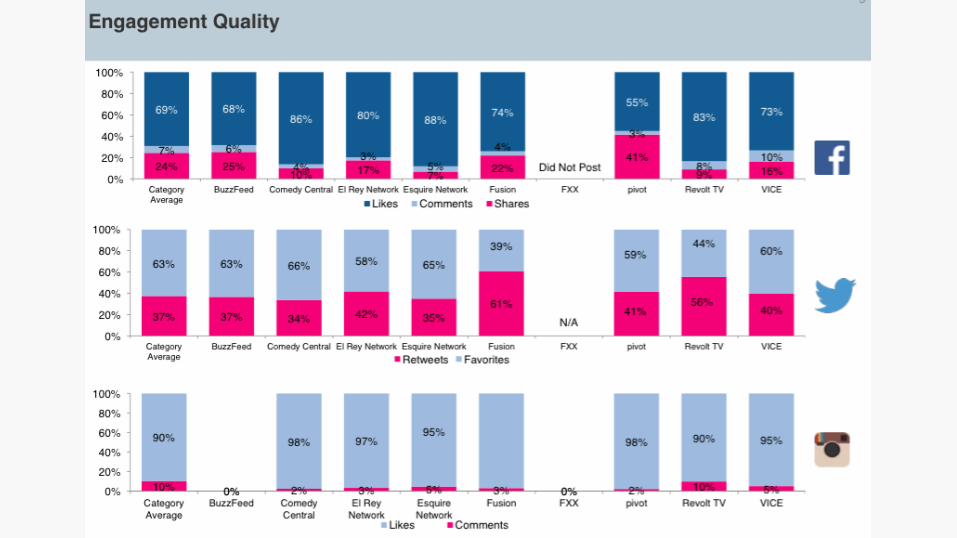
¿Qué tipo de participación están realizando mis usuarios?
62%
Source: Shareablee Social Loyalty Platform 2015 Platforms: Facebook Metrics: % Shares, % Comments, % Likes Period: 2014
12%19%
8% 8% 1%
3%3%
6% 1%5%
85%78%
86% 91% 94%
0%
10%
20%
30%
40%
50%
60%
70%
80%
90%
100%
*Category Average Brand A Brand B Brand C Brand D
Likes % Comments % Shares %
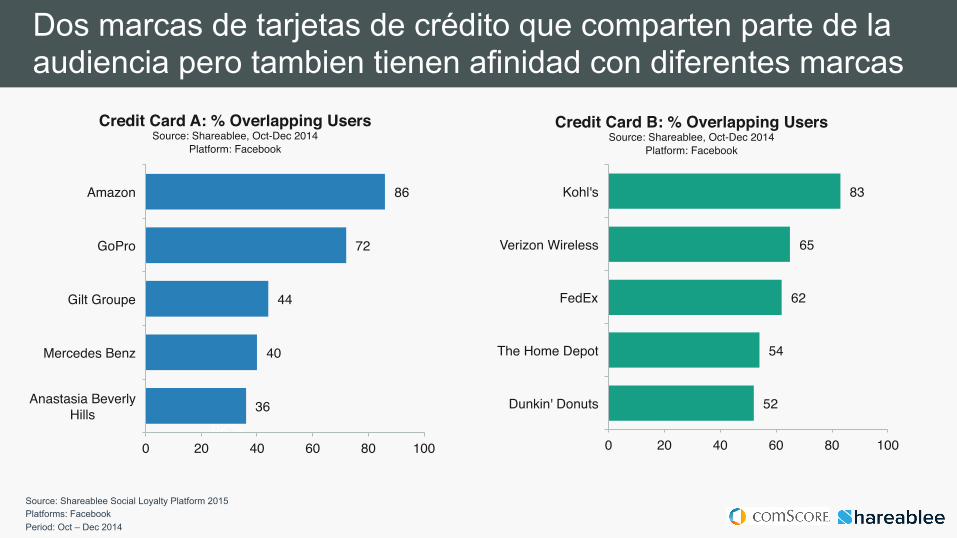
Dos marcas de tarjetas de crédito que comparten parte de la audiencia pero tambien tienen afinidad con diferentes marcas
62%36
40
44
72
86
0 20 40 60 80 100
Anastasia Beverly Hills
Mercedes Benz
Gilt Groupe
GoPro
Amazon
Credit Card A: % Overlapping UsersSource: Shareablee, Oct-Dec 2014
Platform: Facebook
52
54
62
65
83
0 20 40 60 80 100
Dunkin' Donuts
The Home Depot
FedEx
Verizon Wireless
Kohl's
Credit Card B: % Overlapping UsersSource: Shareablee, Oct-Dec 2014
Platform: Facebook
Source: Shareablee Social Loyalty Platform 2015 Platforms: Facebook Period: Oct – Dec 2014
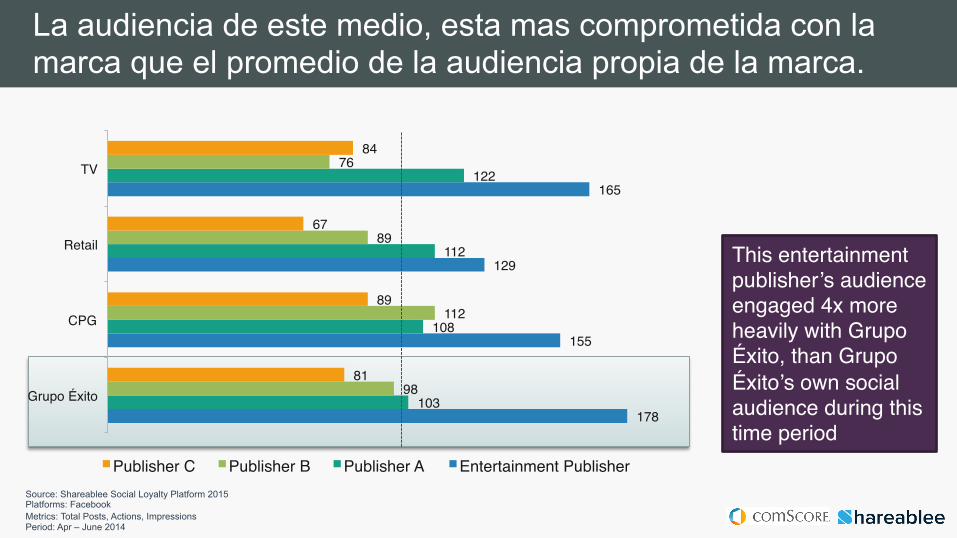
178
155
129
165
103
108
112
122
98
112
89
76
81
89
67
84
Grupo Éxito
CPG
Retail
TV
Publisher C Publisher B Publisher A Entertainment Publisher
La audiencia de este medio, esta mas comprometida con la marca que el promedio de la audiencia propia de la marca.
Source: Shareablee Social Loyalty Platform 2015 Platforms: Facebook Metrics: Total Posts, Actions, Impressions Period: Apr – June 2014
This entertainment publisher’s audience engaged 4x more heavily with Grupo Éxito, than Grupo Éxito’s own social audience during this time period
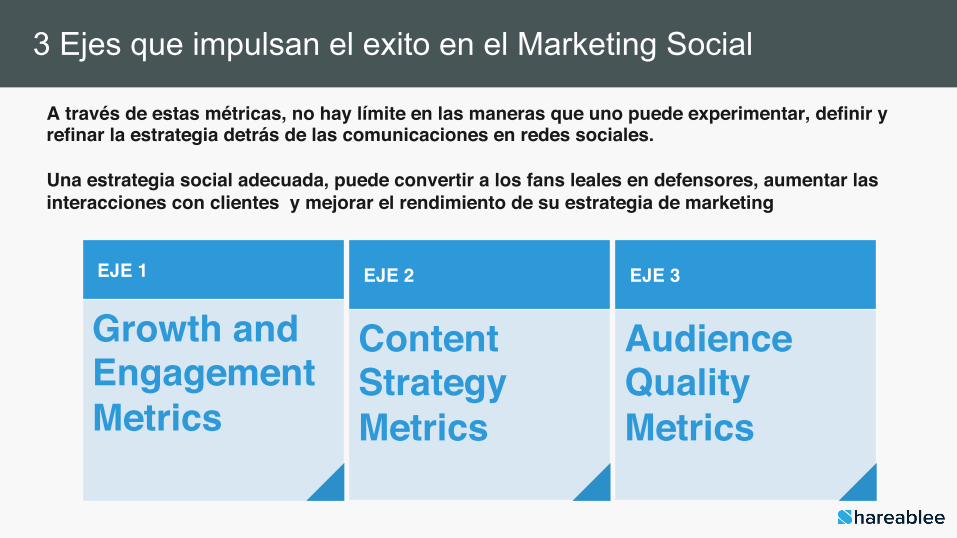
EJE 1
Growth and Engagement Metrics
EJE 2
ContentStrategyMetrics
EJE 3
AudienceQualityMetrics
3 Ejes que impulsan el exito en el Marketing Social
A través de estas métricas, no hay límite en las maneras que uno puede experimentar, definir y refinar la estrategia detrás de las comunicaciones en redes sociales.
Una estrategia social adecuada, puede convertir a los fans leales en defensores, aumentar las interacciones con clientes y mejorar el rendimiento de su estrategia de marketing
Appendix & Case Studies
For info about the proprietary technology used in comScore products, refer to http://comscore.com/About_comScore/Patents
www.comscore.com @comScore www.linkedin.com/company/comscore www.facebook.com/comscoreinc
Muchas Gracias! Marcos Christensen [email protected] 4711.8725