Embed Size (px)
Citation preview

STARBUCKS
social media strategy
developed by kennedy smith
TABLE OF CONTENTS 1. Executive Summary
2. Social Media Audit a. Social Media Assessment
b. Traffic Source Assessment
c. Customer Demographics Assessment
d. Competitor Assessment
3. Social Media Objectives
4. Online Brand Persona and Voice
5. Strategies and Tools
6. Timing and Key Dates
7. Social Media Roles and Responsibilities
8. Social Media Policy
9. Critical Response Plan
10. Measurement and Reporting Results

EXECUTIVE SUMMARY
Our major social media priorities in 2016 are to continue growing our virtual community and fostering long-term relationships with our audience. The main goal is to better utilize social in such a way that it drives up revenue; the idea is to bring more online visitors in stores, securing a relationship with these individuals. Two social strategies will make these objectives happen:
1. Increase interactive content that encourages conversation and store visits.
2. Develop more content across all social platforms while experimenting with platforms where we are currently not present, but our consumer is.

SOCIAL MEDIA AUDIT
This is an audit of Starbucks’ current social media presence. You will find an assessment of social network and web traffic, audience demographics, and a competitor analysis.
Social Network
URL Follower Count
Average Weekly Activity
Average Engagement
Facebook https://www.facebook.com/Starbucks 36,444,340 3-4 posts/ week 5.1%
Twitter https://twitter.com/Starbucks 11,700,000 5 posts/ week 3.1%
Instagram https://www.instagram.com/starbucks/ 11,500,000 7 posts/ week 6.7%
Social Media Assessment: Starbucks is most active on Instagram -- with highest average weekly activity and engagement. Their largest audience is on Facebook, the potential to interact with these individuals is what should be focused on for this plan.

SOCIAL MEDIA AUDIT CONT.
This is an audit of Starbucks’ current website traffic sources.
Source Volume % of Overall Traffic
Conversion Rate
Facebook 300,000 7% 3.2%
Twitter 450,000 10% 5%
Instagram 750,000 24% 10%
Website Traffic Assessment: Instagram drives the most traffic Starbucks’ webpage in comparison to Facebook and Twitter. Instagram also holds the highest conversion rate. Facebook has the lowest percentage of overall traffic and lowest conversion rate.

SOCIAL MEDIA AUDIT CONT.
This is an audit of Starbucks’ Audience Demographics.
Age Distribution
Gender Distribution
Primary Social
Network
Secondary Social
Network
Primary Need Secondary Need
70% 18-30 81% Female 19% Male
Instagram Twitter Coffee before work or class
Coffee for aesthetic reasons
10% 31-40 70% Female 30% Male
Facebook Instagram Coffee before work Coffee as a learned daily habit
10% 41-55 90% Female 10% Male
Twitter Facebook Coffee before work Coffee as a learned daily habit
10% 56-80 100% Female Facebook Twitter Coffee as a learned daily habit
Coffee as a luxury, after dinner treat
Audience Demographics Audit: Millennials and females drive sales in comparison.

SOCIAL MEDIA AUDIT CONT.
This is an audit of Starbucks’ competitors.
Competitor Name
Social Media Profile
Strengths Weaknesses
Dunkin Donuts Instagram: @dunkindonuts
Posts more regularly and more consumer photos, effectively directly engaging with the audience
Posts do not vary or directly relate to current happenings (i.e. seasons)
Coffee Bean Twitter: @thecoffeebean
A great deal of audience interaction (i.e. retweeting)
Significantly less followers and original content
Competitor Assessment: Dunkin Donuts poses the legitimate threat and should encourage Starbucks to remain on top of their consumer interactions on social media along with their own original posts.

SOCIAL MEDIA OBJECTIVES
Our primary focus of our social media strategy for 2016 is to increase revenue through driving more traffic from our social media outlets directly into our store. We plan to do this through increasing personal consumer interaction with our target audience -- millenials -- sharing relevant content which can directly engage audiences.
Specific Objectives are as follows: 1. Increase millenial followers on all social media accounts (Instagram, Twitter, Facebook) by
25% by January 2017 2. Increase engagement rate (comments, likes, shares) on Twitter and Facebook posts by 15%
by January 2017 3. Increase original video content (such as Facebook Live) on Facebook and Twitter by 25% by
May 2017
SOCIAL MEDIA OBJECTIVES CONT.
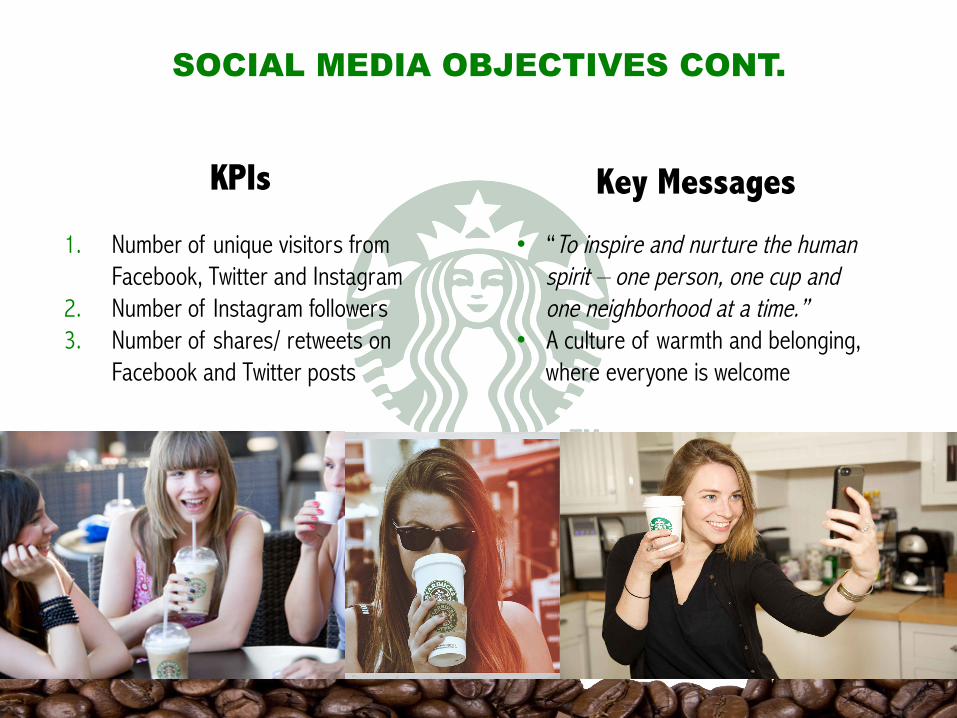
KPIs Key Messages
1. Number of unique visitors from Facebook, Twitter and Instagram
2. Number of Instagram followers 3. Number of shares/ retweets on
Facebook and Twitter posts
• “To inspire and nurture the human spirit – one person, one cup and one neighborhood at a time.”
• A culture of warmth and belonging, where everyone is welcome

ONLINE BRAND PERSONA AND VOICE
Adjectives that describe our brand
When interacting with customers we are
• Trendy • Green • Quirky • Outdoorsy • Cultured
• Helpful • Excited • Engaging
STRATEGIES AND TOOLS
Paid: Every Friday boost the most popular Facebook post for the weekend. The post should have a reach of at least 300, as well as a minimum of 200 likes or 50 comments. Owned: Introduce the use of #mystarbucks to encourage consumer production of their own original content which can then be shared to our own social media outlets. Earned: Monitor people who use the #mystarbucks and randomly select 10 people every month to receive a free drink
Tools: • Hootsuite • TweetDeck • Canva
Rejected Tools: • N/A Existing Subscriptions/ Licenses: • Photoshop • Vimeo
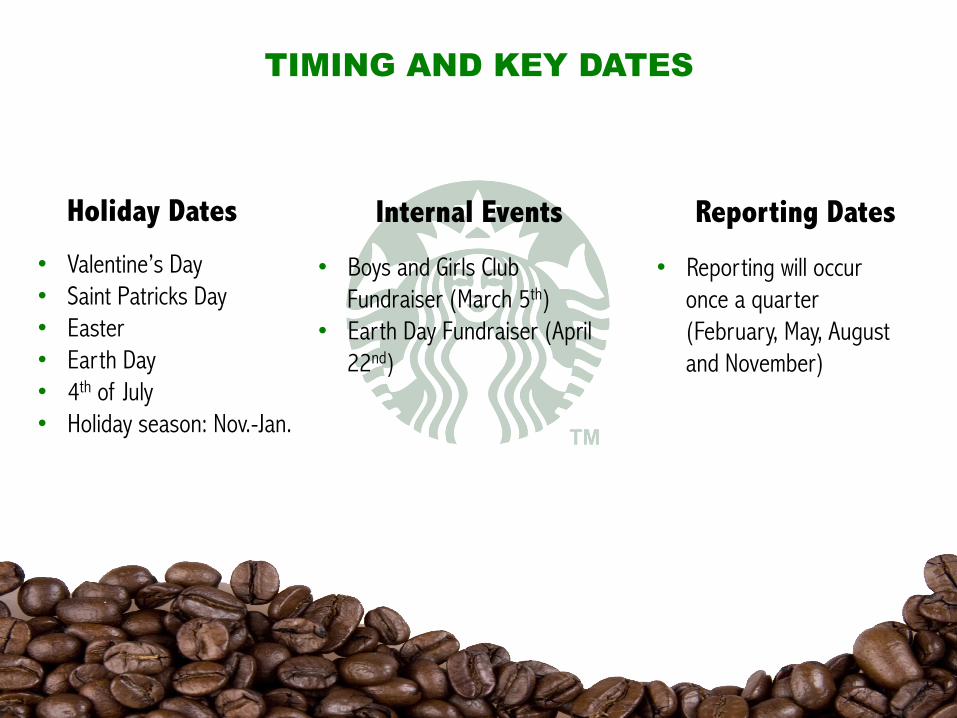
TIMING AND KEY DATES
Holiday Dates Internal Events Reporting Dates
• Valentine’s Day • Saint Patricks Day • Easter • Earth Day • 4th of July • Holiday season: Nov.-Jan.
• Boys and Girls Club Fundraiser (March 5th)
• Earth Day Fundraiser (April 22nd)
• Reporting will occur once a quarter (February, May, August and November)
SOCIAL MEDIA ROLES AND RESPONSIBILITIES
• Marketing Director of Operations: Diego Aguilar
• Manager of Social Media Strategy: Ashlee Langholz
• Digital Engagement: Ryan Turner
• Global Social Media: Stephanie Marx

SOCIAL MEDIA POLICY
Social Media plays a huge role in the lives of our consumers and that of our company. It provides us a glimpse into their everyday lives and see them enjoying our products first hand. It is our goal to post relevant and engaging content that allows our audience to feel a personal connection.
Key rules to help us achieve these goals include:
• Reply to at least 10 comments a day, leaving customers with a smile • Don’t discuss competitors, especially in a negative light • Only leave positive messages in posts and comments • Respond to questions and complaints within 24 hours, offering a positive solution

CRITICAL RESPONSE PLAN
Follow if inappropriate posts are detected:
1. Screenshot the post at hand and save for reference 2. Show Ashlee and Diego the situation immediately 3. Discuss what action should be taken with Ashlee and Diego 4. Once action is determined, carry it out as soon as possible 5. Let the PR team know what happened in case the company is contacted in the future about
the post

MEASURING AND REPORTING RESULTS
Social Network
URL Follower Count
Average Weekly Activity
Average Engagement
Facebook https://www.facebook.com/Starbucks 40,444,340 6-10 posts/ week 10.1%
Twitter https://twitter.com/Starbucks 11,900,000 15 posts/ week 7.1%
Instagram https://www.instagram.com/starbucks/ 11,700,000 15 posts/ week 9.7%
Source Volume % of Overall Traffic
Conversion Rate
Facebook 450,000 15% 5%
Twitter 580,000 20% 10%
Instagram 860,000 30% 20%

Results Assessment: The #mystarbucks contributed to growth in followers on both Instagram and Twitter and lead to more website visits. Sentiment Analysis:
Direct consumer interaction increased across all platforms but notably on Twitter and Instagram, with the consumers utilizing the #mystarbucks. Positivity continues to reign supreme across comment sections. Proposed Action Items:
Continue to use the #mystarbucks and interactive posts on Facebook and Twitter. Perhaps develop seasonal hashtags that encourage consumers to share their favorite seasonal drink concoctions.
MEASURING AND REPORTING RESULTS CONT.