Embed Size (px)
Citation preview

STARTUP
SURVEY
BY CREATIVESPARK (PTY) LTD. CONFIDENTIAL: NOT FOR PUBLICATION OR CIRCULATIONBY CREATIVESPARK (PTY) LTD (2015) [email protected]

BY CREATIVESPARK (PTY) LTD (2015) [email protected]
The true picture of South Africa’s
startup landscape revealed.


VENTUREBURN’S NATIONWIDE SURVEY INVESTIGATES
THE TECH STARTUP COMMUNITY AND FINDS OUT MORE
ABOUT THIS EVER-EXPANDING LANDSCAPE. GIVEN
VENTUREBURN’S REACH AND AUTHORITY IN THIS
SEGMENT, IT IS THE MOST COMPREHENSIVE SURVEY
TO DATE.
THE VENTUREBURN SOUTH
AFRICAN STARTUP SURVEY:
The true picture of South Africa’s
startup landscape revealed.

• 197 startups were included in the survey analysis (after a data clean-up)
• Of the total number of responses, 334 startups started the survey, 237 completed the survey
• The survey comprised of 42 questions ranging from questions about demographics, funding and
revenue challenges, information about founders and employees, motivations and questions about
markets the startups operate in
• The definition of a startup for the purposes of this survey was: A tech-based startup with revenues
of under R20-million and/or staff numbers from 0-100
• Prizes were offered to startups for completing the survey that included an iPad Mini, Goodie bag,
and 170k worth of marketing value on Ventureburn and associated Burn Media sites
• Survey achieved a 95% confidence level and a 7% margin of error. Sample size assumed a
population of about 5 000 tech startups in South Africa, a more than generous estimate, which
shows that the sample size of 197 is more than sufficient. The sample size is random
• This survey will be referenced and contextualised by an upcoming PWC Emerging Companies
Survey which will pull various startup surveys together in the country

• In order to ensure that the results were representative of the tech startup ecosystem,
we removed inconsistent responses and we removed any responses from employees
(whether holding shares or not)
• Qurio, the official research partner, has done as much as possible to ensure statistical
accuracy with a survey of this nature.
• A decision has been made not to report on Q6 due to the obvious misinterpretation of the
question. Based on the information we had (comparison with Q25), the misinterpretations
were enough to void the question, but it was not necessary to remove the responses from
the data set.
• For some of the checkbox questions (questions where respondents could choose
more than one option), we decided to weigh the questions according to how many
answer options were chosen. These questions are marked with a (W). For example:
– If someone chose 2 options, each answer option would be weighed by 50%
– If someone chose 3 options, each answer option by 33.33%

Paul Kim: Director @ Qurio, BComm Honours Actuarial Science (University of Stellenbosch)
Erin Murdoch: Data Analyst @ Qurio, BSc Applied Maths (University of Stellenbosch), [email protected]
Jacques Coetzee: Head of Ventureburn; Graham van der Made: Contributing writer; Stuart Thomas: Head of Memeburn
Jason Bechervaise; Kyle Hauptfleisch: Commercial lead; Job Mabiala: Sales executive
Matthew Buckland: MD & Founder of Burn Media, Creative Spark
Oliver Kurt Drews, consulting on data (Clifftop Colony)
Special thanks to those who consulted on survey questions: Keet van Zyl (Knife Capital), Brett Commaille (Montegray),
Andrea Bohmert (Knife Capital), Michelle Atagana (Google), Nicholas Haralambous (Entrepreneur consultant).
And a special thanks to our sponsors at FNB, Clifftop Colony and Qurio. Barrett Whiteford, (Head of Marketing : FNB
Business) and Bernice Samuels (Executive Head of Marketing at FNB), Oliver Kurt Drews, Premysl Trojan, and Kevin
Mahoney from Clifftop-Colony Venture Capitalists.
And last, but not least, a special mention to the very clever guys at research company, Qurio.
Press queries and general queries: [email protected]
The true picture of
South Africa’s
startup landscape
revealed…

• Most startups (59%) exist in the Western Cape supporting the idea of “Silicon Cape” being the
home of startups, followed by Gauteng (29%), then KwaZulu-Natal (5%). This supports the notion
that highly mobile tech entrepreneurs choose “lifestyle cities” to start their businesses in, not too
dissimilar to that of San Francisco’s Silicon Valley.
• Startup founders are young. The most popular age category for startup founders is 25-30. Just
under half (44%) of all the startups were created by people in their 20s
• There has been a surge in black entrepreneurs. The startup world is still a white, male world,
however there has been positive demographic shift towards diversity in recent years:
– Startup founders were 66% white and 17% black; this is an improvement on a Silicon Cape
survey (2012), which surveyed the startup landscape as 78% white and 6.1% black
– 68% of founders were male; just 6% were female, and 27% work in combined male and
female founder teams.

• The startup world, which is often romanticised, is a tough environment characterised by long
hours and low pay. The main cause for a startup losing employees was due to “remuneration”
(26%), followed by not liking “startup culture” (14%) and “too much pressure” (11%).
• Benefits like pensions are non-existent (0%) in the startup world and only 2% of those
surveyed offered medical aid
• This begs the question, why do people then create startups? Founders indicated that their
motivations included “spotting a gap in the market” (17%) or a desire to “innovate and be a
pioneer” (15%).
• The next most popular motivations for creating a startup included “Personal development”
(9%), “Be my own boss” (9%), “Lifestyle/flexibility reasons” (9%), “Creative Outlet” (8%) and
“more control over the work I do” (8%)

• Just 17% of startups surveyed said they were profitable
• Only 8% of startup companies remunerate employees via shares, contrary to popular belief
• The biggest challenge facing startups, unsurprisingly, is access to funds (43%), followed by “lack
of technical staff” (12%) and a South African market perceived to be “too small” (9%)
• Funding: Most startups are self funded from the start, the most popular form of funding by far
(56%), with next most popular method of funding as friends and family (15%) and Angel
investment (6%)
• Banks are not places startups traditionally go to for funding (just 2%)
• Crowdfunding, despite the hype, did not feature as a funding source at all (0%)
• 16% of startups were funded to the tune of over R1-million and 4% of startups were funded at R5-
million and up.
• Very few startups make it to Venture Capital (3%) and Private Equity (1%) rounds, a sign of
“increasing success” where startups then traditionally receive cash injections to grow

• Most startups are run from homes and garages (49%), with about 23% from
rented offices, underlying the need to booststrap and cut costs
• The top industries for SA’s tech startups are computer & software services,
media, advertising & marketing, and consumer services
• The smallest industries for SA’s tech startups are: telecommunications, gaming,
real estate, agriculture
• Most founders surveyed tend to be developers or have some kind of technical
background
• The majority startups surveyed (57%) had more than one founder, which from a
risk perspective is always preferable to investors.
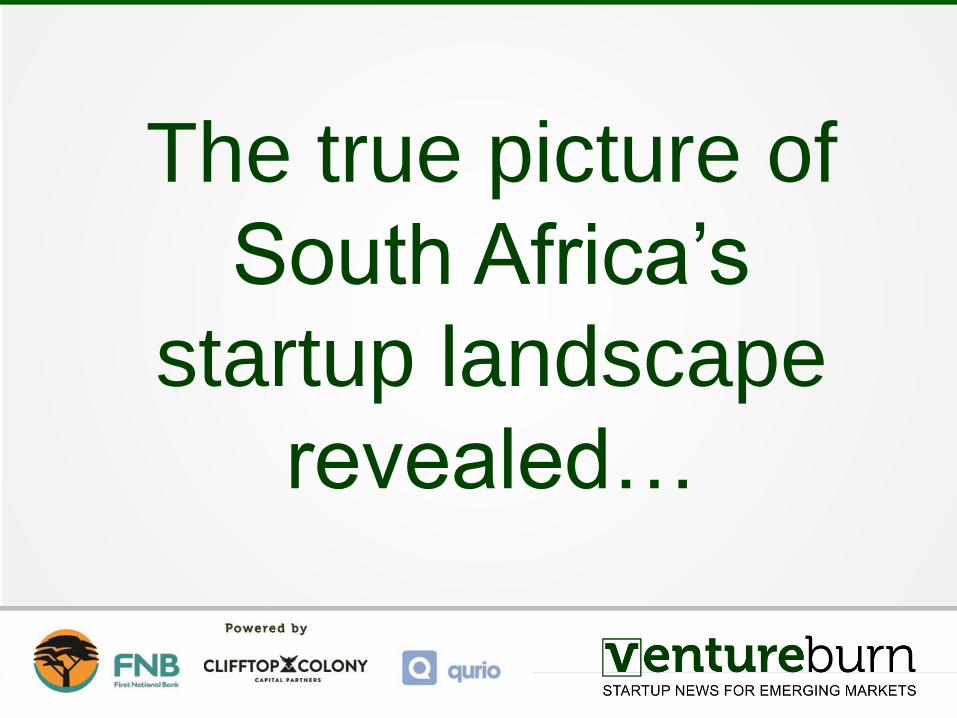
• Service-orientated businesses are more likely
profitable, make money from day one.
• B2B startups are more likely profitable, likely
service-orientated.
• Access to capital is more common a
challenge for non-profitable startups
• Self-funding is more common among
profitable startups
• Refining a scalable business plan takes time,
needs capital
• Businesses over two years are more likely
profitable. More experience, refined business
model.
Ventureburn filtered the successful startups (defined as
profitable) versus the startups not showing a profit.

The detailed
findings…

100%
Q01: Position in startup
Founder
Business Demographics
37%
43%
6%
14%
Service orientatedbusiness (e.g. agency,development house)
Have own product or IP Licence and useanother's product or IP
E-commerce
Q02: Primarily, what kind of business are you?
1%
23%
7%
3%
2%
5%
5%
1%
2%
2%
3%
15%
1%
7%
1%
4%
10%
11%
Agriculture
Computer & Software services
Education
Energy, Electrical & Petro
Entertainment & Leisure
Financial services & Insurance
Food & Beverage
Gaming
Government & Public services
Medical, Healthcare & Biotechnology
Hospitality & Travel
Media, Advertising & marketing
Real estate
Retailing/Distribution
Telecommunications
Transportation
Consumer products & services
Other
Q03: Which industry sector does your startup best fit into?

• Only founders data counted, employees eliminated from survey
• Most (43%) entrepreneurs’ startups are built around their own
product or IP (scalable enterprises), whereas 37% have
service/agency businesses
• Top industries for SA startups are computer & software services,
media, advertising & marketing, and consumer services
• Smallest industries are: telecommunications, gaming, real
estate, agriculture

45%
54%
1%
Q04: Is your business B2B, B2C or B2G?
B2B
B2C
B2G
39%
32%
13%
8%
3% 3% 2%
Less than 1year
1 to 2 years 2 to 3 years 3 to 4 years 4 to 5 years 5 to10 yearsMore than 10years
Q05: How long has the startup been in business?
59%
2% 3%
29%
1% 1%5%
1% 0%
Western Cape Northern Cape Eastern Cape Gauteng Free State North West Kwazulu-Natal Mpumalanga Limpopo
Q07: In which province is the startup based?
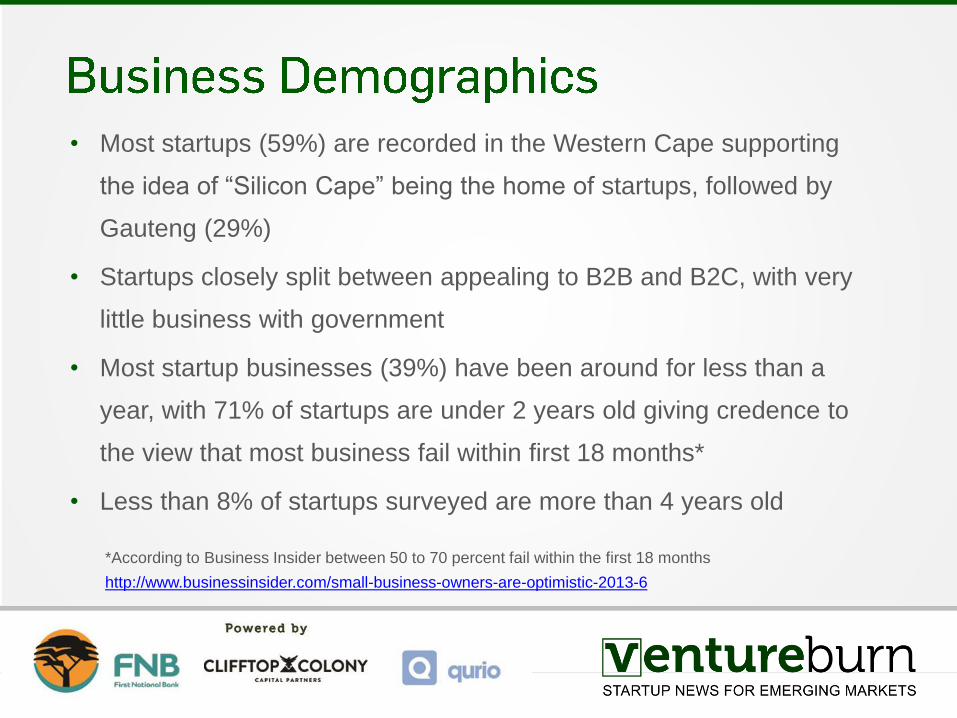
• Most startups (59%) are recorded in the Western Cape supporting
the idea of “Silicon Cape” being the home of startups, followed by
Gauteng (29%)
• Startups closely split between appealing to B2B and B2C, with very
little business with government
• Most startup businesses (39%) have been around for less than a
year, with 71% of startups are under 2 years old giving credence to
the view that most business fail within first 18 months*
• Less than 8% of startups surveyed are more than 4 years old
*According to Business Insider between 50 to 70 percent fail within the first 18 months
http://www.businessinsider.com/small-business-owners-are-optimistic-2013-6

37%
6%
3%
7%
19%
2%
0%
1%
1%
27%
I don't know my startup's BEE status
BEE Level 1 (Highest compliance)
BEE Level 2
BEE Level 3
BEE Level 4
BEE Level 5
BEE Level 6
BEE Level 7
BEE Level 8 (Lowest compliance)
Not compliant
Q34: BEE Status
6%
4%
45%
12%
11%
23%
Incubator or VC offices
Garage
My home
Remotely
Shared working space
Rent/own offices
Q14: Where is the startup run from? (W)
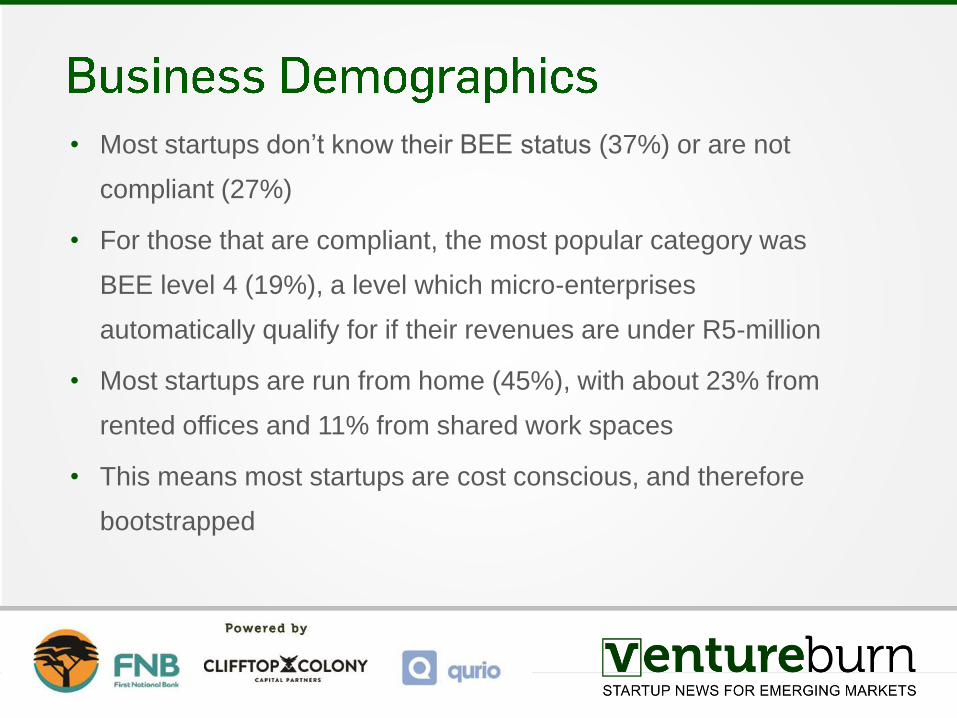
• Most startups don’t know their BEE status (37%) or are not
compliant (27%)
• For those that are compliant, the most popular category was
BEE level 4 (19%), a level which micro-enterprises
automatically qualify for if their revenues are under R5-million
• Most startups are run from home (45%), with about 23% from
rented offices and 11% from shared work spaces
• This means most startups are cost conscious, and therefore
bootstrapped

43%
37%
15%
3%
2%
1
2
3
4
5 or more
Q08: How many founders does the startup have?
Founders
1%
18%
26%
21%
15%
11%
8%
Less than 20 years old 20 to 25 years old 25 to 30 years old 30 to 35 years old 35 to 40 years old 40 to 50 years old 50+ years old
Q09: Which age group do the founders fall into?

8%
66%
4%
6%
17%
1%
Prefer not to say
White
Indian
Coloured
Black
Asian
Q12: Race of the Founders
68%
5%
27%
Q10: Gender of the founders
Male
Female
Both
52%
30%
18%
Q13: Are the founders technical?
Yes, founder/s main developer
Yes, founder/s assist in development strategy
No

• Most startups have between 1-2 founders (80%)
• 57% of startups have more than one founder
• Only 2% of startups have 5 or more founders
• The majority of startups (43%) had a single founder
• The most popular age category for startups founders is
25-30, followed by 30-35
• Just under half (44%) of all startups were created by
people in their 20s

• The startup world is still a white-male dominated world, however there
has been a positive demographic shift towards diversity
• Startup founders were 66% white and 17% black; this is an
improvement on a Silicon Cape survey (2012), which surveyed the
startup landscape as 78% white and 6.1% black
• 68% of founders were male; 6% female, and 27% worked in combined
male and female teams.
• Most founders tend to be developers or have some kind of technical
background. Only 18% aren’t technical.

70%
30%
Q37: Were you previously employed by a corporate?
Yes No
34%
66%
Q38: Would you ever work for a corporate again?
Yes No
25%
33%
42%
Q39: Net Promoter Score
Detractor
Passive
Promoter
NPS=16%

4%
9%
7%
17%
9%
8%
4%
8%
2%
7%
15%
9%
1%
Make the big bucks
Personal development
To find more meaning in my life
Opportunity/Gap in the market
Be my own boss
More control over the work I do
Don’t like rigidity/rules of corporate
Creative outlet
Altruism
Startup culture
Want to innovate/be a pioneer
Lifestyle and flexibility reasons
Other
Q35: Reason for founding a startup (W)
Reason for Founding a Startup
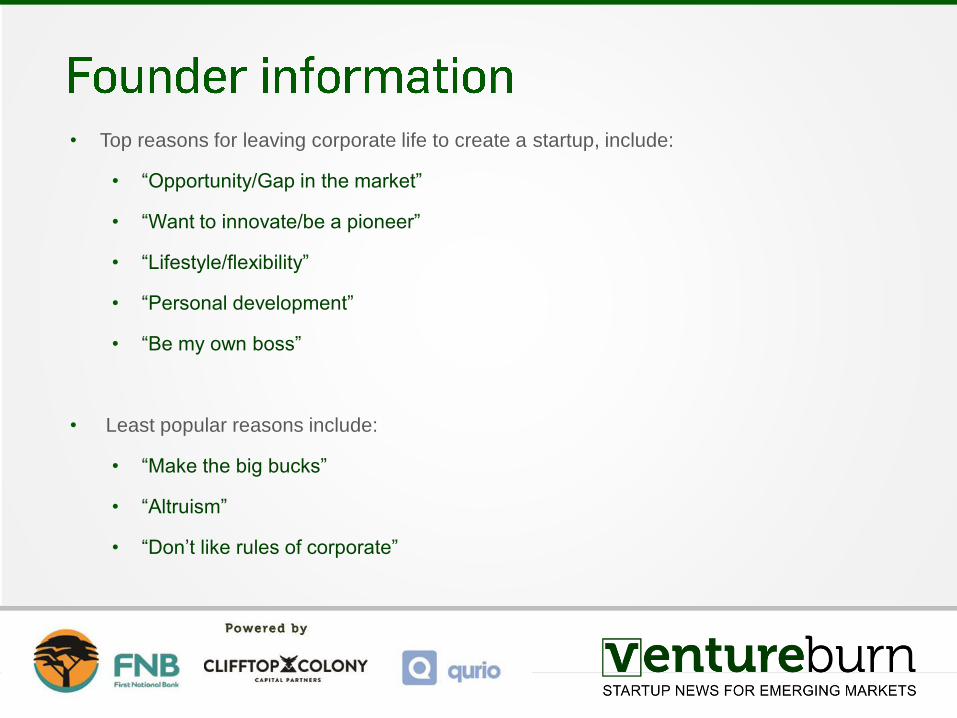
• Top reasons for leaving corporate life to create a startup, include:
• “Opportunity/Gap in the market”
• “Want to innovate/be a pioneer”
• “Lifestyle/flexibility”
• “Personal development”
• “Be my own boss”
• Least popular reasons include:
• “Make the big bucks”
• “Altruism”
• “Don’t like rules of corporate”

• Most founders (70%) were previously employed by a corporate.
This means that South Africans value building their networks and
skills in corporate settings before heading out to create their own
ventures.
• Most founders indicated they would not like to return to corporate
life (66%), clearly indicating that the startup bug has bitten!
• 42% of startup founders indicated that they would recommend the
“startup way” to others, while 25% say they would not recommend
the entrepreneurial startup journey

38%
50%
9%
2%
0%
1%
0
1 to 5
6 to 10
11 to 25
26 to 40
41 to 100
Q15: Nr of employees the startup has (Excluding founders)
Employees
20%19%
26%
6%
12%
6%
3%
8%
Volunteer Below Market salaries Market salaries Over market salaries Other incentives Profit share Bonuses Shares
Q16: How are employees remunerated? (W)

• 88% of startups have 5 employees or fewer
• 38% have no employees (just a founder)
• Only 1% have 41-100 employees
• Most employees on startups are remunerated with
“market related” salaries; 39% of employees work on
volunteer basis or for a “below market related” salary
• Only 8% of startup companies remunerate via shares,
contrary to popular belief
2% 0%
15%
7% 7%
18%
5%
46%
Medical Aid Pension Skills development(training, education
etc)
Travel benefits(petrol, travel
allowance etc)
Productivityallowance (laptop,
cellphone, dataetc)
Office benefits(coffee, lunch etc)
Other None of the above
Q17: Additional benefits offered to employees (W)
26%
6%
5%
8%
4%
6%
9%
14%
5%
11%
6%
Remuneration
Benefits
Employee performance
Poached by corporate
Poached by competitor
Personal reasons
Battles with multiple roles and disciplines
Startup culture does not agree with them
Working hours
Too much pressure
Other
Q18: Main causes for losing employees in startups (W)

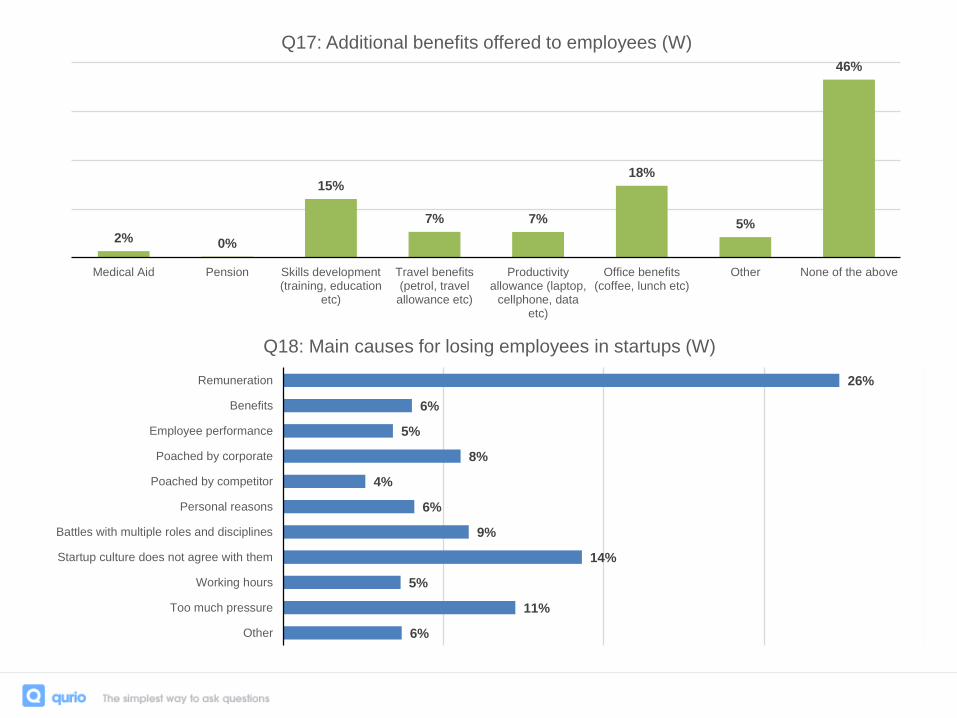
• Startup life tends to be glamorised, but the survey reveals that it can be
tough
• Almost half of all startups (46%) offer no benefits to their employees
• No startup in the survey offers any pension benefits (0%) and only 2% do
medical aid
• The main cause for a startup losing employees was due to “remuneration”
(26%), followed by not liking “startup culture” (14%) and “too much
pressure” (11%)
• A sum of 39% lose employees due to having a culture clash with the
industry itself (culture, pressure, battles with multiples roles, long working
hours)

43%
3%
9%
7%
12%
6%
7%
14%
Raising enough funds/access to capital
Lack of government support
Market too small
Lack of support in ecosystem
Not enough skilled technical staff/development
Not enough skilled staff
Too much red tape
Other
Q19: What is the biggest challenge startups face?
Challenges Facing Startups

3%
4%
1%
1%
56%
3%
0%
3%
2%
2%
4%
1%
3%
6%
11%
Other
Service work to supplement revenues
Funds by way of grant or donors
Government or quasi government funding
Self-funded from the start
Credit cards
Crowd funding
Revenue from another business
Revenue from a startup competition
Bank finance (loan)
Loans from friends and family
Private equity investment
Venture capital investment
Angel investment
Investment by friends and family
Q22: How did the startup first access funds? (W)
Funding of Startups

44%
12% 12%
8% 8%6% 6%
4%
Less than R50k R50k to R100k R100k to R250k R250 to R500k R500k to R1m R1m to R2m R2m to R5m R5m+
Q23: How much funding did your startup receive in total?
90%
2%8%
Q24: Where were the funds sourced from?
South Africa
Africa
Outside of Africa
34%
24%
17%
9%
17%
0 to 3 months 3 to 6 months 6 to 12 months 12+ months We're profitable
Q25: How many months before funding runs out?

2%
4%
10%
10%
25%
23%
27%
R100m and above
R25m to R100m
R10m to R25m
R5m to R10m
R1m to R5m
0 to R1m
Not looking to raise
Q26: How much funding does your business need to raise in the next 3 years?

• Biggest challenge facing startups, unsurprisingly, is access to funds (43% of
startups), followed by “lack of technical staff” (12%) and a South African market that
is perceived to be too small (9%)
• More than half of all startups are self-funded from the start (56%)
• The next most popular method of funding is friends and family (11%), Angel
investment (6%)
• Typically conservative banks are not places startups go for funding (2%). Alarmingly
3% of founders indicated they used their credit cards to start their companies
• Crowd-funding, despite the hype, is non-existent as a form of funding (0%)
• Very few startups make it to Venture Capital rounds, typically where they will get cash
injections to scale further (3%)

• Most startups surveyed received funding of R50 000 or under (44%)
• 16% of startups were funded to the tune of over R1-million
• 4% of startups were funded in the R5-million-plus bracket
• Most funding emanates from South Africa
• Only 17% of startups surveyed were profitable
• 75% of startups indicated they will be running out of funding within the next year
• 27% indicated they were not looking for funding, where as 50% were looking for R1-million-
plus funding
• The majority of startups indicated they were to source funds from venture capitalists (14%),
private equity (10%) and angel investment (9%). This is in contrast to those that actually
achieve Venture Caoital funding (3%).
• Just 7% said that they would continue to self-fund their startup
• Only 4% indicated that they would source funds from friends and family

58%
7%12% 11%
7%4%
2% 1% 1%
R0k to R100k ayear
R100k to R250kper year
R250k to R500kper year
R500k to R1mper year
R1m to R2m peryear
R2m to R5m peryear
R5m to R10mper year
R10m to 20m peryear
R20m+ per year
Q32: Revenue generated by the startup
13%
6%
20%
35%
18%
8%
Anywhere from 100% annual revenue growth and upwards
Anywhere from 75% annual revenue growth and upwards
Anywhere from 50% annual revenue growth and upwards
Anywhere from 25% annual revenue growth and upwards
Anywhere from 10% annual revenue growth and upwards
Anywhere from 0% annual revenue growth and upwards
Q33: Floor annual revenue growth rate, to be deemed successful

65%
13%
2% 0% 1%3%
15%
1%
South Africa Africa North America South America Australasia Europe Whole world Other
Q28: Which market does your startup operate in? (W)
Market Related
43%
23%
14%
20%
R0 to R100m a year R100m to R500m a year R500m to R1b a year R1b plus a year
Q29: What is the size of the market you are addressing in terms of revenue per year?

41%
14%
23%
22%
Dominate market
Top 3 position in market
Highest possible market share
Sustainable business
Q30: Startup objective, when positioning company in desired market

• Most startups (58%) indicated they were generating revenues of R0-R100 000 per
year with the majority looking for high growth of between 25%-50% pa
• Most startups believed their market size was between R0-R100-million, with at least
20% indicating they were operating in a R1-billion market
• Most startups have high hopes, looking to dominate their defined market (41%)
• Most startups are marketed via “word of mouth” (24%), personal networks (19%), and
social media (21%)
• Traditional marketing was the least preferred form of promotion (3%), which supports
the notion that most startups, most of whom are bootstrapping, cannot afford
traditional forms of marketing