Embed Size (px)
Citation preview
1Center for RuralEnterprise Engagement
Social Media Benchmarksa guide for the green industry
Center for Rural Enterprise Engagement
2Center for RuralEnterprise Engagement
E-newsletter
Website
3Center for RuralEnterprise Engagement
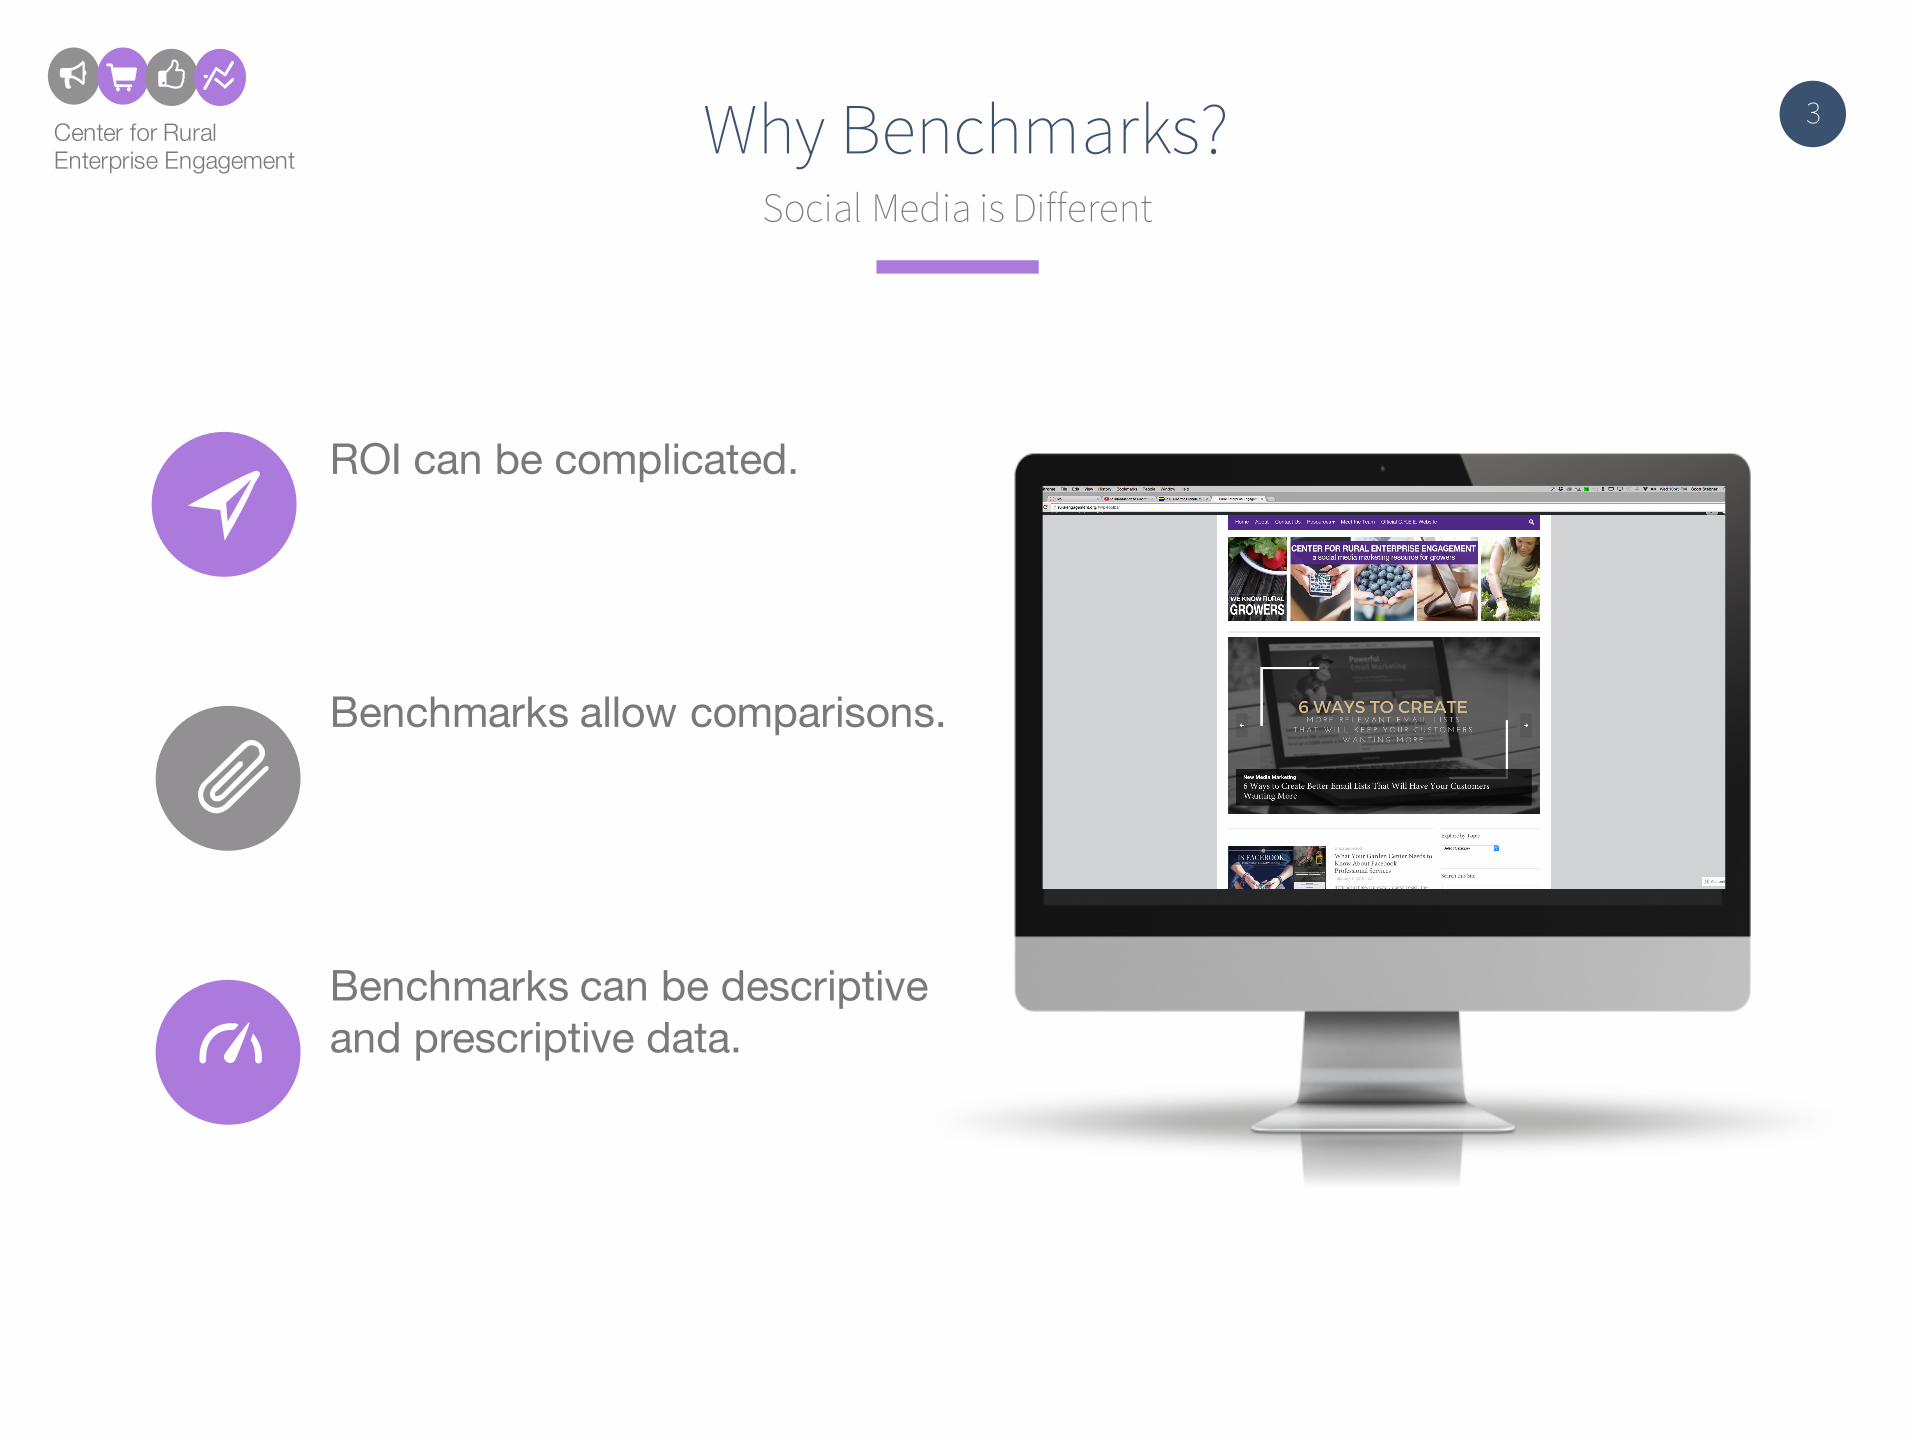
ROI can be complicated.
Benchmarks allow comparisons.
Benchmarks can be descriptiveand prescriptive data.
Why Benchmarks?Social Media is Different
4Center for RuralEnterprise Engagement
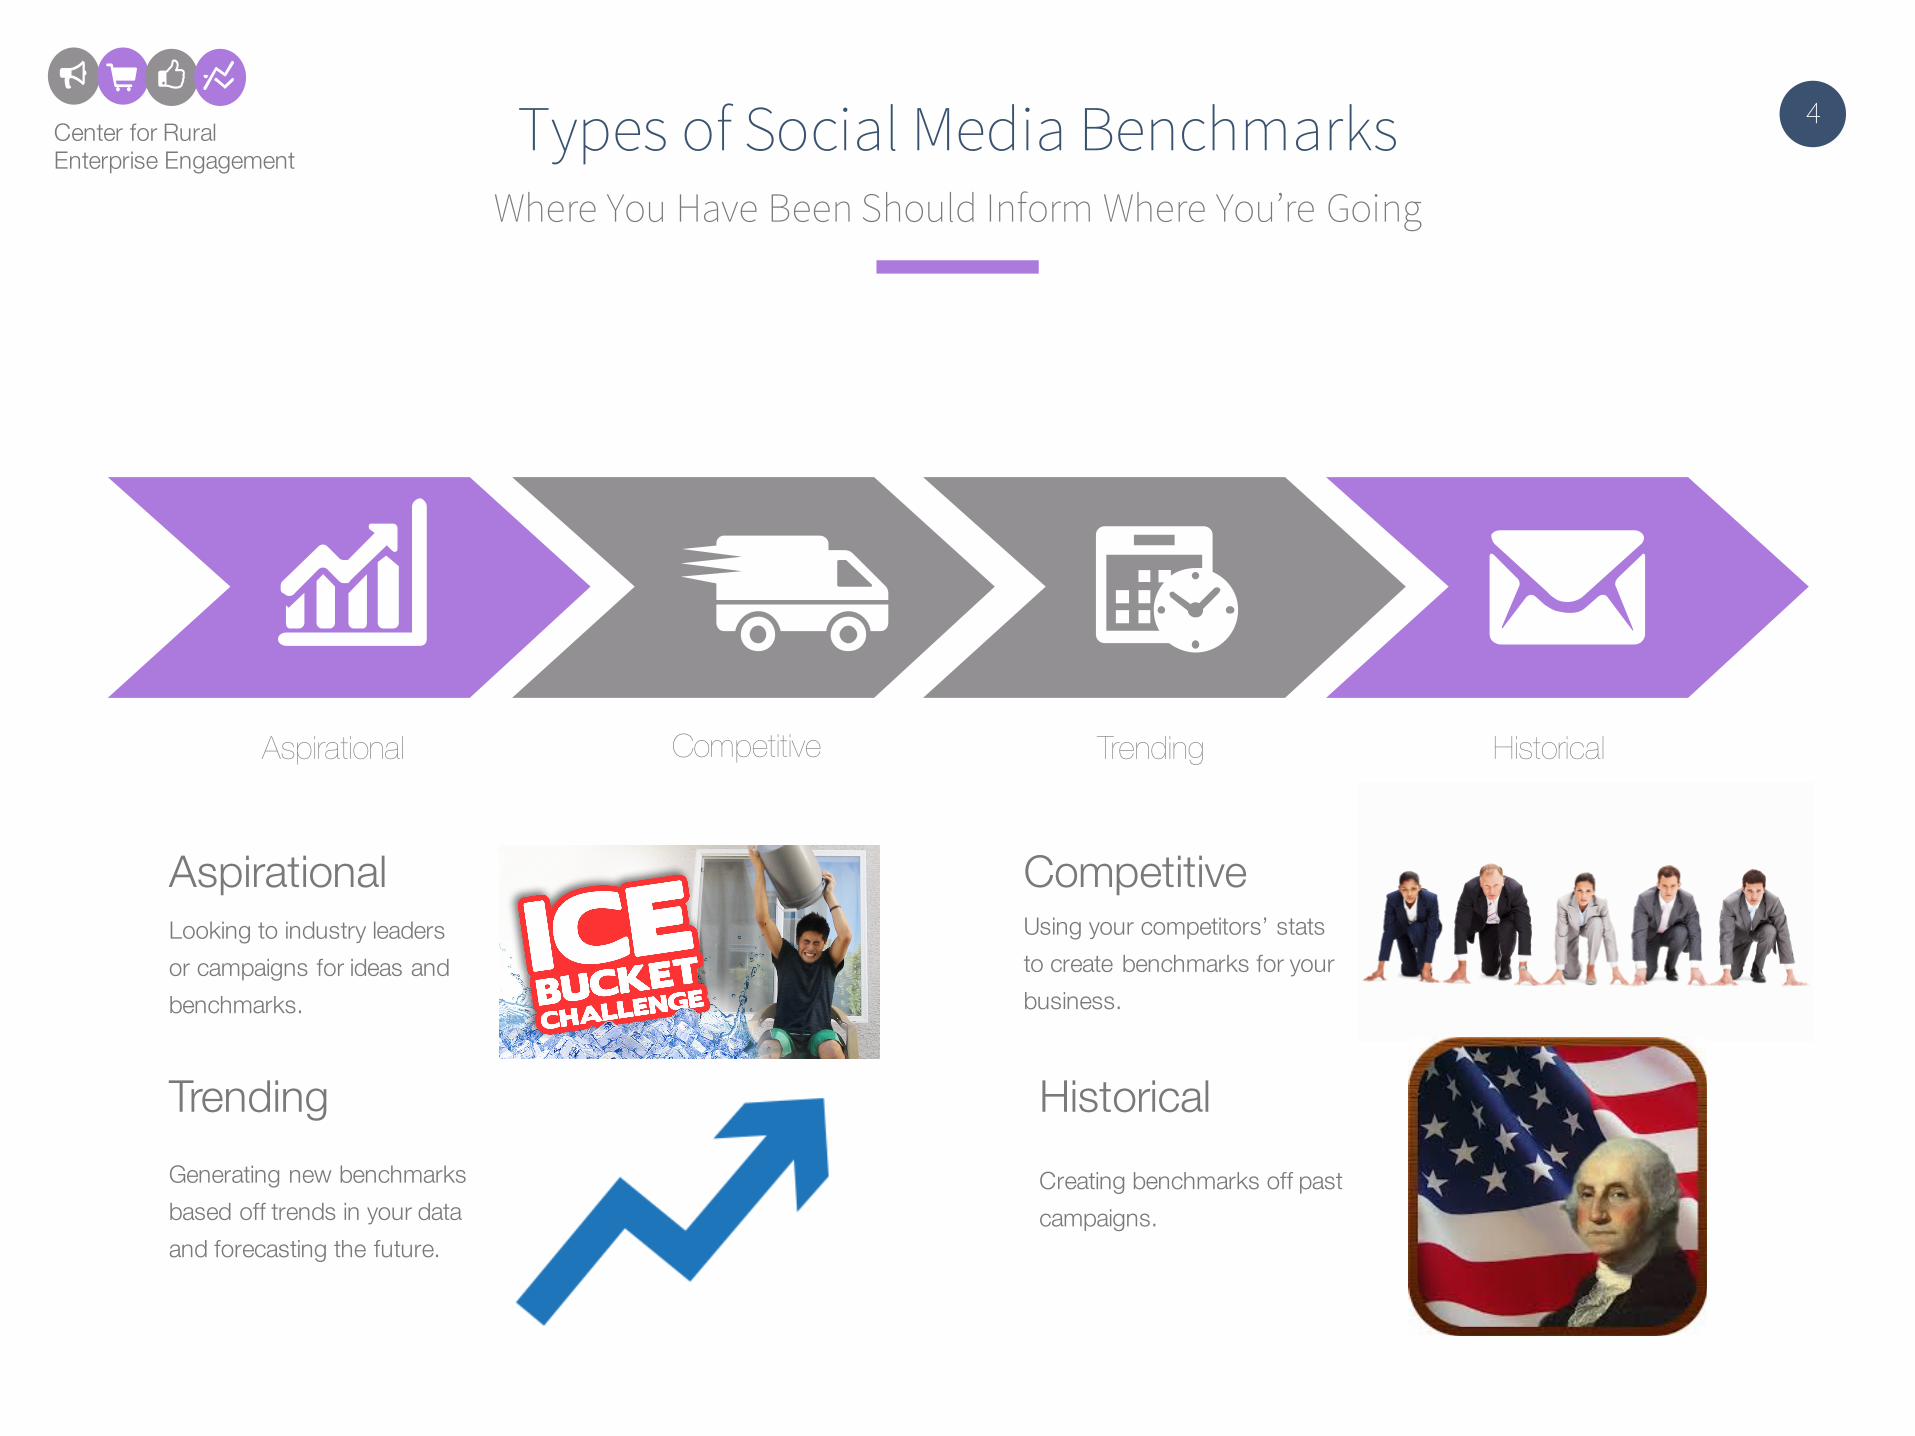
Types of Social Media BenchmarksWhere You Have Been Should Inform Where You’re Going
AspirationalLooking to industry leaders or campaigns for ideas and benchmarks.
CompetitiveUsing your competitors’ stats to create benchmarks for your business.
Aspirational Competitive Trending Historical
TrendingGenerating new benchmarks based off trends in your data and forecasting the future.
HistoricalCreating benchmarks off past campaigns.
5Center for RuralEnterprise Engagement
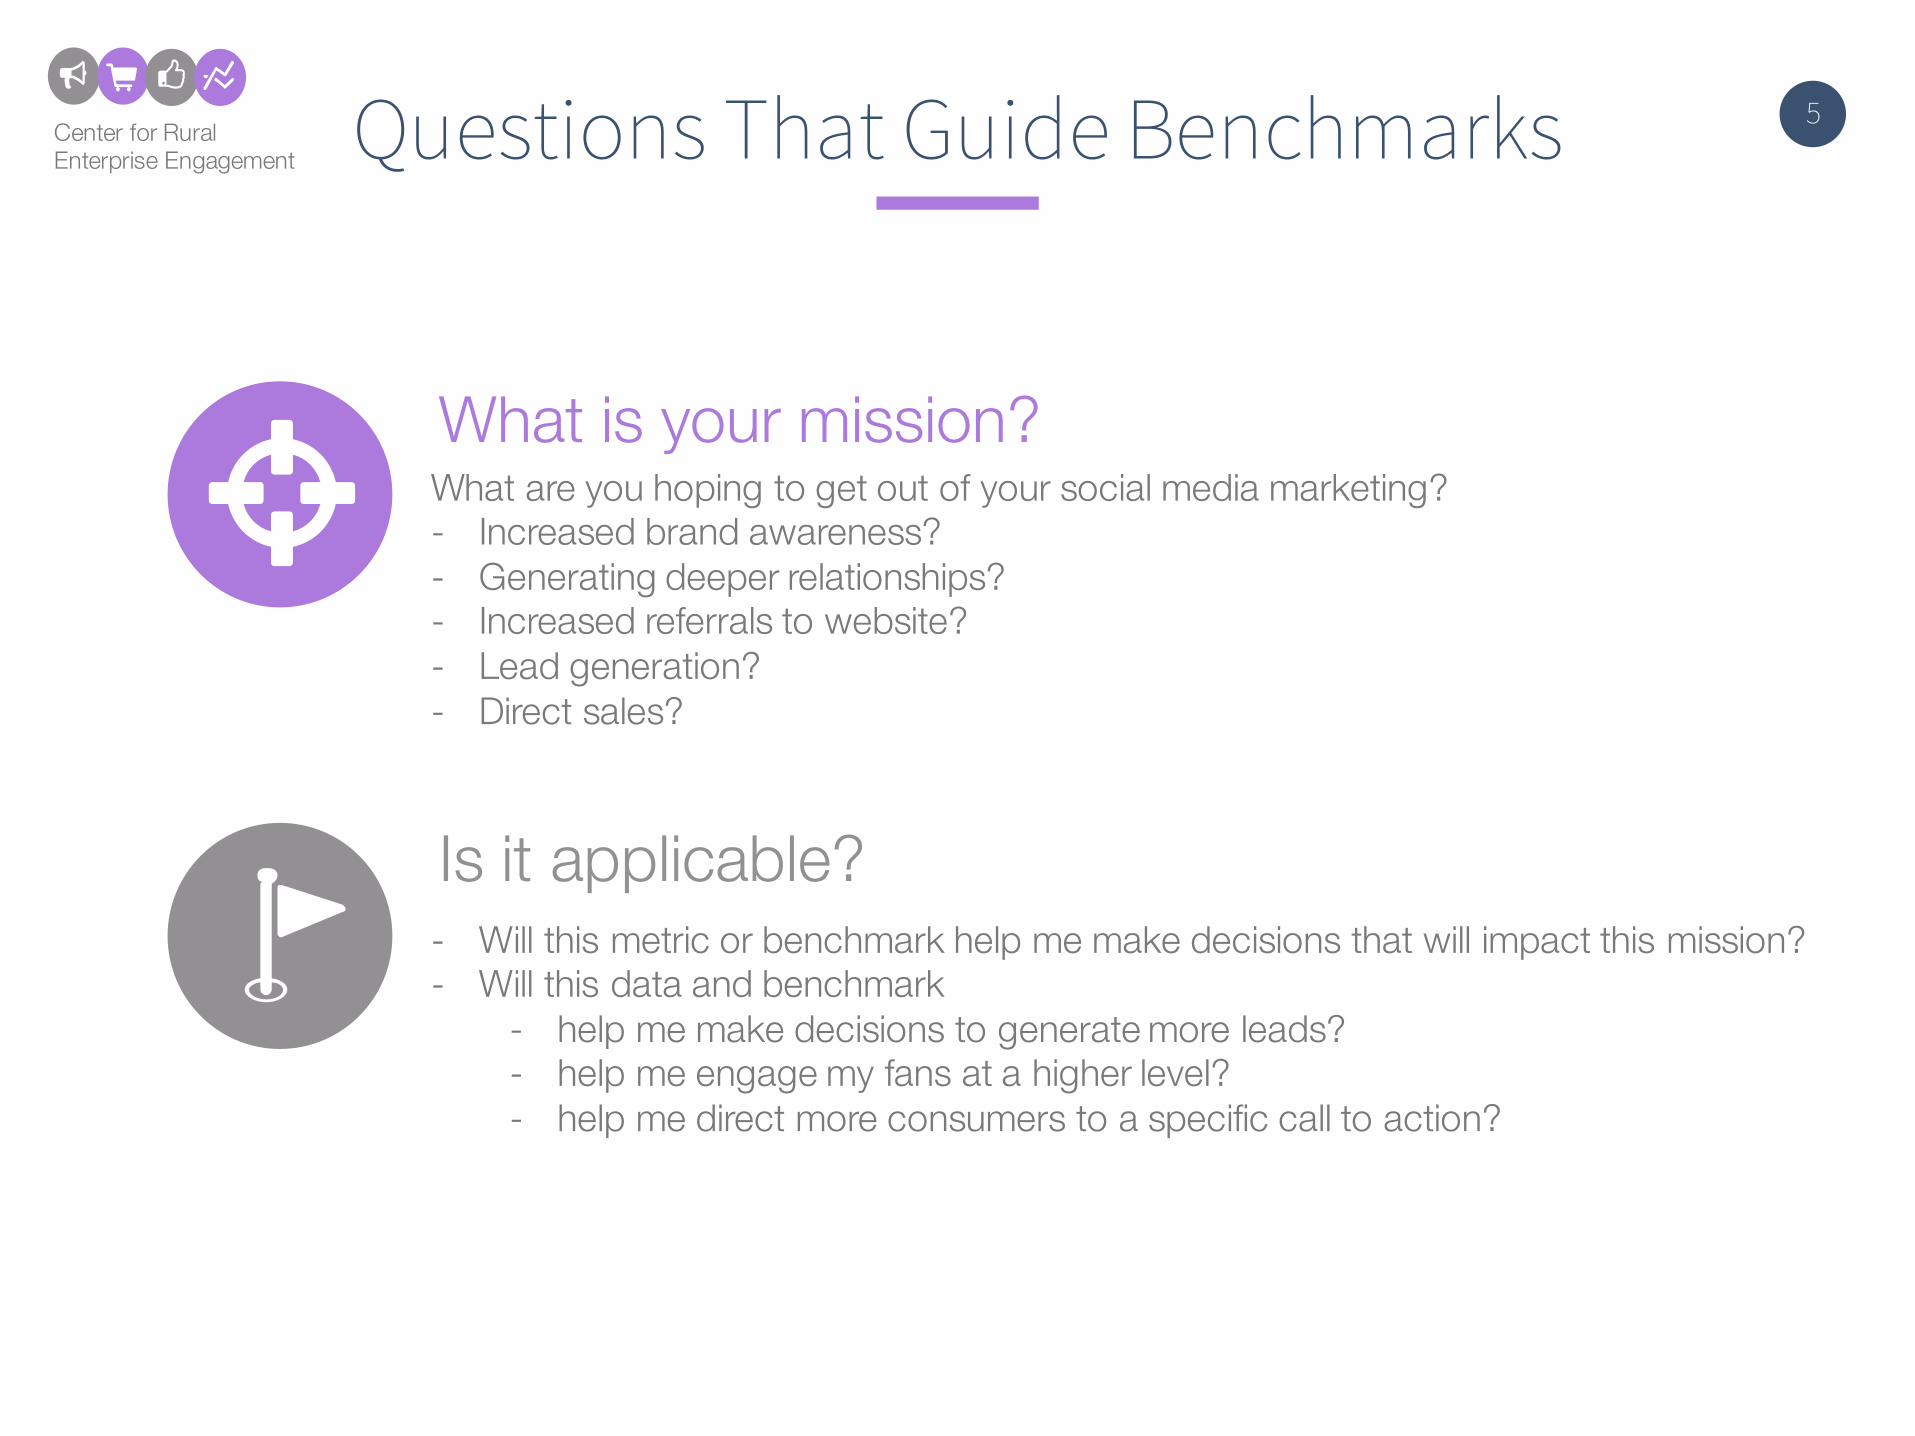
What is your mission?What are you hoping to get out of your social media marketing?- Increased brand awareness?- Generating deeper relationships?- Increased referrals to website?- Lead generation?- Direct sales?
Is it applicable?- Will this metric or benchmark help me make decisions that will impact this mission?- Will this data and benchmark
- help me make decisions to generate more leads? - help me engage my fans at a higher level?- help me direct more consumers to a specific call to action?
Questions That Guide Benchmarks
6Center for RuralEnterprise Engagement
FacebookData-Driven Benchmarks
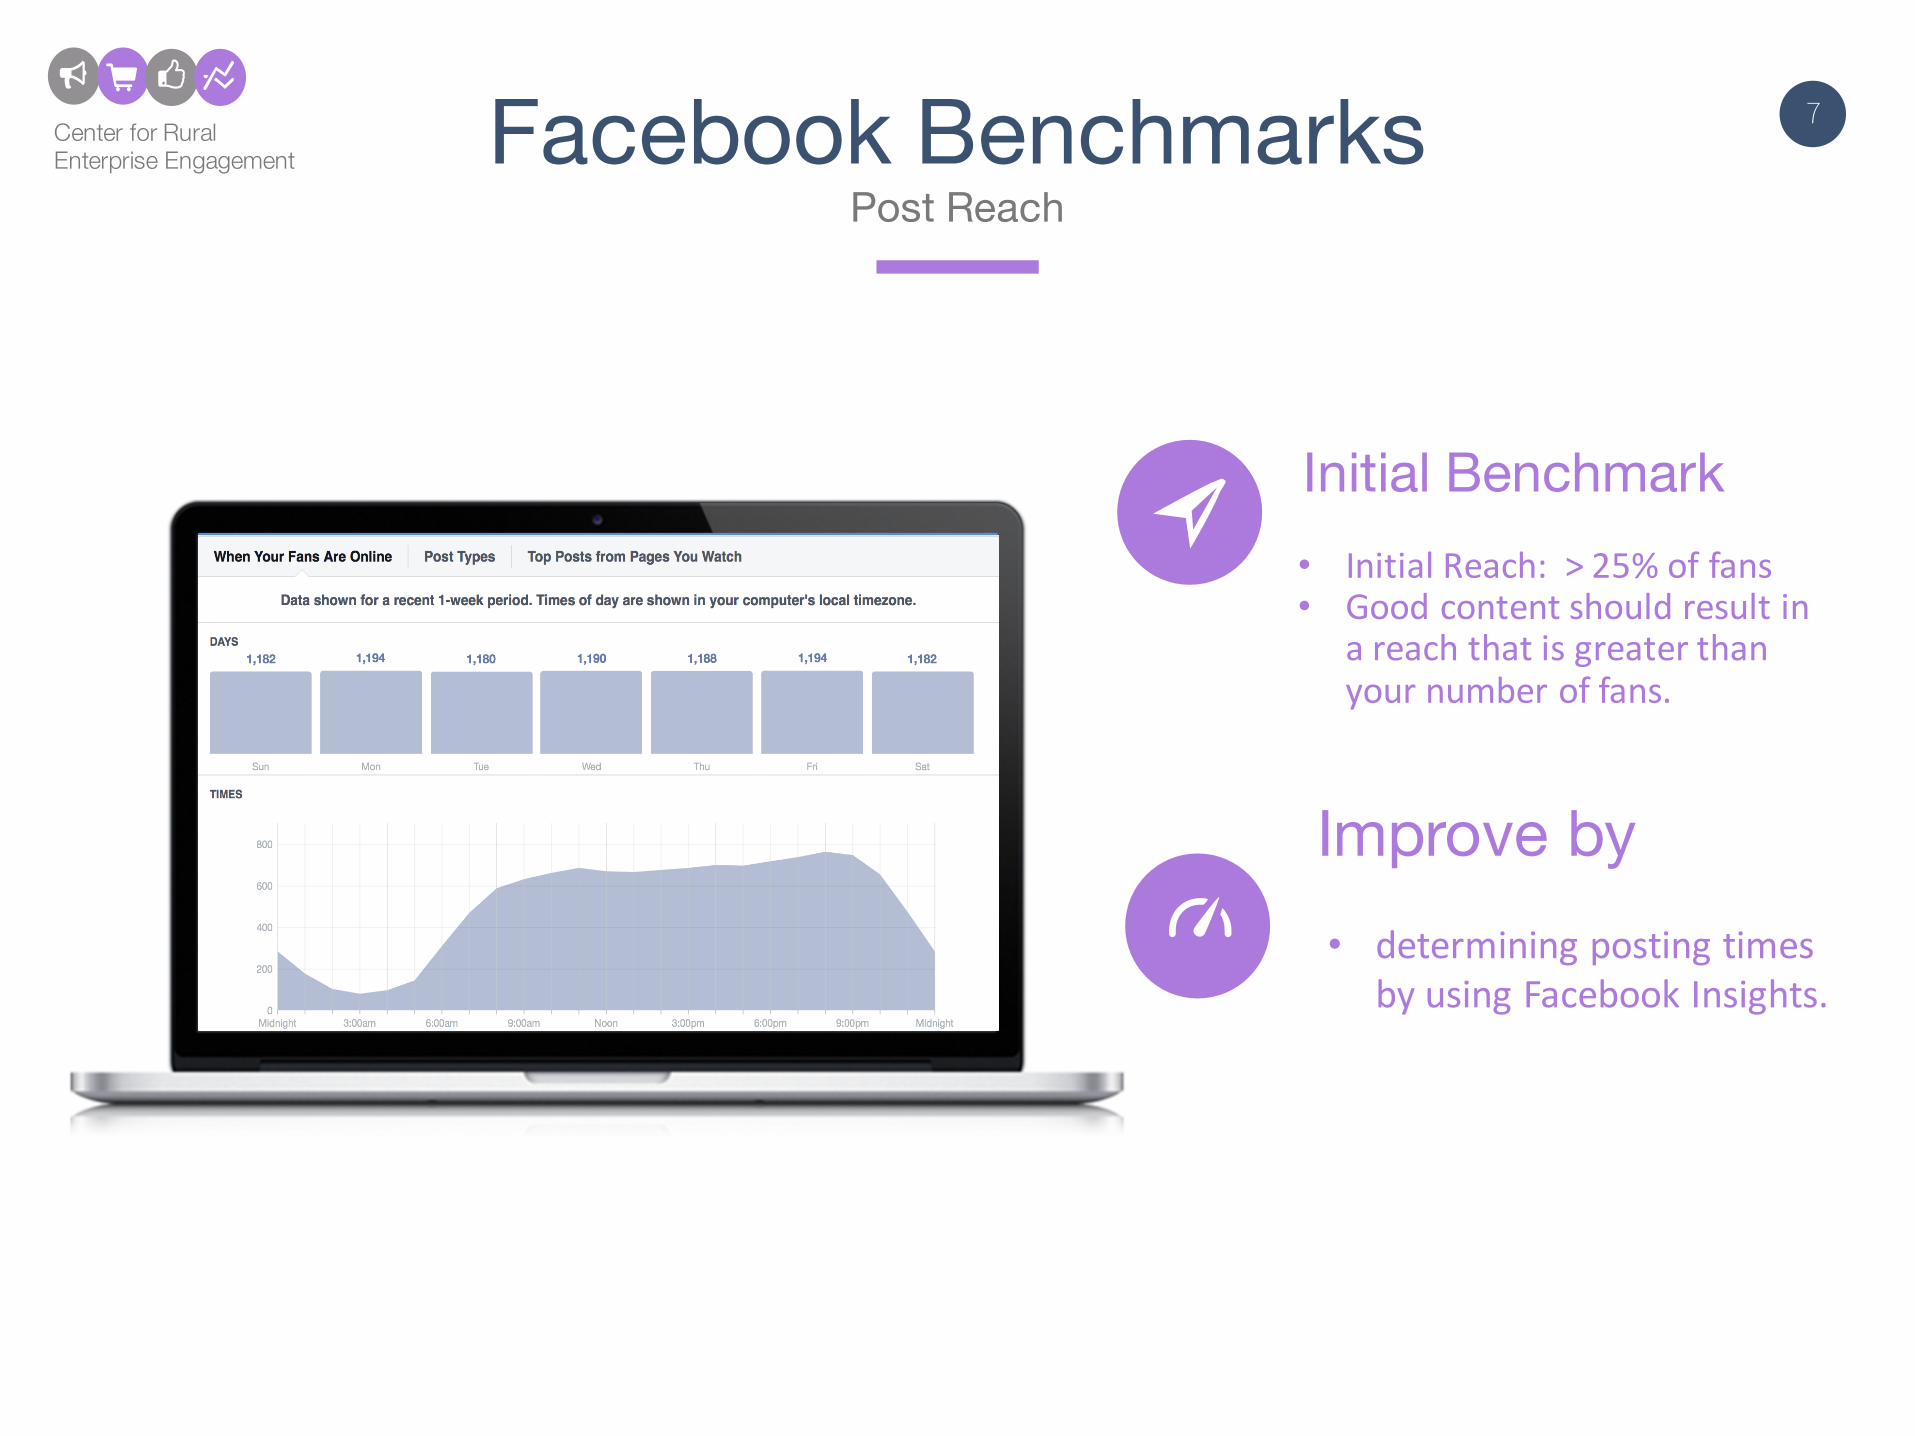
7Center for RuralEnterprise Engagement Facebook Benchmarks
Post Reach
Initial Benchmark• InitialReach:>25%offans• Goodcontentshouldresultin
areachthatisgreaterthanyournumberoffans.
Improve by• determiningpostingtimes
byusingFacebookInsights.
8Center for RuralEnterprise Engagement
Benchmark
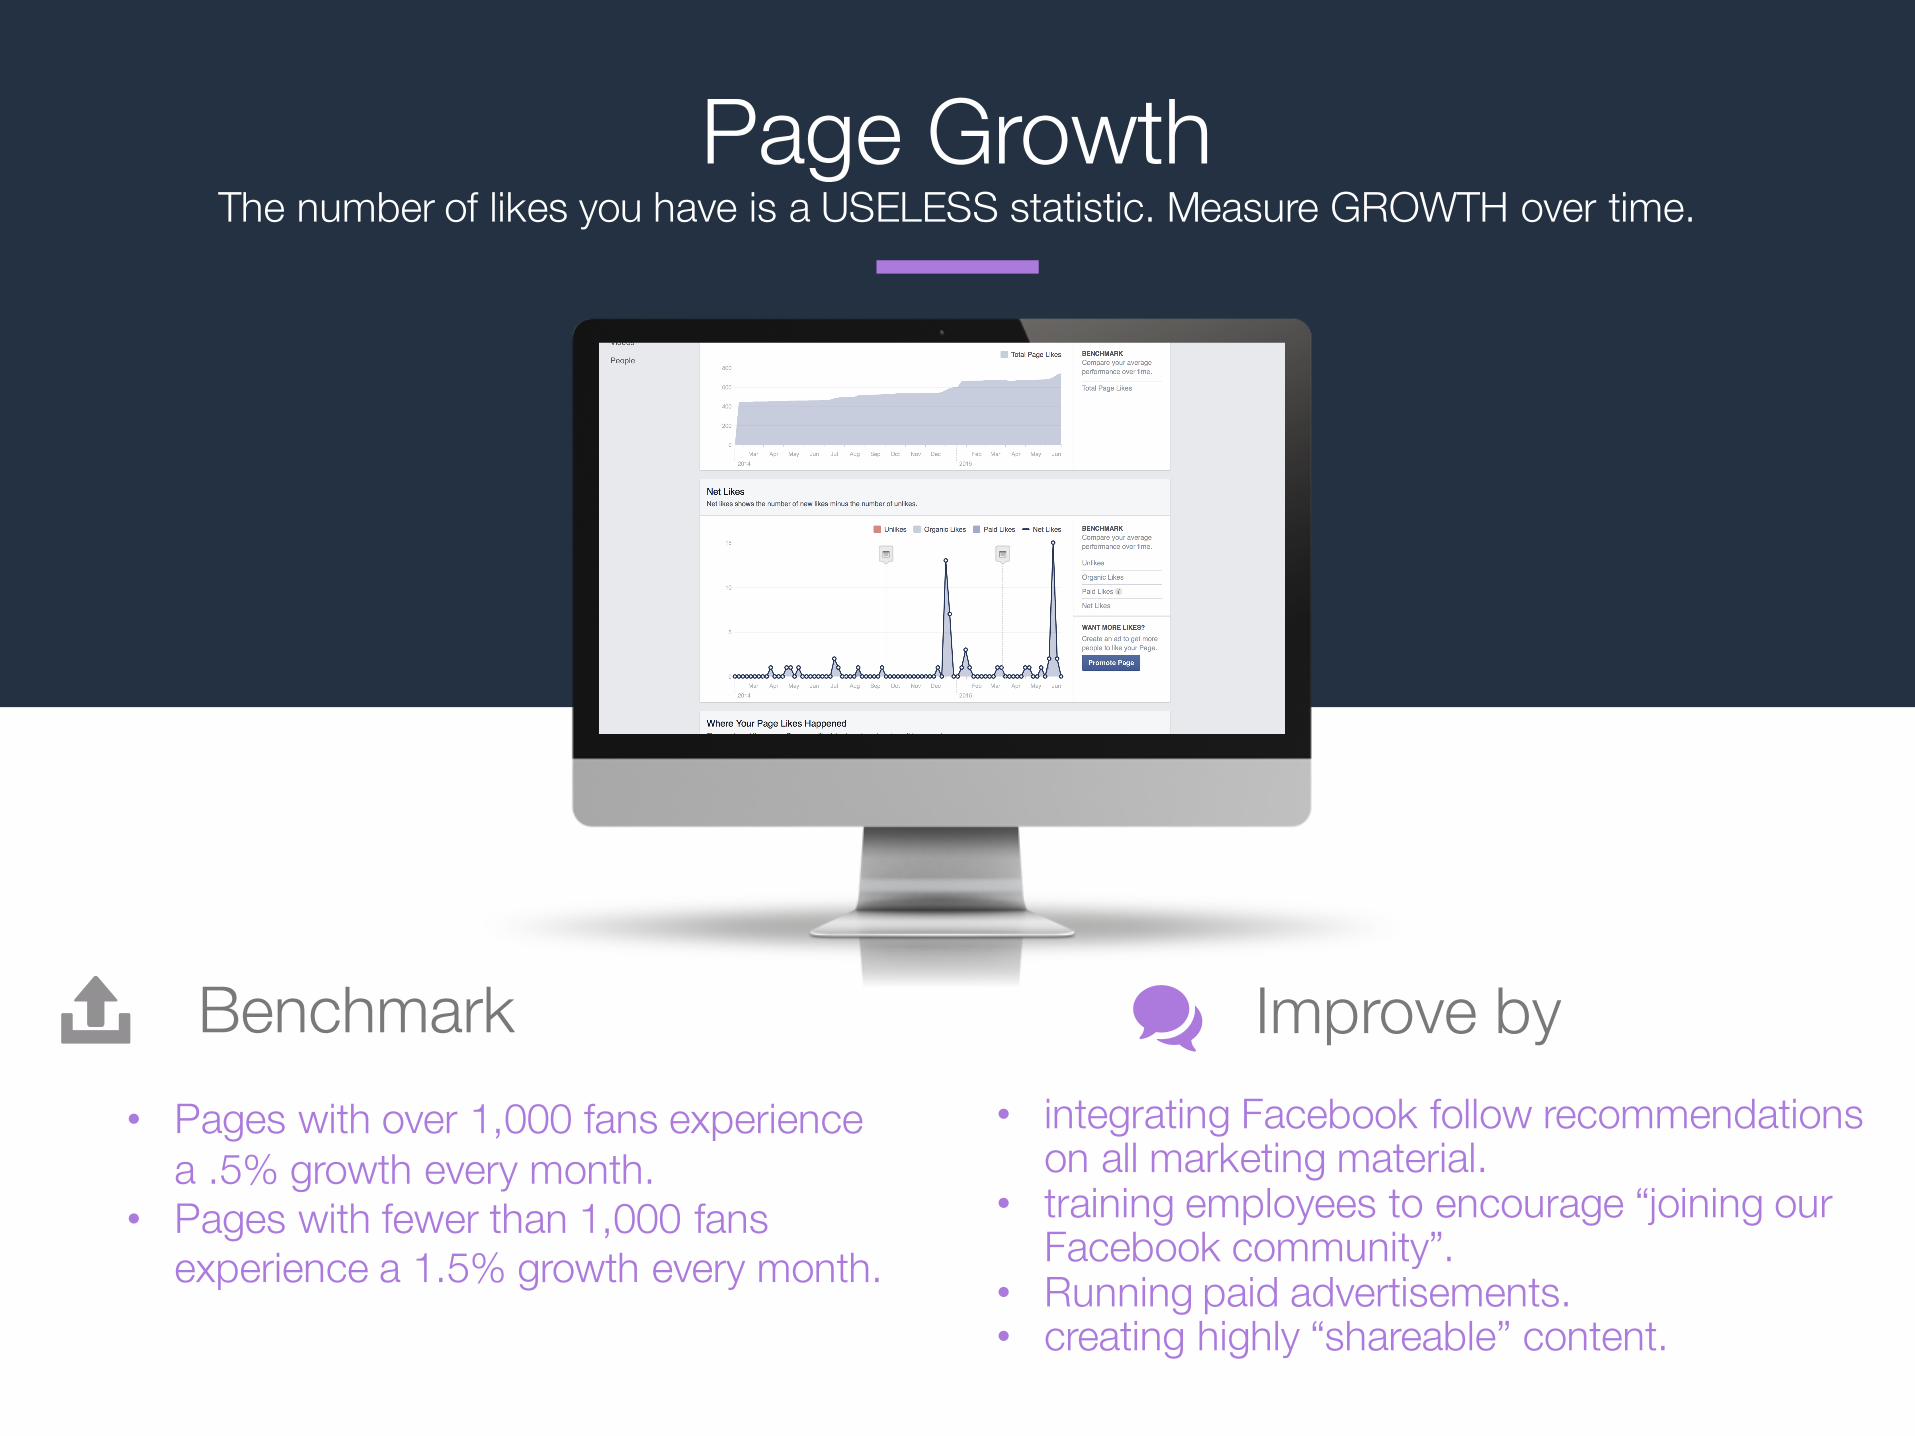
Page GrowthThe number of likes you have is a USELESS statistic. Measure GROWTH over time.
• Pages with over 1,000 fans experience a .5% growth every month.
• Pages with fewer than 1,000 fans experience a 1.5% growth every month.
Improve by• integrating Facebook follow recommendations
on all marketing material.• training employees to encourage “joining our
Facebook community”.• Running paid advertisements.• creating highly “shareable” content.
9Center for RuralEnterprise Engagement Post and Page Engagement Rate
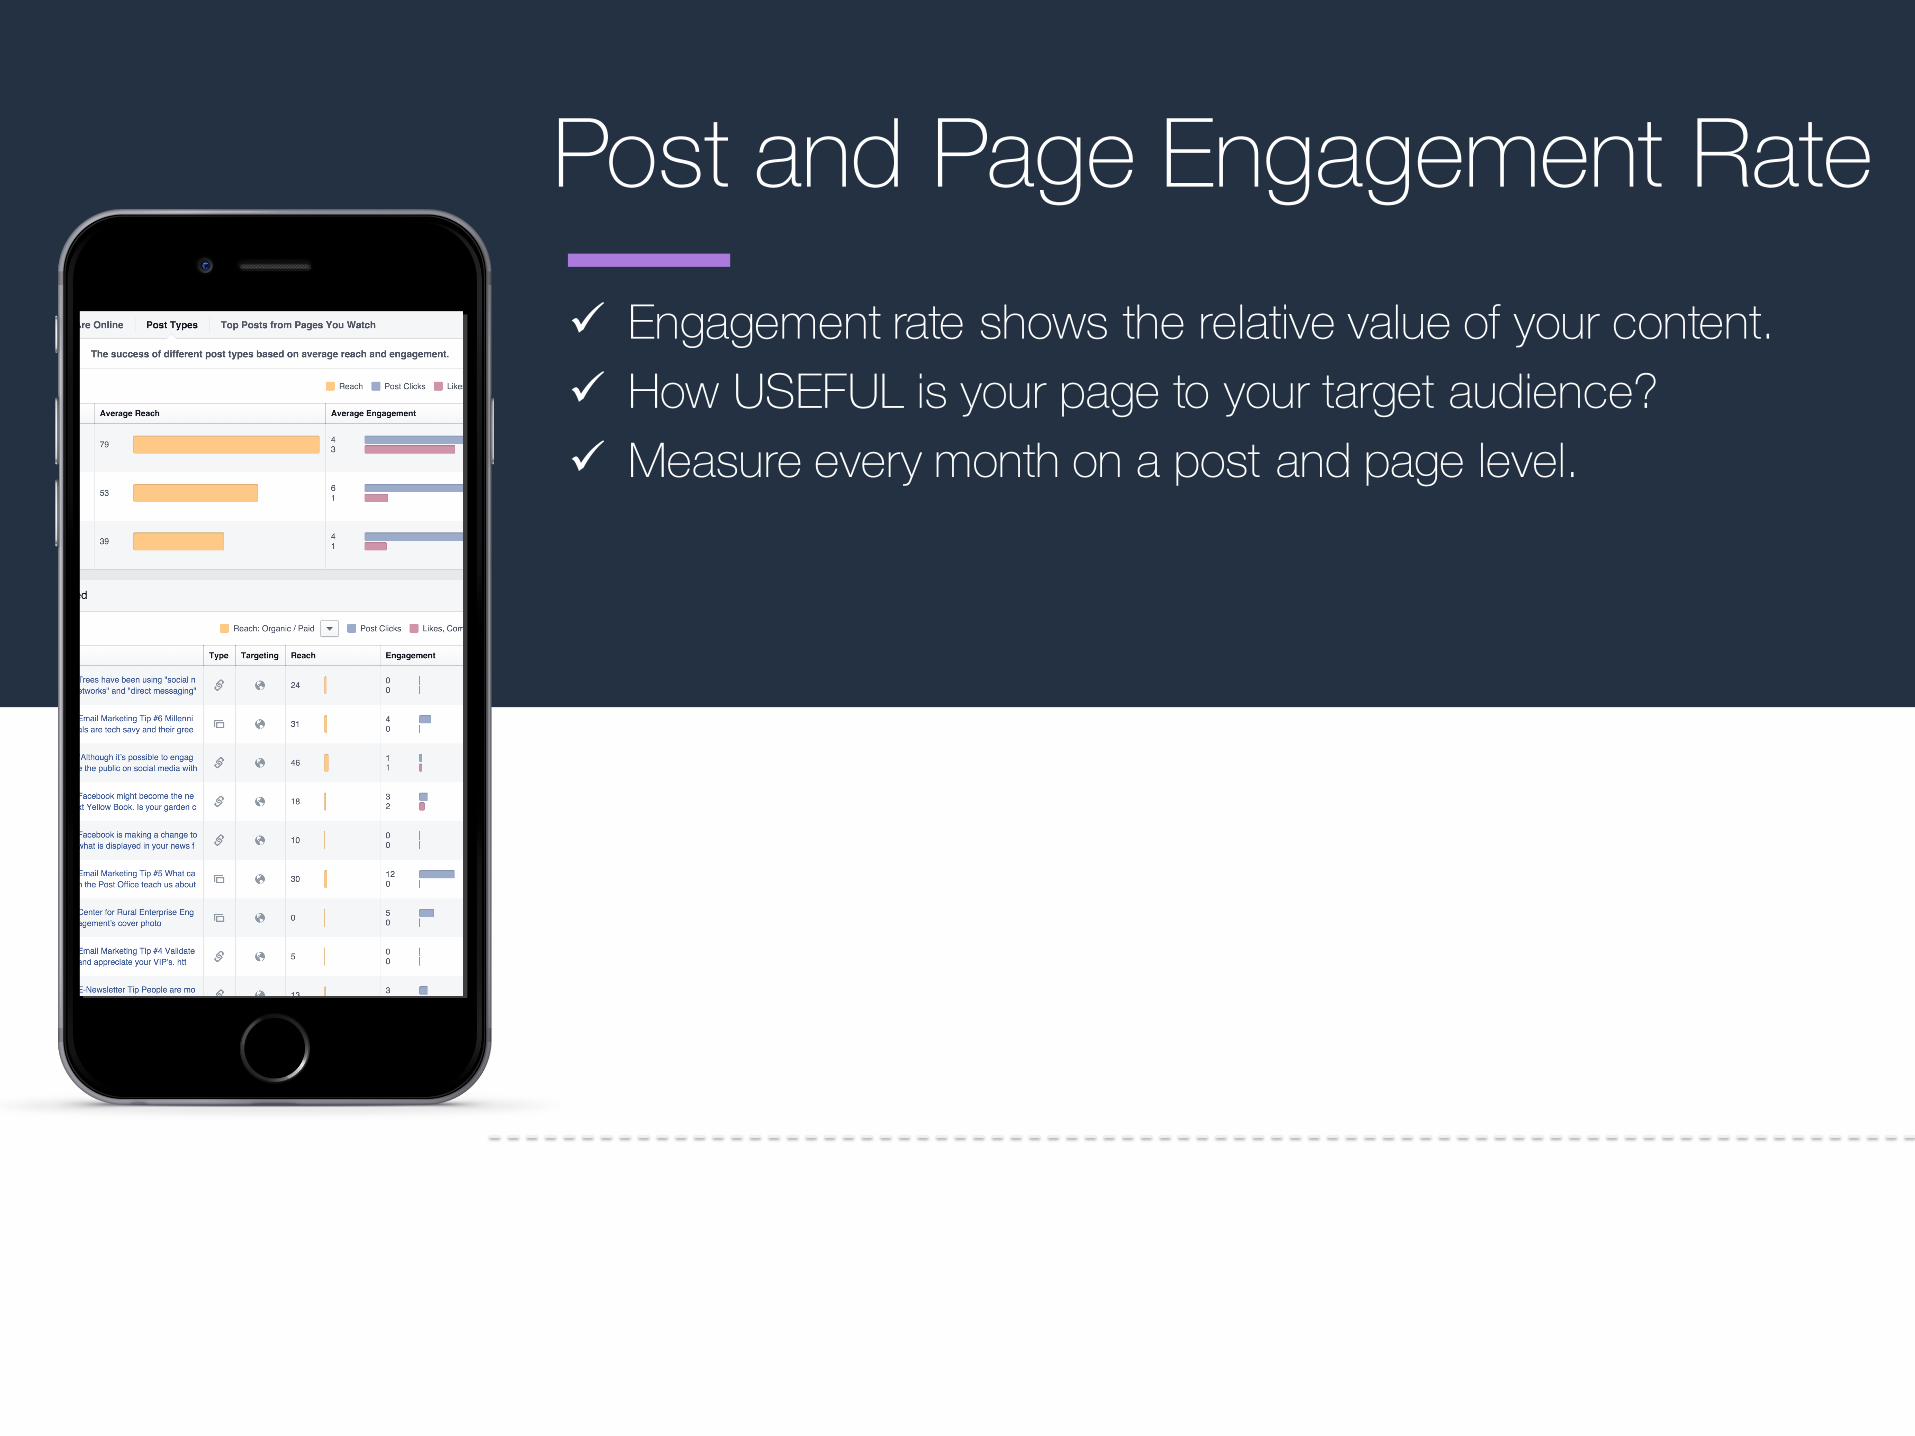
ü Engagement rate shows the relative value of your content. ü How USEFUL is your page to your target audience?ü Measure every month on a post and page level.

10Center for RuralEnterprise Engagement Post and Page Engagement Rate
ü Engagement rate shows the relative value of your content. ü How USEFUL is your page to your target audience?ü Measure every month on a post and page level.
Competitive Benchmark• Compare your engagement rate to the industry average and your
competition.• This benchmark will show you how well you engage your fans
compared to your competition.
•Formula: (Likes + Comments + Shares) / Total Fans•Industry average is between 1-2%.
11Center for RuralEnterprise Engagement Post and Page Engagement Rate
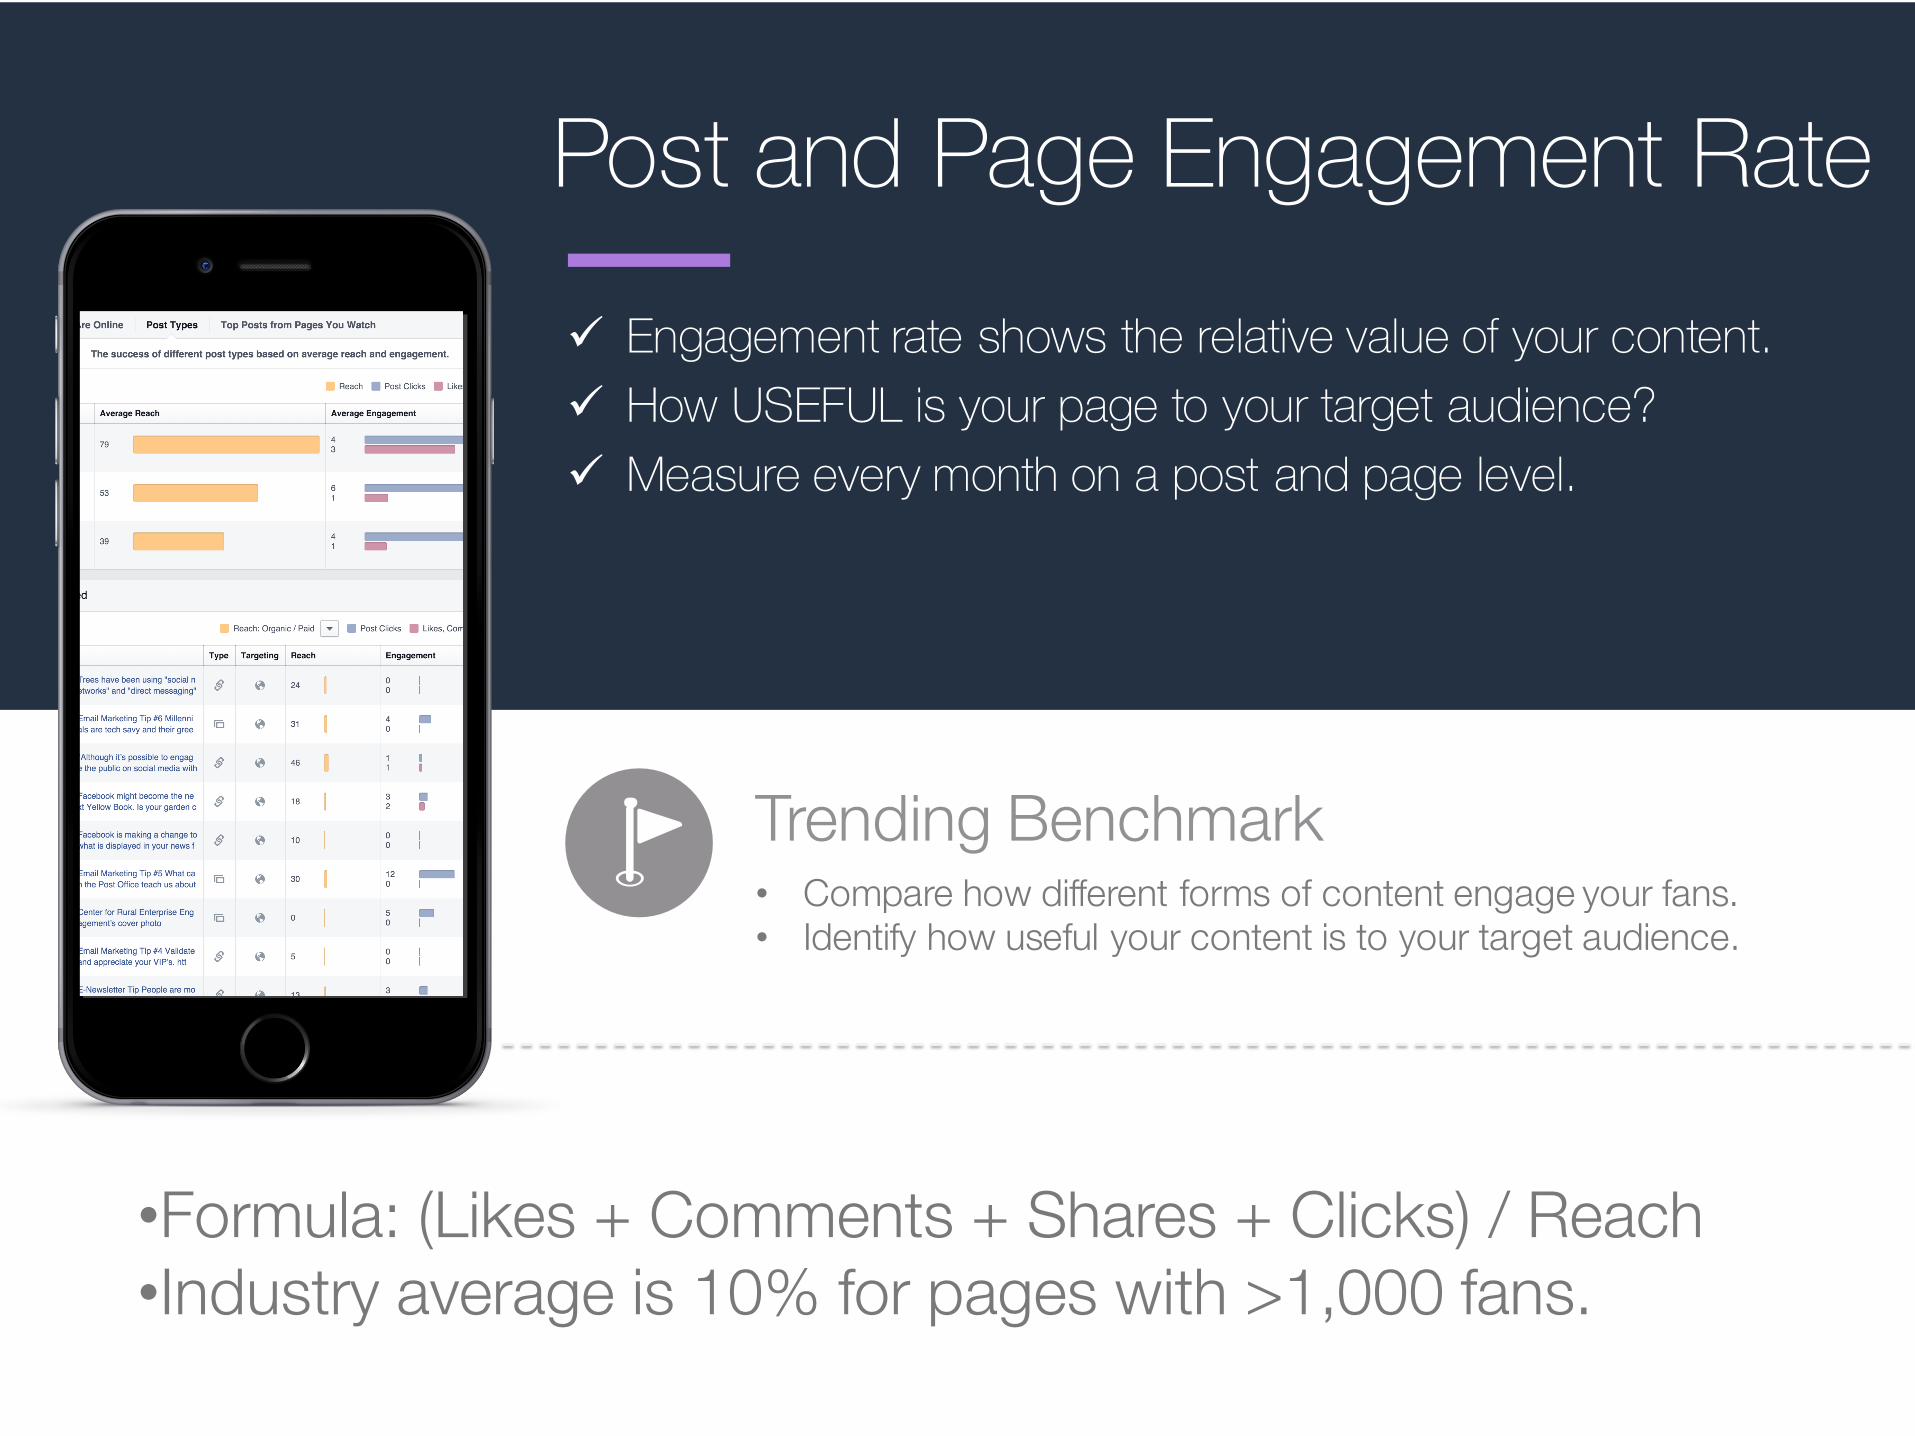
ü Engagement rate shows the relative value of your content. ü How USEFUL is your page to your target audience?ü Measure every month on a post and page level.
Trending Benchmark• Compare how different forms of content engage your fans.• Identify how useful your content is to your target audience.
•Formula: (Likes + Comments + Shares + Clicks) / Reach•Industry average is 10% for pages with >1,000 fans.
12Center for RuralEnterprise Engagement Post and Page Engagement Rate
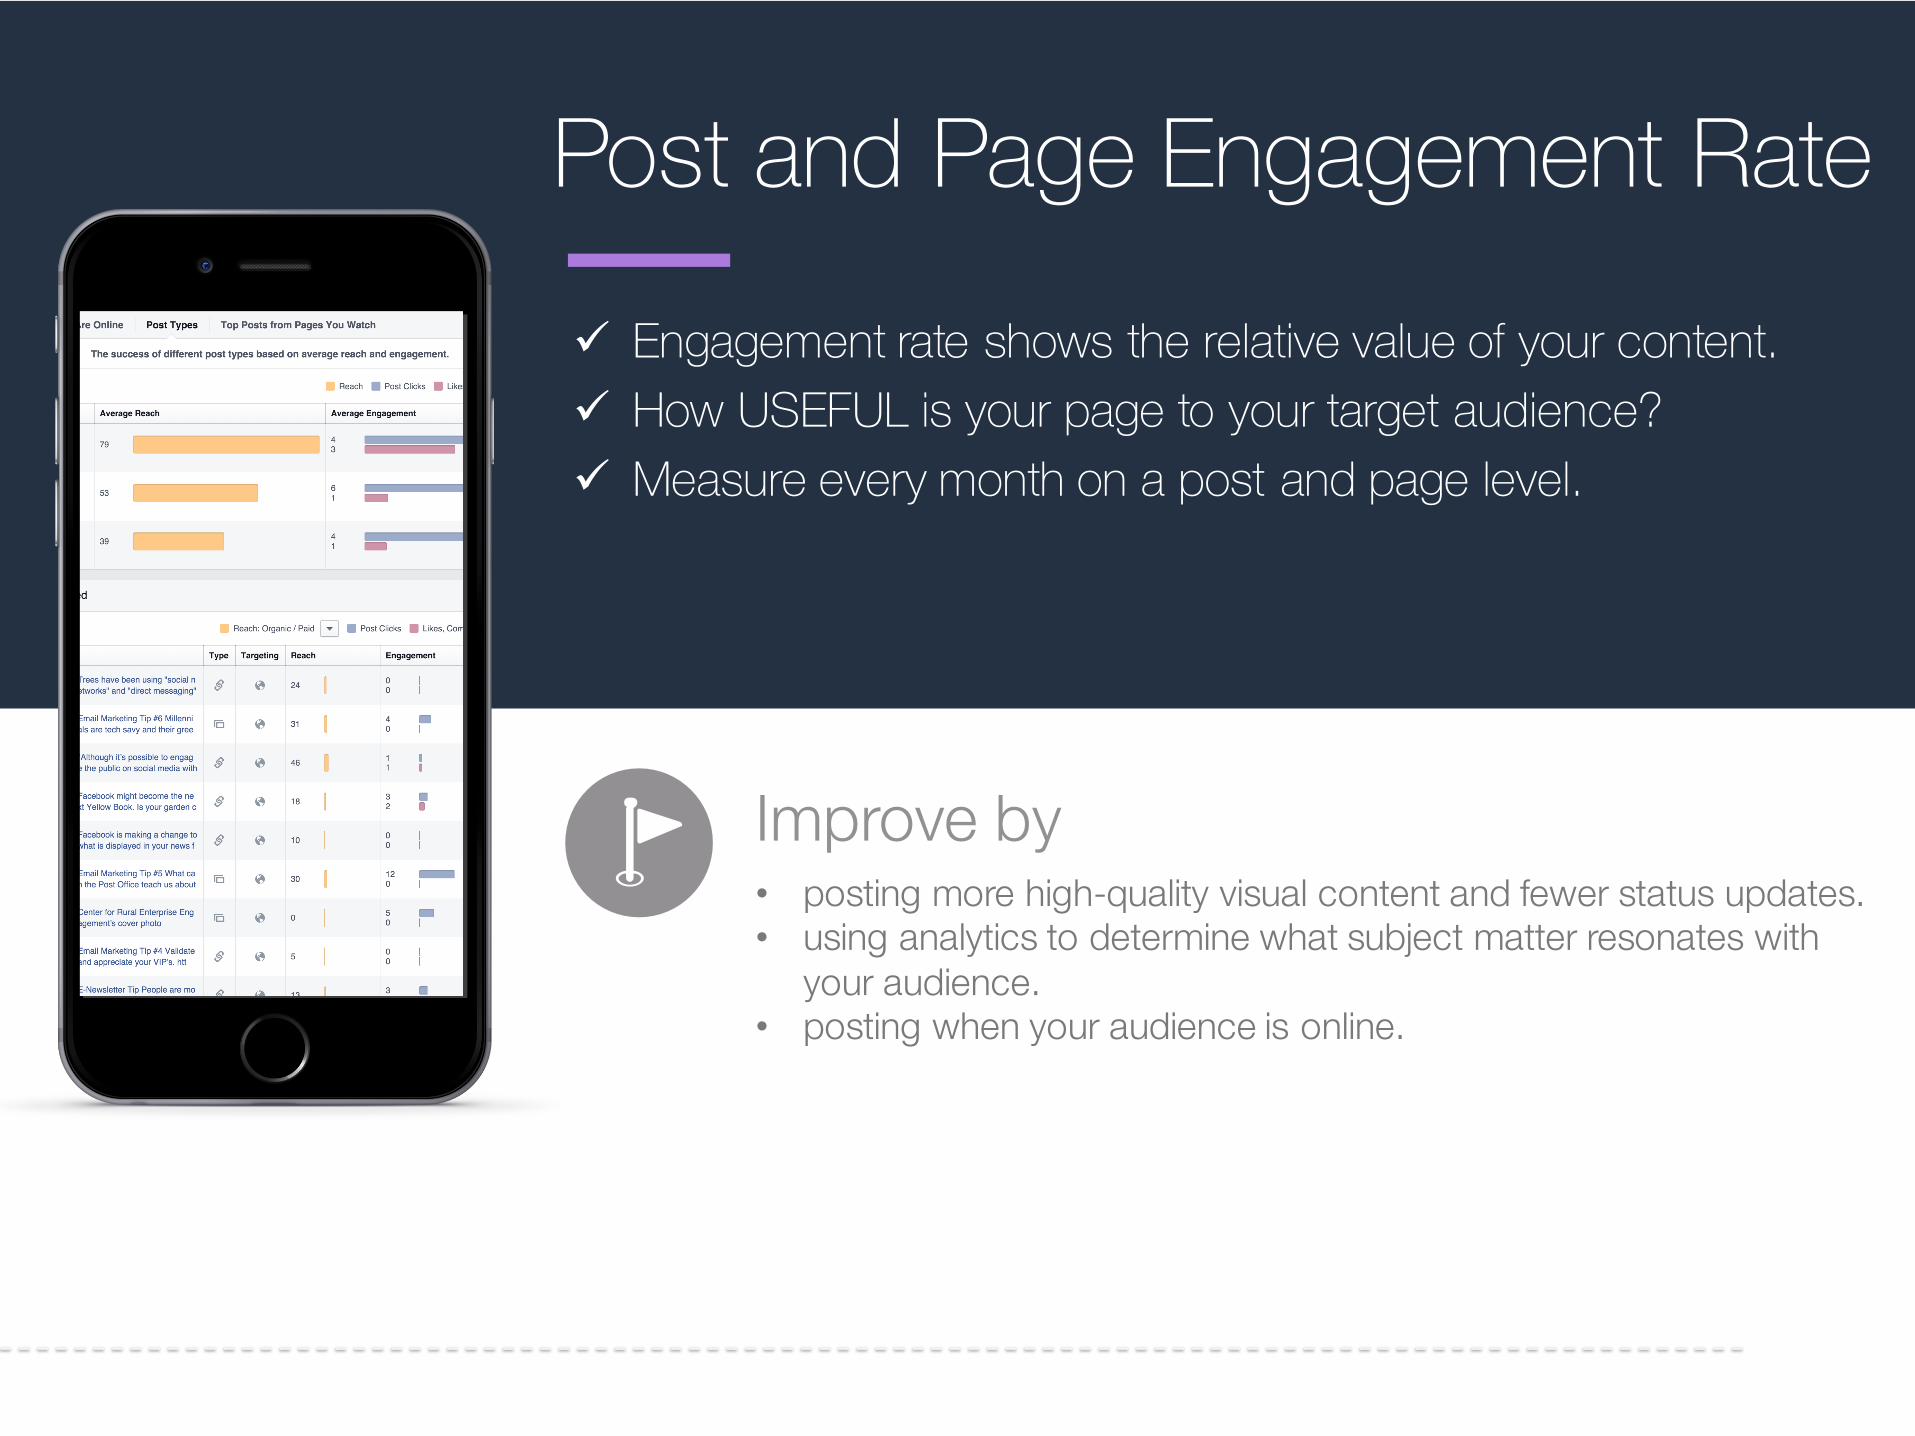
ü Engagement rate shows the relative value of your content. ü How USEFUL is your page to your target audience?ü Measure every month on a post and page level.
Improve by• posting more high-quality visual content and fewer status updates.• using analytics to determine what subject matter resonates with
your audience. • posting when your audience is online.

13Center for RuralEnterprise Engagement Finding Your Engagement Rate
Find out how to measure your engagement rate at tinyurl.com/FacebookAnalytics
14Center for RuralEnterprise Engagement
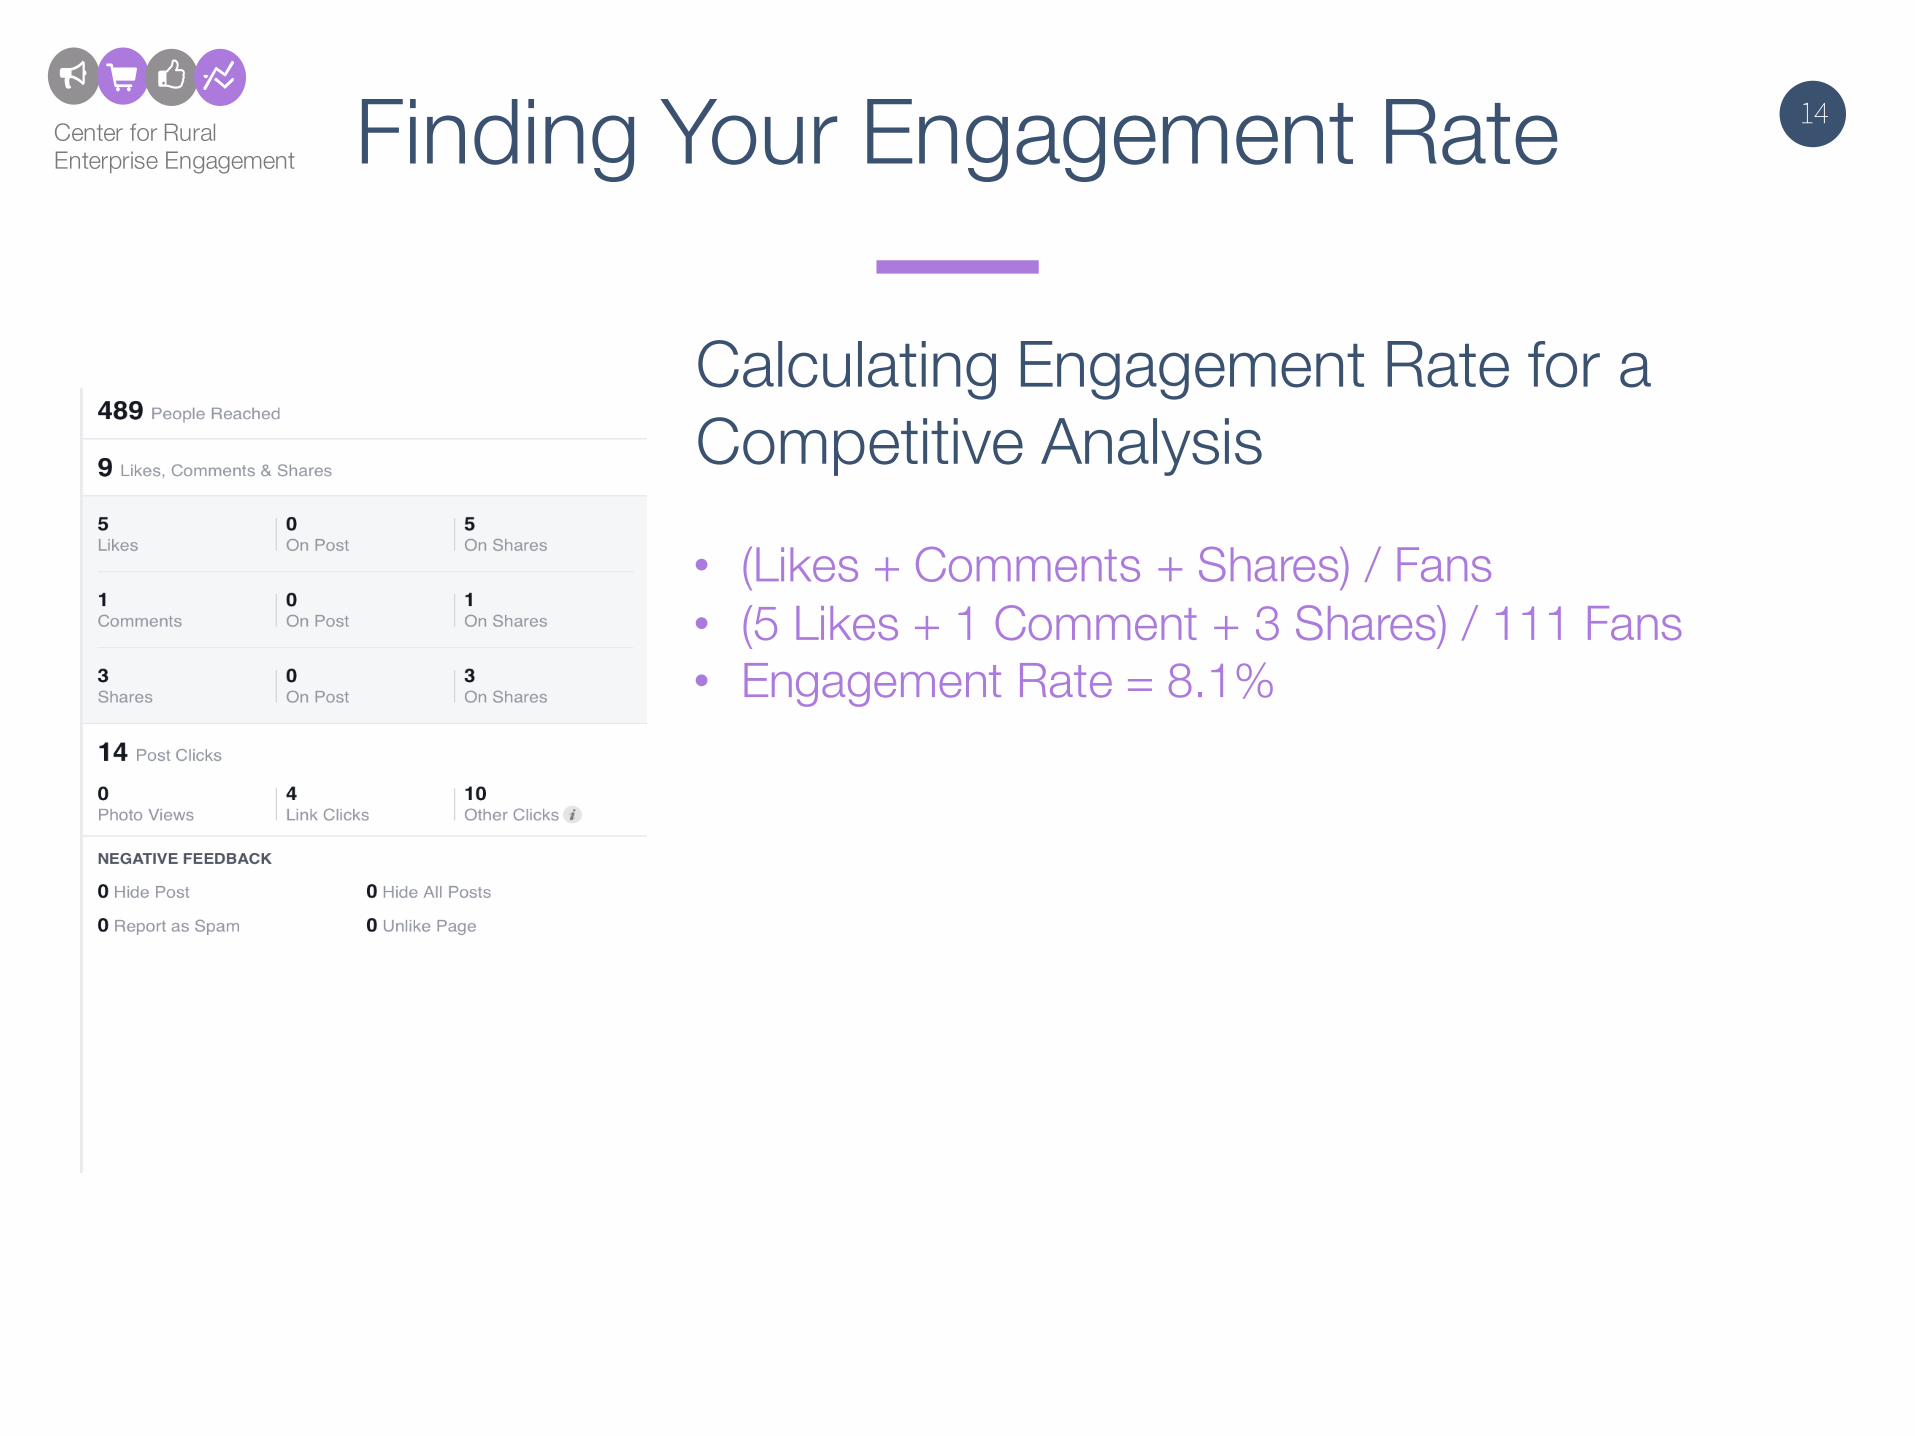
Calculating Engagement Rate for a Competitive Analysis
Finding Your Engagement Rate
• (Likes + Comments + Shares) / Fans• (5 Likes + 1 Comment + 3 Shares) / 111 Fans• Engagement Rate = 8.1%
15Center for RuralEnterprise Engagement
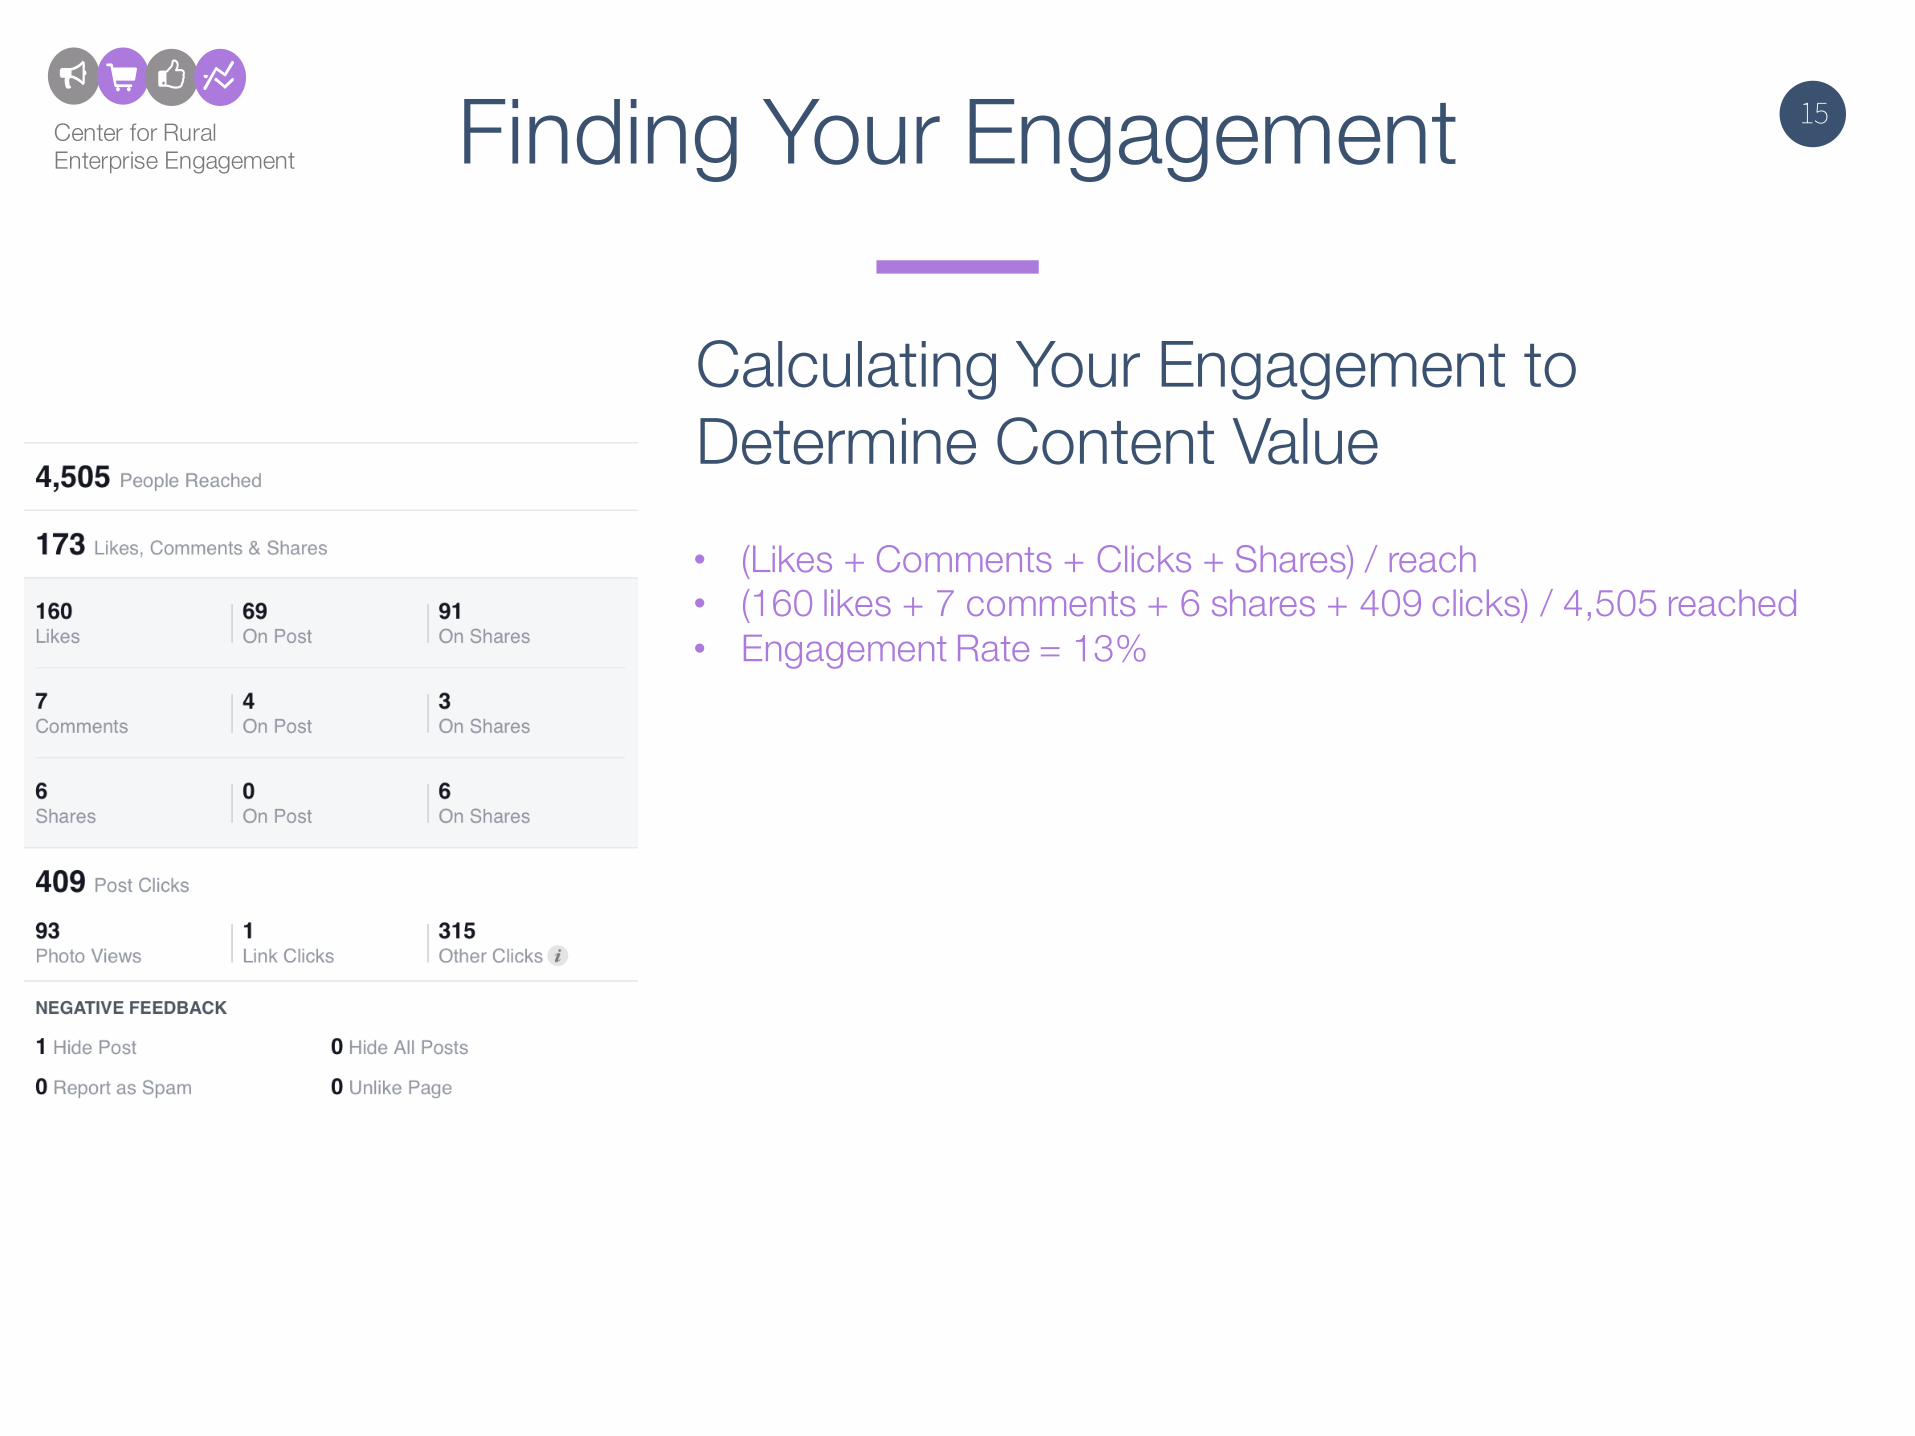
Calculating Your Engagement to Determine Content Value
Finding Your Engagement
• (Likes + Comments + Clicks + Shares) / reach• (160 likes + 7 comments + 6 shares + 409 clicks) / 4,505 reached• Engagement Rate = 13%
16Center for RuralEnterprise Engagement
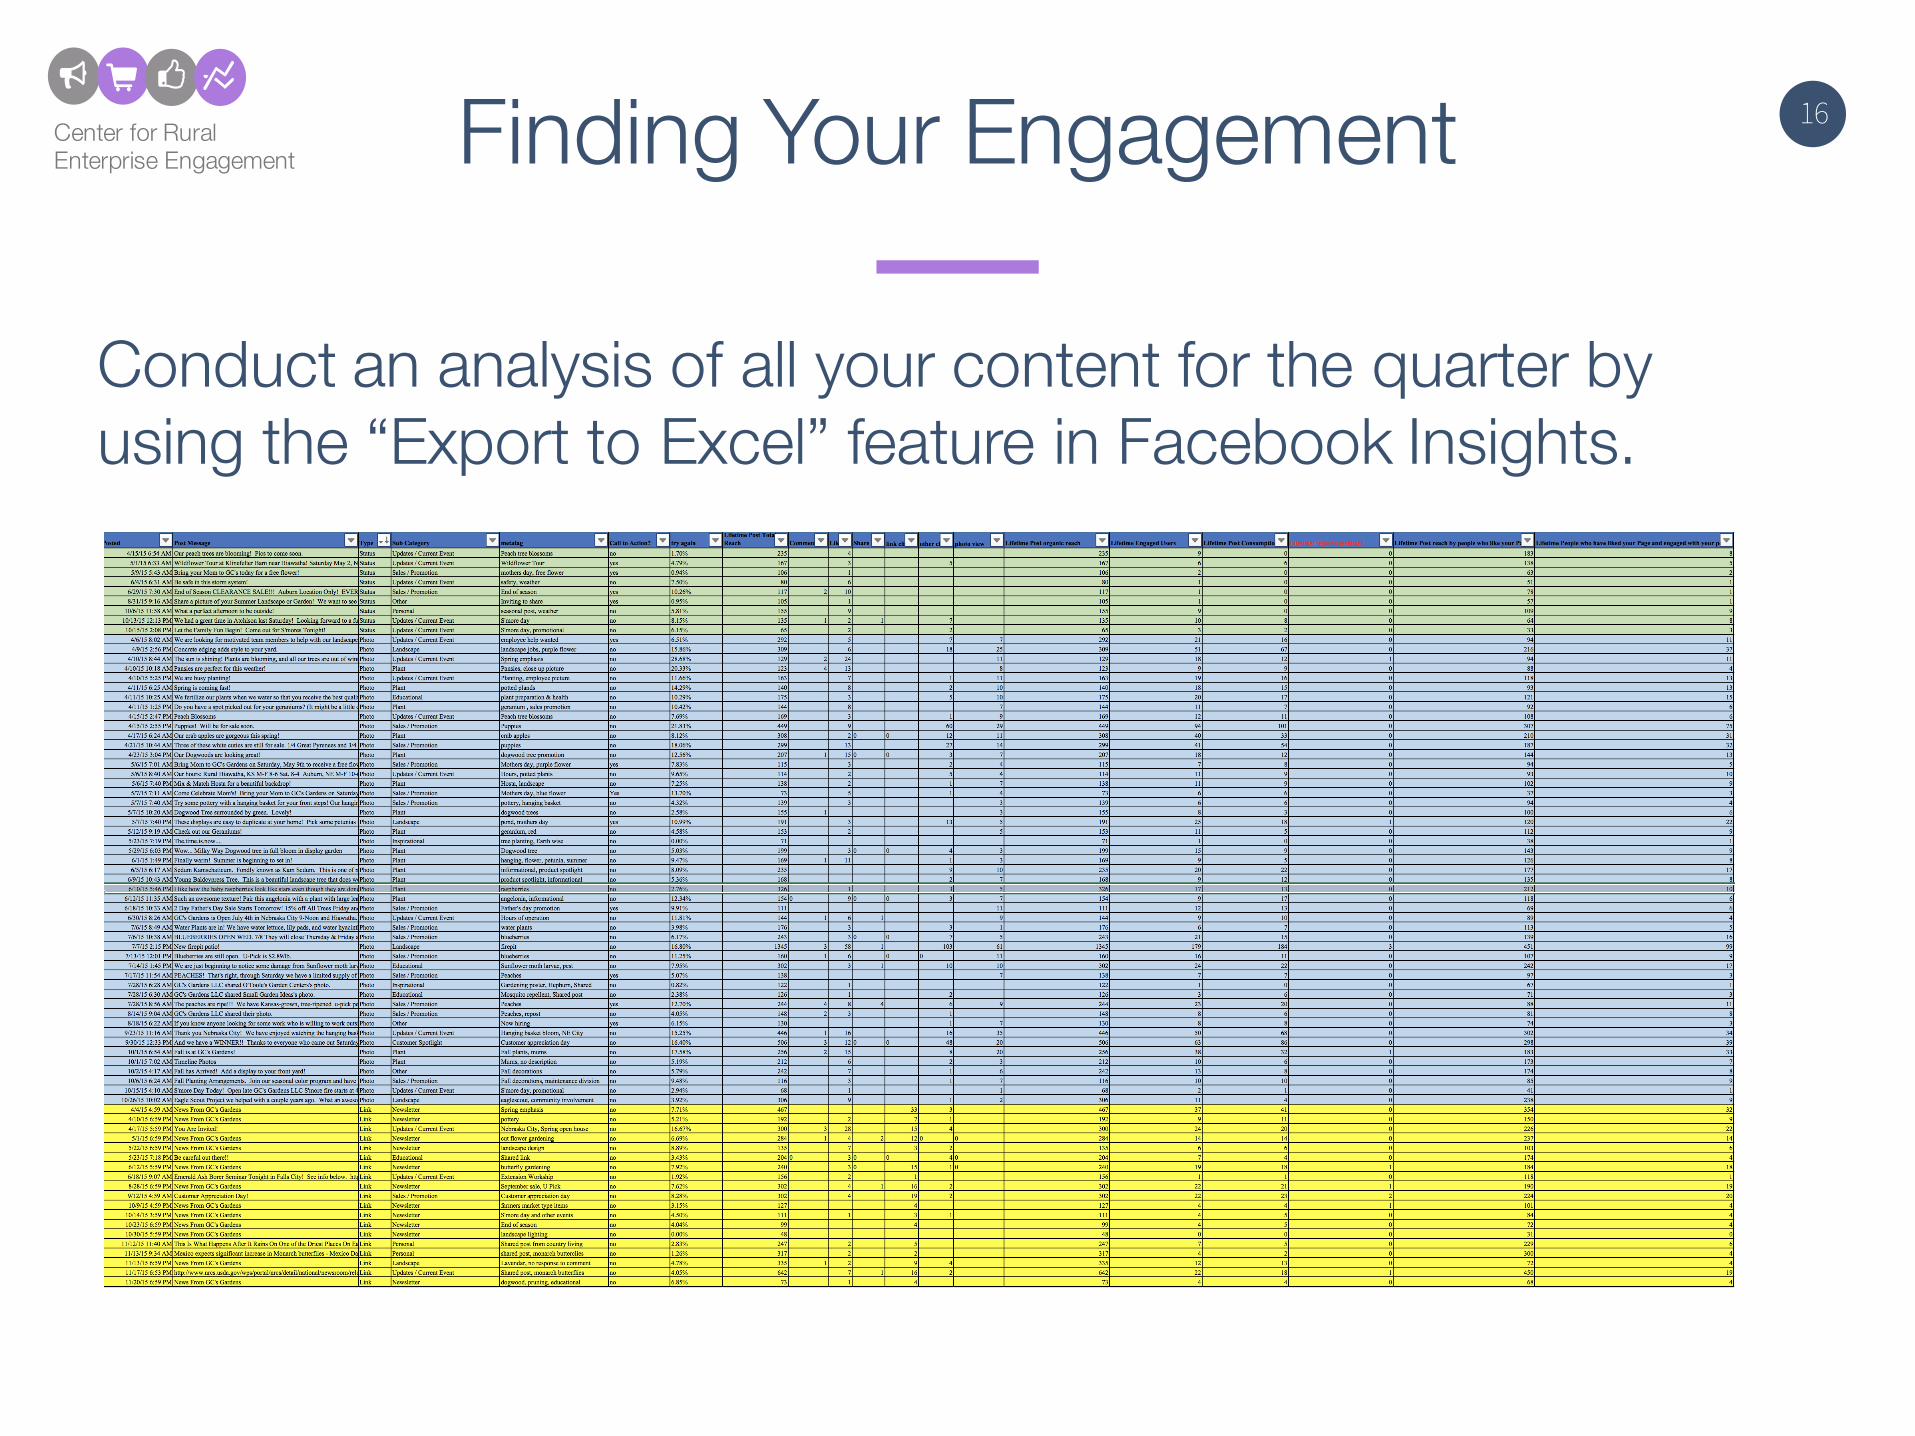
Conduct an analysis of all your content for the quarter by using the “Export to Excel” feature in Facebook Insights.
Finding Your Engagement
17Center for RuralEnterprise Engagement
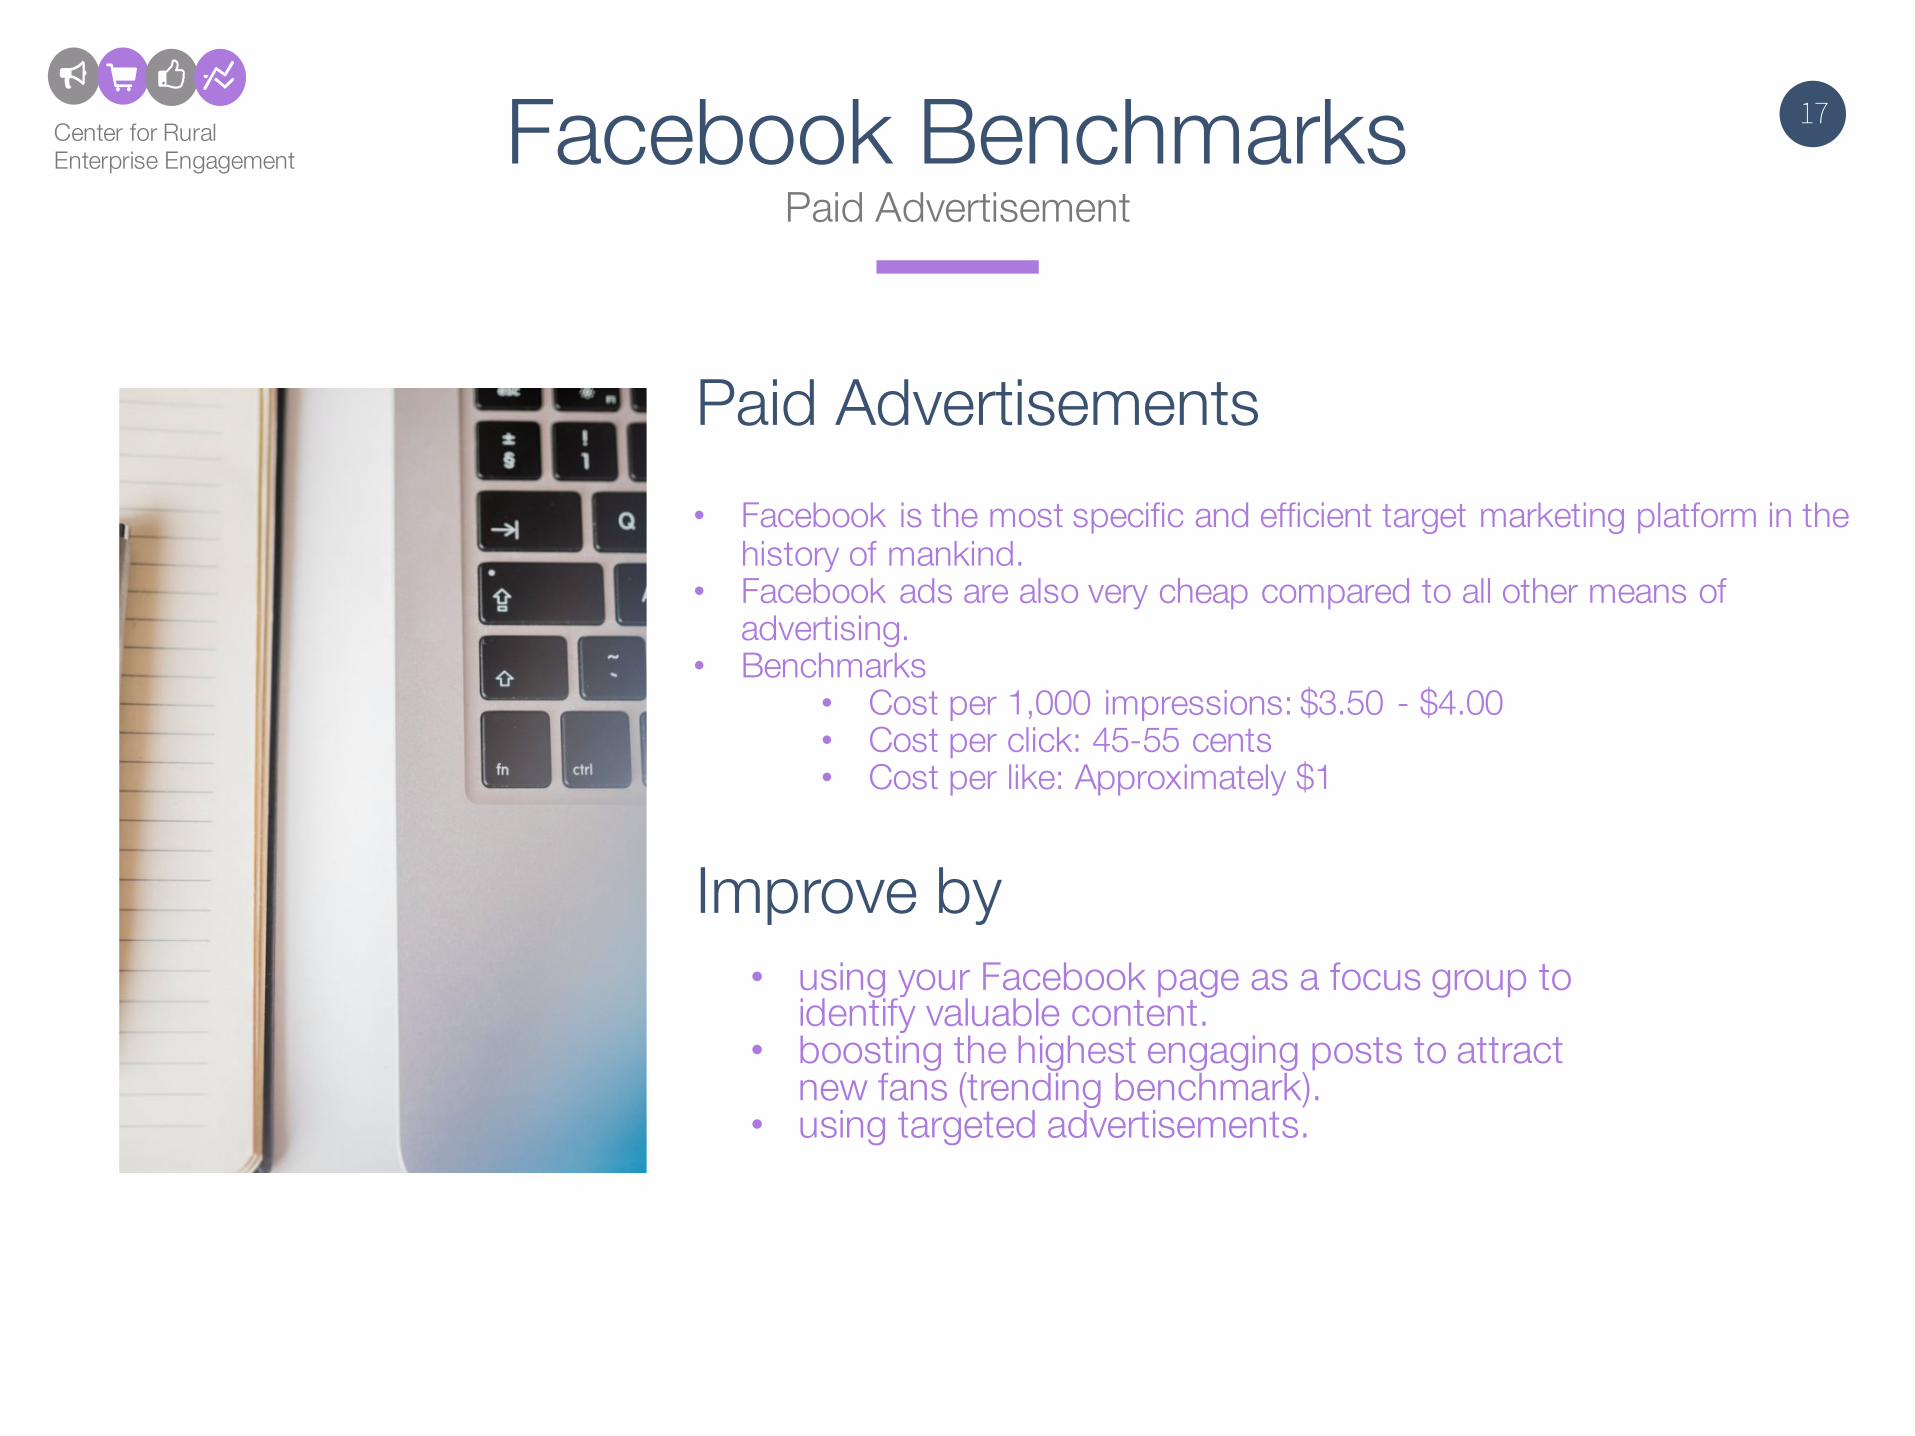
Paid Advertisements
Improve by
Facebook BenchmarksPaid Advertisement
• Facebook is the most specific and efficient target marketing platform in the history of mankind.
• Facebook ads are also very cheap compared to all other means of advertising.
• Benchmarks• Cost per 1,000 impressions: $3.50 - $4.00• Cost per click: 45-55 cents• Cost per like: Approximately $1
• using your Facebook page as a focus group to identify valuable content.
• boosting the highest engaging posts to attract new fans (trending benchmark).
• using targeted advertisements.
18Center for RuralEnterprise Engagement
E-NewslettersData-driven Benchmarks

19Center for RuralEnterprise Engagement E-Newsletter
Open Rates
Open Rate• Misleading statistic.• 20-23%
Improve by• Improving titles of emails.• Ask to be “Whitelisted”.• Clean up old email lists.
Read more about improving your newsletter at http://tinyurl.com/RETAILWORKS
20Center for RuralEnterprise Engagement E-Newsletter
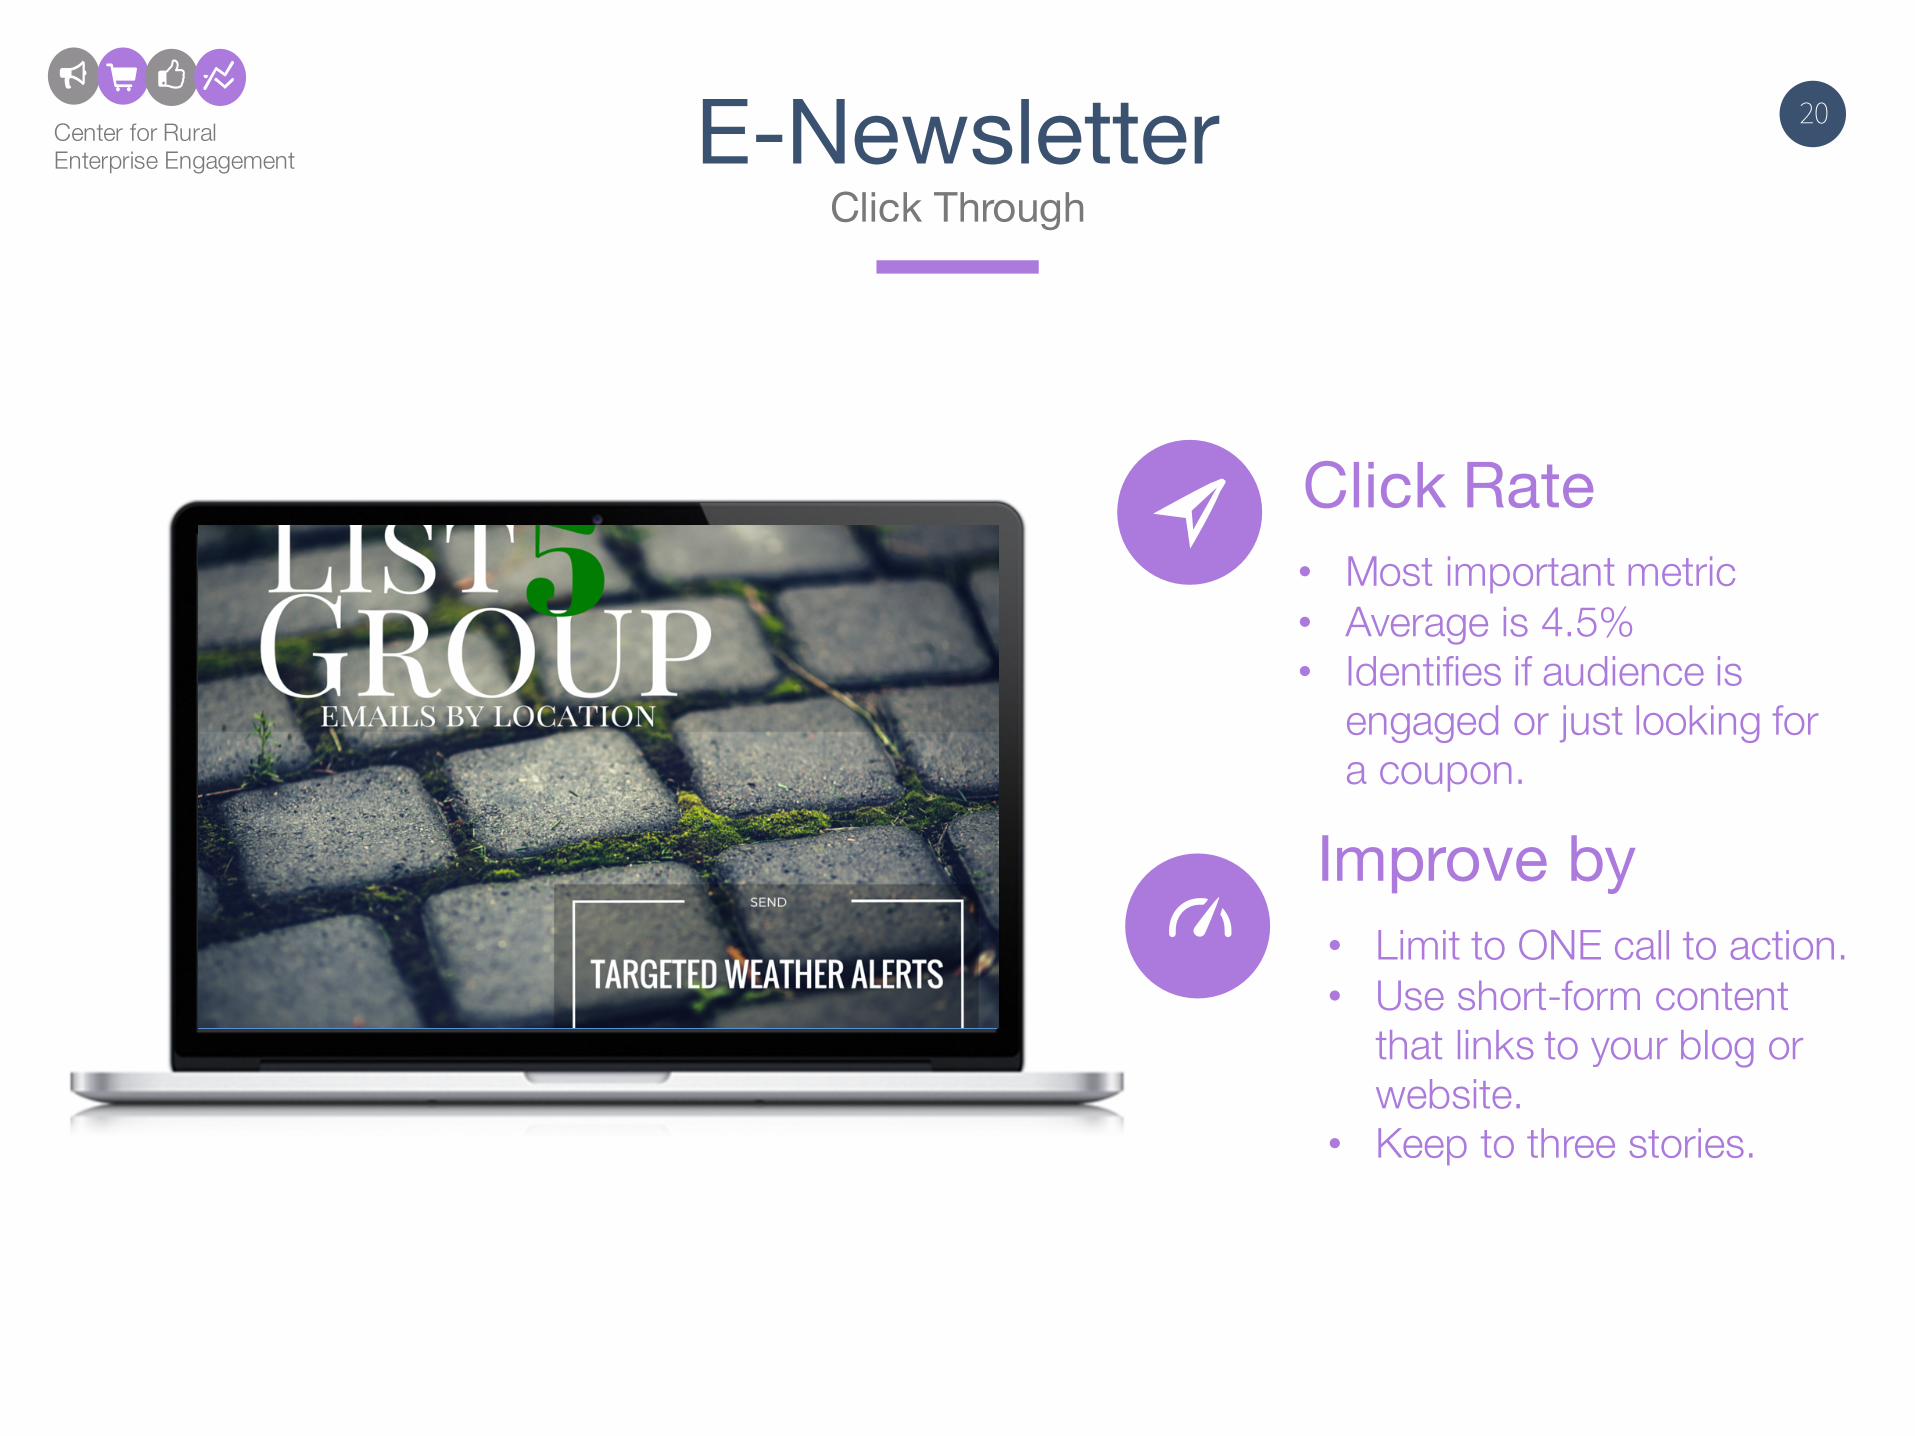
Click Through
Click Rate• Most important metric• Average is 4.5%• Identifies if audience is
engaged or just looking for a coupon.
Improve by• Limit to ONE call to action.• Use short-form content
that links to your blog or website.
• Keep to three stories.
21Center for RuralEnterprise Engagement E-Newsletter
Overall Health
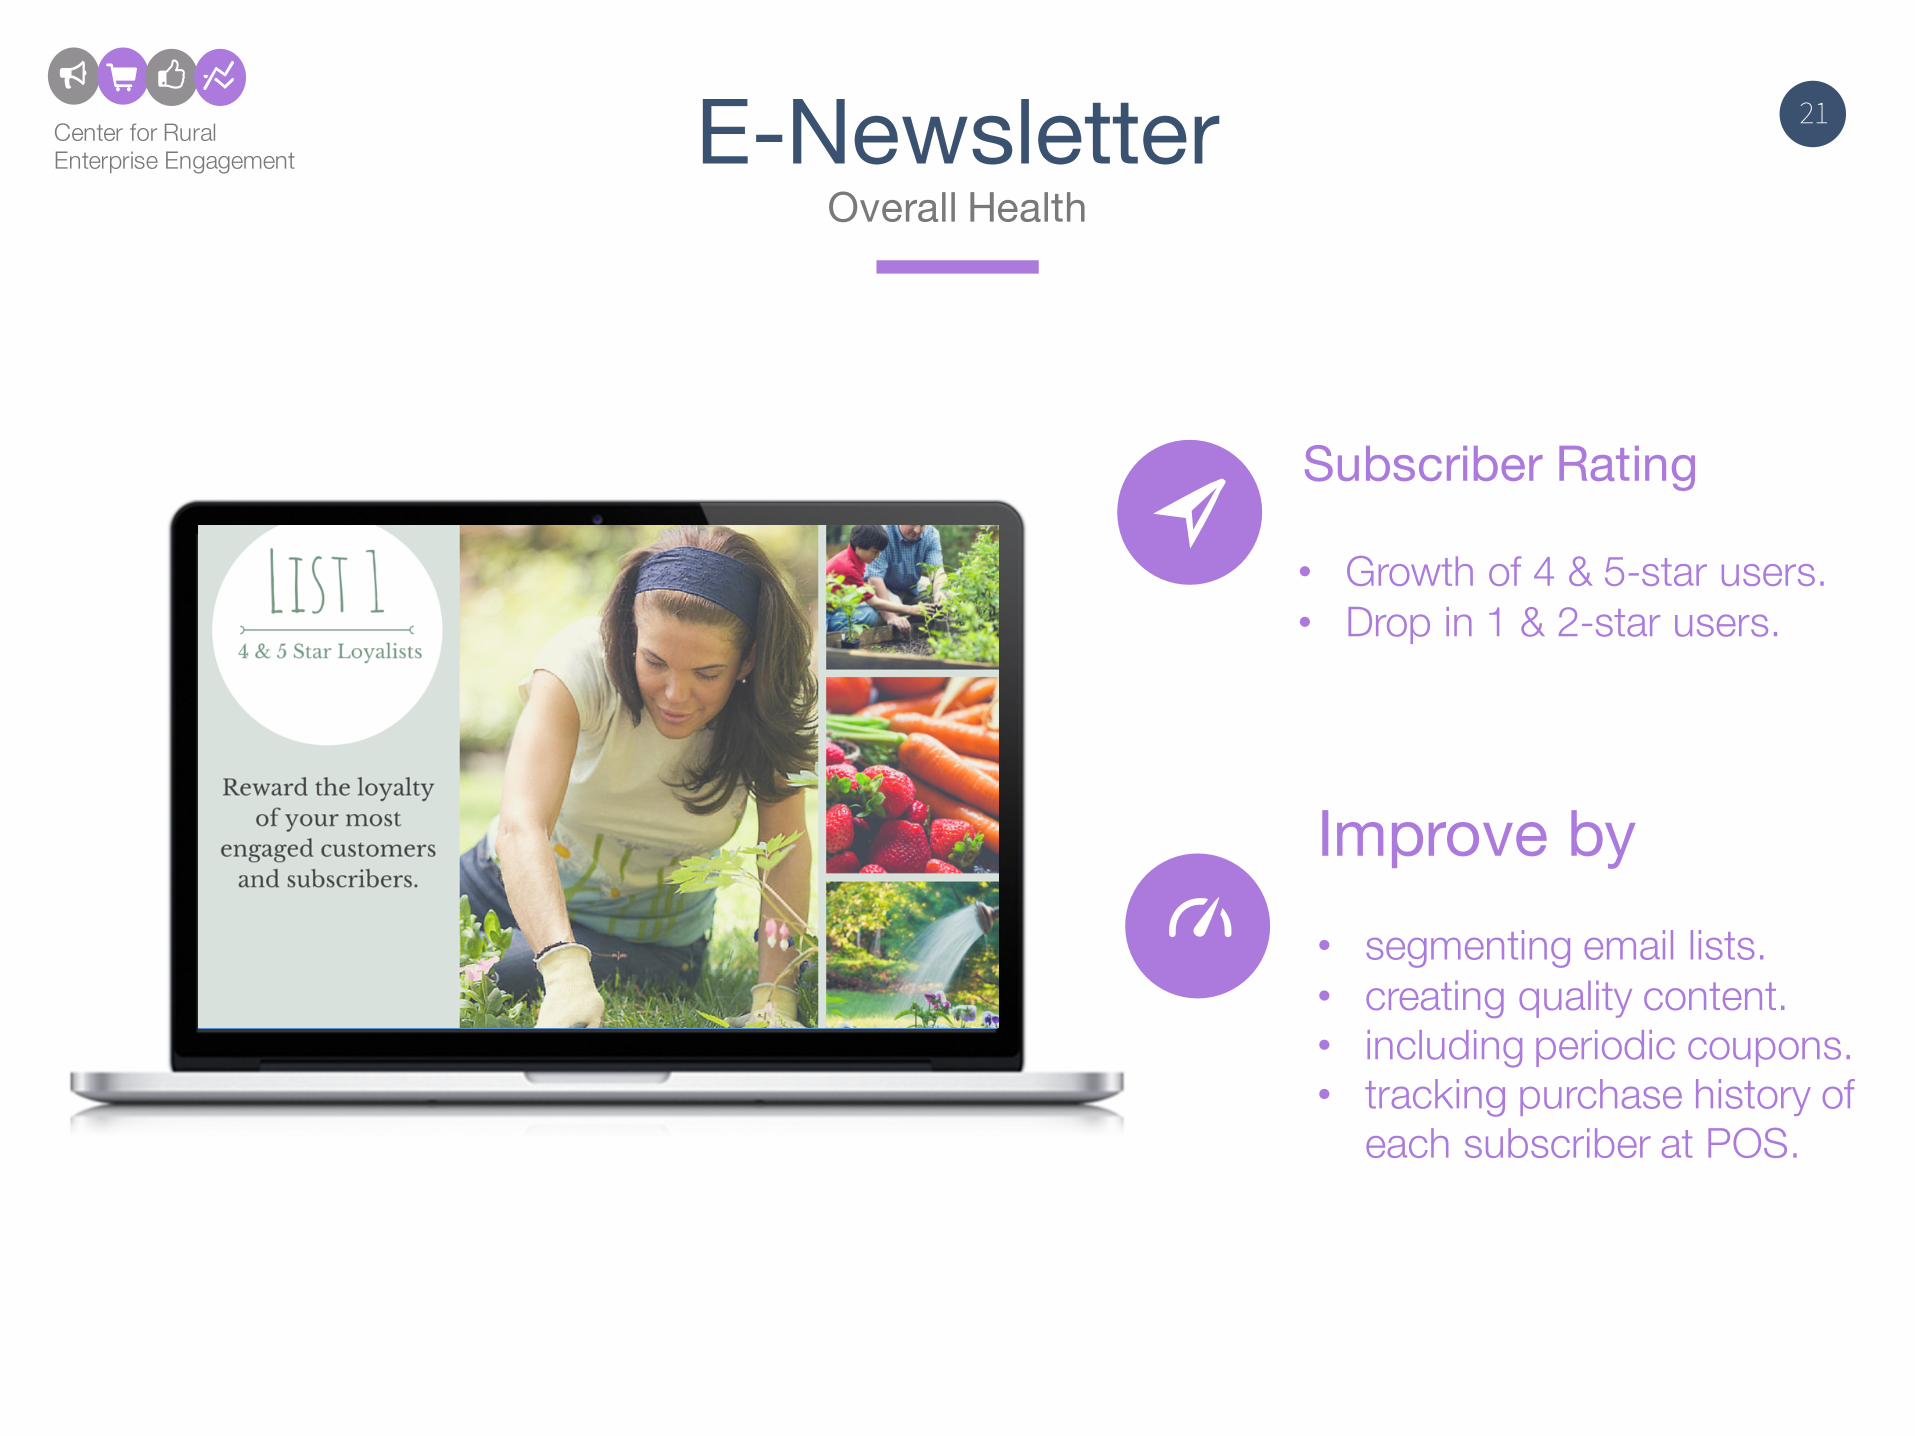
Subscriber Rating
• Growth of 4 & 5-star users.• Drop in 1 & 2-star users.
Improve by• segmenting email lists.• creating quality content.• including periodic coupons. • tracking purchase history of
each subscriber at POS.

22Center for RuralEnterprise Engagement E-Newsletter
List Growth
List Growth• Always increasing,
especially during Spring.
Improve by• including a signup at the
POS.• training employees to
collect email addresses.
23Center for RuralEnterprise Engagement
Your WebsiteData-Driven Benchmarks
24Center for RuralEnterprise Engagement Your Website
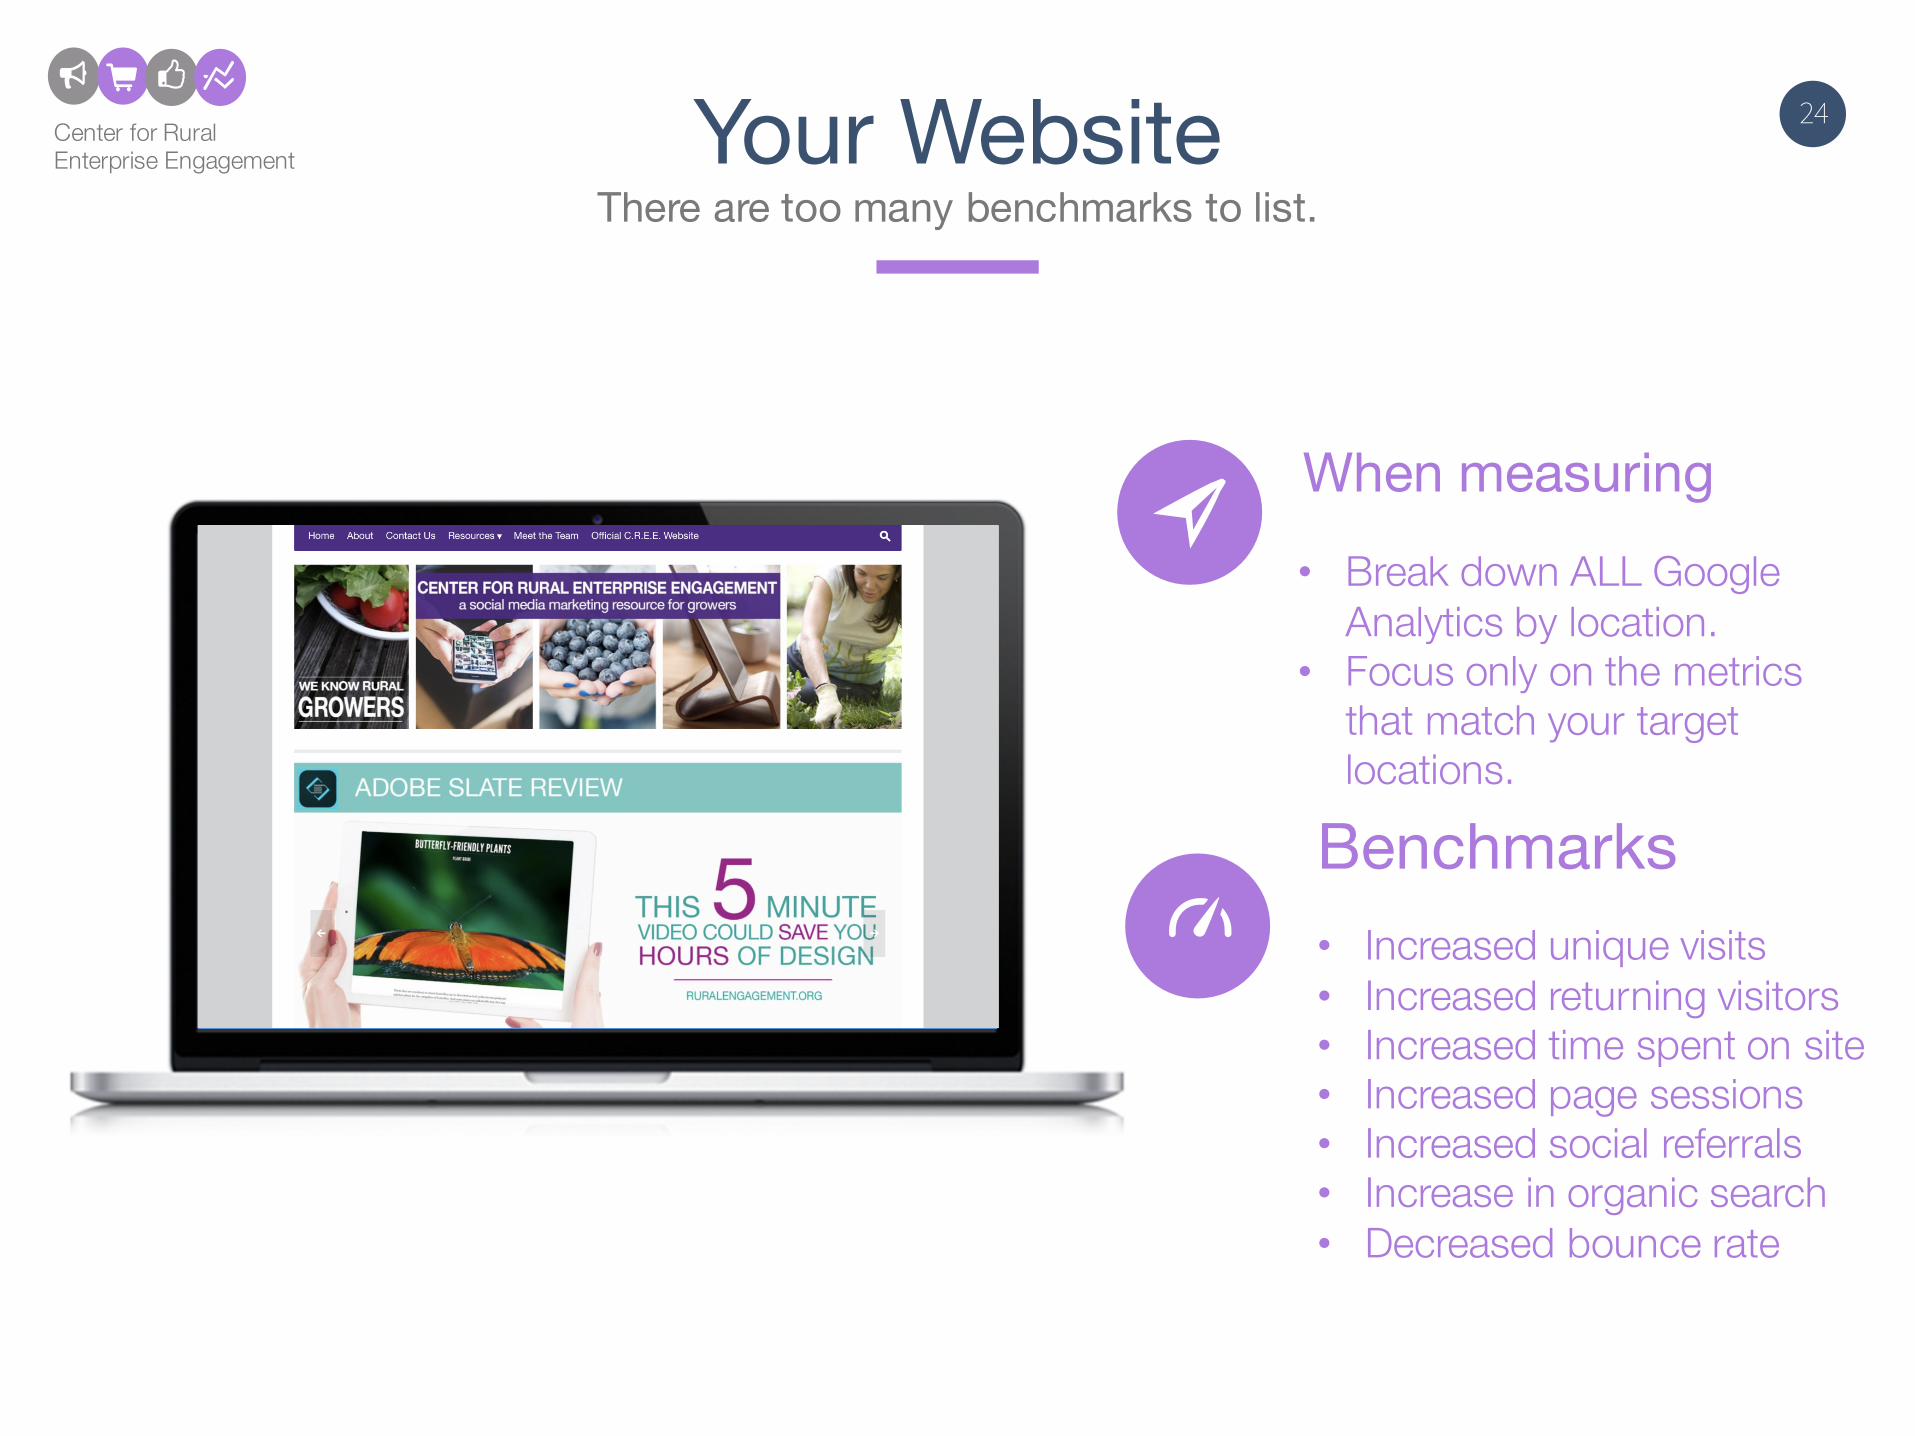
There are too many benchmarks to list.
When measuring • Break down ALL Google
Analytics by location. • Focus only on the metrics
that match your target locations.
Benchmarks• Increased unique visits• Increased returning visitors• Increased time spent on site• Increased page sessions• Increased social referrals• Increase in organic search• Decreased bounce rate
25Center for RuralEnterprise Engagement Final Suggestions
1. Establishwhatbenchmarksareimportanttoyourbusiness.
2. Identifytheappropriatemetrics.1. Startwithindustryaverages.
3. Measureroutinelyandmeasureoften.4. Usethedatatomakepositivechanges
andsetnewbenchmarks.5. Evaluateagain.
Visitourlearningresourcesandgiveusacall.We’reallinthistogether.
26Center for RuralEnterprise Engagement
785-532-1173www.k-state.edu/CREE
Learning Resourcewww.ruralengagement.org
Social MediaFacebook.com/ruralengagement
Twitter.com/ruralengagement