Embed Size (px)
Citation preview

UNITED STATES SECURITIES AND EXCHANGE COMMISSIONWashington, D.C. 20549
Form 20-Fc Registration statement pursuant to Section 12(b) or 12(g) of the Securities Exchange Act of 1934 orR Annual report pursuant to Section 13 or 15(d) of the Securities Exchange Act of 1934 For the Fiscal Year Ended December 31, 2010 orc Transition report pursuant to Section 13 or 15(d) of the Securities Exchange Act of 1934 For the transition period from/to orc Shell company report pursuant to Section 13 or 15(d) of the Securities Exchange Act of 1934 Date of event requiring this shell company report:
Commission file number 000–12033
TELEFONAKTIEBOLAGET LM ERICSSON (Exact Name of Registrant as Specified in Its Charter)
LM ERICSSON TELEPHONE COMPANY(Translation of Registrant’s Name Into English)
Kingdom of Sweden(Jurisdiction of Incorporation or Organization)
SE-164 83 Stockholm, Sweden(Address of Principal Executive Offices)
Roland Hagman, Vice President Group Function Financial Control Telephone: +46 8 719 53 80, Facsimile: +46 8 719 42 22 SE-164 83 Stockholm, Sweden(Name, Telephone, E-mail and/or Facsimile Number and Address of Company Contact Person)
Securities registered or to be registered pursuant to Section 12(b) of the Act:Title of Each Class Name of Each Exchange on Which registered
American Depositary Shares The NASDAQ Stock Market LLCB Shares * The NASDAQ Stock Market LLC
* Not for trading, but only in connection with the registration of the American Depositary Shares representing such B Shares pursuant to the requirements of the Securities and Exchange Commission
Securities registered pursuant to Section 12(g) of the Act: None
Securities for which there is a reporting obligation pursuant to Section 15(d) of the Act: None
Indicate the number of outstanding shares of each of the issuer’s classes of capital or common stock as of the close of the period covered by the Annual Report:B shares (SEK 5.00 nominal value) 3,011,595,752A shares (SEK 5.00 nominal value) 261,755,983C shares (SEK 1.00 nominal value) 0
Indicate by check mark if the registrant is a well-seasoned issuer, as defined in Rule 405 of the Securities Act. Yes P No
If this report is an annual or transition report, indicate by check mark if the registrant is not required to file reports pursuant to Section 13 or 15(d) of the Securities Exchange Act of 1934. Yes No PIndicate by check mark whether the registrant: (1) has filed all reports required to be filed by Section 13 or 15(d) of the Securities Exchange Act of 1934 during the preceding 12 months (or for such shorter period that the registrant was required to file such reports), and (2) has been subject to such filing requirements for the past 90 days. Yes P No
Indicate by check mark whether the registrant has submitted electronically and posted on its corporate Web site, if any, every Interactive Data File required to be submitted and posted pursuant to Rule 405 of Regulation S-T (§232.405 of this chapter) during the preceding 12 months (or for such shorter period that the registrant was required to submit and post such files). Yes No
Indicate by check mark whether the registrant is a large accelerated filer, an accelerated filer, or a non-accelerated filer. See definition of “accelerated filer” and “large accelerated filer” in Rule 12b-2 of the Exchange Act.
P Large accelerated filer Accelerated filer Non-accelerated filer
Indicate by check mark which basis of accounting the registrant has used to prepare the financial statements included in this filing:
US GAAP International Financial Reporting Standards as issued by the International Accounting Standards Board P Other
Indicate by check mark which financial statement item the registrant has elected to follow. Item 17 P Item 18
Indicate by check mark whether the registrant is a shell company (as defined in Rule 12b-2 of the Exchange Act). Yes No P

ContentsForm 20-F 2010 Cross reFerenCe Table........................................................................................................................................................................................................ i
leTTer From The Ceo........................................................................................................................................................................................................................................................ 1
our business............................................................................................................................................................................................................................................................................ 2
our soluTions......................................................................................................................................................................................................................................................................... 3
our asseTs.................................................................................................................................................................................................................................................................................. 8
2010 highlighTs....................................................................................................................................................................................................................................................................... 9
Five-Year summarY.......................................................................................................................................................................................................................................................... 10
share inFormaTion.......................................................................................................................................................................................................................................................... 11
leTTer From The Chairman.................................................................................................................................................................................................................................... 15
board oF direCTors’ reporT............................................................................................................................................................................................................................... 16
reporT oF independenT regisTered publiC aCCounTing Firm....................................................................................................................................... 41
ConsolidaTed FinanCial sTaTemenTs.......................................................................................................................................................................................................... 42
noTes To The ConsolidaTed FinanCial sTaTemenTs.................................................................................................................................................................... 46
risk FaCTors........................................................................................................................................................................................................................................................................... 99
Forward-looking sTaTemenTs....................................................................................................................................................................................................................... 105
remuneraTion reporT.............................................................................................................................................................................................................................................. 106
CorporaTe governanCe reporT 2010....................................................................................................................................................................................................... 111
unCerTainTies in The FuTure............................................................................................................................................................................................................................. 134
managemenT’s reporT on inTernal ConTrol over FinanCial reporTing...................................................................................................... 135
supplemenTal inFormaTion................................................................................................................................................................................................................................ 136
shareholder inFormaTion.................................................................................................................................................................................................................................. 148
glossarY................................................................................................................................................................................................................................................................................. 149
FinanCial TerminologY........................................................................................................................................................................................................................................... 150
signaTures.............................................................................................................................................................................................................................................................................151

Ericsson Annual Report on Form 20-F 2010 | i
Form 20-F 2010 Cross reFerenCe tableOur Annual Report on Form 20-F consists of the English version of our Swedish Annual Report for 2010, with certain adjustments made to comply with U.S. requirements, together with certain other information required by Form 20-F which is set forth under the heading Supplemental Information. The following cross reference table indicates where information required by Form 20-F may be found in this document.
Form 20-F item Heading Location in DocumentPage
Number
PArT i
1 identity of Directors, etc. N/A
2 offer Statistics & Timetable N/A
3 Key information
A Selected Financial Data Five-Year Summary 10
Supplemental Information
Exchange Rates 137
B Capitalization & Indebtedness N/A -
C Reason for Offer & Use of Proceeds N/A -
D Risk Factors Risk Factors 99
4 info on the Company
A History and Development of the Company
Our Solutions
Mobile Broadband 3
Managed Services 6
Operations & Business Support Systems 7
Board of Directors’ Report
Vision 17
Strategy 17
Business Focus 18
Cash Flow – Capital Expenditures 25
Notes to the Consolidated Financial Statements
Note C26 Business Combinations 88
Note C33 Events After the Balance Sheet Date 98
Supplemental Information
General Facts on the Company 136
Company History and Development 136
B Business Overview
Our Business 2
Our Solutions 3
Our Assets 8
Board of Directors’ Report
Vision 17
Strategy 17
Business Focus 18
Business Results 27
Material Contracts 35
Corporate Governance 35
Sourcing and Supply 36
Sustainability and Corporate Responsibility 37
Notes to the Consolidated Financial Statements
Note C3 – Segment Information 57
Note C32 – Contractual Obligations 98
Risk Factors
Market, Technology and Business Risks 99
Regulatory, Compliance and Corporate Governance Risks 103

ii
Form 20-F item Heading Location in DocumentPage
Number
C Organizational Structure
Supplemental Information
General Facts on the Company 136
Investments 146
D Property, Plants and Equipment
Supplemental Information
Primary Manufacturing and Assembly Facilities 137
Notes to the Consolidated Financial Statements
Note C11 – Property, Plant and Equipment 66
Note C27 – Leasing 90
Board of Directors’ Report
Cash Flow – Capital Expenditures 25
4A Unresolved Staff Comments -
5 operating & Fin’l review & Prospects - -
A Operating Results
Our Solutions 3
Our Assets 8
Board of Directors’ Report
Business Results 27
Notes to the Consolidated Financial Statements
Note C1 – Significant Accounting Policies – Group Companies 47
Note C20 – Financial Risk Management and Financial Instruments – Foreign Exchange Risk 83
Risk Factors
Regulatory, Compliance and Corporate Governance Risks 103
Board of Directors’ Report
Risk Management 36
Supplemental Information
Operating Results 137
Taxation 141
B Liquidity and Capital Resources
Board of Directors’ Report
Financial Position 23
Cash Flow 25
Risk Management 36
Notes to the Consolidated Financial Statements
Note C19 – Interest-Bearing Liabilities 82
Note C20 – Financial Risk Management and Financial Instruments 83
Note C25 – Statement of Cash Flows 87
C R&D, Patents & Licenses
Five-Year Summary 10
Board of Directors’ Report
Strategy – Technology Leadership 17
Business Focus – Technology 19
Financial Results of Operations – Operating expenses 22
Consolidated Financial Statements
Consolidated Income Statement and Statement of Comprehensive Income 42
D Trend Info
Our Solutions 3
Our Assets 8
Board of Directors’ Report
Business Results 27

Ericsson Annual Report on Form 20-F 2010 | iii
Form 20-F item Heading Location in DocumentPage
Number
E Off-Balance Sheet Arrangements
Board of Directors’ Report
Financial Position - Off-balance sheet arrangements 24
Notes to the Consolidated Financial Statements
Note C14 – Trade Receivables and Customer Finance – Credit Risk – Finance Credit Risk 69
Note C24 – Contingent Liabilities 87
F Tabular Disclosure of Contractual Obligations
Board of Directors’ Report
Material Contracts 35
Notes to the Consolidated Financial Statements
Note C32 – Contractual Obligations 98
6 Directors, Senior management and Employees -
A Directors & Senior Management
Corporate Governance Report 2010
Members of the Board of Directors 122
Members of the Executive Leadership Team 128
B Compensation
Board of Directors’ Report
Corporate Governance 35
Corporate Governance Report 2010
Committees of the Board of Directors – Remuneration Committee – Remuneration to Board members 121
Members of the Executive Leadership Team 128
Remuneration Report 106
Notes to the Consolidated Financial Statements
Note C17 – Post-Employment Benefits 75
Note C29 – Information Regarding Members of the Board of Directors, the Group Management and Employees 91
C Board Practices
Corporate Governance Report 2010
Board of Directors 116
Members of the Board of Directors 122
Members of the Executive Leadership Team 128
Notes to the Consolidated Financial Statements
Note C29 – Information Regarding Members of the Board of Directors, the Group Management and Employees 91
D Employees
Five Year Summary 10
Board of Directors’ Report
Business Focus 18
Notes to the Consolidated Financial Statements
Note C29 – Information Regarding Members of the Board of Directors, the Group Management and Employees 91
E – Share Ownership
Share Information
Shareholders 14
Corporate Governance Report 2010
Members of the Board of Directors 122
Members of the Executive Leadership Team 128
Notes to the Consolidated Financial Statements
Note C29 – Information Regarding Members of the Board of Directors, the Group Management and Employees 91

iv
Form 20-F item Heading Location in DocumentPage
Number
7 major S/Hs and related Party Transactions
A Major Shareholders
Share Information
Shareholders 14
B Related Party Transactions
Notes to the Consolidated Financial Statements
Note C30 – Related Party Transactions 97
C Interests of Experts & Counsel N/A -
8 Financial information
A Consolidated Statements and Other Financial Information
Consolidated Financial Statements 42
Please see also Item 17 cross references
Report of Independent Registered Public Accounting Firm 41
Notes to the Consolidated Financial Statements 46
Note C4 Net Sales 61
Supplemental Information
Memorandum and Articles of Association - Dividends 139
B Significant Changes
Board of Directors’ Report
Post-Closing Events 40
Notes to the Consolidated Financial Statements
Note C33 – Events After the Balance Sheet Date 98
9 The offer and Listing
A Offer and Listing Details
Share Information
Offer and Listing Details 13
B Plan of Distribution N/A
C Markets
Share Information
Stock Exchange Trading 11
D Selling Shareholders N/A
E Dilution N/A
F – Expenses of the issue N/A
10 Additional information
A Share Capital N/A
B Articles of Association
Supplemental Information
Memorandum and Articles of Association 139
C Material Contracts
Board of Directors’ Report
Material Contracts 35
Notes to the Consolidated Financial Statements
Note C32 Contractual Obligations 98
D Exchange Controls
Supplemental Information
Exchange Controls 141
E Taxation
Supplemental Information
Taxation 141

Ericsson Annual Report on Form 20-F 2010 | v
Form 20-F item Heading Location in DocumentPage
Number
F Dividends and paying agents N/A
G Statement by Experts N/A
H Documents on Display
Supplemental Information
General Facts on the Company 136
I Subsidiary Information N/A
11 Quantitative and Qualitative Disclosures About market risk
A Quantitative Information about Market Risk
Board of Directors’ Report
Risk Management 36
Notes to the Consolidated Financial Statements
Note C20 – Financial Risk Management and Financial Instruments 83
B Qualitative Information about Market Risk
Board of Directors’ Report
Risk Management 36
Notes to the Consolidated Financial Statements
Note C20 – Financial Risk Management and Financial Instruments 83
C Interim Periods N/A
D Safe Harbor N/A
E Small Business Issuers N/A
12 Description of Securities other than Equity Securities
A Debt Securities N/A
B Warrants and Rights N/A
C Other Securities N/A
D American Depositary Shares
Supplemental Information
Depositary Fees and Charges 144
PArT ii
13 Defaults, Dividends, Arrearages and Delinquencies N/A
14 material modifications to the rights of Security Holders and Use of Proceeds N/A
15 Controls and Procedures - -
A Disclosure Controls and Procedures
Corporate Governance Report 2010
Disclosure Controls and Procedures 131
B Management’s annual report on internal control over financial reporting 135
Management’s Report on internal control over financial reporting 135
CAttestation report of the registered public accounting firm
D Changes in internal control over financial reporting
16 reserved - -
A Audit Committee Financial Expert
Corporate Governance Report 2010
Audit Committee – Members of the Audit Committee 119
B Code of Ethics
Corporate Governance Report 2010
Code of Business Ethics 112

vi
Form 20-F item Heading Location in DocumentPage
Number
C Principal Accountant Fees and Services
Notes to the Consolidated Financial Statements
Note C31 Fees to Auditors 98
Corporate Governance Report 2010
Committees of the Board of Directors - Audit Committee 119
D Exemptions from the Listing Standards for Audit Committees
Corporate Governance Report 2010
Board of Directors - Independence 116
Supplemental Information
Independence Requirements 145
E Purchase of Equity Securities by the Issuer and Affiliated Purchasers
N/A
F Change in Registrant’s Certifying Accountant N/A
G Corporate Governance
Corporate Governance Report 2010
Board of Directors - Independence 116
Supplemental Information
Independence Requirements 145
PART iii
17 Financial Statements - -
Consolidated Income Statement and Statement of Comprehensive Income 42
Consolidated Balance Sheet 43
Consolidated Statement of Cash Flows 44
Consolidated Statement of Changes in Equity 45
Notes to the Consolidated Financial Statements 46
Note C1 – Significant Accounting Policies 47
Note C16 – Equity and Other Comprehensive Income 71
Report of Independent Registered Public Accounting Firm 41
18 Financial Statements N/A
19 Exhibits
Exhibit 1 Articles of Association
Exhibit 2 Not applicable
Exhibit 3 Not applicable
Exhibit 4 Not applicable
Exhibit 5 Not applicable
Exhibit 6Please see Notes to the Consolidated Financial Statements, Note C1 Significant Accounting Policies 47
Exhibit 7For definitions of certain ratios used in this report, please see Financial Terminology 150
Exhibit 8 Please see Supplemental Information, Investments 146
Exhibit 9 Not applicable
Exhibit 10 Not applicable
Exhibit 11 Our Code of Business Ethics and Conduct is included on our web site at
www.ericsson.com/bg/res/thecompany/docs/corporate-responsibility/2009/cobe/cobe_english.pdf
Exhibit 12 302 Certifications
Exhibit 13 906 Certifications
Exhibit 14 Not applicable
Exhibit 15.1 Consent of Independent Registered Public Accounting Firm
Exhibit 15.2 Consolidated Financial Statements of Sony Ericsson Mobile Communications AB
Exhibit 15.3 Consent of Independent Registered Public Accounting Firm

Ericsson Annual Report on Form 20-F 2010 | 1
Letter from Hans VestBerG
Hans Vestberg
President and CEO
Dear shareholders,
In 2010, Group sales decreased –2 percent to SEK 203.3 billion. Our operating margin,
before JV’s and excluding restructuring charges, was flat at 12 percent. Net income
increased 172 percent to SEK 11.2 billion, mainly due to improvements in earnings in our
joint venture Sony Ericsson and less restructuring charges.
In the first half of 2010, we were still impacted by the economic slowdown in the world.
In the latter part of the year, sales of mobile broadband took off, especially in North America
and Japan. This was driven by a strong increase in mobile data traffic.
During the year, we struggled with the industry-wide component shortage. While the
supply of components has now normalized we are still not fully meeting the increased
demand on certain mobile broadband products due to the increased customer demand.
We have four Group targets that should secure increased shareholder value: grow faster
than the market, deliver best-in-class margins, cash conversion of more than 70 percent and
improved earnings in our JVs.
Early market data indicates that we kept our market shares in our network and services
businesses. We delivered the industry’s best-in-class margins and achieved a cash conversion
of 112 percent. The fourth target, growth in JV earnings, was partly reached thanks to better
performance in Sony Ericsson.
2010 was the year when mobile broadband took off. The number of mobile subscriptions
increased by more than 60 percent to about 600 million and the number is forecasted to
almost double and hit 1 billion this year.
Once you are connected, you want connectivity 24/7, wherever you are.
This will become a reality for more and more people since we will see more smartphones
in the market, and also more affordable ones. Embedded mobile broadband modules will
become standard in laptops and other devices. To meet this consumer demand, network
speed, capacity and quality are prerequisites.
In the networked society, everything that benefits from a connection will be connected.
We have spoken about how 50 billion devices will be networked by 2020. We are already
today enabling the networked society: from the concept of building future networks in
demanding urban settings, to our networks which recently attained speeds of 168 Mbps
on HSPA – to our business in TV and media, and our services, which help manage and
integrate the complex networks that are behind the networked society.
Of course our joint ventures bring devices into the picture, and we are finding that this is
getting more and more personal for consumers. No longer is the device only a tool for them;
it is part of themselves that they want to have alongside them during their daily lives.
Finally, I would like to sincerely thank all our highly dedicated and skilled employees for
their efforts in 2010. In 2011, we will focus even more on understanding and meeting our
customer demand, ultimately seeking increased value for our shareholders. Continued
long-term growth and profitability are Ericsson’s characteristics, along with a healthy
financial position.
“ LonG-term GrowtH and profitaBiLity are ericsson’s cHaracteristics”
Net salesSEK 203.3 (206.5) billion
OperatiNg margiN*12% (12%)
Net iNcOmeSEK 11.2 (4.1) billion
Net cashSEK 51.3 (36.1) billion
earNiNgs per shareSEK 3.46 (1.14)
financiaL resuLts in sHort
* Excluding restructuring charges and share in earnings of JVs
2 | Ericsson Annual Report on Form 20-F 2010
sony ericsson st-ericsson
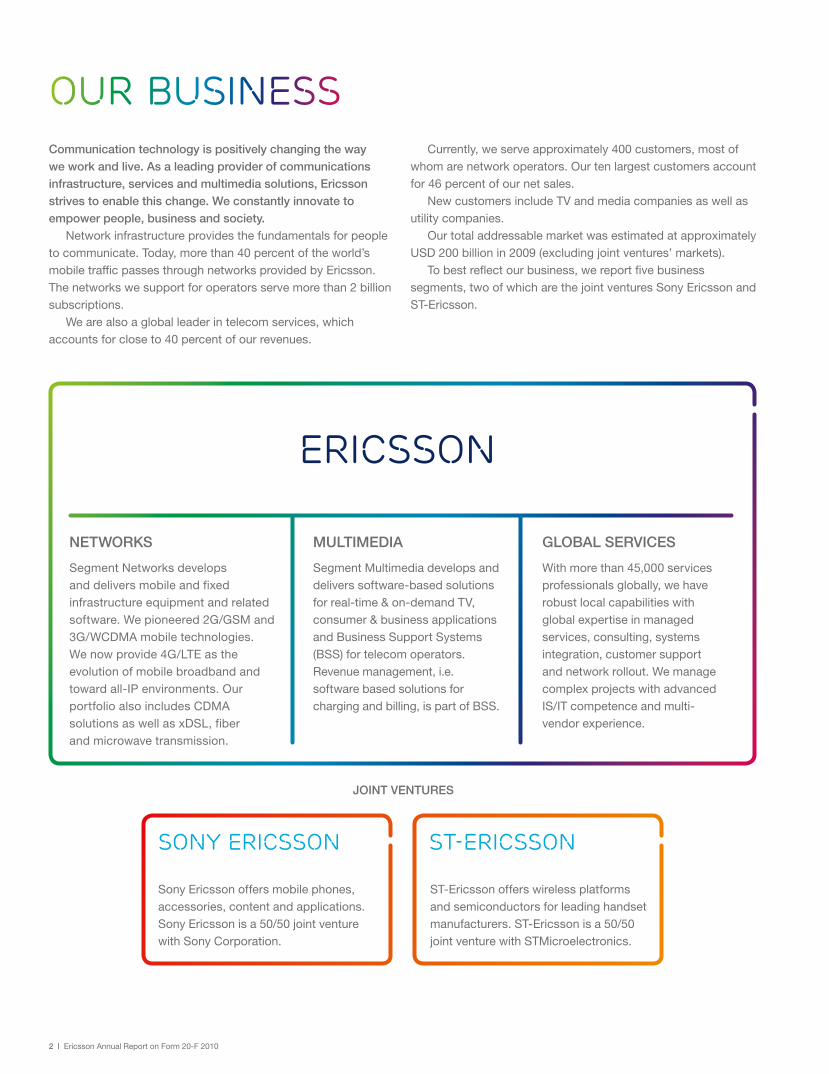
our Business
ericsson
communication technology is positively changing the way we work and live. as a leading provider of communications infrastructure, services and multimedia solutions, ericsson strives to enable this change. We constantly innovate to empower people, business and society.
Network infrastructure provides the fundamentals for people to communicate. Today, more than 40 percent of the world’s mobile traffic passes through networks provided by Ericsson. The networks we support for operators serve more than 2 billion subscriptions.
We are also a global leader in telecom services, which accounts for close to 40 percent of our revenues.
Currently, we serve approximately 400 customers, most of whom are network operators. Our ten largest customers account for 46 percent of our net sales.
New customers include TV and media companies as well as utility companies.
Our total addressable market was estimated at approximately USD 200 billion in 2009 (excluding joint ventures’ markets).
To best reflect our business, we report five business segments, two of which are the joint ventures Sony Ericsson and ST-Ericsson.
multimeDia
Segment Multimedia develops and delivers software-based solutions for real-time & on-demand TV, consumer & business applications and Business Support Systems (BSS) for telecom operators. Revenue management, i.e. software based solutions for charging and billing, is part of BSS.
Sony Ericsson offers mobile phones, accessories, content and applications. Sony Ericsson is a 50/50 joint venture with Sony Corporation.
ST-Ericsson offers wireless platforms and semiconductors for leading handset manufacturers. ST-Ericsson is a 50/50 joint venture with STMicroelectronics.
NetWOrks
Segment Networks develops and delivers mobile and fixed infrastructure equipment and related software. We pioneered 2G/GSM and 3G/WCDMA mobile technologies. We now provide 4G/LTE as the evolution of mobile broadband and toward all-IP environments. Our portfolio also includes CDMA solutions as well as xDSL, fiber and microwave transmission.
glObal services
With more than 45,000 services professionals globally, we have robust local capabilities with global expertise in managed services, consulting, systems integration, customer support and network rollout. We manage complex projects with advanced IS/IT competence and multi- vendor experience.
JOiNt veNtures

Ericsson Annual Report on Form 20-F 2010 | 3
User trends
24/7 connectivity to the internet is becoming an essential part of modern life. During the year, we met increased demand for mobile broadband infrastructure and services. The accelerated demand was fuelled by smartphones and notebooks, coupled with sharply rising usage of video services (like YouTube). Mobile data traffic more than doubled in 2010 and is expected to double annually over the coming three years.
Expansion opportunitiesToday, we are doing for broadband what we did for voice 20 years ago – making it mobile and affordable for the vast majority of people. Mobile subscriptions worldwide have reached approximately 5.3 billion of which approximately ten percent are now on mobile broadband. We estimate the number of mobile broadband subscriptions to reach almost 5 billion in 2016, the vast majority being for smartphones.
Our broadband solutions not only include equipment but also business advice, systems integration and roll-out service for fast implementation of cost-effective solutions.
Mobile broadband is a wireless access technology that offers at least 1 Mbps. It enables high-speed internet access services, such as video streaming.
OUR SOLUTIONS
MOBILE BROADBAND
COVERAGEPercentage of population
We are shifting our focus toward a more solutions-oriented sales process. During the year, we therefore organized our portfolio into seven solution areas to better address customer needs. Here we describe our solutions, the business drivers and the market trends.
MObIlE bROADbAnD 3
FIxED bROADbAnD AnD COnVERGEnCE 5
COMMUnICATIOn sERVICEs 5
MAnAGED sERVICEs 6
TElEVIsIOn AnD MEDIA MAnAGEMEnT 6
OpERATIOns AnD bUsInEss sUppORT sYsTEMs 7
COnsUMER AnD bUsInEss ApplICATIOns 7
1. Smartphones change behavior
2. Soaring video usage
3. Demand for 24/7 internet connectivity
WhAT IS MOBILE BROADBAND?
0
20
40
60
80
100
LTEHSPAEvolution
HSPAWCDMAEDGEGPRSGSMWorldpopulation
World population of 6.9 billion people
GSM WCDMA LTE
approx 2%
5-10%
35% <35%35% <35%
>70%
<85%>85%
Rural
Suburban
Urban
Metro

4 | Ericsson Annual Report on Form 20-F 2010
Source: Ericsson
Meeting the need for speedTo accommodate the massive growth in data traffic, operators are turning to us to boost capacity and speed in their networks. Networks are continuously being upgraded as the number of data users and data volume transported increase. All Ericsson-supplied commercial WCDMA networks have now been upgraded to HSPA. Four of our customers have launched 4G/LTE networks in 2010, covering 140 million people, 60 percent of whom are served by Ericsson LTE equipment.
On the devices side, notebooks and other electronic devices are equipped with our latest 3G/HSPA broadband modules, delivering speeds of up to 21 Mbps.
Operators implement tiered pricingWhen mobile broadband was introduced, many operators offered flat rates and unlimited usage to encourage fast uptake of service. A challenge for operators today is to secure user experience and increase revenue from mobile broadband. The answer is differentiated service offerings. Tiered pricing and innovative business models are becoming more common. The user can thus select and pay for a subscription with a certain service level. Voice still represents the main source of revenue for operators. Data traffic accounts for approximately 30 percent of total revenues on average and will represent the majority of future growth.
Ramp up of our Rbs 6000The multi-standard radio base station, RBS 6000, can run 2G/GSM, 3G/WCDMA and 4G/LTE technologies in the same unit, using different frequency spectrum bands. The RBS 6000 takes up 25 percent less space and reduces power consumption by up to 65 percent compared to previous-generation RBSs. This is a significant saving as operators may spend up to 50 percent of operating expenses on power. Many operators are therefore looking to modernize their radio networks with the RBS 6000. Modernization projects often involve a high degree of consulting, systems integration and network rollout.
Core networks may also need capacity upgrades to accommodate increasing data traffic and speed. Our 4G/LTE core network, the Evolved Packet Core, is an all-IP network, supporting both mobile and fixed access. Our 2G and 3G packet core networks require only a software upgrade to support 4G/LTE access.
Mobile broadband stimulates GDp growthHigh-speed broadband infrastructure (mobile and fixed) is becoming as essential as roads, water and electricity. Studies show a direct correlation between broadband penetration and GDP growth. In emerging markets, many users can access the internet only via mobile devices due to the lack of fixed network infrastructure.
Mobile PC and tablets
Mobile handheld
Voice
0
10
20
30
40
50
60
201620152014201320122011201020092008
0
1
2
3
4
5
2016
2015
2014
2013
2012
2011
2010
2009
2008
Mobile PC and tablets
Handheld devices
Source: Ericsson
MObIlE bROADbAnD TREnDSubscriptions (billion)
Feature phone user10 kbpsapprox. 10 MB/month
smartphone user100-1,000 kbpsapprox. 100 MB/month
Mobile pC/tablet user>1 Mbpsapprox. 1 Gb/month
spEED AnD DATA TRAFFIC
sUbsCRIbER TRAFFIC In MObIlE ACCEss nETWORKsYearly Exabytes (1018)

Ericsson Annual Report on Form 20-F 2010 | 5
Fixe
d n
etw
ork
Wire
less
net
wor
k
Dat
a/in
tern
et n
etw
ork
Cab
le T
V n
etw
ork
Service network
Different services for devicesin separate systems.
Same services irrespectiveof access device.
Core network
Fixed broadband access
Mobile broadband access
FixeD brOaDbaND treNDSubscriptions (million)
fiXed BroadBand and conVerGence
communication serVices
Communication services are the services people use to interact with each other, such as voice and video calls as well as text and multimedia messaging. These operator-based services are provided globally and are based on industry standards, ensuring interoperability.
As voice and SMS still account for the main part of operator revenues, operators now exploit opportunities to enhance user experience while reducing costs for voice communication.
Users want enriched communication and the ability to instantaneously share experiences and information with family, friends and colleagues – anywhere, anytime and to any device. Our IP Multimedia Subsystem (IMS) makes this possible. Services controlled by IMS are voice (incl. HD-voice), video calls, the Rich Communication Suite (RCS) and messaging. With RCS, consumers get a suite of IMS-based services (e.g. presence information, chat and content sharing) from the address book of a mobile phone or from a broadband connection.
Fixed broadbandIn today’s mature markets, most data traffic is handled by fixed networks. Operators compete by evolving their networks to provide fast internet speeds, reliable high-definition IPTV and video on demand. We enable this by providing end-to-end broadband access solutions via high-speed fiber (such as GPON) and copper (xDSL).
all-ip networks and convergenceTo reduce cost and enable service bundling, fixed traffic can be provided over a multi-service network converging telephony, internet and TV. This multi-service network is IP based, providing lower-cost and higher-performance broadband services. IP starts in the core network. Our Evolved Packet Core (EPC) provides support for multiple access technologies and fixed-mobile convergence. New functionality is introduced through software upgrades. With our breadth of experience, we provide a service, including consulting and systems integration, to manage transformation of networks to all-IP, often involving multiple-vendor equipment.
are connected to fixed broadband networks.Includes all technologies.
500 million subscriptions
NetWOrk traNsFOrmatiON
xDSL Cable Fiber
0
100
200
300
400
500
600
700
2016
2015
2014
2013
2012
2011
2010
2009
2008
Source: Ericsson. Includes xDSL, Cable and Fiber. Other technologies excluded.

6 | Ericsson Annual Report on Form 20-F 2010
750 miLLion subscribers worldwide are served by networks that we manage.
manaGed serVices
Network operations have traditionally been seen as core to operators. Today, competitive pressure, rapid technology evolution and changing user demands drive another focus. Many operators now view strategy, marketing and customer retention as being equally important as technology. Our managed services agreements free up in-house resources for this focus, and can reduce network operating costs by as much as 20 percent.
We have a long history of taking on employees from operators. We have invested USD 1 billion in tools, methods and processes to secure capabilities and competence.
improving operators’ operational efficiency The need to improve operational efficiency, reducing both capital expenditures and operating expenses, is a key driver for an operator to change its business. It is estimated that a mature operator spends approximately 5-6 percent of revenues on network equipment and 10-12 percent on operating the network, i.e. operating expenses account for twice the capital expenditures for networks. Our network operations contracts are often multi-year, multi-technology and multi-vendor agreements.
simplifying network complexity Another key driver is the increasing complexity of networks as they are transformed and modernized. IT and telecom convergence creates many opportunities for us to act as an advisor, both in streamlining business and operations support systems and helping to quickly and cost-efficiently introduce new services.
shared networks and shared capacity The initial growth of managed services was driven by operational efficiency. There is now an increasing demand for business models that support shared capacity and network sharing between two or more operators. This trend also drives structural efficiencies in the networks. Managed services play a decisive role in this evolution.
Outsourcing trends:> Reduce and control spending
> Focus on key business priorities
> Greater operational efficiency> Lower risks, reduce complexity> Shared capacity – structural
efficiency
tV and media manaGement
tv is going digital and interactiveIn the converging media landscape, broadcast and broadband are coming together, moving towards a connected world.
The worldwide digital TV market is growing. TV solutions and services enable global media companies and operators (cable, satellite, telecom and terrestrial) to deliver TV content, either directly to consumers or for professional digital video content exchange.
With a broad suite of open standards-based products, we offer high-quality solutions for digital TV, HDTV, video on demand, IPTV, mobile TV, connected home and content management.
High-performance video means large amounts of traffic in the networks. This can be handled with our media distribution (MDN) solution for video delivery over IP, combining a content distribution network with our TV portfolio.
Business consulting, systems integration and implementation ensure a smooth launch of new TV services and infrastructure.

Ericsson Annual Report on Form 20-F 2010 | 7
consumer and Business appLicationsinteraction and collaboration To support operators in growing their revenues, we provide new means of interaction and collaboration. Our solutions include messaging, social networks, location-based services, media, advertising, internet commerce and enterprise applications.
We support our customers in the modernization and consolidation of legacy service delivery systems and messaging systems, such as SMS, MMS and video mail.
Our Business Communication Suite (BCS) targets the enterprise market. It enables sharing of voice, video data, messaging and web conferences in a collaborative environment.
Our multimedia brokering solution facilitates payment and distribution of content. We act as the interface between enterprises and multiple mobile operators with consumer data and services such as via SMS.
Several of our solutions can be delivered as cloud services.
operations and Business support systems
Operations support systems – for controlRising network complexity drives the need for one consolidated “dashboard-style” Operations Support System (OSS). Our OSS includes capabilities for performance monitoring and fault management, configuration and security management as well as systems to optimize performance for efficiency. OSS can also handle multi-vendor equipment.
business support systems – efficient billing and chargingOur Business Support Systems (BSS) support operators in instant provisioning and activation of services, devices and price plans. Our solutions can also provide real-time convergent charging (i.e. the user gets one invoice for both mobile and fixed usage) and billing and data management. With our solutions, operators can capture and secure revenue streams. Users can instantly start using a new service or device and control their spending.
Operators have to handle the increased data traffic in their networks along with many new devices. At the same time, operators introduce tiered pricing and new business models in order to maximize their revenues for mobile broadband services as well as voice traffic. This development requires upgrading of old support systems as well as the introduction of new BSS solutions.
Consulting and systems integration services are vital components of BSS solutions.

8 | Ericsson Annual Report on Form 20-F 2010
Unique global presence and scaleOur global presence and scale give us a competitive advantage. In the industry consolidation, where operators are merging, we can handle larger cross-border contracts as well as targeted local assignments. It is key for us to stay close to customers, building trust, earning a strong track record and applying our in-depth expertise.
Today, over 1,000 networks in more than 180 countries use equipment supplied by us. Over the years, we have gained local knowledge and experience in network rollouts and systems integration as well as managing, upgrading and modernizing networks.
Technology leadership – investing for the futureOur technology leadership is a key asset that we leverage. We focus on early involvement in creating new technologies, strong contribution in technology standardization work, development of intellectual property rights and establishment of licensing agreements. We pioneered the development of digital AXE switching, 2G/GSM, 3G/WCDMA and 4G/LTE, leading to 27,000 granted patents. We invested approximately 15 percent of our total sales into R&D in 2010. At year end, the number of R&D employees was more than 20,000. Over 80 percent of our product development is software related.
OUR ASSETSEricsson AcademyIn 2010 we launched Ericsson Academy and Learning Services. It is an online platform for sharing knowledge and inspiration both internally and externally. The site offers free telecom tutorials, technical snapshots and a forum to exchange smart ideas.
Creating a winning culture We want to attract and develop the most competent, high-performing and motivated people in the industry. The culture we encourage is innovative, fast moving and responsive, with a business-winning mindset. To get the entire company moving in this direction, we implemented a group wide empowerment program. We also run a leadership training program to promote global diversity and cultivate top talent worldwide.
Putting consumer insight to workTo stay abreast of consumer trends, we use our ConsumerLab market research unit, which conducts more than 40,000 interviews annually. This represents the combined opinions and behavior patterns of more than 1 billion people. Not only do we incorporate these insights into our product development, but we can also make them available to our customers.
Our breadth of experience enables us to offer end-to-end support to our customers.
CUSTOMERS
PROdUCTS & SOlUTiOnS
SySTEMS inTEgRATiOn
COnSUlTing & nETwORk
dESign
nETwORk OPERATiOn &
SUPPORT
GSM GPRS, EDGE, WCDMA, HSPA LTE & BEYOND
GSM GPRS, EDGE, WCDMA, HSPA
GSM
LEADERSHIP IN MOBILE BROADBAND
LEADERSHIP IN MOBILE INTERNET
LEADERSHIP IN MOBILE TELEPHONY
GSM
1980 1990 2000 2010
HSPA, LTE, CDMA2000 EV-DO
GPRS, EDGE, WCDMA
Mobile broadband
Mobile internet
Mobile telephony
GSM, CDMA2000
1990 2000 2010
Services leadershipNetworks are becoming increasingly complex and often include multi-vendor equipment. The knowledge gained from managing networks for 750 million subscribers is an asset. Today our global services organization handles consulting, systems integration, network rollout, network operation, customer support and education. Competence development is further enhanced by insourcing staff from operators and acquiring companies in consulting and systems integration.

Ericsson Annual Report on Form 20-F 2010 | 9
2010 HiGHLiGHts JaNuarY-march
> World record of 84 Mbps HSPA demonstrated.
> TeliaSonera rolls out 4G/LTE in Norway and Sweden, with core network and RBS 6000 from Ericsson. Three more customers have since launched LTE.
> Ericsson delivers LTE network equipment and services to AT&T.
> A world record is set with 1 Gbps for LTE in a live demo.
> Ericsson performs a live demo of the world’s first high-speed microwave radio connection with a transporting capacity of 2.5 Gbps.
april-JuNe
> Ericsson increases presence in Korea by acquiring Nortel’s stake in the joint venture LG-Nortel. The business is consolidated by Ericsson.
> First managed operations contract in Canada, for Mobilicity’s 3G network.
> Indosat, Indonesia, prepares for 4G and launched Asia’s fastest network with 42 Mbps.
> Ericsson chosen to operate Telefonica’s network operations center in São Paulo.
> Ericsson provides industry’s first 3D sports television network, ESPN 3D, with standards-based video processing solution, tuned for 3D and HD broadcasts.
JulY-september
> Mobile data is growing ten times faster than voice.
> China Mobile Hebei selects Ericsson as its managed services partner.
> MetroPCS launches first 4G/LTE network in the USA, with Ericsson as primary supplier.
> Ericsson gets its largest fiber-to-the-home contract in India.
> Ericsson announces embedded mobile broadband modules – world’s first to support 21 Mbps (HSPA) for notebooks and other consumer electronics.
> EMOBILE upgrades its HSPA network with the HSPA Evolution technology – the highest-speed network in Japan with a peak data rate of 42 Mbps.
OctOber-December
> TeliaSonera renews and expands its managed services contract with Ericsson to include field service for voice and data networks in 29 countries.
> Hans Vestberg, CEO, participated via Telepresence at COP 16 in Mexico, to stress the importance of ICT in addressing climate change.
> Ericsson is selected as key equipment and services provider for next evolution of the Sprint network, supplying radio access, core and IP/Microwave backhaul.
> Ericsson wins managed services contract with China Unicom.
> Verizon Wireless launches the world’s largest LTE network with Ericsson as the primary vendor.
> 3 Italia chooses Ericsson for data center consolidation and modernization of IT infrastructure.
160
170
180
190
200
210
20102009200820072006
23%
7%5%
3%
7%
0
5
10
15
20
25
ItalyIndiaJapanChinaUnitedStates
179.8
187.8
208.9206.5206.5
203.3
10%9%
4% 4%4%
9%
4% 4%4%
160
170
180
190
200
210
20102009200820072006
23%
7%5%
3%
7%
0
5
10
15
20
25
ItalyIndiaJapanChinaUnitedStates
179.8
187.8
208.9206.5206.5
203.3
10%9%
4% 4%4%
9%
4% 4%4%
Five Year sales SEK billion
tOp Five cOuNtries iN salesPercentage of total sales
2009 2010

10 | Ericsson Annual Report on Form 20-F 2010
For definitions of the financial terms used, see Glossary, Financial Terminology and Exchange Rates.
Five-Year summarY
sek million 2010 change 2009 2008 2007 2006
income statement items
Net sales 203,348 –2% 206,477 208,930 187,780 179,821
Operating income 16,455 178% 5,918 16,252 30,646 35,828
Financial net –672 –307% 325 974 83 165
Net income 11,235 172% 4,127 11,667 22,135 26,436
Year-end position
Total assets 281,815 4% 269,809 285,684 245,117 214,940
Working capital 105,488 6% 99,079 99,951 86,327 82,926
Capital employed 182,640 1% 181,680 182,439 168,456 142,447
Gross cash 87,150 14% 76,724 75,005 57,716 62,280
Net cash 51,295 42% 36,071 34,651 24,312 40,728
Property, plant and equipment 9,434 –2% 9,606 9,995 9,304 7,881
Stockholders’ equity 145,106 4% 139,870 140,823 134,112 120,113
Non-controlling interest 1,679 45% 1,157 1,261 940 782
Interest-bearing liabilities and post-employment benefits 35,855 –12% 40,653 40,354 33,404 21,552
Other information
Earnings, per share, basic, SEK 3.49 203% 1.15 3.54 6.87 8.27
Earnings, per share, diluted, SEK 3.46 204% 1.14 3.52 6.84 8.23
Cash dividends per share, SEK 2.25 1) 13% 2.00 1.85 2.50 2.50
Stockholders’ equity per share, SEK 45.34 4% 43.79 44.21 42.17 37.82
Number of shares outstanding (in millions)
end of period, basic 3,200 – 3,194 3,185 3,180 3,176
average, basic 3,197 – 3,190 3,183 3,178 3,174
average, diluted 3,226 – 3,212 3,202 3,193 3,189
Additions to property, plant and equipment 3,686 –8% 4,006 4,133 4,319 3,827
Depreciation and write-downs/impairments of property, plant and equipment 3,296 –6% 3,502 3,105 2,914 3,038
Acquisitions/capitalization of intangible assets 7,246 – 11,413 1,287 29,838 18,319
Amortization and write-downs/impairments of intangible assets 6,657 –23% 8,621 5,568 5,459 4,479
Research and development expenses 31,558 –5% 33,055 33,584 28,842 27,533
as percentage of net sales 15.5% – 16.0% 16.1% 15.4% 15.3%
ratios
Operating margin excluding joint ventures 8.7% – 6.5% 8.0% 12.5% 16.7%
Operating margin 8.1% – 2.9% 7.8% 16.3% 19.9%
EBITA margin 11.0% – 6.7% 9.4% 18.0% 21.0%
Cash conversion 112% – 117% 92% 66% 57%
Return on equity 7.8% – 2.6% 8.2% 17.2% 23.7%
Return on capital employed 9.6% – 4.3% 11.3% 20.9% 27.4%
Equity ratio 52.1% – 52.3% 49.7% 55.1% 56.2%
Capital turnover 1.1 – 1.1 1.2 1.2 1.3
Inventory turnover days 74 – 68 68 70 71
Trade receivables turnover 3.2 – 2.9 3.1 3.4 3.9
Payment readiness, SEK million 96,951 9% 88,960 84,917 64,678 67,454
as percentage of net sales 47.7% – 43.1% 40.6% 34.4% 37.5%
statistical data, year-end
Number of employees 90,261 9% 82,493 78,740 74,011 63,781
of which in Sweden 17,848 –2% 18,217 20,155 19,781 19,094
Export sales from Sweden, SEK million 100,070 6% 94,829 109,254 102,486 98,6941) For 2010, as proposed by the Board of Directors.
fiVe-year summary

Ericsson Annual Report on Form 20-F 2010 | 11
sHare information
> Omx stockholm index increase in 2010: 23 percent
> s&p 500 index increase in 2010: 13 percent
> ericsson’s total market capitalization at year end: sek 255 (215) billion
stock eXcHanGe tradinGThe Ericsson Class A and Class B shares are listed on NASDAQ OMX Stockholm. In the United States, the Class B shares are listed on NASDAQ in the form of American Depositary Shares (ADS) evidenced by American Depositary Receipts (ADR) under the symbol ERIC. Each ADS represents one Class B share.
In 2010, approximately 6 (7) billion Ericsson shares were traded, of which about 3.4 billion were traded on NASDAQ OMX Stockholm and about 1.6 billion were traded on NASDAQ. (Note: The approximate total volumes include trading on alternative trading venues such as BATS Europe, Burgundy, Chi-X Europe.)
Trading volume in Ericsson shares decreased by approximately 30 percent on NASDAQ OMX Stockholm and decreased by approximately 7 percent on NASDAQ as compared to 2009.
chaNges iN Number OF shares aND capital stOck 2006–2010
Number of shares share capital
2006 December 31 (no changes) 16,132,258,678 16,132,258,678
2007 December 31 (no changes) 16,132,258,678 16,132,258,678
2008 June 2, reverse split 1:5 3,226,451,735 16,132,258,678
2008 July 23, new issue. (Class C shares, later converted to Class B)
19,900,000 99,500,000
2008 December 31 3,246,351,735 16,231,758,678
2009 June 8, new issue (Class C-shares, later converted to Class B)
27,000,000 135,000,000
2009 December 31 3,273,351,735 16,366,758,678
2010 December 31 3,273,351,735 16,366,758,678
perFOrmaNce iNDicatOrs
2010 2009 2008 2007 2) 2006 2)
Earnings per share, diluted (SEK) 3.46 1.14 3.52 6.84 8.23
Operating income per share (SEK) 1) 7.42 5.80 7.50 9.64 11.29
Cash flow from operating activities per share (SEK) 8.31 7.67 7.54 6.04 5.82
Stockholders’ equity per share, basic, end of period (SEK) 45.34 43.79 44.21 42.17 37.82
P/E ratio 22 57 17 11 17
Total shareholder return (%) 22 15 –20 –43 3
Dividend per share (SEK) 3) 2.25 2.00 1.85 2.50 2.501) For 2010, 2009 and 2008 excluding restructuring charges.2) 2006 and 2007 restated for reverse split 1:5 in 2008.3) For 2010 as proposed by the Board of Directors.
For definitions of the financial terms used, see Glossary, Financial Terminology and Exchange Rates.
All performance indicators except Earnings per share, diluted, and Stockholders’ equity per share, basic, end of period are calculated on average number of shares outstanding, basic.
18%
the ericssON share
share listings
NASDAQ OMX, Stockholm
NASDAQ, New York
Total number of shares outstanding 3,273,351,735
of which Class A shares 261,755,983
of which Class B shares 3,011,595,752
of which Ericsson treasury shares, Class B 73,088,515
Quotient value SEK 5.00
Market capitalization, approx. December 31, 2010 SEK 255b.
GICs (Global Industry Classification) 45201020
ticker codes
NASDAQ OMX ERIC AStockholm ERIC B
NASDAQ, New York ERIC
Bloomberg NASDAQ ERICA SSOMX Stockholm ERICB SS
Bloomberg NASDAQ ERIC US
Reuters NASDAQ ERICa.STOMX Stockholm ERICb.ST
Reuters NASDAQ ERIC.O
ISIN
ERIC A SE0000108649
ERIC B SE0000108656
ERIC US2948216088
CUSIP 294821608
increase in 2010 of
market capitaLiZation

12 | Ericsson Annual Report on Form 20-F 2010
sHare trendIn 2010, Ericsson’s total market capitalization increased by about 18 (13) percent to SEK 255 billion (SEK 215 billion in 2009). The OMX Stockholm Index on NASDAQ OMX Stockholm increased by 23 percent, the S&P 500 Index increased by 13 percent and the NASDAQ composite index increased by 17 percent.
DiviDeND per sharesek
earNiNgs per share, DiluteDsek
2006 20062007 2008 2009 20100.00
3.00
6.00
9.00
2007 2008 2009 20100.00
10.00
20.00
30.00
40.00
50.008.23
6.84
3.52
37.82
42.17
45.3443.79
3.46
1.14
44.21
stOckhOlDers’ equitY per share, basicsek
2006 20062007 2008 2009 20100.00
3.00
6.00
9.00
2007 2008 2009 20100.00
10.00
20.00
30.00
40.00
50.008.23
6.84
3.52
37.82
42.17
45.3443.79
3.46
1.14
44.21
Volumes reflect trading on NASDAQ OMX Stockholm only.
share turNOver aND price treND, NasDaq Omx stOckhOlm
USD m. USDADS
Jan-Dec, 2007Jan-Dec, 2006 Jan-Dec, 2008 Jan-Dec, 2009 Jan-Dec, 2010
Turnover, USD million Price, USD S&P 500 (indexed to ADS price)
0
5
10
15
20
25
0
500
1,000
1,500
2,000
2,500
3,000
3,500
4,000
4,500
SEK m. SEKClass B shares
Jan-Dec, 2007Jan-Dec, 2006 Jan-Dec, 2008 Jan-Dec, 2009 Jan-Dec, 2010
Turnover, SEK million Price, SEK OMX Stockholm (indexed to share price)
0
20
40
60
80
100
120
140
160
180
200
0
20,000
40,000
60,000
80,000
100,000
120,000
140,000
SEK m. SEKClass A shares
Jan-Dec, 2007Jan-Dec, 2006 Jan-Dec, 2008 Jan-Dec, 2009 Jan-Dec, 2010
Turnover, SEK million Price, SEK OMX Stockholm (indexed to share price)
0
20
40
60
80
100
120
140
160
180
200
0
50
100
150
200
250
300
350
share turNOver aND price treND, us market
USD m. USDADS
Jan-Dec, 2007Jan-Dec, 2006 Jan-Dec, 2008 Jan-Dec, 2009 Jan-Dec, 2010
Turnover, USD million Price, USD S&P 500 (indexed to ADS price)
0
5
10
15
20
25
0
500
1,000
1,500
2,000
2,500
3,000
3,500
4,000
4,500
SEK m. SEKClass B shares
Jan-Dec, 2007Jan-Dec, 2006 Jan-Dec, 2008 Jan-Dec, 2009 Jan-Dec, 2010
Turnover, SEK million Price, SEK OMX Stockholm (indexed to share price)
0
20
40
60
80
100
120
140
160
180
200
0
20,000
40,000
60,000
80,000
100,000
120,000
140,000
SEK m. SEKClass A shares
Jan-Dec, 2007Jan-Dec, 2006 Jan-Dec, 2008 Jan-Dec, 2009 Jan-Dec, 2010
Turnover, SEK million Price, SEK OMX Stockholm (indexed to share price)
0
20
40
60
80
100
120
140
160
180
200
0
50
100
150
200
250
300
350
2006 2007 2008 2009 2010 1)0.00
0.50
1.00
1.50
2.00
2.502.50 2.50
1.85
2.00
2.25
1) For 2010 as proposed by the Board of Directors.

Ericsson Annual Report on Form 20-F 2010 | 13
SHARE pRicES on nASDAQ oMX STocKHoLM AnD nASDAQ
nASDAQ oMX Stockholm nASDAQ
SEK per class A share SEK per class B share USD per ADS 1)
period Low High Low High Low High
Annual high and low
2006 2) 104.50 154.50 104.50 155.00 14.44 20.57
2007 2) 73.00 148.50 72.65 149.50 11.12 21.71
2008 40.60 83.60 40.60 83.70 5.49 14.00
2009 55.40 78.80 55.50 79.60 6.60 10.92
2010 65.20 88.40 65.90 90.45 9.40 12.39
Quarterly high and low
2009 First Quarter 55.40 78.00 55.50 78.70 6.60 9.65
2009 Second Quarter 64.10 78.80 64.00 79.60 8.10 9.92
2009 Third Quarter 65.80 78.60 66.10 79.50 9.10 10.84
2009 Fourth Quarter 64.70 76.25 65.25 76.95 8.94 10.92
2010 First Quarter 65.20 78.70 65.90 80.00 9.40 11.33
2010 Second Quarter 73.00 88.40 74.15 90.45 9.51 12.39
2010 Third Quarter 69.00 86.55 70.85 89.35 9.62 12.20
2010 Fourth Quarter 66.95 77.05 68.85 79.95 9.96 11.71
Monthly high and low
August 2010 69.00 79.45 70.85 81.05 9.62 11.40
September 2010 69.70 78.50 71.85 80.65 9.98 11.33
October 2010 68.80 74.50 70.65 76.80 10.49 11.60
November 2010 66.95 72.00 68.85 74.20 9.96 11.20
December 2010 70.00 77.05 72.45 79.95 10.48 11.71
January 2011 72.50 78.55 74.80 82.00 10.99 12.61
February 2011 74.00 80.05 77.15 83.00 12.09 12.931) One ADS = 1 Class B share. 2) 2006 and 2007 restated for reverse split 1:5 in 2008.
Offer and listing details principal trading market – nASDAQ oMX Stockholm – share prices
The table below states the high and low share prices for our Class A and Class B shares as reported by NASDAQ OMX Stockholm for the last five years. Trading on the exchange generally continues until 5:30 p.m. (CET) each business day. In addition to trading on the exchange there is also trading off the exchange and on alternative venues during trading hours and also after 5:30 p.m. (CET).
NASDAQ OMX Stockholm publishes a daily Official Price List of Shares which includes the volume of recorded transactions in each listed stock, together with the prices of the highest and lowest recorded trades of the day. The Official Price List of Shares reflects price and volume information for trades completed by the members. The equity securities listed on the NASDAQ OMX Stockholm Official Price List of Shares currently comprise the shares of 258 companies.
Host market nASDAQ – ADS prices The table below states the high and low share prices quoted for our ADSs on NASDAQ for the last five years. The NASDAQ quotations represent prices between dealers, not including retail mark-ups, markdowns or commissions, and do not necessarily represent actual transactions.
SHARE pRicES on nASDAQ oMX STocKHoLM
(SEK) 2010 2009 2008 2007 1) 2006 1)
Class A at last day of trading 74.00 65.00 59.30 76.80 138.00
Class A high for year (June 21, 2010) 88.40 78.80 83.60 148.50 154.50
Class A low for year (January 4, 2010) 65.20 55.40 40.60 73.00 104.50
Class B at last day of trading 78.15 65.90 58.80 75.90 138.25
Class B high for year (June 21, 2010) 90.45 79.60 83.70 149.50 155.00
Class B low for year (January 4, 2010) 65.90 55.50 40.60 72.65 104.501) 2006 and 2007 restated for reverse split 1:5 in 2008.
SHARE pRicES on nASDAQ nEw yoRK
(USD) 2010 2009 2008 2007 1) 2006 1)
ADS at last day of trading 11.53 9.19 7.81 11.68 20.12
ADS high for year(April 23, 2010) 12.39 10.92 14.00 21.71 20.57
ADS low for year (February 5, 2010) 9.40 6.60 5.49 11.12 14.441) 2006 and 2007 restated for reverse split 1:5 in 2008.

14 | Ericsson Annual Report on Form 20-F 2010
sharehOlDers
sHareHoLdersAs of December 31, 2010, the Parent Company had 630,592 shareholders registered at Euroclear Sweden AB (the Central Securities Depository – CSD), of which 1,334 holders had a US address. According to information provided by Citibank, there were 262,814,956 ADSs outstanding as of December 31, 2010, and 4,888 registered holders of such ADSs. A significant number of Ericsson ADSs are held by banks, broker and/or nominees for the accounts of their customer. As of December 31, 2010, the number of bank, broker and/or nominee accounts holding Ericsson ADSs was 196,360.
According to information known at year-end 2010, almost 78 percent of our Class A and Class B shares were owned by institutions, Swedish and international.
Our major shareholders do not have different voting rights than other shareholders holding the same classes of shares.
As far as we know, the Company is not directly or indirectly owned or controlled by another corporation, by any foreign government or by any other natural or legal person(s) separately or jointly.
tOp executives aND bOarD members, OWNership
Number ofclass a shares
Number ofclass b shares
voting rights,percent
Top executives and Board members as a group (31 persons) 2,416 3,937,920 0.07For individual holdings, see Corporate Governance Report.
The table shows the total number of shares in the Parent Company owned by top executives and Board members (including Deputy employee representatives) as a group as of December 31, 2010.
The following table shows share information, as of December 31, 2010, with respect to our 15 largest shareholders, ranked by voting rights, as well as percentage of voting rights as of December 31, 2010, 2009 and 2008.
largest sharehOlDers, December 31, 2010 aND perceNtage OF vOtiNg rights, December 31, 2010, 2009 aND 2008
identity of person or group 1)
Number of class a
shares
Of total class a shares, percent
Number of class b
shares
Of total class b shares, percent
2010 voting rights,
percent
2009 voting rights,
percent
2008 voting rights,
percent
Investor AB 102,664,038 39.22 61,414,664 2.04 19.33 19.33 19.42
AB Industrivärden 77,680,600 29.68 0 0.00 13.80 13.62 13.28
Handelsbankens Pensionsstiftelse 19,800,000 7.56 0 0.00 3.52 3.52 3.00
Skandia Liv 15,719,072 6.01 10,745,693 0.36 2.98 3.02 2.89
Swedbank Robur Fonder AB 1,495,549 0.57 138,868,343 4.61 2.73 3.07 2.44
Pensionskassan SHB Försäkringsföreningen 11,672,000 4.46 0 0.00 2.07 2.25 2.26
BlackRock Fund Advisors 0 0.00 81,187,654 2.70 1.44 1.81 0.00
Dodge & Cox, Inc. 0 0.00 80,330,400 2.67 1.43 1.05 0.98
AMF Pensionsförsäkring AB 800,000 0.31 67,174,148 2.23 1.34 1.30 1.55
OppenheimerFunds, Inc. 0 0.00 72,416,412 2.40 1.29 1.29 1.31
Handelsbanken Fonder AB 1,340 0.00 59,260,630 1.97 1.05 0.94 1.02
Gamla Livförsäkringsbolaget SEB Trygg Liv 4,675,919 1.79 12,275,600 0.41 1.05 0.98 1.04
Aberdeen Asset Managers Ltd. 0 0.00 56,648,517 1.88 1.01 0.71 0.38
SEB Investment Management AB 498,441 0.19 50,604,935 1.68 0.99 0.89 0.98
PRIMECAP Management Co. 0 0.00 52,241,292 1.73 0.93 0.83 0.56
Others 26,749,024 10.21 2,268,427,464 75.32 45.04 45.39 48.89
total 261,755,983 100.00 3,011,595,752 100.00 100.00 100.00 100.001) Source: Capital Precision.
Singapore: 1.34% (0.58%)
Other countries: 17.25% (18.00%)
United Kingdom: 8.17% (7.33%)
United States: 24.94% (24.29%)
Norway: 2.45% (2.63%)
Sweden: 45.85% (47.17%)
Five largest cOuNtries Percent of capital
Source: Capital Precision

Ericsson Annual Report on Form 20-F 2010 | 15
Dear shareholders,
When I summarized year 2009, I wrote that the key future opportunities for the industry and
Ericsson would be increased mobile traffic. In 2010 we saw massive data traffic uptake,
driven by laptops and smartphones. The global mobile data traffic actually more than
doubled. As a consequence, Ericsson saw a growing demand for mobile broadband.
The telecom industry has for a very long time been characterized by rapid technology
development and consolidation. Along with the introduction of new technologies, Ericsson’s
business is becoming more and more services and software-related. Management has taken
action to adapt the Company to this change and the implementation of a new organization
has so far been smooth. This is an important foundation for Ericsson’s future growth.
In 2010, Ericsson acquired companies to the value of SEK 3.3 billion. Many new
employees came aboard during the year, 5,250 joined through acquisitions and about 1,300
through managed services contracts. The Board closely follows the integration of acquired
businesses and the insourcing of new employees from operators via managed services
contracts. Ericsson has a well-established integration process and a culture where new
colleagues quickly become a part of the Company.
During the year, The Board has continued to monitor the Company’s remuneration
principles. The Board is of the opinion that Ericsson has a well-balanced and competitive
compensation structure which rewards performance. We think it is beneficial that senior
executives invest in shares and we hope the new long-term variable remuneration (LTV)
program will prove to be motivational.
Ericsson has a strong financial position with net cash of SEK 51.3 billion. A strong
cash position is important since it gives the Company the ability to play a role in industry
consolidation and to strengthen its assets in areas such as systems integration and
consulting.
At my very first Board meeting in April 2002, Ericsson was in a quite different situation.
The Company was in a financial crisis and at that meeting, we took the decision to propose
a rights offering of SEK 30 billion. Since then we have paid back about SEK 41.9 billion in
dividends to our shareholders, including the proposed dividend for 2010. In 2002 the share
price declined below the subscription price of SEK 3.80 per B-share. Following the rights
offering the share price saw sustained growth until 2007. Since then the share price
has underperformed.
It has been an exciting journey for me to help to steer Ericsson and shape the industry
during my years as Chairman of the Board. I have introduced two new CEOs and their
management teams. We have seen the services part of the Company grow to represent
close to 40 percent of revenues. Ericsson and the industry are now in the initial phase of
rolling out mobile broadband on a large scale.
It is an exciting future ahead for Ericsson. Taking into account the Company’s strong
market and financial position, it is well positioned to continue to lead the industry.
After nine years in this position it is time to hand over to my successor. I wish the new
chairman and Ericsson all the best.
Letter from micHaeL trescHow
Michael Treschow
Chairman of the Board

16 | Ericsson Annual Report on Form 20-F 2010
Net sales aNd Net iNcomeSEK billion
operatiNg iNcome aNd operatiNg margiNExcluding restructuring charges and share in earnings of JVs
This Board of Directors’ Report is based on Ericsson’s consolidated financial statements, prepared in accordance with IFRS as endorsed by the EU. The application of reasonable but subjective judgments, estimates and assumptions to accounting policies and procedures affects the reported amounts of assets and liabilities and contingent assets and liabilities at the balance sheet date as well as the reported amounts of revenues and expenses during the reporting period. These amounts could differ materially under different judgments, assumptions and estimates. Please see Note C2 – “Critical Accounting Estimates and Judgments” (p. 55).
Also non-IFRS measures are used to provide meaningful supplemental information to the IFRS results. Non-IFRS measures are designed to facilitate analysis by indicating Ericsson’s underlying performance. However, these measures should not be viewed in isolation or as substitutes to the IFRS measures. A reconciliation of non-IFRS measures with the IFRS results can be found on page 21.
This report includes forward-looking statements subject to risks and uncertainties. Actual developments could differ materially from those described or implied. Please see “Forward-Looking Statements” (p. 105) and “Risk Factors” (p. 99).
The external auditors review the quarterly interim reports, perform audits of the Annual Report and report their findings to the Board and its Audit Committee.
The terms “Ericsson”, “the Group”, and unless the context reasonably requires otherwise also “the Company”, all refer to Telefonaktiebolaget LM Ericsson and its subsidiaries. The “Parent Company” solely refers to Telefonaktiebolaget LM Ericsson. Unless otherwise noted, numbers in parentheses refer to the previous year (i.e. 2009).
BOARD OF DIRECTORS’ REpORT
0
50
100
150
200
250
20102009200820072006
26.4
179.8
208.9 206.5 203.3
22.122.1
11.711.2
4.1
0
5
10
15
20
25
30
187.8
Net sales Net income
NET SAlES SEk 203.3 (206.5) BIllIONsales decreased –2%.
OpERATINg mARgIN 12% (12%)ExCl. JOINT VENTURES AND RESTRUCTURINg ChARgES operating income was 24.4 (24.6) billion.
CASh FlOw SEk 29.8 (28.7) BIllIONcash flow is adjusted for cash outlays for restructuring of seK 3.3 (4.2) billion.
SE
K b
illio
n
0
5
10
15
20
25
30
201020092008
24.4
12%12%11%
23.424.6
Operating income Operating margin
0%
2%
4%
6%
8%
10%
12%
14%
Operating income Operating margin
ContentsVisioN 17
strategy 17
BusiNess focus 18
operatioNal goals aNd results 20
fiNaNcial results of operatioNs 21
fiNaNcial positioN 23
cash flow 25
BusiNess results 27
legal aNd tax proceediNgs 34
material coNtracts 35
corporate goVerNaNce 35
risK maNagemeNt 36
sourciNg aNd supply 36
sustaiNaBility aNd corporate respoNsiBility 37
pareNt compaNy 39
post-closiNg eVeNts 40
Board assuraNce 40

Ericsson Annual Report on Form 20-F 2010 | 17
VisionEricsson’s vision is to be the prime driver in an all-communicating world. The vision of an all-communicating world is rapidly becoming a reality as there are more than 5.3 billion subscriptions today for mobile telecommunications. Ericsson envisions a continued evolution, from having connected 5 billion people to connecting 50 billion “things”. The Company envisions that anything that can benefit from being connected will be connected, mainly via mobile broadband.
strateGyBy leveraging global presence and scale as well as technology and services leadership, Ericsson will continue to be the prime driver in the telecom industry.
global presence and scaleEricsson has today business in more than 180 countries. The Company is the largest provider of operator equipment and with 45,000 service professionals, the Company has secured scale advantages.
Going forward, Ericsson intends to increase its market share in the solution areas: Communication Services, Consumer and Business Applications, Fixed Broadband and Convergence, Managed Services, Mobile Broadband, Operations and Business Support Systems and Television and Media Management.
With its strong financial position, the Company intends to grow also through acquisitions, targeting small and medium-sized companies.
Ericsson sees opportunities to increase its footprint, i.e. installed equipment base, mainly in Europe, where its market share is lower than the overall global position. By outperforming its competitors, there is an opportunity for the Company to grow footprint by achieving a larger part of a roll-out project than initially assigned by the customer.
market iNDicatOrs
In understanding where the market is heading, Ericsson follows different drivers.
For segment Networks the Company monitors the traffic development in the networks and the evolution of the installed equipment. These parameters vary between countries and regions. Operators’ total capital expenditure is not a key indicator since only around 50 percent of the cost is related to telecom. Of the telecom part, about 10-15 percent is designated for telecom equipment. Accordingly, operator capital expenditure can therefore decrease without necessarily impacting Ericsson sales.
For segment Global Services, it is relevant to study operators’ operating expenses, since Ericsson offers services and solutions to reduce their operating cost.
Multimedia is more fragmented, with a number of parameters for different parts of the business.
busiNess mix
Ericsson’s Group margins depend to a high degree on the business mix with the proportion of services, software and hardware content as well as type of projects. Rolling out a new network, increasing coverage, or modernizing a network, means deploying hardware, i.e. radio base stations (RBSs) and controllers, on a large scale. These projects are often won in open tenders in a highly competitive environment. Later, after deployment, the hardware will be regularly upgraded with software to enable for example higher data speeds and new functionality/features. These upgrades normally provide the Company with more even revenue streams. The initial large projects are a necessary first step to secure future software and services business when upgrades and/or expansions of the networks take place.
technology leadershipBy continuing to invest in research and development (R&D), the Company will secure its technology leadership. The objectives are to deliver superior performance and to be the thought leader in the industry.
Ericsson has one of the industry’s largest organizations for R&D.
research aND DevelOpmeNt
The Company’s total spend on R&D was SEK 29.9 (27.0) billion excluding restructuring charges. More than 20,000 people work in developing products and solutions. With approximately 600 research engineers, research accounts for about three percent of the overall investment in R&D.
All research is closely connected to future solutions and products. The applied research usually targets products that will reach the market within three to five years. Research performed in the areas of multimedia and user services target products and solutions which are closer in time. An increasing part of the solutions are software based which requires a different mode of operation in R&D. During the last years, developing
50 billiON cONNectiONs iN 2020
Bill
ion
conn
ectio
ns
0
10
20
30
40
50
1980 1990 2000 2010 2020
THINGS
PEOPLE
PLACES
Turning point for mobile communication

18 | Ericsson Annual Report on Form 20-F 2010
the Company’s software capabilities has been important and a key part of this has been to implement new ways of working. An agile engineering method has been implemented, allowing quick response to market changes. The new ways of working as well as product packaging, enable online delivery of software, and new customization possibilities. The strategy to develop software-based solutions also means new business models in the customer engagement, such as software subscription or software-as-a-service.
The research activities are performed in-house as well as in collaboration with research institutes and universities. An essential part of the research work is performed in parallel with standardization work. Standardization is performed together with peers in different industry bodies. Open standards are a foundation for the industry in order to secure ecosystems and interoperability.
To speed up the transfer of knowledge and research concepts into product development, research engineers responsible for the initial project usually move along to the product development units. To fill the gap in the research organization, Ericsson continuously recruits talented research engineers with the task to take on new projects.
When developing new technologies such as 3G/WCDMA or 4G/LTE, the project cycles have normally been longer, up to ten years. However, when developing new services or applications other project models have been created with shorter lead-times, sometimes only a few months. In order to shorten the time from idea to product, Ericsson has introduced beta tests with up to 1,000 users trying out new services and applications. A focus area for Ericsson is now how to support the commercialization of these ideas into new solutions.
Every quarter, the executive team in Ericsson reviews the project portfolio in R&D. Return on investment is calculated as net present value for the different projects.
Read more about Ericsson’s R&D in 2010 on page 19.
Intellectual ProPerty rIGHtS anD lIcenSInG
The intellectual property rights (IPR) are licensed to other companies (infrastructure equipment suppliers, embedded module suppliers, handset suppliers and mobile application developers) in return for royalty payments and/or access to their IPRs. The Company is of the opinion that it has access to all essential patents that are material to the business in part or in whole. The net revenue from IPRs was about SEK 4.6 (4.5) billion in 2010.
Services leadershipWith 45,000 service professionals across the world, the Company has the industry’s largest services organization. The Company provides managed services, consulting and systems integration, customer support and network rollout.The services organization, with its broad skills and experiences, provides a competitive advantage for sales of infrastructure.
Drawing on the experiences gained in providing services related to the infrastructure business, the Company is also able to offer new, more advanced and stand-alone services,
such as managing data centers. A key area is to develop new business models such as network sharing and new ways of bundling technology and services. The Company has over the years strengthened its competence in services through the insourcing of staff from telecom operators and acquiring small and medium-sized companies in the field of consulting and systems integration.
Moving into new industry segmentsEricsson has in 2010 taken the decision to increase its efforts to approach customers in new segments, such as governments, health industry, transport and utilities. These are industries with either similar business models as telecom operators and/or obvious benefits from mobile broadband.
Guiding principlesThe basic principles for Ericsson’s strategy are:
>> Customer intimacy; highly qualified employees working closely with the customer to create effective solutions
>> Continuous process improvements and innovation in all areas
>> Scale in delivery and technical solutions.
Business>focusMeeting demand for mobile broadband worldwideThe business focus in 2010 has been to provide operators with mobile broadband. The most obvious driver of this development was the massive data traffic growth, especially in the US and Japan.
Recently introduced mobile devices such as smartphones and tablets drive data traffic and the need for higher speeds and enhanced capacity in the networks.
Telecom operators across the world see an increasing part of their revenues emerging from data, although voice still is the main source for sales revenues. For some operators in Japan, mobile data represents more than 50 percent of total revenues. In many countries, such as the US, operators have introduced tiered pricing for mobile data services, further spurring demand for data services. In addition, quality of service has become a
Mobile PC and tablets
Handheld devices
MobIle broaDbanD GrowtHSubscriptions (billion)
0
0.5
1.0
1.5
2.0
2.5
3.0
3.5
4.0
4.5
5.0
20162010

Ericsson Annual Report on Form 20-F 2010 | 19
Of the total cost for development of new products in 2010, the majority was spent on further enhancements of 3G/WCDMA/HSPA as well as 4G/LTE. Resources are also spent on further adaptations of 2G/GSM although at lower levels compared to previous years.
The complexity in the industry with a number of technologies installed, new solutions and services as well as more frequencies used, requires continued efforts in R&D to secure Ericsson’s technology leadership also in coming years.
Current radio research focus is on ensuring that radio networks can handle the massive data growth that we have experienced since introducing mobile broadband technologies.
Ericsson held approximately 27,000 (25,000) granted patents globally as of December 31, 2010. The Company believes it holds approximately 25 percent of all essential patents in LTE.
The Company has a number of essential patents relating to GSM, Edge, WCDMA, HSPA, TD-SCDMA, CDMA2000, WiMAX and LTE. Ericsson also holds patents in other areas, including IMS, voice-over-IP, ATM, messaging, WAP, Bluetooth, SDH/SONET, WDM and carrier Ethernet.
Read more about Ericsson’s R&D strategy and IPR’s on page 17.
increasing services businessIn 2010, 54 (30) managed services contracts were signed, with fixed, mobile and cable operators and for enterprise networks. 26 (9) of the contracts were extensions or expansions.
The year was also characterized by further acquisitions. The Company acquired companies in the area of consulting and systems integrations:
> Pride in Italy with 1,000 employees
> InCode, a US strategy and consulting firm with 45 employees
> Optimi, a US-Spanish network management and optimization company with 200 employees.
competence and skillsEricsson introduced a new go-to-market model in 2010. The Company set up ten regions, replacing the former 23 market units. The regions approach customers with solutions, covering services, software and hardware. By this, Ericsson will move from a product-led to a solutions-led sales approach, selling the full breadth of the portfolio. The Company also started up projects in the regions, developing solutions for new customer segments.
At year end, Ericsson had 90,261 (82,493) employees. In 2010, 5,250 individuals joined Ericsson through acquisitions and about 1,300 through managed services contracts. Approximately 5,000 were made redundant and 6,000 were recruited. The vast majority of recruitments took place in India, China and Brazil. These new recruitments were primarily made within the areas of R&D and service delivery.
Half of the workforce, 45,000 people, are service professionals. The competence and capabilities of the Company’s employees is increasingly service and software oriented.
differentiator for operators, driving investments for expansions and upgrades.
For Ericsson, this resulted in an increasing demand for mobile broadband and quicker than expected ramp-up of volumes of the new radio-base station RBS 6000. During the first half of 2010, Ericsson was still impacted by the cautious operator investments that started in the second half of 2009. The Company also put a lot of focus on mitigating the effects of the industry-wide component shortage that occurred mid 2010. While the supply of components has now normalized, we are still not fully meeting the increased demand on certain mobile broadband products. The total global number of mobile subscriptions is 5.3 billion. In 2010, mobile broadband subscriptions increased more than 60 percent to approximately 600 million, still only representing some 10 percent of total mobile subscriptions. Ericsson expects the strong uptake for mobile broadband to continue in 2011. Already in 2011, the number of mobile broadband subscriptions is expected to hit one billion. This development is mainly driven by the use of smartphones. Devices with embedded modules such as tablets are also expected to show continuously strong growth.
increasing market shareIn 2010, focus was also on increasing footprint in Europe and to secure footprint in the rollout of 3G networks in India. In Europe, approximately 800,000 radio-base stations are expected to be replaced. These base stations were installed before 2004 and consume 30 percent more energy than new equipment. Since energy represents a significant part of the total operating expenses of a radio site, replacement is a good business case. Ericsson has seen the initial modernization of networks in Europe and has so far managed to gain contracts in countries where the Company previously had a weaker position. However, modernization projects typically last for a couple of years, so it is still too early to conclude what the Company’s market position will be. Ericsson has in general a lower market share in Europe than in the rest of the world. This was a result of the 3G rollouts that took place in Europe approximately eight years ago. Ericsson was then in a financially turbulent situation and lost out on certain 3G deals.
In India, 3G rollouts started in 2010 and Ericsson has maintained a market share in line with its 2G position.
Ericsson also acquired companies to strengthen its market position:
> Nortel’s GSM business in North America with 350 employees
> Nortel’s share in LG-Nortel in Korea with 1,300 employees.Ericsson also signed agreements to acquire GDNT, a Chinese R&D and services company with 1,100 employees, and the Nortel multi-service switch business. These two businesses were not consolidated in 2010.
technologyEricsson invested SEK 29.9 (27.0) billion in R&D in 2010, excluding restructuring charges. The increase is mainly a result of consolidation of acquired companies.

20 | Ericsson Annual Report on Form 20-F 2010
custOmer satisFactiON aND emplOYee eNgagemeNt
Excellence
Strength
Potential
Improvements needed
40
50
60
70
80
20102009200820072006
Customer satisfaction Employee engagement
ObJectives
GROW FASTER THAN THE MARKET
BEST IN CLASS OPERATING MARGINS
STRONG CASH CONVERSION >70%
GROWTH IN JV EARNINGS
operationaL GoaLs and resuLts Ericsson’s overall goal is to create shareholder value. Management uses four metrics to monitor the Company’s overall performance: faster than market sales growth, a best-in-class margin, a strong cash conversion and growth in JV earnings.
shareholder value creation
grOWth iN Jv earNiNgs
JV earnings improved in 2010 to SEK –0.7 (–6.1) billion, excluding restructuring charges. Ericsson’s share in earnings in Sony Ericsson was SEK 0.9 (–4.8) billion, excluding restructuring charges, and in ST-Ericsson SEK –1.5 (–1.3) billion, excluding restructuring charges. Sony Ericsson’s improved results were driven by a streamlined product portfolio focused on higher-end smartphones and an improved cost structure. ST-Ericsson is on its way of completing the transition program and has new products coming.
Other performance indicatorsEricsson believes that satisfied customers and motivated employees are key to success.
custOmer satisFactiON
Every year, an independent customer satisfaction survey is performed. In 2010, approximately 10,000 representatives, in different professions, of Ericsson customers around the world were polled to assess their satisfaction with Ericsson, compared to its main competitors. Over the past five years, Ericsson has maintained a level of excellence. The goal is to increase this level further.
emplOYee eNgagemeNt
In 2004 Ericsson began measuring motivation among its employees. This survey is conducted by an independent company. In 2010, 87 (91) percent of all employees across the world responded to the survey. The human capital index, which measures employee contribution in adding value for customers and meeting business goals, was 72 (69). This is a high level, but as with customer satisfaction, the objective is to further increase employee engagement and motivation.
grOW Faster thaN the market
The Company is the largest provider of operator equipment. In the market for 4G/LTE, the Company’s market share is higher than for earlier radio technology generations since Ericsson has managed to get a good start in the rollout of 4G/LTE. The 4G/LTE market is still small though, since it is in its initial phase. When including CDMA in the operator equipment market, Ericsson increased its market share in 2010 due to the acquired Nortel business. In professional services, the company is estimated to have kept or slightly increased its market share. The overall market position for segment Multimedia is difficult to assess, as the market is fragmented.
best-iN-class OperatiNg margiN
The operating margin for the Company, excluding joint ventures and restructuring charges, was 12 (12) percent. Based on reported results for 2010, we believe the margin remains the highest among the Company’s traditional telecom competitors that are publicly listed.
cash cONversiON OF Over 70 perceNt
The cash conversion rate for 2010 was 112 (117) percent, reflecting a strong focus on cash flow and a higher net income. Cash conversion is defined as cash flow from operating activities divided by net income reconciled to cash.
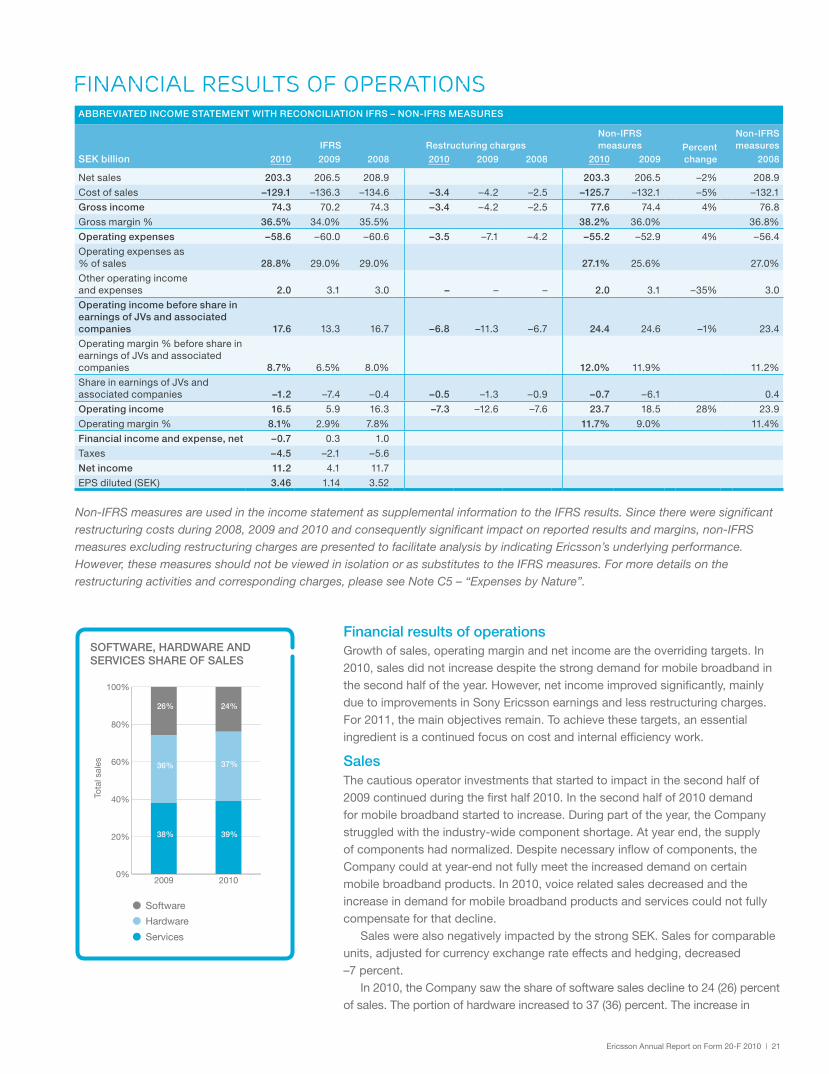
Ericsson Annual Report on Form 20-F 2010 | 21
Financial results of operationsGrowth of sales, operating margin and net income are the overriding targets. In 2010, sales did not increase despite the strong demand for mobile broadband in the second half of the year. However, net income improved significantly, mainly due to improvements in Sony Ericsson earnings and less restructuring charges. For 2011, the main objectives remain. To achieve these targets, an essential ingredient is a continued focus on cost and internal efficiency work.
salesThe cautious operator investments that started to impact in the second half of 2009 continued during the first half 2010. In the second half of 2010 demand for mobile broadband started to increase. During part of the year, the Company struggled with the industry-wide component shortage. At year end, the supply of components had normalized. Despite necessary inflow of components, the Company could at year-end not fully meet the increased demand on certain mobile broadband products. In 2010, voice related sales decreased and the increase in demand for mobile broadband products and services could not fully compensate for that decline.
Sales were also negatively impacted by the strong SEK. Sales for comparable units, adjusted for currency exchange rate effects and hedging, decreased –7 percent.
In 2010, the Company saw the share of software sales decline to 24 (26) percent of sales. The portion of hardware increased to 37 (36) percent. The increase in
abbreviateD iNcOme statemeNt With recONciliatiON iFrs – NON-iFrs measures
iFrs restructuring charges Non-iFrs measures percent
change
Non-iFrs measures
sek billion 2010 2009 2008 2010 2009 2008 2010 2009 2008
Net sales 203.3 206.5 208.9 203.3 206.5 –2% 208.9
Cost of sales –129.1 –136.3 –134.6 –3.4 –4.2 –2.5 –125.7 –132.1 –5% –132.1
gross income 74.3 70.2 74.3 –3.4 –4.2 –2.5 77.6 74.4 4% 76.8
Gross margin % 36.5% 34.0% 35.5% 38.2% 36.0% 36.8%
Operating expenses –58.6 –60.0 –60.6 –3.5 –7.1 –4.2 –55.2 –52.9 4% –56.4
Operating expenses as % of sales 28.8% 29.0% 29.0% 27.1% 25.6% 27.0%
Other operating income and expenses 2.0 3.1 3.0 – – – 2.0 3.1 –35% 3.0
Operating income before share in earnings of Jvs and associated companies 17.6 13.3 16.7 –6.8 –11.3 –6.7 24.4 24.6 –1% 23.4
Operating margin % before share in earnings of JVs and associated companies 8.7% 6.5% 8.0% 12.0% 11.9% 11.2%
Share in earnings of JVs and associated companies –1.2 –7.4 –0.4 –0.5 –1.3 –0.9 –0.7 –6.1 0.4
Operating income 16.5 5.9 16.3 –7.3 –12.6 –7.6 23.7 18.5 28% 23.9
Operating margin % 8.1% 2.9% 7.8% 11.7% 9.0% 11.4%
Financial income and expense, net –0.7 0.3 1.0
Taxes –4.5 –2.1 –5.6
Net income 11.2 4.1 11.7
EPS diluted (SEK) 3.46 1.14 3.52
financiaL resuLts of operations
Non-IFRS measures are used in the income statement as supplemental information to the IFRS results. Since there were significant restructuring costs during 2008, 2009 and 2010 and consequently significant impact on reported results and margins, non-IFRS measures excluding restructuring charges are presented to facilitate analysis by indicating Ericsson’s underlying performance. However, these measures should not be viewed in isolation or as substitutes to the IFRS measures. For more details on the restructuring activities and corresponding charges, please see Note C5 – “Expenses by Nature”.
Tota
l sal
es
0%
20%
40%
60%
80%
100%
20102009
37%
24%
36%
39%38%
26%
Software
Hardware
Services
sOFtWare, harDWare aND services share OF sales

22 | Ericsson Annual Report on Form 20-F 2010
hardware is a result of demand for mobile broadband products. In the short term, the software share might continue to decrease due to a higher portion of projects with a lot of hardware. Longer term, the software part should increase following more expansions and upgrades of networks.
seasonalityThe Company’s quarterly sales, income and cash flow from operations are seasonal in nature, generally lowest in the first quarter of the year and highest in the fourth quarter. This is mainly a result of the seasonal purchase patterns of network operators.
mOst receNt Five-Year average seasONalitY
First quarter
second quarter
third quarter
Fourth quarter
Sequential change –21% 9% –5% 30%
Share of annual sales 22% 25% 23% 30%
gross marginGross margin, excluding restructuring charges, improved to 38 (36) percent due to business mix with a higher proportion of network upgrades and expansions. Cost of sales was also reduced as a result of efficiency work.
Operating expensesTo secure continued technology leadership, focus is on innovation and R&D. R&D expenses amounted to SEK 29.9 (27.0) billion. Spending on R&D as a percentage of sales was 15 (13) percent. The increase is a result of lower sales, higher investments in certain R&D areas and the acquired Nortel and LG-Ericsson operations. In 2011, R&D expenses of approximately SEK 31–33 billion is estimated, including restructuring charges. The amount might fluctuate due to currency exchange rate effects.
Selling and administrative expenses, excluding restructuring charges, was stable in relation to sales 12 (13) percent. The amount was SEK 25.3 (25.9) billion. In the year, there were positive effects from efficiency work along with the strong SEK. However, costs for the integration of acquired companies impacted negatively. The Company also conducted a growing number of LTE trials across the world which increased selling and administrative expenses.
Operating margin before JvsDespite the improved gross margin, operating margin, before share in JV earnings and excluding restructuring charges, was flat at 12 (12) percent. This was an effect of increased R&D expenses.
share in earnings of JvsSony Ericsson returned to profit in 2010, after two years of losses. The turnaround has been possible thanks to restructuring and a streamlined product portfolio focused on higher-end smartphones.
ST-Ericsson is still reporting a loss. The company is on its way of completing the transition program and has new products coming. Ericsson’s share in Sony Ericsson’s income before tax was SEK 0.9 (–4.8) billion, excluding restructuring charges. Ericsson’s share in ST-Ericsson’s income before tax, adjusted to
IFRS, was SEK –1.5 (–1.3) billion, excluding restructuring charges.
Operating income Operating income increased significantly, due to improved earnings in Sony Ericsson.
Financial netThe financial net was SEK –0.7 (0.3) billion. The difference is mainly attributable to a negative impact of around SEK 0.6 billion due to foreign exchange currency revaluation effects and lower interest net of SEK 0.3 billion compared to 2009.
taxesThe tax expense for the year was SEK 4.5 (2.1) billion or 28.8 (33.9) percent of income after financial items. The tax rate may vary between years depending on business and geographic mix. The tax rate excluding joint ventures and associated companies was 25.7 (25.7) percent due to lower tax rate from the loss-making joint venture.
Net incomeNet income increased SEK 7.1 billion to SEK 11.2 (4.1) billion as a result of improved earnings in Sony Ericsson and less restructuring charges.
earnings per share, dilutedEarnings per share increased by SEK 2.32 to SEK 3.46 (1.14), as a result of improved net income. The Board of Directors proposes a dividend of SEK 2.25 (2.00).
restructuring chargesTotal restructuring charges were SEK 6.8 (11.3) billion. Cash outlays was SEK 3.3 (4.2) billion. A cost reduction program was initiated in 2009 and completed by the second quarter 2010. Charges of SEK 4.2 billion were recognized in 2010 related to the program. In the second half of the year, an additional SEK 2.6 billion in charges were recognized. These charges primarily relate to efficiency activities in service delivery, product development and administration. At the end of the year, cash outlays of SEK 3.2 billion remain to be made. In 2011, restructuring charges of approximately SEK 2 billion are estimated.
research aND DevelOpmeNt prOgram
2010 2009 2008
Expenses (SEK billion) 1) 29.9 27.0 30.9
As percent of Net sales 14.7% 13.1% 14.8%
Employees within R&D as at December 31 2) 20,800 18,300 19,800
Patents 2) 27,000 25,000 24,0001) Excluding restructuring charges.2) The number of employees and patents are approximate.

Ericsson Annual Report on Form 20-F 2010 | 23
cONsOliDateD balaNce sheet (abbreviateD)
December 31, sek billion 2010 2009 2008 2010 2009 2008
assets equitY aND liabilities
Non-current assets, total 83.4 87.4 87.2 Equity 146.8 141.0 142.1
of which intangible assets 46.8 48.2 48.2 Non-current liabilities 38.3 43.3 39.5
of which property, plant and equipment 9.4 9.6 10.0 of which post-employment benefits 5.1 8.5 9.9
of which financial assets 14.5 15.3 14.1 of which borrowings 27.0 30.0 24.9
of which deferred tax assets 12.7 14.3 14.9 of which other non-current liabilities 6.2 4.8 4.7
Current assets, total 198.4 182.4 198.5 Current liabilities 96.8 85.5 104.1
of which inventory 29.9 22.7 27.8 of which provisions 9.4 12.0 14.0
of which trade receivables 61.1 66.4 75.9 of which current borrowings 3.8 2.1 5.5
of which other receivables/financing 20.2 16.6 19.8 of which trade payables 25.0 18.9 23.5
of which short-term investments, cash and cash equivalents
87.2
76.7
75.0
of which other current liabilities 58.6 52.5 61.0
total assets 281.8 269.8 285.7 total equity and liabilities 1) 281.8 269.8 285.71) Of which interest-bearing liabilities and post-employment benefits SEK 35.9 billion (SEK 40.7 billion in 2009).
financiaL position
Ericsson’s strategy is to maintain a strong balance sheet including a sufficiently large cash position to ensure the financial flexibility to operate freely and to capture business opportunities. This has been particularly important during the past years’ difficult macroeconomic and financial market situation.
By maintaining a strong cash position, the Company can also maintain an active strategy for mergers and acquisitions. During 2010, Ericsson made five acquisitions and strengthened its market position in the USA and Korea along with adding competencies in consulting and systems integration.
An important focus area is the release of working capital. Major efforts have been made during the year in order to reduce days sales outstanding and inventory turnover days as well as to increase payable days. The target for inventory turnover days was not met, while the other two were achieved. The efforts to release further working capital will continue in 2011.
At year end, the strong SEK impacted net operating assets positively when translating assets denominated in foreign currencies into SEK.
The Board of Directors will propose to the Annual General Meeting 2011 a dividend of SEK 2.25 per share. In 2010, the dividend was SEK 2.00 per share. When considering the level of dividend, the Board of Directors take into account the need to secure a continued strong cash position as well as capital needed in order to secure a healthy business going forward.
current assetsinventory levels have been higher than expected due to the industry-wide component shortage and supply chain bottlenecks. At year end, inventory was SEK 29.9 (22.7) billion. The higher inventory level followed a higher level of work in progress in the regions. This was an effect from delayed project implementations within network rollout due to the component shortage earlier in the year. Effects from component shortage and supply chain bottlenecks were eliminated at year end while there was still an impact of slightly higher component inventories. The target of inventory turnover days less than 65 days was not reached and improvement efforts will continue in 2011.
keY ratiOs
Days sales outstanding Target is less than 90 days
Inventory turnover daysTarget is less than 65 days
Payable days Target is more than 60 days
0
60
80
100
120
20102009200820072006
102
85
71
106 106
88
70
54 57
68 68
74
55 5762

24 | Ericsson Annual Report on Form 20-F 2010
0
1
2
3
4
5
6
2020
2017
2016
2015
2014
2013
2012
2011
2010
3.4
5.4
3.4
4.0
2.0
1.21.2
4.5
1.2
trade receivables: Days sales outstanding reached high levels in parts of the year, but had improved significantly at year end, reaching 88 (106) days at year end. The improvement was mainly due to a strong collection and positive effects from a stronger SEK. The Company’s nominal credit losses have historically been low and continued to be so in 2010. Net cash increased to SEK 51.3 (36.1) billion, mainly due to a strong operating cash flow. Read more about changes in cash on page 25.
equityEquity increased by SEK 5.8 billion to SEK 146.8 (141.0) billion. Net income was SEK 11.2 (4.1) billion and a dividend of SEK 6.7 (6.3) billion was paid during the year. The equity ratio was maintained at a healthy level of 52 (52) percent.
Return on equity increased to 7.8 (2.6) percent, primarily due to improved earnings in the joint venture Sony Ericsson and less restructuring charges.
Return on capital employed (ROCE) improved to 9.6 (4.3) percent. Excluding restructuring charges, ROCE would have been 13.6 (11.2) percent.
Non-current liabilitiespost-employment benefits related to defined benefit plans declined to SEK 5.1 (8.5) billion. The year 2010 was characterized by a general increase in discount rates and plan assets yielded higher than expected. Consequently, the Company experienced a decrease in the net pension liability and the funded ratio (plan assets as percentage of defined benefit obligations) increased to 89 (76) percent.
current liabilitiesprovisions declined to SEK 9.4 (12.0) billion. SEK 3.2 (4.3) billion were related to restructuring. The cash outlays of provisions were SEK 7.2 billion. The lower amount of provisions is mainly a result of business mix with more upgrades and expansions. There is also an effect of improved project management as well as geographical mix. Provisions will fluctuate over time, depending on business mix, market mix and technology shifts.payable days increased by five days to 62 (57) days. The target of payable days of above 60 days was met.Non-current borrowings decreased to SEK 27.0 (30.0) billion. No major changes were made in the debt maturity profile during 2010. Debt of SEK 3.4 billion is maturing in 2012 and SEK 5.4 billion in 2013. The Company also has unutilized committed credit facilities of USD 2.0 billion available, maturing in 2014.
credit ratings at “solid investment grade”Credit ratings were unchanged during 2010, remaining at “solid investment grade”: Moody’s at Baa1 and Standard & Poor’s at BBB+, both with stable outlook.
Off-balance sheet arrangementsThere are currently no material off-balance sheet arrangements that have, or would be reasonably likely to have, a current or anticipated effect on the Company’s financial condition, revenues, expenses, result of operations, liquidity, capital expenditures or capital resources.
Notes and bonds
Financial leases
Loan from the European Investment Bank
Loan from the Swedish Export Credit Corporation
Debt maturitY prOFileSEK billion
returN ON capital emplOYeDPercent
0
6
12
18
24
30
20102009200820072006
27.4%
20.9%
11.2%
4.3%
11.3%9.6%
4.3%
Loan from the Swedish Export Credit Corporation, guaranteed by the Swedish Export Credit Guarantee Board

Ericsson Annual Report on Form 20-F 2010 | 25
capital expendituresAnnual capital expenditures are normally around two percent of sales and are expected to remain at this level. This corresponds to the needs for keeping and maintaining the current capacity level, including the introduction of new technology and methods. The expenditures are largely related to test equipment in R&D units, network operations centers as well as manufacturing and repair operations.
The Board of Directors reviews the Company’s investment plans and proposals.
The Company has sufficient cash and cash generation capacity to fund expected capital expenditures as well as acquisitions without external borrowings in 2011.
We believe that the Company’s property, plant and equipment and the facilities the Company occupies are suitable for its present needs in most locations. As of December 31, 2010, no material land, buildings, machinery or equipment were pledged as collateral for outstanding indebtedness.
capital expeNDitures 2006–2010
sek billion 2010 2009 2008 2007 2006
Capital expenditures 3.7 4.0 4.1 4.3 3.8
of which in Sweden 1.4 1.3 1.6 1.3 1.0
as percent of net sales 1.8% 1.9% 2.0% 2.3% 2.2%
At the end of the year, gross cash had increased by SEK 10.4 billion to SEK 87.2 (76.7) billion. The increase was mainly attributed to a strong cash flow from operating activities of SEK 26.6 (24.5) billion, offsetting investing activities of SEK 12.5 (37.5) billion and a dividend to shareholders of SEK 6.7 (6.3) billion.
Net cash increased to SEK 51.3 (36.1) billion.
cash flow from operating activitiesThe adjusted operating cash flow was positively impacted by improved net income as well as released working capital.
Cash flow from operating activities tends to fluctuate between quarters. This is due to changes in trade receivables where there is a seasonal effect from project completion. There is also an effect from seasonal purchase patterns of network operators. The cash flow is therefore evaluated on a yearly basis.
cash flow from investing activitiesCash outlays for recurring investing activities increased slightly to SEK –5.2 (–4.9) billion.
Acquisitions and divestments during the year were net SEK –2.8 (–18.1) billion, with the major items being the Nortel stake in the LG-Nortel joint venture and Nortel’s GSM business in North America. Divestments were SEK 0.5 (1.2) billion.
Cash outflow for short-term investments for cash management purposes and other investing activities was net SEK –4.5 (–14.5) billion, largely attributable to SEK –3.0 (–17.1) billion of short-term investments.
cash FlOW (abbreviateD) JaNuarY-December
sek billion 2010 2009 2008
Net income 11.2 4.1 11.7
Income reconciled to cash 23.7 21.0 26.0
Changes in operating net assets 2.9 3.5 –2.0
Cash flow from operating activities 26.6 24.5 24.0
Adjusted operating cash flow 1) 29.8 28.7 22.1
Cash flow from investing activities –12.5 –37.5 –8.5
of which capital expenditures, sales of PP&E, product development –5.2 –4.9 –4.1
of which acquisitions/divestments, net –2.8 –18.1 1.8
of which short-term investments for cash management purposes and other investing activities –4.5 –14.5 –6.2
Cash flow before financing activities 14.0 –13.0 15.5
Cash flow from financing activities –5.7 –1.7 –7.2
Cash conversion (Cash flow from operating activities divided by income reconciled to cash) 112% 117% 92%
Gross cash (Cash, cash equivalents and short-term investments) 87.1 76.7 75.0
Net cash (Gross cash less interest-bearing liabilities and post-employment benefits) 51.3 36.1 34.71) Cash flow from operations excl. restructuring cash outlays that have been provided for.
casH fLow
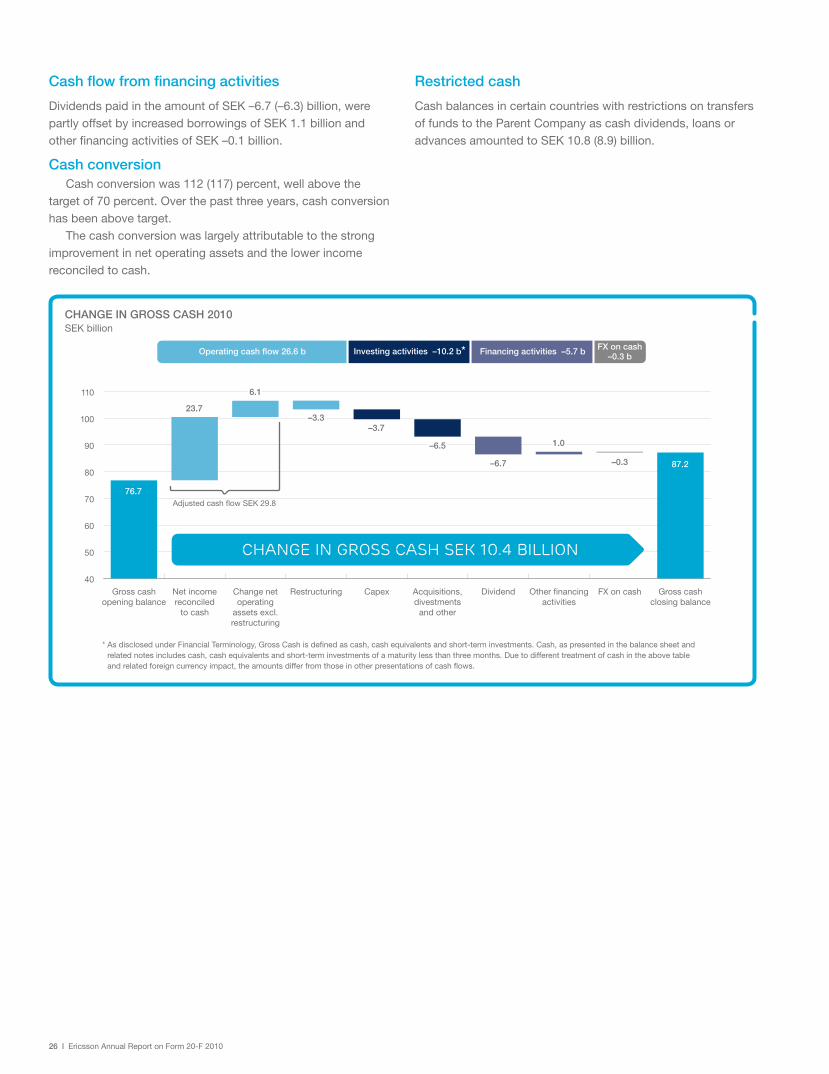
26 | Ericsson Annual Report on Form 20-F 2010
cash flow from financing activities
Dividends paid in the amount of SEK –6.7 (–6.3) billion, were partly offset by increased borrowings of SEK 1.1 billion and other financing activities of SEK –0.1 billion.
cash conversionCash conversion was 112 (117) percent, well above the
target of 70 percent. Over the past three years, cash conversion has been above target.
The cash conversion was largely attributable to the strong improvement in net operating assets and the lower income reconciled to cash.
restricted cash
Cash balances in certain countries with restrictions on transfers of funds to the Parent Company as cash dividends, loans or advances amounted to SEK 10.8 (8.9) billion.
Operating cash flow 26.6 b Investing activities –10.2 b* FX on cash –0.3 b
Financing activities –5.7 b
40
50
60
70
80
90
100
110
Gross cashclosing balance
FX on cashOther financingactivities
DividendAcquisitions,divestments
and other
CapexRestructuringChange netoperating
assets excl.restructuring
Net incomereconciled
to cash
Gross cashopening balance
Change in gross cash SEK 10.4 bILLION
87.2
76.7
23.7
Adjusted cash flow SEK 29.8
6.1
–3.3
–6.5 1.0
6.1
1.0
–3.3–3.7
–6.5
–6.7 –0.3
chaNge iN grOss cash 2010SEK billion
* As disclosed under Financial Terminology, Gross Cash is defined as cash, cash equivalents and short-term investments. Cash, as presented in the balance sheet and related notes includes cash, cash equivalents and short-term investments of a maturity less than three months. Due to different treatment of cash in the above table and related foreign currency impact, the amounts differ from those in other presentations of cash flows.

Ericsson Annual Report on Form 20-F 2010 | 27
sales bY regiON 2010Net sales (SEK billion and percent)
Business resuLtsregional developmentThe regions are the Company’s primary sales channels. As of January 1, 2010, Ericsson has changed its geographical reporting. Instead of the five geographical areas reported in previous years, ten regions are reported, mirroring the new internal geographical organization.
sales per regiON aND segmeNt 2010
sek billion Networksglobal
servicesmulti-media total
percent change
North America 30.5 17.7 1.3 49.5 107%
Latin America 9.2 7.7 0.9 17.9 –11%
Northern Europe & Central Asia 7.2 4.3 0.6 12.2 2%
Western & Central Europe 8.3 10.5 1.0 19.9 –12%
Mediterranean 10.6 10.6 1.4 22.6 –10%
Middle East 7.2 6.6 1.4 15.1 –17%
Sub-Saharan Africa 3.6 4.6 1.0 9.2 –40%
India 5.1 2.8 0.7 8.6 –43%
China & North East Asia 17.1 8.3 0.5 26.0 0%
South East Asia & Oceania 7.8 6.5 0.6 14.9 –29%
Other* 6.0 0.5 1.1 7.4 4%
total 112.7 80.1 10.5 203.3 –2%
Share of total 56% 39% 5 % 100%
Percent change –1% 1% –21% –2%
* Other – This includes sales of e.g. mobile broadband modules, cables, power modules as well as licensing and IPR. Mobile broadband modules are sold directly by business unit Networks to PC/netbook manufacturers. A central IPR unit manages sales of licenses to equipment vendors or others who wish to use Ericsson’s patented technology. TV solutions are sold both through other equipment vendors as resellers and directly by business unit Multimedia to cable-TV operators.
NOrth america
Sales was positively impacted by the acquired Nortel businesses and negatively affected by the strong SEK. Ericsson became the largest player in the region, driven by organic growth as well as acquisitions. The main growth drivers were the managed services agreement with Sprint, data traffic driven network expansions and the initial build out of LTE networks. Ericsson is a leading supplier of WCDMA/CDMA and LTE to Verizon, AT&T and MetroPCS. MetroPCS and Verizon commercially launched their LTE networks in 2010. North America is Ericsson’s largest market measured in sales and its second largest after Sweden measured in number of employees.
Sprint announced Ericsson as key partner in their network evolution strategy “Network vision” program.
latiN america
The region was characterized by major mergers between regional operators. Lower cost smartphones have created continuous growth in mobile broadband usage, driving operators to invest in networks and services. The services business developed favorably, especially managed services. LTE trials are ongoing in the region.
The world’s first solution to connect public buses to mobile broadband was provided by Dataprom and Ericsson in Brazil. Ericsson was also selected to manage Telefonica’s network operation center in São Paulo with core, transmission and fixed-access equipment.
The contracts mentioned are a selection of deals signed by Ericsson in 2010. Ericsson normally publicly announces only a part of its wins. Typically only agreements that have some kind of significance in terms of strategy or value are announced via a press release. Ericsson also always seeks for customer approval for any contract release.
8.6
9.2
26
14.9 7.4
15.1
22.619.9
49.5
17.912.2
24%
9%
6%
10%11%
7%
4%
5%
13%
7%4%
Latin America
North America
Northern Europe and Central Asia
Western and Central Europe
Mediterranean
Middle East
India
Sub-Saharan Africa
China and North East Asia
South East Asia and Oceania
Other*
0 5 10 15 20 25 30
17.7
1.3
30.5
0 5 10 15 20 25 30
9.2
7.7
0.9
latiN america
Networks Global Services Multimedia
sales per regiON aND segmeNt 2010SEK billion
NOrth america

28 | Ericsson Annual Report on Form 20-F 2010
NOrtherN eurOpe aND ceNtral asia
In the eastern part of the region, both 2G expansions and mobile broadband buildouts are taking place. In Scandinavia, focus is on 4G/LTE deployments. 4G/LTE trials are planned or ongoing across the region. Operators have operational efficiency high on the agenda, which creates good demand for managed services. Denmark’s leading operator TDC is about to upgrade to 4G/LTE and has chosen Ericsson to supply and manage its nationwide network. Ericsson was also chosen to provide the broadband access network based on VDSL2 technology to TeliaSonera.
WesterN aND ceNtral eurOpe
Mobile broadband usage continues to increase in the region. Following conclusions of auctions for 4G/LTE in several markets, Ericsson has been selected for a number of 4G/LTE trials now being implemented with major operators. Ericsson is also supporting operators in connection with data capacity and modernization projects. Operators’ focus on efficiency continued to drive strong interest for managed services, network sharing and network transformation leading to opportunities in both services and networks. The UK is at the forefront of network sharing. Ericsson has completed the consolidation of shared sites (over 12,000) for Mobile Broadband Network Ltd (MBNL). Ericsson also extended the managed services business through extensions of existing contracts. This includes a three-year extension with Netia Poland, as well as a renewed and expanded multi-country managed services contract with TeliaSonera International Carrier for field operation services for voice and data networks, built on multi-vendor equipment. Ericsson also signed a five-year managed field service contract for Vodafone in Germany.
meDiterraNeaN
Operator investments especially in Spain and Greece were cautious due to the overall economic environment and price competition among operators. In order to meet demand for mobile broadband services, operators continued to focus on network modernization. Operational efficiency continues to be high on the agenda, creating good momentum for managed services and consulting in networks as well as in all ICT areas.
Ericsson signed a seven-year managed services contract with 3 Italia for data center consolidation and modernization of IT infrastructure.
The largest utility company in Spain, Endesa, selected Ericsson to operate its corporate telecommunication network.
miDDle east
The sales drop was caused by cautious operator investments in parts of the region. Development in the region showed large variations where the Gulf countries continued to show good momentum, while most other parts of the region were slow. Services continues to be a large part of the business, representing 43 percent of total sales. Operators are starting to show interest in 4G/LTE with several trials going on throughout the region. Mobile subscriptions in the region are developing positively with net additions for both voice and broadband services.
To offer innovative services to its customers, the Qtel Group chose Ericsson’s Service Delivery Platform. Its customers across the Middle East, North Africa and South East Asia get access to new multimedia services such as social networking and mobile music.
sales per regiON aND segmeNt 2010SEK billion
NOrtherN eurOpe & ceNtral asia
0 5 10 15 20 25 30
7.2
4.3
0.6
0 5 10 15 20 25 30
8.3
10.5
1.0
0 5 10 15 20 25 30
10.6
10.6
1.4
0 5 10 15 20 25 30
7.2
6.6
1.4
WesterN & ceNtral eurOpe
meDiterraNeaN
miDDle east
Networks Global Services Multimedia

Ericsson Annual Report on Form 20-F 2010 | 29
sub-saharaN aFrica
The region was impacted by the global economic downturn with a tight credit environment as well as operator consolidation. The region is predominately a market where 2G rollouts are in focus. However, demand for mobile broadband is emerging throughout the region, although at a low pace. Services sales increased and now represents 50 percent of total sales.
iNDia
India sales were impacted by 3G auctions and security clearance in the first half of the year. In the middle of the year, Ericsson got security clearance for deliveries of equipment. In the fall, contracts for 3G deployments were signed. Ericsson has a market share for 3G which is in line with its 2G position. Throughout the year, the recurring services business maintained good development. Radius Infratel signed a fiber-to-the-home contract with Ericsson, providing more than half a million subscribers with fixed broadband.
chiNa aND NOrth-east asia
While operators on mainland China are still focused on successful 3G launches, operators across the region also now have 4G/LTE on the agenda. In Japan, demand for mobile broadband had a positive effect on sales.
Ericsson won a managed services contract with China Unicom for field maintenance of radio base station sites, fixed network and transmission as well as a contract with China Mobile for field maintenance of radio base station sites. Leading Japanese operator SoftBank Mobile invested in capacity by upgrading its HSPA radio access network with Ericsson’s RBS 6000. Increased use of smartphones and advanced mobile applications boost data traffic and in order to ensure continued user quality, EMOBILE has enhanced its network with 3G/HSPA 42 Mbps supplied by Ericsson.
On June 30, the acquisition of Nortel’s part of LG-Nortel was completed. This positions Ericsson as a leading vendor in Korea. Another milestone was the showcase of the first complete TD-LTE solution with end-to-end-capabilities, together with ST-Ericsson in China.
sOuth-east asia aND OceaNia
Sales of network equipment were weaker overall due to cautious investment in a number of markets. Investment highlights include network expansions in Bangladesh and Indonesia. Access to spectrum for 3G and 4G/LTE remains a limitation in several markets. Overall there is an increasing interest for managed services among operators in several countries.
The region includes a mix of markets focused on long-term government-sponsored fiber deployments as well as operator investment in 3G/HSPA upgrades and 4G/LTE trials. Other markets in the region are continuing to expand in 2G and mobile broadband.
Indonesian GSM and 3G operator AXIS extended its managed services contract with Ericsson. Ericsson will be responsible for AXIS’ network operations, field maintenance, support services and spare parts management in Greater Jakarta and Northern Sumatra. Indosat has commissioned Ericsson to modernize its network and launched Asia’s fastest mobile network, based on Ericsson’s 3G/HSPA 42 Mbps.
0 5 10 15 20 25 30
5.1
2.8
0.7
0 5 10 15 20 25 30
3.6
4.6
1.0
0 5 10 15 20 25 30
17.1
0.5
8.3
0 5 10 15 20 25 30
7.8
0.6
6.5
iNDia
chiNa aND NOrth-east asia
sOuth-east asia aND OceaNia
Networks Global Services Multimedia
sales per regiON aND segmeNt 2010SEK billion
sub-saharaN aFrica
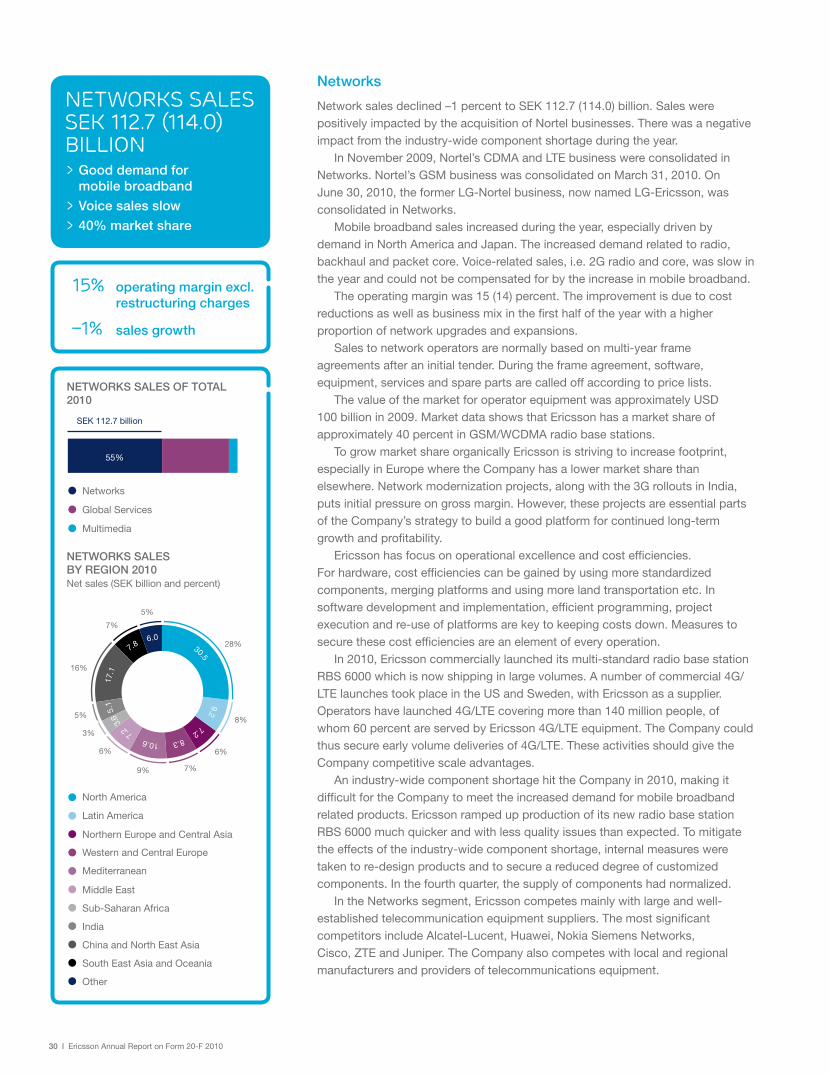
30 | Ericsson Annual Report on Form 20-F 2010
17.1
7.86.0
5.1
3.6
7.2
10.6 8.3
30.59.2
7.2
28%
8%
6%
7%9%
6%
3%
5%
16%
7%
5%
Networks
Network sales declined –1 percent to SEK 112.7 (114.0) billion. Sales were positively impacted by the acquisition of Nortel businesses. There was a negative impact from the industry-wide component shortage during the year.
In November 2009, Nortel’s CDMA and LTE business were consolidated in Networks. Nortel’s GSM business was consolidated on March 31, 2010. On June 30, 2010, the former LG-Nortel business, now named LG-Ericsson, was consolidated in Networks.
Mobile broadband sales increased during the year, especially driven by demand in North America and Japan. The increased demand related to radio, backhaul and packet core. Voice-related sales, i.e. 2G radio and core, was slow in the year and could not be compensated for by the increase in mobile broadband.
The operating margin was 15 (14) percent. The improvement is due to cost reductions as well as business mix in the first half of the year with a higher proportion of network upgrades and expansions.
Sales to network operators are normally based on multi-year frame agreements after an initial tender. During the frame agreement, software, equipment, services and spare parts are called off according to price lists.
The value of the market for operator equipment was approximately USD 100 billion in 2009. Market data shows that Ericsson has a market share of approximately 40 percent in GSM/WCDMA radio base stations.
To grow market share organically Ericsson is striving to increase footprint, especially in Europe where the Company has a lower market share than elsewhere. Network modernization projects, along with the 3G rollouts in India, puts initial pressure on gross margin. However, these projects are essential parts of the Company’s strategy to build a good platform for continued long-term growth and profitability.
Ericsson has focus on operational excellence and cost efficiencies. For hardware, cost efficiencies can be gained by using more standardized components, merging platforms and using more land transportation etc. In software development and implementation, efficient programming, project execution and re-use of platforms are key to keeping costs down. Measures to secure these cost efficiencies are an element of every operation.
In 2010, Ericsson commercially launched its multi-standard radio base station RBS 6000 which is now shipping in large volumes. A number of commercial 4G/LTE launches took place in the US and Sweden, with Ericsson as a supplier. Operators have launched 4G/LTE covering more than 140 million people, of whom 60 percent are served by Ericsson 4G/LTE equipment. The Company could thus secure early volume deliveries of 4G/LTE. These activities should give the Company competitive scale advantages.
An industry-wide component shortage hit the Company in 2010, making it difficult for the Company to meet the increased demand for mobile broadband related products. Ericsson ramped up production of its new radio base station RBS 6000 much quicker and with less quality issues than expected. To mitigate the effects of the industry-wide component shortage, internal measures were taken to re-design products and to secure a reduced degree of customized components. In the fourth quarter, the supply of components had normalized.
In the Networks segment, Ericsson competes mainly with large and well-established telecommunication equipment suppliers. The most significant competitors include Alcatel-Lucent, Huawei, Nokia Siemens Networks, Cisco, ZTE and Juniper. The Company also competes with local and regional manufacturers and providers of telecommunications equipment.
Latin America
North America
Northern Europe and Central Asia
Western and Central Europe
Mediterranean
Middle East
Sub-Saharan Africa
India
China and North East Asia
South East Asia and Oceania
Other
NetWOrks sales OF tOtal 2010
Networks
Global Services
Multimedia
networks saLes sek 112.7 (114.0)BiLLion
55%
SEK 112.7 billion
> good demand formobile broadband
> voice sales slow
> 40% market share
NetWOrks sales bY regiON 2010 Net sales (SEK billion and percent)
15% operating margin excl.restructuring charges
–1% sales growth

Ericsson Annual Report on Form 20-F 2010 | 31
Latin America
North America
Northern Europe and Central Asia
Western and Central Europe
Mediterranean
Middle East
Sub-Saharan Africa
India
China and North East Asia
South East Asia and Oceania
Other
global services
Global Services sales increased 1 percent to SEK 80.1 (79.2) billion. Operating margin was 11 (11) percent. Global Services includes Professional Services and Network Rollout.
Professional Services consists of managed services, consulting and systems integration, customer support and education. Professional Services increased 4 percent to SEK 58.5 (56.1) billion and in local currencies 9 percent, in line with previous years’ growth pace. Managed Services increased 21 percent to SEK 21.1 (17.4) billion. The increase was primarily driven by the contract with the US-based operator Sprint, which started in September 2009. The contract value was USD 5.5 billion for seven years at the time of the announcement.
Two thirds of Professional Services’ revenues are recurring, mainly managed services and customer support. Contracts are often long, five to seven years, and payments are made in advance. Consulting and systems integration deals are by nature shorter and paid after fulfillment of contract.
Network Rollout decreased –7 percent to SEK 21.6 (23.1) billion. Network rollout includes turnkey projects with a large part of third party sourcing, making it a lower-margin business.
Ericsson’s services offering covers all areas within an operator’s operational scope. Ericsson can be provided the opportunity to design, plan, build and manage a core network or operate all field operations for an operator’s business support system, service, core, transmission and access network. Most often however, operators turn to Ericsson for support in a certain part of its operation. Ericsson has three assignments where the Company is responsible for everything within an operator’s operational scope. Those agreements are with Sprint in the US, 3 in the UK and 3 in Italy. Ericsson manages networks, or parts of networks, with 450 million subscribers. If also field operations and spare parts management contracts are included, the figure is 750 million subscribers.
Over the past years, Ericsson has seen a growing interest from operators for sharing the access networks. Through this, operators can reduce cost for the so called passive equipment at a site, like rental costs for towers, power and cooling. Execution of a sharing plan requires complex integration of multi-vendor systems, which is one of Ericsson’s key competencies.
The total global telecom services market was valued at USD 239-249 billion in 2009 (see graph on next page). Roughly two thirds is operator-internal operating spending. Services handled by suppliers represented a third of the total market. Over the years 2005-2009 the total services market grew in average by about 11 percent annually.
Ericsson estimates its market share in telecom services at over 10 percent. Due to the fragmented market, Ericsson is by far the largest player. The Company has 45,000 professionals across the world. Over the years, the Company has insourced more than 20,000 employees from operators.
Services is a local business and all competitors therefore basically have the same cost structure. In order to gain synergies and cost efficiencies, global methods, processes and tools are a prerequisite. Over the past years, Ericsson has invested USD 1 billion in developing methods, processes and tools, securing efficiencies and cost advantages. As telecom is becoming more and more of a software industry, monitoring and maintenance of networks as well as upgrading of software can be done remotely. Ericsson today has four global network operations service centers in Mexico, Romania, India and China. The Company secures the operation of networks around the clock, throughout the year, for 2 billion subscribers.
In managed services, Ericsson can insource employees from the customer. In the transition period, restructuring costs are taken, for e.g. replacement of
GLoBaL serVices saLes sek 80.1 (79.2) BiLLion> strong growth in
managed services
> supports 2 billionpeople 24/7
glObal services sales OF tOtal 2010
Networks
Global Services
Multimedia
4.6
2.8
8.3
6.5
6.6
10.6 10.5
17.7
7.74.3
23%
10%
5%
13%13%
8%
6%
3%
10%
8%
1%0.5
SEK 80.1 billion
39%
glObal services sales bY regiON 2010 Net sales (SEK billion and percent)
11% operating margin excl.restructuring charges
1% sales growth

32 | Ericsson Annual Report on Form 20-F 2010
global telecom services market USD billion
200920082007
~150-154
~158-162
CAGR 2005-2009: approx 11%
Currently ad
dressed
m
arket
~156-160
~43-45
~9-11
~49-51
~11-13
~50-52
~13-15
~19 ~21-23 ~20-22
Professional services, excluding Managed Services
Operator-internal services spending
Managed Services
Network roll-out services
IS/IT-systems, migration of employees into new systems and premises. All this to transform operations to standardized processes, methods and tools. In this process, management’s leadership and communication skills are of utmost importance. Ericsson has a culture of putting individuals in focus, showing respect and giving employees the opportunities to develop. In the transformation phase, following the transition, scale synergies are carried through.
Of operators’ internal operating expenditures a large part relates to IS/IT. With solutions for Operations Support Systems (OSS) and Business Support Systems (BSS), Ericsson targets also this IS/IT-oriented part of the market. OSS/BSS are software-based solutions, but require a lot of integration work on the customer’s site, both for IS/IT and telecom systems. Systems integration business is also important to the Business Support System’s (BSS) area within segment Multimedia.
Competition in the Global Services segment includes many of the traditional telecommunication equipment suppliers. Since a lot of business in Global Services is about moving up the value chain, the Company competes with large companies from other industry sectors, such as Accenture, HP, IBM, Oracle and India-based off-shore companies, e.g. Tata Consultancy Services and Tech Mahindra. Among competition is also a large number of smaller but specialized companies operating on a local or regional basis.

Ericsson Annual Report on Form 20-F 2010 | 33
multimedia
Multimedia sales declined –21 percent to SEK 10.5 (13.3) billion. Operating margin was –4 (8) percent. The segment showed a strong recovery in the last quarter, mainly as a result of increased operator investments in revenue management as well as continued good development for TV solutions.
In 2010, a program for return to profitability was initiated. The program includes phase-out of products, reduction of sourcing and supply costs and decoupling of software and hardware using commercial off-the-shelf hardware. Increased volumes at the end of the year resulted in a recovery in the last quarter.
Operations within Multimedia are divided into three areas with their specific market drivers.
Business Support Systems is the segment’s largest market with a total value of about USD 35 billion in 2009. Within this market, the revenue management market is the largest. The Company is the market leader and more than 1.2 billion subscribers are charged and billed via Ericsson’s solutions.
The decline in Multimedia’s total sales 2010 was mainly related to revenue management. Segment Multimedia in general and revenue management in particular has a large exposure to markets such as India, Middle East and Sub-Saharan Africa where operators postponed investments mainly due to operator consolidation. Going forward, there is growth potential as operators want to modernize their business support systems to capture the full revenue potential of mobile broadband and to merge billing and charging systems into one solution.
The second largest operation in Multimedia is Television and Media Management which developed well in 2010. The compression business continues to grow. Ericsson is the leading player with a market share of 25 percent in compression and 40 percent in IPTV head-ends. The worldwide digital TV market showed strong growth, with digital TV homes expected to double in the next five years.
The third operation is Consumer and Business Applications. A key aim is to support operators in modernizing their legacy value-added services environment, by providing for example messaging systems and service delivery systems. With a market share of 40 percent in mobile positioning and more than 10 percent in service delivery platforms, Ericsson holds a leading position. The Business Communication Suite targets the enterprise market. It combines unified communication with mobility, providing business communities with a collaboration and multimedia solution.
Multimedia is mainly a software business. The solutions often require local adaptations in customers’ networks. Therefore Multimedia sales also drive sales of systems integration services.
The market for the Multimedia segment is rather fragmented. Competitors vary widely depending on the solution being offered. They include many of the traditional telecommunication equipment and IT suppliers, such as Amdocs and Comverse, as well as companies from other industries, such as Harmonic, Oracle and Thompson.
multimedia sales oF total 2010
Networks
Global Services
Multimedia
1.0
0.7
0.5
0.
61.0
1.4 1.4
1.0
1.3
0.90.6
12%
9%
6%
10%
14%13%
9%
7%
5%
5%
10%
SEK 10.5 billion
5%
MULTIMEDIA sALEs sEk 10.5 (13.3) bILLIon
–4% operating margin excl.restructuring charges
–21% sales growth for comparable units
> Weak sales for revenue management
> good development in tv
Latin America
North America
Northern Europe and Central Asia
Western and Central Europe
Mediterranean
Middle East
Sub-Saharan Africa
India
China and North East Asia
South East Asia and Oceania
Other
multimedia sales by region 2010 Net sales (SEK billion and percent)

34 | Ericsson Annual Report on Form 20-F 2010
Joint Ventures
Sony EricSSon
Sony Ericsson is a 50/50 joint venture between Sony Corporation and Ericsson, established in 2001. Sony Ericsson is accounted for according to the equity method.
The global handset market is believed to have increased slightly in volume to almost 1.2 billion units. Sony Ericsson’s market share in the total global handset market 2010 was approximately 4 percent in units and 6 percent in value. Sony Ericsson focuses on the smartphone segment and the Android operating system.
Units shipped declined by –25 percent to 43.1 (57.1) million while the average selling price increased by 23 percent to EUR 146 (119). Sales decreased by –7 percent to EUR 6.3 (6.8) billion. Gross margin improved during the year to 29 (15) percent as benefits of cost reductions and new smartphones materialized.
Income before taxes, excluding restructuring charges, was EUR 0.2 (–0.9) billion. Income increased during the year thanks to improved gross margin and reduced operating expenses. Ericsson’s share in Sony Ericsson’s income before taxes was SEK 0.7 (–5.7) billion.
Sony Ericsson’s primary competitors include Apple, HTC, LG, Motorola, Nokia, RIM and Samsung.
ST-EricSSon
ST-Ericsson is a 50/50 joint venture between STMicroelectronics and Ericsson, which started in February, 2009. ST-Ericsson is accounted for according to the equity method. It has one of the industry’s strongest product offering in semiconductors and platforms for mobile devices. ST-Ericsson is a key supplier to top handset manufacturers. In 2010, ST-Ericsson continued its transition, merging three operations. Its focus today is to deliver new products to the market.
Sales declined –9 percent to USD 2.3 (2.5) billion. The operating loss for the year, adjusted for restructuring costs, was USD –0.4 (–0.4) billion.
ST-Ericsson is reporting in US-GAAP. Ericsson’s share in ST-Ericsson’s income before taxes, adjusted to IFRS, was SEK –1.8 (–1.8) billion. Adjustments for IFRS-compliance mainly consist of capitalization of R&D expenses for hardware development.
The Company’s net financial position was USD –82 (229) million at year-end. In the fourth quarter 2010, a short-term credit facility of USD 150 million made available on a 50:50 basis by parent companies was utilized.
During 2010, two restructuring plans of USD 345 million were finalized. The first one of USD 230 million gave full impact from third quarter and the second plan of USD 115 million was completed by year end.
ST-Ericsson’s largest competitor is Qualcomm. The market is growing in complexity as several new operating systems for handsets and other devices have been launched, e.g. Google’s Android, Microsoft’s Windows and Samsung’s Bada.
LegaL and tax proceedingsTogether with most of the mobile communications industry, Ericsson has been named a defendant in two class action lawsuits in the US, in which plaintiffs allege that adverse health effects could be associated with mobile phone usage:
In Pennsylvania: In September 2008, the federal court in Pennsylvania dismissed the plaintiffs’ claims as preempted by federal law. The Third Circuit Court of Appeals subsequently affirmed this ruling. In February 2011, the Public Citizen Litigation Group filed an appeal with US Supreme Court.
In the District of Columbia: In July 2010, the District of Columbia Superior Court granted in part and denied in part
20102009200820072006
6,294
12,916
6,788
10,95911,244
–2,000
0
2,000
4,000
6,000
8,000
10,000
12,000
14,000
1,298 1,574
92
–878
189
12,91611,24411,244
Net sales
Income before taxes excl. restructuring charges
Net sales
Operating income adjusted for amortization of acquired intangibles and restructuring charges
All figures in accordance with reported adjusted US GAAP figures
Sony EricSSon nET SalES and adJuSTEd incomE bEforE TaxESEuro million
ST-EricSSon nET SalES and adJuSTEd opEraTing incomEUSD million
20102009
12,916
2,293
–436
2,524
–369
11,244
–500
0
500
1,000
1,500
2,000
2,500
3,000

Ericsson Annual Report on Form 20-F 2010 | 35
the defendants’ motion to dismiss. In September 2010, the plaintiff filed a third amended complaint. In October 2010, the defendants moved to dismiss the District of Columbia case. In February, 2011, the Supreme Court for the District of Columbia dismissed with prejudice Ericsson from the case.
In April 2007, an Australian company, QPSX Developments Pty Ltd., filed a patent infringement lawsuit against Ericsson and other defendants in the US, alleging that Ericsson infringed a patent related to Asynchronous Transfer Mode (ATM) technology. The lawsuit was stayed in August 2009 pending the resolution of a reexamination proceeding in the US Patent and Trademark Office (PTO). The stay was lifted in November 2010 after all the asserted patent claims were confirmed as valid by the PTO. The trial is scheduled for September 2011.
Swedish fiscal authorities have disallowed deductions for sales commission payments via external service companies to sales agents in certain countries. Most of the taxes have already been paid. The decision covering the fiscal year 1999 was appealed. In December 2006, the County Administrative Court in Stockholm rendered a judgment in favor of the fiscal authorities. The Administrative Court of Appeal in Stockholm affirmed the County Administrative Court’s judgment. The judgment has been appealed to the Administrative Supreme Court. For more information on risks related to litigations, see chapter Risk Factors.
In January 2011, a US company SynQor filed a patent infringement lawsuit against Ericsson Inc. in the Eastern District of Texas alleging that Ericsson infringes five U.S. patents related to bus converters. In February 2011, SynQor filed a motion for preliminary injunction seeking to prevent Ericsson from manufacturing, using, selling, and offering for sale in the U.S. and/or importing into the U.S. certain unregulated and semi-regulated bus converters and any Ericsson products that contain those bus converters. SynQor also seeks to prevent Ericsson from selling the accused bus converters to companies that in-turn sell products incorporating the bus converters in or into the U.S.
MateriaL contractsMaterial contractual obligations are outlined in Note C32 “Contractual obligations”. These are primarily related to operating leases for office and production facilities, purchase contracts for outsourced manufacturing, R&D and IT operations, and the purchase of components for the Company’s own manufacturing.
Ericsson is party to certain agreements, which include provisions that may take effect or be altered or invalidated by a change in control of the Company as a result of a public takeover offer. However, none of the agreements currently in effect would entail any material consequence to Ericsson due to a change in control of the Company.
corporate governanceIn accordance with the Annual Accounts Act (1995:1554 Chapter 6, Section 6), a separate Corporate Governance Report, including an Internal Control section, has been prepared.
continued compliance with the Swedish corporate governance codeThe Company applies the Swedish Corporate Governance Code. The Company is committed to complying with best-practice corporate governance standards on a global level wherever possible. This includes continued compliance with the corporate governance provisions expressed by this Code without deviations.
an ethical businessEricsson’s Code of Business Ethics summarizes the Group’s fundamental policies and directives governing its relationships internally, with its stakeholders and with others. It also sets out how the Group works to achieve and maintain its high standards. There have been no amendments or waivers to Ericsson’s Code of Business Ethics for any Director, member of management or other employee.
board of directors 2010/2011The Annual General Meeting on April 13, 2010, re-elected Michael Treschow as Chairman of the Board and Roxanne S. Austin, Sir Peter L. Bonfield, Börje Ekholm, Ulf J. Johansson, Sverker Martin-Löf, Nancy McKinstry, Anders Nyrén, Carl-Henric Svanberg and Marcus Wallenberg as Directors of the Board. The Annual General Meeting elected Hans Vestberg and Michelangelo Volpi as new members of the Board. Anna Guldstrand, Jan Hedlund and Karin Åberg were appointed as union representatives with Pehr Claesson, Kristina Davidsson and Karin Lennartsson as deputies.
managementHans Vestberg was appointed President and CEO, succeeding Carl-Henric Svanberg, as of January 1, 2010. The President and CEO is supported by the Executive Leadership Team which, in addition to the President and CEO, consists of heads of Group Functions, heads of business units, two heads of region and the Chief Brand Officer. A management system is implemented to ensure that the business is well controlled and able to fulfill the objectives of major stakeholders within established risk limits. The system also monitors internal control and compliance with applicable laws, listing requirements and governance codes.
remunerationFees to the members of the Board of Directors and the remuneration of Group management as well as the 2010 guidelines for remuneration to senior management are reported in Notes to the Consolidated Financial Statements – Note C29, “Information Regarding Members of the Board of Directors, the Group management and Employees”.

36 | Ericsson Annual Report on Form 20-F 2010
sourcinG and suppLyEricsson’s hardware largely consists of electronics, such as circuit boards, radio frequency (RF) modules, antennas etc. For manufacturing, the Company purchases customized and standardized components, services etc. from several global providers as well as from numerous local and regional suppliers. Certain types of components, such as power modules and cables, are produced in-house.
The production of electronic modules and sub-assemblies is mostly outsourced to manufacturing services companies, of which the vast majority is in low-cost countries. Node production is largely done in-house and on-demand. This consists of assembly, testing of modules and integrating them into complete radio base stations, mobile switching centers etc.
Where possible Ericsson relies on alternative supply sources. When selecting a new supplier, the supplier code of conduct should be met. Variations in market prices for raw materials generally have a limited effect on total cost of goods sold.
As of December 31, 2010, there were no loans outstanding from and no guarantees issued to or assumed by Ericsson for the benefit of any member of the Board of Directors or senior management.
All relevant information regarding remuneration can be found in chapter Remuneration Report.
the board of Directors’ proposal for guidelines for remuneration to senior managementThe Board of Directors proposes that the current guidelines for remuneration and other employment terms for the senior management (Remuneration Policy) remain unchanged for the period up to the 2012 Annual General Meeting.
Details of how Ericsson delivers on these principles and policy, including information on previously decided long-term variable remuneration that has not yet become due for payment, can be found Note C29, “Information regarding Members of the Board of Directors, the Group management and Employees”.
risk manaGementRisks are broadly categorized into operational and financial risks. Ericsson’s risk management is based on the following principles, which apply universally across all business activities and risk types:
> Risk management is an integrated part of the Ericsson Group Management System
> Each operational unit is accountable for owning and managing its risks according to policies, directives and process tools. Decisions are made or escalated according to defined delegation of authority. Financial risks are coordinated through Group Function Finance
> Risks are dealt with during the strategy process, the annual planning and target setting, the continuous monitoring through monthly and quarterly steering group meetings and during operational processes by transaction (customer bid/contract, acquisition, investment and product development projects). They are subject to various controls such as decision tollgates and approvals.A central security unit coordinates management of certain
risks, such as business interruption, information security and physical security. A Crisis Management Council deals with ad hoc events of serious nature.
For information of risks that could impact the fulfillment of the targets and form the basis for mitigating activities, see the other sections of the Board of Directors’ Report, Notes C14, “Trade receivables and customer finance”, C19, “Interest-bearing liabilities”, C20, “Financial risk management and financial instruments” and chapter Risk Factors on page 99.

Ericsson Annual Report on Form 20-F 2010 | 37
sustainaBiLity and corporate responsiBiLityThe Company has implemented strong social, environmental and ethical standards supporting risk management and value creation. This commitment generates positive business impacts that benefit society.
Ericsson’s approach to Sustainability and Corporate Responsibility (CR) is integrated into its core business operations and in its relationships with stakeholders. The Board of Directors considers these aspects in governance decision-making. Group level policies and directives ensure consistency across global operations.
Ericsson publishes an annual Sustainability and CR Report which provides additional information.
minimizing riskrespONsible busiNess practices
Ericsson supports the UN Global Compact and endorses its ten principles regarding human and labor rights, anti-corruption and environmental protection. The Ericsson Group Management System includes policies and directives that cover responsible business practices, such as the Code of Business Ethics, Code of Conduct (CoC), anti-corruption and environmental management. It is reinforced by training, workshops and monitoring, including a global assessment program run by an external assurance provider in which CR criteria represent approximately 20 percent of the total areas assessed. During 2010, Ericsson launched a new Sustainability Policy and an e-learning program on Sustainability and CR for all employees.
supplY chaiN
Suppliers must comply with Ericsson’s CoC. Some 150 employees, covering all regions, are trained as supplier CoC auditors and the Company performs regular audits and works with suppliers to ensure measurable and continuous improvements. Findings are followed up to ensure that lasting improvements are made. As a complement to the audits, a free web-based CoC training is now available for all suppliers in 13 languages. To effectively address the issue of conflict minerals, Ericsson participates in the Global e-Sustainability Initiative (GeSI) work group for conflict minerals.
DesigN FOr eNvirONmeNt
Processes and controls are in place to ensure compliance with relevant product related environmental, customer and regulatory requirements. The areas covered are energy efficiency and materials management. To better meet the rapidly changing legal requirements on materials management a new materials declarations tool was released in 2010.
take-back
Ericsson Ecology Management and Product Take-back is a global initiative to take responsibility of products at the end of their life. More than 95 percent of decommissioned equipment is recycled, exceeding the EU Waste Electronic Electrical Equipment Directive (WEEE) stipulation of 75 percent. During 2010 more than 2,500 tonnes of e-waste were collected. This is less than 2009 due to there being a fewer number of operator change-outs of equipment. During 2010, Ericsson has continued to improve its capabilities to handle WEEE in Latin America and the Middle East as well as in production facilities in Sweden, India and China. Alignment of the process in order to comply with the Indian WEEE Directive has also begun.
activities in 2010
A = Supply chain
B = Ericsson’s own activities
Future (lifetime) operation of products delivered 2010
C = Operator activities
D = Products operation
E = End-of-life treatment
–5
0
5
10
15
20
EDCBA
~–0.2
Mto
nnes
CO
2e
~18
~3
0.64~2
Direct emissions (Ericsson own activities)
Indirect emissions (all other life-cycle related emissions)
~ = approximately
ericssON liFe-cYcle assessmeNt carbON FOOtpriNt 2010
Ericsson received recognition and a number of prestigious awards for its sustainability and corporate responsibility achievements. Vodafone presented Ericsson with its Corporate Responsibility supplier award.
Greenpeace named Ericsson one of the best ICT companies in its Cool lT Leaderboard. Ericsson’s focus and accomplishment on sustainability and life-cycle management was awarded the InfoWorld Green Award. Gartner has also recognized Ericsson for its sustainability leadership.

38 | Ericsson Annual Report on Form 20-F 2010
Ericsson is a partner in the Ghana E-waste project. Its goal is to establish local recycling capabilities and transform informal e-waste recycling into a formal business and thereby help to alleviate poverty. This is being coordinated by the Raw Materials Group in cooperation with the Ghana Environmental Protection Agency and financed by the Nordic Development Fund.
raDiO Waves aND health
Ericsson provides public information on radio waves and health, and supports independent research to further increase knowledge in this area. Ericsson has co-sponsored over 90 studies related to electromagnetic fields, radio waves and health since 1996. Independent expert groups and public health authorities, including the World Health Organization, have reviewed the total amount of research and consistently concluded that the balance of evidence does not demonstrate any health effects associated with radio wave exposure from either mobile phones or radio base stations.
creating valuethe eNvirONmeNtal OppOrtuNitY
Information and Communication Technology (ICT) represents about two percent of global CO2 emissions, but can potentially offset a significant portion of the remaining 98 percent from other sectors. Ericsson takes active measures to ensure that its own carbon footprint will be continuously reduced. A carbon footprint reduction target was set in 2008, to reduce emissions relative to products sold by 40 percent over five years, from in-house activities and the life-cycle impacts of products. In 2010, Ericsson met the annual 10 percent reduction target:
> There was a slight increase in direct emissions from Ericsson’s in-house activities. Component shortages have led to an increase in shipping by air, and business travel has increased somewhat due to increased number of employees
> A 14 percent reduction was achieved in indirect emissions from products in operation per capacity, resulting in 26 percent total from 2008. This improvement was mainly due to the introduction of the radio base station RBS 6000 family.In addition, part of Ericsson’s sustainability strategy is
to focus on the role that broadband can play in helping to offset global CO2 emissions. Ericsson focused on sustainable city solutions, and has actively engaged in global climate policy, including the Guadalajara ICT Declaration and Global e-Sustainability Initiative publication “Evaluating the Carbon-Reducing Impacts of ICT”.
meetiNg the milleNNium DevelOpmeNt gOals
Mobile connectivity fuels economic growth, which is particularly vital for the billions of people living at the base of the economic pyramid – the markets of the future. Ericsson is committed to using its technology and competence to help achieve the UN Millennium Development Goals (MDGs), and customer engagement is part of its strategy to meet this aim.
In 2010, Ericsson and its partners, The Earth Institute, Columbia University and Millennium Promise, launched a global education initiative, Connect To Learn, as an extension of its commitment to the MDGs.
ericssON respONse
Ericsson Response is a global employee volunteer initiative with the aim to rapidly roll out communication solutions and provide telecommunications experts to assist disaster relief operations. Ericsson Response cooperates with the UN Office for the Coordination of Humanitarian Affairs (UNOCHA), the UN World Food Programme (WFP), the UN Children’s fund (UNICEF) and other International Organizations and Non-Governmental Organizations (NGO) like the International Federation of Red Cross and Red Crescent Societies (IFRC) and Save the Children.
In 2010, support was provided to WFP and UNICEF working in Haiti, Port-au-Prince, during six months of on-site work by 19 volunteers. This is one of the longest disaster response deployments of Ericsson Response’s history. This year also marked the tenth anniversary and a decade of relief work provided by Ericsson Response.
Product operation kg CO2 /capacity [subscriber/line/port] and year
Ericsson activities kg CO2 /capacity [subscriber/line/port]
carbON FOOtpriNt target result 2010
Baseline 2008 for Ericsson activities and product operation: Actual achievements compared to baseline are shown.
~ = approximately
0
1
2
3
4
5
20102009200820072006
~–15%
~–26%
~–20% ~–20%

Ericsson Annual Report on Form 20-F 2010 | 39
parent companyThe Parent Company business consists mainly of corporate management, holding company functions and internal banking activities. It also handles customer credit management, performed on a commission basis by Ericsson Credit AB.The Parent Company is the owner of a substantial part of Ericsson’s intellectual property rights. It manages the patent portfolio, including patent applications, licensing and crosslicensing of patents and defending of patents in litigations.The Parent Company has 6 (6) branch offices. In total, the Group has 68 (65) branch and representative offices.
Financial informationNet sales for the year amounted to SEK 0.0 (0.3) billion and income after financial items was SEK 6.8 (8.1) billion. Exports accounted for 100 (100) percent of net sales. The Parent Company had no sales in 2010 or 2009 to subsidiaries, while 45 (45) percent of total purchases of goods and services were from such companies.
Major changes in the Parent Company’s financial positionfor the year included:
> Investments in LG-Ericsson of SEK 1.9 billion
> Decreased current and non-current receivables from subsidiaries of SEK 8.3 billion
> Increased other current receivables of SEK 1.6 billion
> Increased cash, cash equivalents and short-term investments of SEK 9.2 billion
> Increased current and non-current liabilities to subsidiaries of SEK 4.7 billion
> Decreased other current liabilities of SEK 0.2 billion.
At year end, cash, cash equivalents and short-term investments amounted to SEK 71.6 (62.4) billion.
share informationAs per December 31, 2010, the total number of shares was 3,273,351,735, of which 261,755,983 were Class A shares, each carrying one vote, and 3,011,595,752 Class B shares, each carrying one tenth of one vote. The two largest shareholders at year end were Investor and Industrivärden holding 19.33 and 13.80 percent respectively of the voting rights in the Parent Company.
Both classes of shares have the same rights of participation in the net assets and earnings.
In accordance with the conditions of the Long-Term Variable Remuneration Program (LTV) for Ericsson employees, 5,890,018 treasury shares were sold or distributed to employees in 2010. The quotient value of these shares was SEK 29.4 million, representing less than 1 percent of capital stock, and compensation received amounted to SEK 59.8 million. The holding of treasury stock at December 31, 2010 was 73,088,515 Class B shares. The quotient value of these shares is SEK 365.4 million, representing 2.2 percent of capital stock, and the related acquisition cost amounts to SEK 622.2 million.
proposed disposition of earnings
The Board of Directors proposes that a dividend of SEK 2.25 (2.00) per share be paid to shareholders duly registered on the record date April 18, 2011, and that the Parent Company shall retain the remaining part of non-restricted equity.
The Class B treasury shares held by the Parent Company are not entitled to receive a dividend. Assuming that no treasury shares remain on the record date, the Board of Directors proposes that earnings be distributed as follows:
Amount to be paid to the shareholders SEK 7,365,041,404Amount to be retainedby the Parent Company SEK 35,608,440,926
Total non-restricted equityof the Parent Company SEK 42,973,482,330
As a basis for its dividend proposal, the Board of Directors has made an assessment in accordance with Chapter 18, Section 4 of the Swedish Companies Act of the Parent Company’s and the Group’s need for financial resources as well as the Parent Company’s and the Group’s liquidity, financial position in other respects and long-term ability to meet their commitments. The Group reports an equity ratio of 52 (52) percent and a net cash amount of SEK 51.3 (36.1) billion.
The Board of Directors has also considered the Parent Company’s result and financial position and the Group’s position in general. In this respect, the Board of Directors has taken into account known commitments that may have an impact on the financial positions of the Parent Company and its subsidiaries.
The proposed dividend does not limit the Group’s ability to make investments or raise funds, and it is our assessment that the proposed dividend is well-balanced considering the nature, scope and risks of the business activities as well as the capital requirements for the Parent Company and the Group.

40 | Ericsson Annual Report on Form 20-F 2010
Board assuranceThe Board of Directors and the President declare that the consolidated financial statements have been prepared in accordance with IFRS, as adopted by the EU, and give a fair view of the Group’s financial position and results of operations. The financial statements of the Parent Company have been prepared in accordance with generally accepted accounting principles in Sweden and give a fair view of the Parent Company’s financial position and results of operations.
The Board of Directors’ Report for the Ericsson Group and the Parent Company provides a fair view of the development of the Group’s and the Parent Company’s operations, financial position and results of operations and describes material risks and uncertainties facing the Parent Company and the companies included in the Group.
post-cLosinG eVentsOn March 16, 2011, Ericsson made a statement regarding the situation in Japan following the earthquake on March 11.
The Company focuses on supporting customers in securing functionality of vital telecommunication services. Ericsson states that, as Japan is a large supplier to the global market for semiconductors and other components, it is reasonable to expect an effect on supply but it is too early to say to what extent. The situation in Japan is not expected to have material impact on Ericsson’s Q1 2011 sales.

Ericsson Annual Report on Form 20-F 2010 | 41
To the Shareholders of Telefonaktiebolaget LM Ericsson (publ)
In our opinion, the accompanying consolidated balance sheets and the related consolidated statements of income, comprehensive income, shareholders equity and cash flows present fairly, in all material respects, the financial position of Telefonaktiebolaget LM Ericsson and its subsidiaries at December 31, 2010 and December 31, 2009, and the results of their operations and their cash flows for each of the three years in the period ended December 31, 2010, in conformity with International Financial Reporting Standards as issued by the International Accounting Standards Board and in conformity with International Financial Reporting Standards as adopted by the European Union. Also in our opinion, the Company maintained, in all material respects, effective internal control over financial reporting as of December 31, 2010, based on criteria established in Internal Control - Integrated Framework issued by the Committee of Sponsoring Organizations of the Treadway Commission. The Company’s management is responsible for these financial statements, for maintaining effective internal control over financial reporting and for its assessment of the effectiveness of internal control over financial reporting, which can be found herein, under
“Management’s Report on Internal Control over Financial Reporting”. Our responsibility is to express opinions on these financial statements and on the Company’s internal control over financial reporting based on our integrated audits. We conducted our audit in accordance with the standards of the Public Company Accounting Oversight Board (United States) and International Standards on Auditing. Those standards require that we plan and perform the audits to obtain reasonable assurance about whether the financial statements are free of material misstatement and whether effective internal control over financial reporting was maintained in all material respects. Our audits of the financial statements included examining, on a test basis, evidence supporting the amounts and disclosures in the financial statements, assessing the accounting principles used and significant estimates made by management, and evaluating the overall financial statement presentation. Our audit of internal control over financial reporting included obtaining an understanding of internal control over financial reporting, assessing the risk that a material weakness exists, and testing and evaluating the design
and operating effectiveness of internal control based on the assessed risk. Our audits also included performing such other procedures as we considered necessary in the circumstances. We believe that our audits provide a reasonable basis for our opinion.
A company’s internal control over financial reporting is a process designed to provide reasonable assurance regarding the reliability of financial reporting and the preparation of financial statements for external purposes in accordance with generally accepted accounting principles. A company’s internal control over financial reporting includes those policies and procedures that (i) pertain to the maintenance of records that, in reasonable detail, accurately and fairly reflect the transactions and dispositions of the assets of the company; (ii) provide reasonable assurance that transactions are recorded as necessary to permit preparation of financial statements in accordance with generally accepted accounting principles, and that receipts and expenditures of the company are being made only in accordance with authorizations of management and directors of the company; and (iii) provide reasonable assurance regarding prevention or timely detection of unauthorized acquisition, use, or disposition of the company’s assets that could have a material effect on the financial statements.
Because of its inherent limitations, internal control over financial reporting may not prevent or detect misstatements. Also, projections of any evaluation of effectiveness to future periods are subject to the risk that controls may become inadequate because of changes in conditions, or that the degree of compliance with the policies or procedures may deteriorate.
Stockholm, March 30, 2011PricewaterhouseCoopers AB
RepoRt of Independent RegIsteRed publIc AccountIng fIRm

Consolidated Income Statements and statements of Comprehensive incomeCONSOLIDATED INCOME STATEMENTS
Years ended December 31, SEK million Notes 2010 2009 2008
Net sales C3, C4 203,348 206,477 208,930
Cost of sales –129,094 –136,278 –134,661
Gross income 74,254 70,199 74,269
Gross margin (%) 36.5% 34.0% 35.5%
Research and development expenses –31,558 –33,055 –33,584
Selling and administrative expenses –27,072 –26,908 –26,974
Operating expenses –58,630 –59,963 –60,558
Other operating income and expenses C6 2,003 3,082 2,977
Operating income before shares in earnings of joint ventures and associated companies 17,627 13,318 16,688
Operating margin before shares in earnings of joint ventures and associated companies (%) 8.7% 6.5% 8.0%
Share in earnings of joint ventures and associated companies C12 –1,172 –7,400 –436
Operating income 16,455 5,918 16,252
Financial income C7 1,047 1,874 3,458
Financial expenses C7 –1,719 –1,549 –2,484
Income after financial items 15,783 6,243 17,226
Taxes C8 –4,548 –2,116 –5,559
Net income 11,235 4,127 11,667
Net income attributable to:
Stockholders of the Parent Company 11,146 3,672 11,273
Non-controlling interest 89 455 394
Other information
Average number of shares, basic (million) C9 3,197 3,190 3,183
Earnings per share attributable to stockholders of the Parent Company, basic (SEK) 1) C9 3.49 1.15 3.54
Earnings per share attributable to stockholders of the Parent Company, diluted (SEK) 1) C9 3.46 1.14 3.521) Based on Net income attributable to stockholders of the Parent Company.
CONSOLIDATED STATEMENTS Of COMprEhENSIvE INCOME
Years ended December 31, SEK million Notes 2010 2009 2008
Net income 11,235 4,127 11,667
Other comprehensive income
Actuarial gains and losses, and the effect of the asset ceiling, related to pensions C16 3,892 –633 –4,019
Revaluation of other investments in shares and participations
Fair value remeasurement C16 7 –2 –6
Cash Flow hedges
Gains/losses arising during the period C16 966 665 –5,116
Reclassification adjustments for gains/losses included in profit or loss C16 –238 3,850 1,192
Adjustments for amounts transferred to initial carrying amount of hedged items C16 –136 –1,029 –
Changes in cumulative translation adjustments C16 –3,259 –1,067 7,314
Share of other comprehensive income on joint ventures and associated companies C16 –434 –259 1,253
Tax on items relating to components of Other comprehensive income C16 –1,120 –1,040 2,330
Total other comprehensive income –322 485 2,948
Total comprehensive income 10,913 4,612 14,615
Total Comprehensive Income attributable to:
Stockholders of the Parent Company 10,814 4,211 13,988
Non-controlling interest 99 401 627
42 | Ericsson Annual Report on Form 20-F 2010

December 31, SEK million Notes 2010 2009
ASSETS
Non-current assets
Intangible assets C10
Capitalized development expenses 3,010 2,079
Goodwill 27,151 27,375
Intellectual property rights, brands and other intangible assets 16,658 18,739
Property, plant and equipment C11, C26, C27 9,434 9,606
Financial assets
Equity in joint ventures and associated companies C12 9,803 11,578
Other investments in shares and participations C12 219 256
Customer finance, non-current C12 1,281 830
Other financial assets, non-current C12 3,079 2,577
Deferred tax assets C8 12,737 14,327
83,372 87,367
Current assets
Inventories C13 29,897 22,718
Trade receivables C14 61,127 66,410
Customer finance, current C14 3,123 1,444
Other current receivables C15 17,146 15,146
Short-term investments C20 56,286 53,926
Cash and cash equivalents C25 30,864 22,798
198,443 182,442
TOTAL ASSETS 281,815 269,809
EQUITY AND LIABILITIES
Equity
Stockholders’ equity C16 145,106 139,870
Non-controlling interest in equity of subsidiaries C16 1,679 1,157
146,785 141,027
Non-current liabilities
Post-employment benefits C17 5,092 8,533
Provisions, non-current C18 353 461
Deferred tax liabilities C8 2,571 2,270
Borrowings, non-current C19, C20 26,955 29,996
Other non-current liabilities 3,296 2,035
38,267 43,295
Current liabilities
Provisions, current C18 9,391 11,970
Borrowings, current C19, C20 3,808 2,124
Trade payables C22 24,959 18,864
Other current liabilities C21 58,605 52,529
96,763 85,487
TOTAL EQUITY AND LIABILITIES 1) 281,815 269,8091) Of which interest-bearing liabilities and post-employment benefits SEK 35,855 million (SEK 40,653 million in 2009).
Consolidated Balance Sheets
Ericsson Annual Report on Form 20-F 2010 | 43

January–December, SEK million Notes 2010 2009 2008
Operating activities
Net income 11,235 4,127 11,667
Adjustments to reconcile net income to cash C25 12,490 16,856 14,318
23,725 20,983 25,985
Changes in operating net assets
Inventories –7,917 5,207 –3,927
Customer finance, current and non-current –2,125 598 549
Trade receivables 4,406 7,668 –11,434
Trade payables 5,964 –3,522 4,794
Provisions and post-employment benefits –2,739 –2,950 3,830
Other operating assets and liabilities, net 5,269 –3,508 4,203
2,858 3,493 –1,985
Cash flow from operating activities 26,583 24,476 24,000
Investing activities
Investments in property, plant and equipment C11 –3,686 –4,006 –4,133
Sales of property, plant and equipment 124 534 1,373
Acquisitions of subsidiaries and other operations C25, C26 –3,286 –19,321 –74
Divestments of subsidiaries and other operations C25, C26 454 1,239 1,910
Product development C10 –1,644 –1,443 –1,409
Other investing activities –1,487 2,606 944
Short-term investments –3,016 –17,071 –7,155
Cash flow from investing activities –12,541 –37,462 –8,544
Cash flow before financing activities 14,042 –12,986 15,456
financing activities
Proceeds from issuance of borrowings 2,580 14,153 5,245
Repayment of borrowings –1,449 –9,804 –4,216
Sale of own stock and options exercised 51 69 3
Dividends paid –6,677 –6,318 –8,240
Other financing activities –175 199 –
Cash flow from financing activities –5,670 –1,701 –7,208
Effect of exchange rate changes on cash –306 –328 1,255
Net change in cash 8,066 –15,015 9,503
Cash and cash equivalents, beginning of period 22,798 37,813 28,310
Cash and cash equivalents, end of period C25 30,864 22,798 37,813
Consolidated Statements of cash flow
44 | Ericsson Annual Report on Form 20-F 2010

NotesCapital
stock
Addi- tional
paid in capital
revalua-tion of other
invest-ments in
shares and
partici-pations
Cash flow
hedges
Cumula- tive
transla- tion
adjust-ments
retained earnings
Stock-holders’
equity
Non-controlling
interest (NCI)
Total equity
January 1, 2010 16,367 24,731 –4 78 663 98,035 139,870 1,157 141,027
Total comprehensive income C16 – – 4 440 –3,808 14,178 10,814 99 10,913
Transactions with owners
Stock issue – – – – – – – – –
Sale of own shares – – – – – 52 52 – 52
Stock Purchase Plans – – – – – 762 762 – 762
Dividends paid – – – – – –6,391 –6,391 –286 –6,677
Business combinations – – – – – – – 708 708
December 31, 2010 16,367 24,731 – 518 –3,145 106,636 145,106 1,679 146,785
January 1, 2009 16,232 24,731 –1 –2,356 2,124 100,093 140,823 1,261 142,084
Total comprehensive income C16 – – –3 2,434 –1,461 3,241 4,211 401 4,612
Transactions with owners
Stock issue 135 – – – – – 135 – 135
Sale of own shares – – – – – 75 75 – 75
Repurchase of own shares – – – – – –135 –135 – –135
Stock Purchase and Stock Option Plans – – – – – 658 658 – 658
Dividends paid – – – – – –5,897 –5,897 –421 –6,318
Business combinations – – – – – – – –84 –84
December 31, 2009 16,367 24,731 –4 78 663 98,035 139,870 1,157 141,027
January 1, 2008 16,132 24,731 5 307 –6,345 99,282 134,112 940 135,052
Total comprehensive income C16 – – –6 –2,663 8,469 8,188 13,988 627 14,615
Transactions with owners
Stock issue 100 – – – – – 100 – 100
Sale of own shares – – – – – 88 88 – 88
Repurchase of own shares – – – – – –100 –100 – –100
Stock Purchase and Stock Option Plans – – – – – 589 589 – 589
Dividends paid – – – – – –7,954 –7,954 –286 –8,240
Business combinations – – – – – – – –20 –20
December 31, 2008 16,232 24,731 –1 –2,356 2,124 100,093 140,823 1,261 142,084
Consolidated Statements of Changes in Equity
Ericsson Annual Report on Form 20-F 2010 | 45

ContentsC1 SignifiCantaCCountingPoliCieS............................................................................................................................................................................................................................47
C2 CritiCalaCCountingeStimateSandJudgmentS................................................................................................................................................................................... 55
C3 Segmentinformation........................................................................................................................................................................................................................................................... 57
C4 netSaleS............................................................................................................................................................................................................................................................................................ 61
C5 exPenSeSbynature................................................................................................................................................................................................................................................................ 61
C6 otheroPeratinginComeandexPenSeS.......................................................................................................................................................................................................... 61
C7 finanCialinComeandexPenSeS............................................................................................................................................................................................................................... 62
C8 taxeS........................................................................................................................................................................................................................................................................................................ 62
C9 earningSPerShare............................................................................................................................................................................................................................................................... 64
C10 intangibleaSSetS..................................................................................................................................................................................................................................................................... 64
C11 ProPerty,PlantandequiPment.............................................................................................................................................................................................................................. 66
C12 finanCialaSSetS,non-Current............................................................................................................................................................................................................................... 67
C13 inventorieS...................................................................................................................................................................................................................................................................................... 68
C14 tradereCeivableSandCuStomerfinanCe................................................................................................................................................................................................. 69
C15 otherCurrentreCeivableS......................................................................................................................................................................................................................................... 71
C16 equityandotherComPrehenSiveinCome................................................................................................................................................................................................... 71
C17 PoSt-emPloymentbenefitS............................................................................................................................................................................................................................................ 75
C18 ProviSionS..........................................................................................................................................................................................................................................................................................81
C19 intereSt-bearingliabilitieS.......................................................................................................................................................................................................................................... 82
C20 finanCialriSkmanagementandfinanCialinStrumentS............................................................................................................................................................ 83
C21 otherCurrentliabilitieS................................................................................................................................................................................................................................................ 86
C22 tradePayableS............................................................................................................................................................................................................................................................................ 86
C23 aSSetSPledgedaSCollateral................................................................................................................................................................................................................................. 86
C24 ContingentliabilitieS......................................................................................................................................................................................................................................................... 87
C25 StatementofCaShflowS................................................................................................................................................................................................................................................ 87
C26 buSineSSCombinationS...................................................................................................................................................................................................................................................... 88
C27 leaSing.................................................................................................................................................................................................................................................................................................. 90
C28 taxaSSeSSmentvalueSinSweden........................................................................................................................................................................................................................ 90
C29 informationregardingmemberSoftheboardofdireCtorS,thegrouPmanagementandemPloyeeS.......................... 91
C30 relatedPartytranSaCtionS...................................................................................................................................................................................................................................... 97
C31 feeStoauditorS........................................................................................................................................................................................................................................................................ 98
C32 ContraCtualobligationS.............................................................................................................................................................................................................................................. 98
C33 eventSafterthebalanCeSheetdate.............................................................................................................................................................................................................. 98
notes to the Consolidated Financial statements
46|ericssonannualreportonform20-f2010

C1 signiFiCant aCCounting PoliCiestheconsolidatedfinancialstatementscomprisetelefonaktiebolagetlm
ericsson,theParentCompany,anditssubsidiaries(“theCompany”)and
theCompany’sinterestsinjointventuresandassociatedcompanies.the
ParentCompanyisdomiciledinSwedenattorshamnsgatan23,Se-16483
Stockholm.
theconsolidatedfinancialstatementsfortheyearendeddecember
31,2010,havebeenpreparedinaccordancewithinternationalfinancial
reportingStandards(ifrS)asendorsedbytheeuandrfr1“additional
rulesforgroupaccounting”,relatedinterpretationsissuedbytheSwedish
financialreportingboard(rådetförfinansiellrapportering),andthe
Swedishannualaccountsact.forthefinancialreportingof2010,the
CompanyhasappliedifrSasissuedbytheiaSb(ifrSeffectiveas
perdecember31,2010)andwithoutanyearlyapplication.thereisno
differencebetweenifrSeffectiveasperdecember31,2010,andifrS
asendorsedbytheeu,norisrfr1relatedinterpretationsissuedbythe
Swedishfinancialreportingboard(rådetförfinansiellrapportering)orthe
SwedishannualaccountsactinconflictwithifrS.
thefinancialstatementswereapprovedbytheboardofdirectorson
february21,2011.thebalancesheetsandincomestatementsaresubject
toapprovalbytheannualmeetingofshareholders.
newstandards,amendmentsofstandardsandinterpretations,effective
asfromJanuary1,2010,changingpresentationordisclosure:
> ifrS3businessCombinations(revisedwithprospectiveapplication)
therevisedstandardcontinuestoapplytheacquisitionmethodto
businesscombinations,withsomesignificantchanges.forexample,the
definitionofabusinessandabusinesscombinationhasbeenexpanded,
allpaymentstopurchaseabusinessaretoberecordedatfairvalue
attheacquisitiondate,withcontingentcashpaymentsclassifiedas
debtsubsequentlyre-measuredthroughtheincomestatement.there
isachoiceonanacquisition-by-acquisitionbasistomeasurethe
non-controllinginterestintheacquireeeitheratfairvalueoratthenon-
controllinginterest’sproportionateshareoftheacquiree’snetassets.all
acquisitionrelatedcostsshallbeexpensedasincurred.
> iaS27Consolidatedandseparatefinancialstatements(revisedwith
prospectiveapplication).therevisedstandardrequirestheeffectsof
alltransactionswithnon-controllingintereststoberecordedinequity
ifthereisnochangeincontrolandthesetransactionswillnolonger
resultingoodwillorgainsorlosses.thestandardalsospecifiesthe
accountingwhencontrolislost.anyremaininginterestintheentityis
re-measuredtofairvalue,andagainorlossisrecognizedinincome
statement.
thefollowingneworamendedstandardsandinterpretationshavealsobeen
adopted:
> ifriC17,distributionsofnon-Cashassetstoowners(issuednovember
27,2008)
> ifrS2,amendment,groupCash-settledShare-basedPayment
transactions(issuedJune18,2009)
> improvementstoifrSs(issuedapril16,2009).
noneoftheneworamendedstandardsandinterpretationshashad
anysignificantimpactonthefinancialresultorpositionoftheCompany.
however,theimpactonbusinesscombinationaccountingduetothe
revisedifrS3businessCombinationsisdependentontypeandsizeofany
futurearrangementinvolvingabusinesscombination.
forinformationon“newstandardsandinterpretationsnotyetadopted”
pleaseseepage54.
Changes.in.financial.reporting.structure
Change.in.segments
asofJanuary1,2010,ericssonreportsthefollowingsegments:networks,
globalServices,multimedia,SonyericssonandSt-ericsson.
theonlychangecomparedtopreviousyearsisthatnetworkrolloutis
nowincludedinglobalServicesinsteadofnetworks.allothersegmentsare
unchanged.withthischangetheexternalreportingisalignedwiththenew
internalreportingstructure.
SegmentsasofJanuary1,2010:
> networks
> globalServices
> ofwhichProfessionalServices
> ofwhichmanagedServices > ofwhichnetworkrollout
> multimedia
> Sonyericsson
> St-ericsson
Change.in.geographiCal.break.down
asofJanuary1,2010,thegeographicalreportingstructureischanged.
insteadoffivegeographicalareas,tenregionsarereported,mirroring
thenewinternalgeographicalorganization.apartcalled“other”isalso
reported,consistingofbusinessnotreportedinthegeographicalstructure,
e.g.embeddedmodules,cables,powermodulesaswellasintellectual
propertyrightsandlicenses.
regionsasofJanuary1,2010:
> northamerica
> latinamerica
> northerneuropeandCentralasia
> westernandCentraleurope
> mediterranean
> middleeast
> Sub-Saharanafrica
> india
> Chinaandnortheastasia
> Southeastasiaandoceania
> other
in2008and2009ericssonreportedtop15countriesinsales.asofJanuary
1,2010,topfivecountriesarereported.
basis.of.presentation
thefinancialstatementsarepresentedinmillionsofSwedishkrona(Sek).
theyarepreparedonahistoricalcostbasis,exceptforcertainfinancial
assetsandliabilitiesthatarestatedatfairvalue:derivativefinancial
instruments,financialinstrumentsheldfortrading,financialinstruments
classifiedasavailable-for-saleandplanassetsrelatedtodefinedbenefit
pensionplans.
basis.of.consolidation.
theconsolidatedfinancialstatementsarepreparedinaccordancewiththe
purchasemethod.accordingly,consolidatedstockholders’equityincludes
equityinsubsidiaries,jointventuresandassociatedcompaniesearnedonly
aftertheiracquisition.
Subsidiariesareallcompaniesinwhichericssonhasanownership
interest,directlyorindirectly,includingeffectivepotentialvotingrights,
hasthepowertogovernthefinancialandoperatingpoliciesgenerally
associatedwithownershipofmorethanonehalfofthevotingrightsor
inwhichericssonbyagreementhascontrol.thefinancialstatementsof
subsidiariesareincludedintheconsolidatedfinancialstatementsfromthe
datethatcontrolcommencesuntilthedatethatcontrolceases.
ericssonannualreportonform20-f2010|..47

ifthereweredifferencesbetweenanyconsiderationpaidandtherelevant
shareacquiredofthecarryingvalueofnetassetsofthesubsidiary.the
non-controllinginterestintheacquireewasmeasuredatthenon-controlling
interestsproportionateshareoftheacquiree’snetassets.
Joint.ventures.and.associated.companies
investmentsinjointventuresandassociatedcompanies,i.e.wherevoting
stockinterest,includingeffectivepotentialvotingrights,isatleast20
percentbutnotmorethan50percent,orwhereacorrespondinginfluence
isobtainedthroughagreement,areaccountedforinaccordancewiththe
equitymethod.undertheequitymethod,theinvestmentinanassociate
isinitiallyrecognizedatcostandthecarryingamountisincreasedor
decreasedtorecognizetheinvestor’sshareoftheprofitorlossofthe
investeeafterthedateofacquisition.
ericsson’sshareofincomebeforetaxesisreportedinitem“Sharein
earningsofjointventuresandassociatedcompanies”,includedinoperating
income.thisisduetothattheseinterestsareheldforoperatingratherthan
investingorfinancialpurposes.ericsson’sshareofincometaxesrelated
tojointventuresandassociatedcompaniesisreportedunderthelineitem
taxesintheincomestatement.
unrealizedgainsontransactionsbetweentheCompanyandits
associatedcompaniesandjointventuresareeliminatedtotheextentof
theCompany’sinterestintheseentities.unrealizedlossesarealso
eliminatedunlessthetransactionprovidesevidenceofanimpairmentofthe
assettransferred.
Sharesinearningsofjointventuresandassociatedcompaniesincluded
inconsolidatedequitywhichareundistributedarereportedinretained
earningsinthebalancesheet.
impairmenttestingaswellasrecognitionorreversalofimpairment
ofinvestmentsineachjointventureisperformedinthesamemanneras
forintangibleassetsotherthangoodwill.theentirecarryingamountof
eachinvestment,includinggoodwill,istestedasasingleasset.Seealso
descriptionunder“intangibleassetsotherthangoodwill”below.
iftheownershipinterestinanassociateisreducedbutsignificant
influenceisretained,onlyaproportionateshareoftheamountspreviously
recognizedinothercomprehensiveincomearereclassifiedtoprofitorloss
whereappropriate.
Foreign.currency.remeasurement.and.translation
itemsincludedinthefinancialstatementsofeachentityoftheCompanyare
measuredusingthecurrencyoftheprimaryeconomicenvironmentinwhich
theentityoperates(‘thefunctionalcurrency’).theconsolidatedfinancial
statementsarepresentedinSwedishkrona(Sek),whichistheParent
Company’sfunctionalandpresentationcurrency.
transaCtions.and.balanCes
foreigncurrencytransactionsaretranslatedintothefunctionalcurrency
usingtheexchangeratesprevailingatthedatesofthetransactions.
foreignexchangegainsandlossesresultingfromthesettlementof
suchtransactionsandfromthetranslationatperiod-endexchangerates
ofmonetaryassetsandliabilitiesdenominatedinforeigncurrencies
arerecognizedintheincomestatement,unlessdeferredinother
Comprehensiveincome(oCi)underthehedgeaccountingpracticesas
describedbelow.
Changesinthefairvalueofmonetarysecuritiesdenominatedinforeign
currencyclassifiedasavailable-for-saleareanalyzedbetweentranslation
differencesresultingfromchangesintheamortizedcostofthesecurityand
otherchangesinthecarryingamountofthesecurity.translationdifferences
relatedtochangesintheamortizedcostarerecognizedinprofitorloss,and
otherchangesinthecarryingamountarerecognizedinoCi.
translationdifferencesonnon-monetaryfinancialassetsandliabilities
arereportedaspartofthefairvaluegainorloss.
intra-groupbalancesandanyunrealizedincomeandexpense
arisingfromintra-grouptransactionsarefullyeliminatedinpreparingthe
consolidatedfinancialstatements.unrealizedlossesareeliminatedin
thesamewayasunrealizedgains,butonlytotheextentthatthereisno
evidenceofimpairment.
business.combinations
business.Combinations.From.January.1,.2010
attheacquisitionofabusiness,thecostoftheacquisition,beingthe
purchaseprice,ismeasuredasthefairvalueoftheassetsgiven,and
liabilitiesincurredorassumedatthedateofexchange,includinganycost
relatedtocontingentconsideration.transactioncostsattributabletothe
acquisitionareexpensedasincurred.theacquisitioncostisallocatedto
acquiredassets,liabilitiesandcontingentliabilitiesbaseduponappraisals
made,includingassetsandliabilitiesthatwerenotrecognizedonthe
acquiredentity’sbalancesheet,forexampleintangibleassetssuchas
customerrelations,brands,patentsandfinancialliabilities.goodwillarises
whenthepurchasepriceexceedsthefairvalueofrecognizableacquirednet
assets.finalamountsareestablishedwithinoneyearafterthetransaction
dateatthelatest.
incasethereisaputoptionfornon-controllinginterestinasubsidiarya
correspondingfinancialliabilityisrecognized.
business.Combinations.beFore.January.1,.2010
attheacquisitionofabusiness,thecostoftheacquisition,beingthe
purchaseprice,wasmeasuredasthefairvalueofassetsacquired,and
liabilitiesincurredorassumedatthedateofexchange,pluscostsdirectly
attributabletotheacquisition.theacquisitioncostwasallocatedto
acquiredassets,liabilitiesandcontingentliabilitiesbaseduponappraisals
made,includingassetsthatwerenotrecognizedontheacquiredentity’s
balancesheet,forexampleintangibleassetssuchascustomerrelations,
brandsandpatents.goodwillarosewhenthepurchasepriceexceeded
thefairvalueofrecognizableacquirednetassets.finalamountshadtobe
establishedwithinoneyearafterthetransactiondate.
non-controlling.interest
aCquisitions.From.January.1,.2010
theCompanytreatstransactionswithnon-controllinginterestsas
transactionswithequityownersoftheCompany.forpurchasesfromnon-
controllinginterests,thedifferencebetweenanyconsiderationpaidandthe
relevantshareacquiredofthecarryingvalueofnetassetsofthesubsidiary
isrecordedinequity.gainsorlossesondisposalstonon-controlling
interestsarealsorecordedinequity.
whentheCompanyceasestohavecontrolorsignificantinfluence,
anyretainedinterestintheentityisremeasuredtoitsfairvalue,withthe
changeincarryingamountrecognizedinprofitorloss.thefairvalueisthe
initialcarryingamountforthepurposesofsubsequentlyaccountingforthe
retainedinterestinanassociate,jointventureorfinancialasset.inaddition,
anyamountspreviouslyrecognizedinothercomprehensiveincomein
respectofthatentityareaccountedforasiftheCompanyhaddirectly
disposedoftherelatedassetsorliabilities.thismaymeanthatamounts
previouslyrecognizedinothercomprehensiveincomearereclassifiedto
profitorloss.
atacquisition,thereisachoiceonanacquisition-by-acquisitionbasisto
measurethenon-controllinginterestintheacquireeeitheratfairvalueorat
thenon-controllinginterest’sproportionateshareoftheacquiree’snetassets.
aCquisitions.beFore.January.1,.2010
theCompanytreatedtransactionswithnon-controllinginterests(formerly
minorityinterests)astransactionswithexternalparties.disposalsof
minorityinterestswererecognizedasgainsandlossesintheincome
statement.Purchasesfromnon-controllinginterestsresultedingoodwill
48|ericssonannualreportonform20-f2010

deFinitions.oF.ContraCt.types.and.related.more.speCiFiC.revenue.reCognition.Criteriadifferentrevenuerecognitionmethods,basedoneitheriaS18“revenue”
oriaS11“Constructioncontracts”,areappliedbasedonthesolutions
providedtocustomers,thenatureandsophisticationofthetechnology
involvedandthecontractconditionsineachcase.
thecontracttypesthatareaccountedforinaccordancewithiaS18are:
> delivery-typecontracts,i.e.contractsfordeliveryofaproductora
combinationofproductstoformawholeorapartofanetworkaswell
asdeliveryofstand-aloneproducts.medium-sizeandlargedelivery
typecontractsgenerallyincludemultipleelements.Suchelements
arenormallystandardizedtypesofequipmentorsoftwareaswellas
services,suchasnetworkrollout.
revenueisrecognizedwhenrisksandrewardshavebeentransferred
tothecustomer,normallystipulatedinthecontractualtermsoftrade.
fordelivery-typecontractswithmultipleelements,revenue,including
theimpactofanydiscountorrebate,isallocatedtoeachelement
basedonrelativefairvalues.ifthereareundeliveredelementsessential
tothefunctionalityofdeliveredelements,theCompanydefers
recognitionofrevenueuntilallelementsessentialtothefunctionality
havebeendelivered.
> Contractsforservicesincludevarioustypesofservicessuchas:training,
consulting,engineering,installation,multi-yearmanagedservicesand
hosting.revenueisgenerallyrecognizedwhentheserviceshavebeen
provided.revenueformanagedservicecontractsandotherservices
contractscoveringlongerperiodsisrecognizedprorataoverthe
contractperiod.
> Contractsgeneratinglicensefeesfromthirdpartiesfortheuseofthe
Company’stechnologyorintellectualpropertyrights.revenue
isnormallyrecognizedbasedonsalesofproductssoldtothe
customer/licensee.
thecontracttypethatisaccountedforinaccordancewithiaS11is:
> Construction-typecontracts.ingeneral,aconstruction-typecontract
isacontractwheretheCompanysuppliestoacustomer,acomplete
network,whichtoalargeextentisbaseduponnewtechnologyor
includesmajorcomponentswhicharespecificallydesignedfor
thecustomer.revenuesfromconstruction-typecontractsare
recognizedaccordingtostageofcompletion,generallyusingthe
milestoneoutputmethod.
earnings.per.share.
basicearningspersharearecalculatedbydividingnetincomeattributable
tostockholdersoftheParentCompanybytheweightedaveragenumber
ofsharesoutstanding(totalnumberofshareslesstreasurystock)during
theyear.
dilutedearningspersharearecalculatedbydividingnetincome
attributabletostockholdersoftheParentCompany,whenappropriate
adjustedbythesumoftheweightedaveragenumberofordinaryshares
outstandinganddilutivepotentialordinaryshares.Potentialordinaryshares
aretreatedasdilutivewhen,andonlywhen,theirconversiontoordinary
shareswoulddecreaseearningspershare.
Stockoptionsandrightstomatchingsharesareconsidereddilutive
whentheactualfulfillmentofanyperformanceconditionsasofthereporting
datewouldgivearighttoordinaryshares.furthermore,stockoptionsare
considereddilutiveonlywhentheexercisepriceislowerthantheperiod’s
averageshareprice.
Financial.assets
financialassetsarerecognizedwhentheCompanybecomesapartytothe
contractualprovisionsoftheinstrument.regularpurchasesandsalesof
financialassetsarerecognizedonthesettlementdate.
group.companies
theresultsandfinancialpositionofallthegroupentitiesthathavea
functionalcurrencydifferentfromthepresentationcurrencyaretranslated
intothepresentationcurrencyasfollows:
> assetsandliabilitiesforeachbalancesheetpresentedaretranslatedat
theclosingrateatthedateofthatbalancesheet;
> incomeandexpensesforeachincomestatementaretranslatedat
averageexchangerates;and
> allresultingnetexchangedifferencesarerecognizedasaseparate
componentofoCi.
onconsolidation,exchangedifferencesarisingfromthetranslationofthe
netinvestmentinforeignoperations,andofborrowingsandothercurrency
instrumentsdesignatedashedgesofsuchinvestments,areaccountedfor
inoCi.whenaforeignoperationispartiallydisposedoforsold,exchange
differencesthatwererecordedinoCiarerecognizedintheincome
statementaspartofthegainorlossonsale.
goodwillandfairvalueadjustmentsarisingontheacquisitionofa
foreignentityaretreatedasassetsandliabilitiesoftheforeignentityand
translatedattheclosingrate.
thereisnosignificantimpactduetoacurrencyofahyperinflationary
economy.
statement.of.cash.flows
thestatementofcashflowispreparedinaccordancewiththeindirect
method.Cashflowsinforeignsubsidiariesaretranslatedattheaverage
exchangerateduringtheperiod.Paymentsforsubsidiariesacquiredor
divestedarereportedascashflowfrominvestingactivities,netofcashand
cashequivalentsacquiredordisposedof,respectively.
Cashandcashequivalentsconsistofcash,bank,andshort-term
investmentsthatarehighlyliquidmonetaryfinancialinstrumentswitha
remainingmaturityofthreemonthsorlessatthedateofacquisition.
revenue.recognition.
theCompanyoffersacomprehensiveportfoliooftelecommunication
anddatacommunicationsystems,multimediasolutionsandprofessional
services,coveringarangeoftechnologies.
thecontractsareoffourmaintypes:
> delivery-type.
> contractsforvarioustypesofservices,forexamplemulti-yearmanaged
servicescontracts.
> licenseagreementsfortheuseoftheCompany’stechnologyor
intellectualpropertyrights,notbeingapartofanotherproduct.
> construction-type.
themajorityoftheCompany’sproductsandservicesaresoldunder
delivery-typecontractsincludingmultipleelements,suchasbasestations,
basestationcontrollers,mobileswitchingcenters,routers,microwave
transmissionlinks,varioussoftwareproductsandrelatedinstallationand
integrationservices.Suchcontractelementsgenerallyhaveindividualitem
pricesinagreedpricelistspercustomer.
Salesarerecordednetofvalueaddedtaxes,goodsreturned,trade
discountsandrebates.revenueisrecognizedwithreferencetoall
significantcontractualtermswhentheproductorservicehasbeendelivered,
whentherevenueamountisfixedordeterminable,andwhencollection
isreasonablyassured.Specificcontractualperformanceandacceptance
criteriamayimpactthetimingandamountsofrevenuerecognized.
theprofitabilityofcontractsisperiodicallyassessed,andprovisionsfor
anyestimatedlossesaremadeimmediatelywhenlossesareprobable.
forsalesbetweenconsolidatedcompanies,associatedcompanies,joint
venturesandsegments,theCompanyappliesarm’slengthpricing.
ericssonannualreportonform20-f2010|..49

impairmentateachbalancesheetdate,theCompanyassesseswhetherthereis
objectiveevidencethatafinancialassetoragroupoffinancialassetsis
impaired.inthecaseofequitysecuritiesclassifiedasavailable-for-sale,a
significantorprolongeddeclineinthefairvalueofthesecuritybelowits
costisconsideredasanevidencethatthesecurityisimpaired.ifanysuch
evidenceexistsforavailable-for-salefinancialassets,thecumulativeloss–
measuredasthedifferencebetweentheacquisitioncostandthecurrentfair
value,lessanyimpairmentlossonthatfinancialassetpreviouslyrecognized
inprofitorloss–isremovedfromoCiandrecognizedintheincome
statement.impairmentlossesrecognizedintheincomestatementonequity
instrumentsarenotreversedthroughtheincomestatement.
anassessmentofimpairmentofreceivablesisperformedwhenthereis
objectiveevidencethattheCompanywillnotbeabletocollectallamounts
dueaccordingtotheoriginaltermsofthereceivable.Significantfinancial
difficultiesofthedebtor,probabilitythatthedebtorwillenterbankruptcy
orfinancialreorganization,anddefaultordelinquencyinpaymentsare
consideredindicatorsthatthetradereceivableisimpaired.theamountof
theallowanceisthedifferencebetweentheasset’scarryingamountand
thepresentvalueofestimatedfuturecashflows,discountedattheoriginal
effectiveinterestrate.thecarryingamountoftheassetisreducedthrough
theuseofanallowanceaccount,andtheamountofthelossisrecognized
intheincomestatementwithinsellingexpenses.whenatradereceivable
isfinallyestablishedasuncollectible,itiswrittenoffagainsttheallowance
accountfortradereceivables.Subsequentrecoveriesofamountspreviously
writtenoffarecreditedtosellingexpensesintheincomestatement.
Financial.liabilitiesfinancialliabilitiesarerecognizedwhentheCompanybecomesboundto
thecontractualobligationsoftheinstrument.
financialliabilitiesarederecognizedwhentheyareextinguished,
i.e.whentheobligationspecifiedinthecontractisdischarged,cancelled
orexpires.
borrowings
borrowingsareinitiallyrecognizedatfairvalue,netoftransactioncosts
incurred.borrowingsaresubsequentlystatedatamortizedcost;any
differencebetweentheproceeds(netoftransactioncosts)andthe
redemptionvalueisrecognizedintheincomestatementovertheperiodof
theborrowingsusingtheeffectiveinterestmethod.
borrowingsareclassifiedascurrentliabilitiesunlesstheCompany
hasanunconditionalrighttodefersettlementoftheliabilityforatleast12
monthsafterthebalancesheetdate.
trade.payables
tradepayablesarerecognizedinitiallyatfairvalueandsubsequently
measuredatamortizedcostusingtheeffectiveinterestmethod.
derivatives.at.Fair.value.through.proFit.or.loss
Certainderivativeinstrumentsdonotqualifyforhedgeaccountingandare
accountedforatfairvaluethroughprofitorloss.Changesinthefairvalue
ofthesederivativeinstrumentsthatdonotqualifyforhedgeaccounting
arerecognizedimmediatelyintheincomestatementeitherascostofsales,
otheroperatingincome,financialincomeorfinancialexpense,dependingon
theintentofthetransaction.
financialassetsarederecognizedwhentherightstoreceivecash
flowsfromtheinvestmentshaveexpiredorhavebeentransferredandthe
Companyhastransferredsubstantiallyallrisksandrewardsofownership.
Separateassetsorliabilitiesarerecognizedifanyrightsandobligationsare
createdorretainedinthetransfer.
theCompanyclassifiesitsfinancialassetsinthefollowingcategories:at
fairvaluethroughprofitorloss,loansandreceivables,andavailableforsale.
theclassificationdependsonthepurposeforwhichthefinancialassets
wereacquired.managementdeterminestheclassificationofitsfinancial
assetsatinitialrecognition.
financialassetsareinitiallyrecognizedatfairvalueplustransaction
costsforallfinancialassetsnotcarriedatfairvaluethroughprofitorloss.
financialassetscarriedatfairvaluethroughprofitorlossareinitially
recognizedatfairvalue,andtransactioncostsareexpensedinthe
incomestatement.
thefairvaluesofquotedfinancialinvestmentsandderivativesarebased
onquotedmarketpricesorrates.ifofficialratesormarketpricesarenot
available,fairvaluesarecalculatedbydiscountingtheexpectedfuturecash
flowsatprevailinginterestrates.valuationsoffxoptionsandinterestrate
guarantees(irg)aremadebyusingablack-Scholesformula.inputsto
thevaluationsaremarketpricesforimpliedvolatility,foreignexchangeand
interestrates.
FinanCial.assets.at.Fair.value.through.proFit.or.loss
financialassetsatfairvaluethroughprofitorlossarefinancialassets
heldfortrading.afinancialassetisclassifiedinthiscategoryifacquired
principallyforthepurposeofsellingorrepurchasinginthenearterm.
derivativesareclassifiedasheldfortrading,unlesstheyaredesignated
ashedges.assetsinthiscategoryareclassifiedascurrentassets.
gainsorlossesarisingfromchangesinthefairvaluesofthe“financial
assetsatfairvaluethroughprofitorloss”-category(excludingderivatives)
arepresentedintheincomestatementwithinfinancialincomeintheperiod
inwhichtheyarise.derivativesarepresentedintheincomestatement
eitherascostofsales,otheroperatingincome,financialincomeorfinancial
expense,dependingontheintentwiththetransaction.
loans.and.reCeivables
receivablesaresubsequentlymeasuredatamortizedcostusingthe
effectiveinterestratemethod,lessallowancesforimpairmentcharges.trade
receivablesincludeamountsduefromcustomers.thebalancerepresents
amountsbilledtocustomeraswellasamountswhereriskandrewardshave
beentransferredtothecustomerbuttheinvoicehasnotyetbeenissued.
Collectabilityofthereceivablesisassessedforpurposesofinitial
revenuerecognition.
available-For-sale.FinanCial.assets
available-for-salefinancialassetsarenon-derivativesthatareeither
designatedinthiscategoryornotclassifiedinanyoftheothercategories.
theyareincludedinnon-currentassetsunlessmanagementintendsto
disposeoftheinvestmentwithin12monthsofthebalancesheetdate.
dividendsonavailable-for-saleequityinstrumentsarerecognizedinthe
incomestatementaspartoffinancialincomewhentheCompany’srightto
receivepaymentsisestablished.
Changesinthefairvalueofmonetarysecuritiesdenominatedinaforeign
currencyandclassifiedasavailable-for-saleareanalyzedbetweentranslation
differencesresultingfromchangesinamortizedcostofthesecurityandother
changesinthecarryingamountofthesecurity.thetranslationdifferences
onmonetarysecuritiesarerecognizedinprofitorloss;translationdifferences
onnon-monetarysecuritiesarerecognizedinoCi.Changesinthefairvalue
ofmonetaryandnon-monetarysecuritiesclassifiedasavailable-for-saleare
recognizedinoCi.whensecuritiesclassifiedasavailable-for-salearesold
orimpaired,theaccumulatedfairvalueadjustmentspreviouslyrecognizedin
oCiareincludedintheincomestatement.
50|ericssonannualreportonform20-f2010

net.investment.hedgeshedgesofnetinvestmentsinforeignoperationsareaccountedforsimilarly
tocashflowhedges.anygainorlossonthehedginginstrumentrelating
totheeffectiveportionofthehedgeisrecognizedinoCi.againorloss
relatingtoanineffectiveportionisrecognizedimmediatelyintheincome
statementwithinfinancialincomeorexpense.gainsandlossesdeferred
inoCiareincludedintheincomestatementwhentheforeignoperationis
partiallydisposedoforsold.
Financial.guaranteesfinancialguaranteecontractsareinitiallyrecognizedatfairvalue(i.e.
usuallythefeereceived).Subsequently,thesecontractsaremeasuredatthe
higherof:
> theamountdeterminedasthebestestimateofthenetexpenditure
requiredtosettletheobligationaccordingtotheguaranteecontract,and
> therecognizedcontractualfeelesscumulativeamortizationwhen
amortizedovertheguaranteeperiod,usingthestraight-line-method.
thebestestimateofthenetexpenditurecomprisesfuturefeesandcash
flowsfromsubrogationrights.
inventories.
inventoriesaremeasuredatthelowerofcostornetrealizablevalueona
first-in,first-out(fifo)basis.
risksofobsolescencehavebeenmeasuredbyestimatingmarket
valuebasedonfuturecustomerdemandandchangesintechnologyand
customeracceptanceofnewproducts.
intangible.assets.
intangible.assets.other.than.goodwill
intangibleassetsotherthangoodwillcomprisecapitalizeddevelopment
expensesandacquiredintangibleassets,suchaspatents,customer
relations,trademarksandsoftware.atinitialrecognition,capitalized
developmentexpensesarestatedatcostwhileacquiredintangibleassets
relatedtobusinesscombinationsarestatedatfairvalue.Subsequentto
initialrecognition,bothcapitalizeddevelopmentexpensesandacquired
intangibleassetsarestatedatinitiallyrecognizedamountslessaccumulated
amortizationandanyimpairment.amortizationandanyimpairmentlosses
areincludedinresearchanddevelopmentexpenses,mainlyforcapitalized
developmentexpensesandpatents,inSellingandadministrativeexpenses,
mainlyforcustomerrelationsandbrands,andinCostofsales.
Costsincurredfordevelopmentofproductstobesold,leasedor
otherwisemarketedorintendedforinternalusearecapitalizedasfrom
whentechnologicalandeconomicalfeasibilityhasbeenestablisheduntil
theproductisavailableforsaleoruse.thesecapitalizedexpensesare
mainlygeneratedinternallyandincludedirectlaboranddirectlyattributable
overhead.amortizationofcapitalizeddevelopmentexpensesbeginswhen
theproductisavailableforgeneralrelease.amortizationismadeona
productorplatformbasisaccordingtothestraight-linemethodover
periodsnotexceedingfiveyears.researchanddevelopmentexpenses
directlyrelatedtoordersfromcustomersareaccountedforasapartofCost
ofsales.otherresearchanddevelopmentexpensesarechargedtoincome
asincurred.
amortizationofacquiredintangibleassets,suchaspatents,customer
relations,brandsandsoftware,ismadeaccordingtothestraight-line
methodovertheirestimatedusefullives,notexceedingtenyears.however,
iftheeconomicbenefitrelatedtoanitemofintangibleassetsisfront-end
loadedtheamortizationmethodreflectsthis.thus,theamortizationfor
suchanitemisamortizedonadigressivecurvebasisandtheassetvalue
decreaseswithhigheramountsinthebeginningoftheusefullifecompared
totheend.
derivative.financial.instruments.and.hedging.activities
derivativesareinitiallyrecognizedatfairvalueattradedateand
subsequentlyre-measuredatfairvalue.themethodofrecognizingthe
resultinggainorlossdependsonwhetherthederivativeisdesignatedas
ahedginginstrument,andifso,thenatureoftheitembeinghedged.the
Companydesignatescertainderivativesaseither:
a) fair.value.hedge:.ahedgeofthefairvalueofrecognizedliabilities;
b)cash.flow.hedge:ahedgeofaparticularriskassociatedwithahighly
probableforecasttransaction;or
c) net.investment.hedge:.ahedgeofanetinvestmentinaforeignoperation.
attheinceptionofthehedge,theCompanydocumentstherelationship
betweenhedginginstrumentsandhedgeditems,aswellasitsrisk
managementobjectivesandstrategyforundertakingvarioushedging
transactions.theCompanyalsodocumentsitsassessment,bothathedge
inceptionandonanongoingbasis,ofwhetherthederivativesthatareused
inhedgingtransactionsarehighlyeffectiveinoffsettingchangesinfair
valuesorcashflowsofthehedgeditems.
thefairvaluesofvariousderivativeinstrumentsusedforhedging
purposesaredisclosedinnoteC20,“financialriskmanagementand
financialinstruments”.movementsinthehedgingreserveinoCiareshown
innoteC16,“equityandoCi”.
thefairvalueofahedgingderivativeisclassifiedasanon-currentasset
orliabilitywhentheremainingmaturityofthehedgeditemismorethan12
months,andasacurrentassetorliabilitywhentheremainingmaturityof
thehedgeditemislessthan12months.tradingderivativesareclassifiedas
currentassetsorliabilities.
Fair.value.hedges
Changesinthefairvalueofderivativesthataredesignatedandqualifyas
fairvaluehedgesarerecordedintheincomestatement,togetherwithany
changesinthefairvalueofthehedgedassetorliabilitythatareattributable
tothehedgedrisk.theCompanyonlyappliesfairvaluehedgeaccounting
forhedgingfixedinterestriskonborrowings.bothgainsandlossesrelating
totheinterestrateswapshedgingfixedrateborrowingsandthechangesin
thefairvalueofthehedgedfixedrateborrowingsattributabletointerestrate
riskarerecognizedintheincomestatementwithinfinancialexpenses.ifthe
hedgenolongermeetsthecriteriaforhedgeaccounting,theadjustmentto
thecarryingamountofahedgeditemforwhichtheeffectiveinterestmethod
isusedisamortizedtoprofitorlossovertheremainingperiodtomaturity.
Cash.Flow.hedges
theeffectiveportionofchangesinthefairvalueofderivativesthatare
designatedandqualifyascashflowhedgesisrecognizedinoCi.thegain
orlossrelatingtoanineffectiveportionisrecognizedimmediatelyinthe
incomestatementwithinfinancialincomeorexpense.
amountsdeferredinoCiarerecycledintheincomestatementinthe
periodswhenthehedgeditemaffectsprofitorloss(forexample,when
theforecastsalethatishedgedtakesplace),eitherinnetSalesorCost
ofSales.whentheforecasttransactionthatishedgedresultsinthe
recognitionofanon-financialasset(forexample,inventoryorfixedassets),
thegainsandlossespreviouslydeferredinoCiaretransferredfromoCiand
includedintheinitialmeasurementofthecostoftheasset.thedeferred
amountsareultimatelyrecognizedinCostofSalesincaseofinventoryorin
depreciationincaseoffixedassets.whenahedginginstrumentexpiresor
issold,orwhenahedgenolongermeetsthecriteriaforhedgeaccounting,
anycumulativegainorlosswhichatthattimeremainsinoCiisrecognized
intheincomestatementwhentheforecasttransactionisultimately
recognized.whenaforecasttransactionisnolongerexpectedtooccur,the
cumulativegainorlossthatwasreportedinoCiisimmediatelytransferred
totheincomestatementwithinfinancialincomeorexpense.
ericssonannualreportonform20-f2010|..51
leasing.leasing.when.the.Company.is.the.lessee
leasesontermsinwhichtheCompanyassumessubstantiallyalltherisks
andrewardsofownershipareclassifiedasfinanceleases.uponinitial
recognition,theleasedassetismeasuredatanamountequaltothelower
ofitsfairvalueandthepresentvalueoftheminimumleasepayments.
Subsequenttoinitialrecognition,theassetisaccountedforinaccordance
withtheaccountingpolicyapplicabletothattypeofasset,althoughthe
depreciationperiodmustnotexceedtheleaseterm.
otherleasesareoperatingleases,andtheleasedassetsundersuch
contractsarenotrecognizedonthebalancesheet.Costsunderoperating
leasesarerecognizedintheincomestatementonastraight-linebasis
overthetermofthelease.leaseincentivesreceivedarerecognizedasan
integralpartofthetotalleaseexpense,overthetermofthelease.
leasing.when.the.Company.is.the.lessor
leasingcontractswiththeCompanyaslessorareclassifiedasfinance
leaseswhenthemajorityofrisksandrewardsaretransferredtothelessee,
andotherwiseasoperatingleases.underafinancelease,areceivable
isrecognizedatanamountequaltothenetinvestmentintheleaseand
revenueisrecognizedinaccordancewiththerevenuerecognitionprinciples.
underoperatingleasestheequipmentisrecordedasproperty,plant
andequipmentandrevenueaswellasdepreciationisrecognizedona
straight-linebasisovertheleaseterm.
income.taxes.incometaxesintheconsolidatedfinancialstatementsincludebothcurrent
anddeferredtaxes.incometaxesarereportedintheincomestatement
unlesstheunderlyingitemisreporteddirectlyinequityoroCi.forthose
items,therelatedincometaxisalsoreporteddirectlyinequityoroCi.a
currenttaxliabilityorassetisrecognizedfortheestimatedtaxespayableor
refundableforthecurrentyearorprioryears.
deferredtaxisrecognizedfortemporarydifferencesbetweenthe
bookvaluesofassetsandliabilitiesandtheirtaxvaluesandfortaxloss
carryforwards.adeferredtaxassetisrecognizedonlytotheextentthat
itisprobablethatfuturetaxableprofitswillbeavailableagainstwhichthe
deductibletemporarydifferencesandtaxlosscarryforwardscanbeutilized.
deferredtaxisnotrecognizedforthefollowingtemporarydifferences:
goodwillnotdeductiblefortaxpurposes,fortheinitialrecognitionof
assetsorliabilitiesthataffectneitheraccountingnortaxableprofit,andfor
differencesrelatedtoinvestmentsinsubsidiarieswhenitisprobablethat
thetemporarydifferencewillnotreverseintheforeseeablefuture.
deferredtaxismeasuredatthetaxratethatisexpectedtobeapplied
tothetemporarydifferenceswhentheyreverse,basedonthetaxlaws
thathavebeenenactedorsubstantivelyenactedbythereportingdate.an
adjustmentofdeferredtaxasset/liabilitybalancesduetoachangeinthetax
rateisrecognizedintheincomestatement,unlessitrelatestoatemporary
differenceearlierrecognizeddirectlyinequityoroCi,inwhichcasethe
adjustmentisalsorecognizedinequityoroCi.
themeasurementofdeferredtaxassetsinvolvesjudgmentregarding
thedeductibilityofcostsnotyetsubjecttotaxationandestimatesregarding
sufficientfuturetaxableincometoenableutilizationofunusedtaxlossesin
differenttaxjurisdictions.alldeferredtaxassetsaresubjecttoannualreview
ofprobableutilization.thelargestamountsoftaxlosscarryforwardsrelate
toSweden,withindefiniteperiodofutilization.
provisions.Provisionsaremadewhentherearelegalorconstructiveobligations
asaresultofpasteventsandwhenitisprobablethatanoutflowof
resourceswillberequiredtosettletheobligationsandtheamountscanbe
reliablyestimated.whentheeffectofthetimevalueofmoneyismaterial,
discountingismadeofestimatedoutflows.however,theactualoutflowsas
aresultoftheobligationsmaydifferfromsuchestimates.
theCompanyhasnotrecognizedanyintangibleassetswithindefinite
usefullifeotherthangoodwill.
impairmenttestsareperformedwheneverthereisanindicationof
possibleimpairment.however,intangibleassetsnotyetavailableforuse
aretestedannually.animpairmentlossisrecognizedifthecarryingamount
ofanassetoritscash-generatingunitexceedsitsrecoverableamount.the
recoverableamountisthehigherofthevalueinuseandthefairvalueless
coststosell.inassessingvalueinuse,theestimatedfuturecashflowsafter
taxarediscountedtotheirpresentvalueusinganafter-taxdiscountrate
thatreflectscurrentmarketassessmentsofthetimevalueofmoneyandthe
risksspecifictotheasset.applicationofaftertaxamountsincalculation,
bothinrelationtocashflowsanddiscountrateisappliedduetothat
availablemodelsforcalculatingdiscountrateincludeataxcomponent.the
aftertaxdiscounting,appliedbytheCompanyisnotmateriallydifferent
fromadiscountingbasedonbefore-taxfuturecashflowsandbefore-tax
discountrates,asrequiredbyifrS.
Corporateassetshavebeenallocatedtocash-generatingunitsin
relationtoeachunit’sproportionoftotalnetsales.theamountrelatedto
corporateassetsisnotsignificant.impairmentlossesrecognizedinprior
periodsareassessedateachreportingdateforanyindicationsthatthe
losshasdecreasedornolongerexists.animpairmentlossisreversedif
therehasbeenachangeintheestimatesusedtodeterminetherecoverable
amountsandiftherecoverableamountishigherthanthecarryingvalue.
animpairmentlossisreversedonlytotheextentthattheasset’scarrying
amountafterreversaldoesnotexceedthecarryingamount,netof
amortization,whichwouldhavebeenreportedifnoimpairmentlosshad
beenrecognized.
goodwill
asfromtheacquisitiondate,goodwillacquiredinabusinesscombination
isallocatedtoeachcash-generatingunit(Cgu)oftheCompanyexpected
tobenefitfromthesynergiesofthecombination.ericsson’sfiveoperating
segmentshavebeenidentifiedasCgus.goodwillisassignedtofourof
them,networks,ProfessionalServices,multimediaandSt-ericsson.
anannualimpairmenttestfortheCgustowhichgoodwillhasbeen
allocatedisperformedinthefourthquarter,orwhenthereisanindication
ofimpairment.impairmenttestingaswellasrecognitionofimpairmentof
goodwillisperformedinthesamemannerasforintangibleassetsother
thangoodwill,seedescriptionunder“intangibleassetsotherthangoodwill”
above.animpairmentlossinrespectofgoodwillisnotreversed.
additionaldisclosureisrequiredinrelationtogoodwillimpairment
testing,seenoteC2,“CriticalaccountingestimatesandJudgments”below
andinnoteC10,“intangibleassets”.
property,.plant.and.equipment.
Property,plantandequipmentarestatedatcostlessaccumulated
depreciationandanyimpairmentlosses.
depreciationischargedtoincome,generallyonastraight-linebasis,
overtheestimatedusefullifeofeachcomponentofanitemofproperty,
plantandequipment,includingbuildings.estimatedusefullivesare,in
general,25–50yearsforrealestateand3–10yearsformachineryand
equipment.depreciationandanyimpairmentchargesareincludedinCost
ofsales,researchanddevelopmentorSellingandadministrativeexpenses.
theCompanyrecognizesinthecarryingamountofanitemofproperty,
plantandequipmentthecostofreplacingacomponentandderecognizes
theresidualvalueofthereplacedcomponent.
impairmenttestingaswellasrecognitionorreversalofimpairment
ofproperty,plantandequipmentisperformedinthesamemannerasfor
intangibleassetsotherthangoodwill,seedescriptionunder“intangible
assetsotherthangoodwill”above.
gainsandlossesondisposalsaredeterminedbycomparingthe
proceedslesscosttosellwiththecarryingamountandarerecognized
withinotheroperatingincomeandexpensesintheincomestatement.
52|ericssonannualreportonform20-f2010

thereisnodeepmarketinsuchbonds,themarketyieldsongovernment
bondsareused.thecalculationsarebaseduponactuarialassumptions,
assessedonaquarterlybasis,andareasaminimumpreparedannually.
actuarialassumptionsaretheCompany’sbestestimateofthevariables
thatdeterminethecostofprovidingthebenefits.whenusingactuarial
assumptions,itispossiblethattheactualresultswilldifferfromthe
estimatedresultsorthattheactuarialassumptionswillchangefromone
periodtoanother.thesedifferencesarereportedasactuarialgainsand
losses.theyareforexamplecausedbyunexpectedlyhighorlowratesof
employeeturnover,changedlifeexpectancy,salarychanges,changesinthe
discountrateanddifferencesbetweenactualandexpectedreturnonplan
assets.actuarialgainsandlossesarerecognizedinoCiintheperiodin
whichtheyoccur.theCompany’snetliabilityforeachdefinedbenefitplan
consistsofthepresentvalueofpensioncommitmentslessthefairvalueof
planassetsandisrecognizednetonthebalancesheet.whentheresultis
anetbenefittotheCompany,therecognizedassetislimitedtothetotalof
anycumulativepastservicecostandthepresentvalueofanyfuturerefunds
fromtheplanorreductionsinfuturecontributionstotheplan.
thenetofreturnonplanassetsandinterestonpensionliabilitiesis
reportedasfinancialincomeorexpense,whilethecurrentservicecostand
anyotheritemsintheannualpensioncostarereportedasoperatingincome
orexpense.
Payrolltaxesrelatedtoactuarialgainsandlossesareincludedin
determiningactuarialgainsandlosses.
share-based.compensation.to.employees..and.the.board.of.directors
Share-basedcompensationisrelatedtoremunerationtoallemployees,
includingkeymanagementpersonnelandtheboardofdirectors.
underifrS,acompanyshallrecognizecompensationcostsforshare-
basedcompensationprogramsbasedonameasureofthevaluetothe
companyofservicesreceivedundertheplans.
thisvalueisbasedonthefairvalueof,forexamplefreesharesatgrant
date,measuredasstockpriceaspereachinvestmentdate.thevalueat
grantdateischargedtotheincomestatementasanyotherremuneration
overtheserviceperiod.forexample,valueatgrantdateis90.giventhe
normalserviceperiodofthreeyearswithinericsson,30arechargedper
yearduringtheserviceperiod.
theamountchargedtotheincomestatementisreversedinequityeach
timeoftheincomestatementcharge.
thereasonforthisaccountingprincipleofifrSisthatcompensation
costisacostwithnodirectcashflowimpact.thepurposeofshare-
basedaccountingaccordingtoifrS(ifrS2)istopresentanimpactof
sharebasedprograms,beingpartofthetotalremuneration,intheincome
statement.
Compensation.to.employees
stock.purchase.plans
forstockpurchaseplans,compensationcostsarerecognizedduring
thevestingperiod,basedonthefairvalueoftheericssonshareatthe
employee’sinvestmentdate.thefairvalueisbasedupontheshare
priceatinvestmentdate,adjustedforthefactthatnodividendswillbe
receivedonmatchingsharespriortomatchingandotherfeaturesthat
arenon-vestingconditions.theemployeepaysapriceequaltotheshare
priceatinvestmentdatefortheinvestmentshares.theinvestmentdate
isconsideredasthegrantdate.inthebalancesheet,thecorresponding
amountsareaccountedforasequity.vestingconditionsarenon-market
basedandaffectthenumberofsharesthatericssonwillmatch.other
featuresofashare-basedpaymentarenotvestingconditions.these
featureswouldneedtobeincludedinthegrantdatefairvaluefor
transactionswithemployeesandothersprovidingsimilarservices.inthe
periodwhenanemployeetakesarefundofpreviouslymadecontributions
theprovisionsaremainlyrelatedtowarrantycommitments,
restructuring,customerprojectsandotherobligations,suchasunresolved
incometaxandvalueaddedtaxissues,claimsorobligationsasaresult
ofpatentinfringementandotherlitigations,supplierclaimsandcustomer
financeguarantees.
Productwarrantycommitmentsconsiderprobabilitiesofallmaterial
qualityissuesbasedonhistoricalperformanceforestablishedproductsand
expectedperformancefornewproducts,estimatesofrepaircostperunit,
andvolumessoldstillunderwarrantyuptothereportingdate.
arestructuringobligationisconsideredtohavearisenwhenthe
Companyhasadetailedformalplanfortherestructuring(approvedby
management),whichhasbeencommunicatedinsuchawaythatavalid
expectationhasbeenraisedamongthoseaffected.
Projectrelatedprovisionsincludeestimatedlossesononerous
contracts,contractualpenaltiesandundertakings.forlossesoncustomer
contracts,aprovisionequaltothetotalestimatedlossisrecordedwhena
lossfromacontractisanticipatedandpossibletoestimatereliably.these
contractlossestimatesincludeanyprobablepenaltiestoacustomerunder
alosscontract.
otherprovisionsincludeprovisionsforunresolvedtaxissues,litigations,
supplierclaims,customerfinanceandotherprovisions.theCompany
providesforestimatedfuturesettlementsrelatedtopatentinfringements
basedontheprobableoutcomeofeachinfringement.theultimateoutcome
oractualcostofsettlinganindividualinfringementmayvaryfromthe
Company’sestimate.
theCompanyestimatestheoutcomeofanypotentialpatent
infringementmadeknowntotheCompanythroughassertionandthrough
theCompany’sownmonitoringofpatent-relatedcasesintherelevant
legalsystems.totheextentthattheCompanymakesthejudgmentthatan
identifiedpotentialinfringementwillmorelikelythannotresultinanoutflow
ofresources,theCompanyrecordsaprovisionbasedontheCompany’s
bestestimateoftheexpenditurerequiredtosettlewiththecounterpart.
intheordinarycourseofbusiness,theCompanyissubjectto
proceedings,lawsuitsandotherunresolvedclaims,includingproceedings
underlawsandgovernmentregulationsandothermatters.thesemattersare
oftenresolvedoveralongperiodoftime.theCompanyregularlyassesses
thelikelihoodofanyadversejudgmentsinoroutcomesofthesematters,as
wellaspotentialrangesofpossiblelosses.Provisionsarerecognizedwhenit
isprobablethatanobligationhasarisenandtheamountcanbereasonably
estimatedbasedonadetailedanalysisofeachindividualissue.
Certainpresentobligationsarenotrecognizedasprovisionsasitisnot
probablethataneconomicoutflowwillberequiredtosettletheobligation
ortheamountoftheobligationcannotbemeasuredwithsufficientreliability.
Suchobligationsarereportedascontingentliabilities.forfurtherdetailed
information,seenoteC24,“Contingentliabilities”.
post-employment.benefits
Pensionsandotherpost-employmentbenefitsareclassifiedaseither
definedcontributionplansordefinedbenefitplans.underadefined
contributionplan,theCompany’sonlyobligationistopayafixedamount
toaseparateentity(apensiontrustfund)withnoobligationtopayfurther
contributionsifthefunddoesnotholdsufficientassetstopayallemployee
benefits.therelatedactuarialandinvestmentrisksfallontheemployee.
theexpendituresfordefinedcontributionplansarerecognizedasexpenses
duringtheperiodwhentheemployeeprovidesservice.underadefined
benefitplan,itistheCompany’sobligationtoprovideagreedbenefitsto
currentandformeremployees.therelatedactuarialandinvestmentrisksfall
ontheCompany.
thepresentvalueofthedefinedbenefitobligationsforcurrent
andformeremployeesiscalculatedusingtheProjectedunitCredit
method.thediscountrateforeachcountryisdeterminedbyreferenceto
marketyieldsonhigh-qualitycorporatebondsthathavematuritydates
approximatingthetermsoftheCompany’sobligations.incountrieswhere
ericssonannualreportonform20-f2010|..53

new.standards.and.interpretations.not.yet.adopted.
anumberofissuednewstandards,amendmentstostandardsand
interpretationsarenotyeteffectivefortheyearendeddecember31,
2010,andhavenotbeenappliedinpreparingtheseconsolidatedfinancial
statements:
belowisalistofstandards/interpretationsthathavebeenissued,except
foramendmentsrelatedtoifrS1,‘firsttimeadoptionofinternational
financialreportingStandards’andareeffectivefortheperiodsstartingas
fromJanuary1,2011.
> amendment.to.ias.32,.‘Financial.instruments:.presentation.–.
Classification.of.rights.issues’.
theiaSbamendediaS32toallowrights,optionsorwarrantstoacquire
afixednumberoftheentity’sownequityinstrumentsforafixedamount
ofanycurrencytobeclassifiedasequityinstrumentsprovidedtheentity
offerstherights,optionsorwarrantsproratatoallofitsexistingowners
ofthesameclassofitsownnon-derivativeequityinstruments.
> iFriC.19,.‘extinguishing.financial.liabilities.with.equity.instruments’
ClarifiestherequirementsofifrSswhenanentityrenegotiatesthe
termsofafinancialliabilitywithitscreditorandthecreditoragrees
toaccepttheentity’ssharesorotherequityinstrumentstosettlethe
financialliabilityfullyorpartially.
> ias.24,.‘related.party.disclosures’.(revised.2009)
amendsthedefinitionofarelatedpartyandmodifiescertainrelated
partydisclosurerequirementsforgovernment-relatedentities,
associatedcompaniesandjointventures.
> amendments.to.iFrs.7
amendsdisclosuresinrelationtotransfersoffinancialassets.
> amendment.to.iFriC.14,.ias.19.–.‘the.limit.on.a.defined.benefit.asset,.
minimum.funding.requirements.and.their.interaction’..
removesunintendedconsequencesarisingfromthetreatmentof
prepaymentswherethereisaminimumfundingrequirement.this
resultsinprepaymentsofcontributionsincertaincircumstancesbeing
recognizedasanassetratherthananexpense.
> iFrs.9,.‘Financial.instruments’..
ifrS9isthefirststandardissuedaspartofawiderprojecttoreplace
iaS39.ifrS9retainsbutsimplifiesthemixedmeasurementmodeland
establishestwoprimarymeasurementcategoriesforfinancialassets:
amortizedcostandfairvalue.thebasisofclassificationdependsonthe
entity’sbusinessmodelandthecontractualcashflowcharacteristicsof
thefinancialasset.theguidanceiniaS39onimpairmentoffinancial
assetsandhedgeaccountingcontinuestoapply.
> improvements.to.iFrss.2010.
theamendmentsaregenerallyapplicableforannualperiodsbeginningat
January1,2011,exceptforamendmentstoifrS7thatisapplicableas
fromJanuary1,2012,andifrS9thatisapplicableasfromJanuary1,2013.
theeuhasnotendorsedamendmentstoifrS7,ifrS9orimprovements
toifrSs.
noneoftheamendmentseffectiveasfromJanuary1,2011,are
expectedtohaveasignificantimpactontheCompany’sfinancialresultor
position.theimpactofamendmentstoifrS7andifrS9havenotyet
beenevaluated.
(andstopsmakingfurthercontributions)allremainingcompensation
expenseisrecognized.non-vestingconditionswouldnotimpactthe
numberofawardsexpectedtovestorvaluationthereofsubsequentto
grantdate.whencalculatingthecompensationcostsforsharesunder
performance-basedmatchingprograms,theParentCompanyateach
reportingdateassessestheprobabilitythattheperformancetargetsaremet.
Compensationexpensesarebasedonestimatesofthenumberofshares
thatwillmatchattheendofthevestingperiod.whensharesarematched,
socialsecuritychargesaretobepaidincertaincountriesonthevalue
oftheemployeebenefit.theemployeebenefitisgenerallybasedonthe
marketvalueofthesharesatthematchingdate.duringthevestingperiod,
estimatedamountsforsuchsocialsecuritychargesareaccrued.
Compensation.to.the.board.oF.direCtors
during2008,theParentCompanyintroducedashare-basedcompensation
programasapartoftheremunerationtotheboardofdirectors.the
programgivesnon-employeddirectorselectedbythegeneralmeeting
ofShareholdersarighttoreceivepartoftheirremunerationasafuture
paymentofanamountwhichcorrespondstothemarketvalueofashareof
classbintheParentCompanyatthetimeofpayment,asfurtherdisclosed
innoteC29,“informationregardingmembersoftheboardofdirectors,
thegroupmanagementandemployees”.thecostforcashsettlementsis
measuredandrecognizedbasedontheestimatedcostsfortheprogram
onaproratabasisduringtheserviceperiod,beingoneyear.theestimated
costsareremeasuredduringandattheendoftheserviceperiod.
segment.reporting
anoperatingsegmentisacomponentofacompanywhoseoperating
resultsareregularlyreviewedbytheCompany’schiefoperatingdecision
maker,(Codm),tomakedecisionsaboutresourcestobeallocatedto
thesegmentandassessitsperformance.withintheCompany,thegroup
managementteamisdefinedastheCodmfunction.
thesegmentpresentation,aspereachsegmentisbasedonthe
accountingpoliciesasdisclosedinthisnote.thearm’slengthprincipleis
appliedintransactionsbetweenthesegments.
theCompany’ssegmentdisclosureaboutgeographicalareasisbased
oninwhichcountrytransferofrisksandrewardsoccur.
borrowing.costs
theCompanycapitalizesborrowingcostsinrelationtoqualifyingassets,
fortheCompanynormallybeinginternallygeneratedintangibleassetsas
capitalizeddevelopmentexpenses.allotherborrowingcostsareexpensed
asincurred.
government.grants.
governmentgrantsarerecognizedwhenthereisareasonableassuranceof
compliancewithconditionsattachedtothegrantsandthatthegrantswill
bereceived.
fortheCompany,governmentgrantsarelinkedtoperformanceof
researchordevelopmentworkortocapitalexpendituresthataresubsidized
asgovernmentalstimulustoemploymentorinvestmentsinacertaincountry
orregion.governmentgrantslinkedtoresearchanddevelopmentare
normallydeductedinreportingtherelatedexpense,whereasgrantsrelated
toassetsareaccountedfordeductingthegrantwhenestablishingthe
acquisitioncostoftheasset.
54|ericssonannualreportonform20-f2010

deferred.taxesKey sources of estimation uncertainty
deferredtaxassetsarerecognizedfortemporarydifferencesbetweenthe
carryingamountsforfinancialreportingpurposesofassetsandliabilities
andtheamountsusedfortaxationpurposesandfortaxlosscarry-forwards.
thelargestamountsoftaxlosscarry-forwardsarereportedinSweden,with
anindefiniteperiodofutilization(i.e.withnoexpirydate).thevaluationof
taxlosscarry-forwards,deferredtaxassetsandtheCompany’sabilityto
utilizetaxlossesisbaseduponmanagement’sestimatesoffuturetaxable
incomeindifferenttaxjurisdictions.forfurtherdetailedinformation,please
refertonoteC8,“taxes”.
atdecember31,2010,thevalueofdeferredtaxassetsamountedto
Sek12.7(14.3)billion.thedeferredtaxassetsrelatedtolosscarryforwards
arereportedasnon-currentassets.
accounting.for.income-,.value.added-.and.other.taxesKey sources of estimation uncertainty
accountingfortheseitemsisbaseduponevaluationofincome-,value
added-andothertaxrulesinalljurisdictionswhereweperformactivities.
thetotalcomplexityofrulesrelatedtotaxesandtheaccountingforthese
requiremanagement’sinvolvementinjudgmentsregardingclassificationof
transactionsandinestimatesofprobableoutcomesofclaimeddeductions
and/ordisputes.
Capitalized.development.expensesKey sources of estimation uncertainty
impairmenttestingisperformedafterinitialrecognitionwheneverthereis
anindicationofimpairment.intangibleassetsnotyetavailableforuseare
testedannually.theimpairmenttestingamountsarebasedonestimatesof
futurecashflowsfortherespectiveproducts.
atdecember31,2010,thecapitalizeddevelopmentexpenses
amountedtoSek3.0(2.1)billion.animpairmentchargeofSek0(0.2)
billionwasrecognizedasapartoftherestructuringprogram.under
thisprogramdecisionsweretakentophaseoutcertainproducts.the
impairmentchargerelatestobalancesfortheseproducts.
Judgments made in relation to accounting policies applieddevelopmentcoststhatmeetifrS’intangibleassetrecognitioncriteriafor
productsthatwillbesold,leasedorotherwisemarketedaswellasthose
intendedforinternalusearecapitalized.thestartingpointforcapitalization
isbaseduponmanagement’sjudgmentthattechnologicalandeconomical
feasibilityisconfirmed,usuallywhenaproductdevelopmentprojecthas
reachedadefinedmilestoneaccordingtotheCompany’sestablished
projectmanagementmodel.Capitalizationceasesandamortizationof
capitalizeddevelopmentcostsbeginwhentheproductisavailablefor
generalrelease.
thedefinitionofamortizationperiodsandtheevaluationofimpairment
indicatorsalsorequiremanagement’sjudgment.
acquired.intellectual.property.rights.and.other.intangible.assets,.including.goodwillKey sources of estimation uncertainty
atinitialrecognition,futurecashflowsareestimated,toensurethatthe
initialcarryingvaluesdonotexceedtheexpecteddiscountedcashflowsfor
theitemsofthistypeofassets.afterinitialrecognitionimpairmenttesting
isperformedwheneverthereisanindicationofimpairment,exceptfor
goodwillforwhichimpairmenttestingisperformedatleastonceperyear.
negativedeviationsinactualcashflowscomparedtoestimatedcashflows
aswellasnewestimatesthatindicatelowerfuturecashflowsmightresult
inrecognitionofimpairmentcharges.onesourceofuncertaintyrelatedto
futurecashflowsislong-termmovementsinexchangerates.
C2 CritiCal aCCounting estimates and Judgments thepreparationoffinancialstatementsandapplicationofaccounting
standardsofteninvolvemanagement’sjudgmentandtheuseofestimates
andassumptionsdeemedtobereasonableatthetimetheyaremade.
however,otherresultsmaybederivedwithdifferentjudgmentsorusing
differentassumptionsorestimates,andeventsmayoccurthatcouldrequire
amaterialadjustmenttothecarryingamountoftheassetorliabilityaffected.
followingaretheaccountingpoliciessubjecttosuchjudgmentsandthe
keysourcesofestimationuncertaintythattheCompanybelievescouldhave
themostsignificantimpactonthereportedresultsandfinancialposition.
theinformationinthisnoteisgroupedasper:
> keysourcesofestimationuncertainty.
> Judgmentsmanagementhasmadeintheprocessofapplyingthe
Company’saccountingpolicies.
revenue.recognitionKey sources of estimation uncertainty
estimatesarenecessaryinevaluationofcontractualperformanceand
estimatedtotalcontractcostsforassessingwhetheranylossprovisions
aretobemadeorifcustomerswillreachconditionalpurchasevolumes
triggeringcontractualdiscountstobegiven.
Judgments made in relation to accounting policies appliedPartsoftheCompany’ssalesaregeneratedfromlargeandcomplex
customercontracts.managerialjudgmentisappliedregarding,amongother
aspects,conformancewithacceptancecriteriaandiftransferofrisksand
rewardstothebuyerhastakenplacetodetermineifrevenueandcosts
shouldberecognizedinthecurrentperiod,degreeofcompletionandthe
customercreditstandingtoassesswhetherpaymentislikelyornottojustify
revenuerecognition.
trade.and.customer.finance.receivablesKey sources of estimation uncertainty
theCompanymonitorsthefinancialstabilityofitscustomersandthe
environmentinwhichtheyoperatetomakeestimatesregardingthe
likelihoodthattheindividualreceivableswillbepaid.totalallowancesfor
estimatedlossesasofdecember31,2010,wereSek1.1(1.7)billionor1.6
(2.4)percentofgrosstradeandcustomerfinancereceivables.
Creditrisksforoutstandingcustomerfinancecreditsareregularly
assessedaswell,andallowancesarerecordedforestimatedlosses.
inventory.valuationKey sources of estimation uncertainty
inventoriesarevaluedatthelowerofcostandnetrealizablevalue.
estimatesarerequiredinrelationtoforecastedsalesvolumesand
inventorybalances.insituationswhereexcessinventorybalancesare
identified,estimatesofnetrealizablevaluesfortheexcessvolumesare
made.inventoryallowancesforestimatedlossesasofdecember31,2010,
amountedtoSek3.1(3.0)billionor10(12)percentofgrossinventory.
investments.in.joint.ventures.and.associated.companiesKey sources of estimation uncertainty
impairmenttestingisperformedafterinitialrecognitionwheneverthereisan
indicationofimpairment.
atdecember31,2010,theamountofjointventuresandassociated
companiesamountedtoSek9.8(11.6)billion.
ericssonannualreportonform20-f2010|..55

themarketcapitalizationoftheCompanyasperyear-end2010well
exceededthevalueoftheCompany’snetassets.
forfurtherdiscussionongoodwill,seenoteC1,“Significantaccounting
Policies”andC10,“intangibleassets”.estimatesrelatedtoacquired
intangibleassetsarebasedonsimilarassumptionsandrisksasforgoodwill.
atdecember31,2010,theamountofacquiredintellectualproperty
rightsandotherintangibleassetsamountedtoSek43.8(46.1)billion,
includinggoodwillofSek27.2(27.4)billion.theCompanyhasalso
recognizedgoodwillinSt-ericssonofSek1.4(1,3)billion,asdisclosedin
noteC12,“financialassets,non-Current”.animpairmentchargeofSek
0.9(4.3)billionwasrecognizedasapartoftherestructuringprogram.under
thisprogramdecisionsweretakentophaseoutcertainproducts.the
impairmentchargerelatestobalancesfortheseproducts.
Judgments made in relation to accounting policies appliedatinitialrecognitionandsubsequentremeasurement,management
judgmentsaremade,bothforkeyassumptionsandregardingimpairment
indicators.inthepurchasepriceallocationmadeforeachacquisition,the
purchasepriceshallbeassignedtotheidentifiableassets,liabilitiesand
contingentliabilitiesbasedonfairvaluesfortheseassets.anyremaining
excessvalueisreportedasgoodwill.thisallocationrequiresmanagement
judgmentaswellasthedefinitionofcashgeneratingunitsforimpairment
testingpurposes.otherjudgmentsmightresultinsignificantlydifferent
resultsandfinancialpositioninthefuture.
provisions
warranty.provisions
Key sources of estimation uncertainty
Provisionsforproductwarrantiesarebasedoncurrentvolumesofproducts
soldstillunderwarrantyandonhistoricqualityratesformatureproductsas
wellasestimatesandassumptionsonfuturequalityratesfornewproducts
andestimatesofcoststoremedythevariousqualitativeissuesthatmight
occur.totalprovisionsforproductwarrantiesasofdecember31,2010,
amountedtoSek2.5(2.5)billion.
provisions.other.than.warranty.provisions
Key sources of estimation uncertainty
Provisions,otherthanwarrantyprovisions,mainlycompriseamountsrelated
tocontractualobligationsandpenaltiestocustomersandestimatedlosses
oncustomercontracts,restructuring,risksassociatedwithpatentand
otherlitigations,supplierorsubcontractorclaimsand/ordisputes,aswell
asprovisionsforunresolvedincometaxandvalueaddedtaxissues.the
estimatesrelatedtotheamountsofprovisionsforpenalties,claimsorlosses
receivespecialattentionfromthemanagement.atdecember31,2010,
provisionsotherthanwarrantycommitmentsamountedtoSek7.3(9.9)
billion.forfurtherdetailedinformation,seenoteC18,“Provisions”.
Judgments made in relation to accounting policies applied
whetherapresentobligationisprobableornotrequiresjudgment.the
natureandtypeofrisksfortheseprovisionsdifferandmanagement’s
judgmentisappliedregardingthenatureandextentofobligationsin
decidingifanoutflowofresourcesisprobableornot.
pension.and.other.post-employment.benefits
Key sources of estimation uncertainty
accountingforthecostsofdefinedbenefitpensionplansandother
applicablepost-employmentbenefitsisbasedonactuarialvaluations,
relyingonkeyestimatesfordiscountrates,expectedreturnonplanassets,
futuresalaryincreases,employeeturnoverratesandmortalitytables.the
discountrateassumptionsarebasedonratesforhigh-qualityfixed-income
investmentswithdurationsascloseaspossibletotheCompany’spension
plans.expectedreturnsonplanassetsconsiderlong-termhistoricalreturns,
allocationofassetsandestimatesoffuturelong-terminvestmentreturns.
atdecember31,2010,definedbenefitobligationsforpensionsandother
post-employmentbenefitsamountedtoSek28.7(30.7)billionandfairvalue
ofplanassetstoSek25.4(23.2)billion.formoreinformationonestimates
andassumptions,seenoteC17,“Post-employmentbenefits”.
Financial.instruments,.hedge.accounting.and.foreign.exchange.risks
Key sources of estimation uncertainty
foreignexchangeriskinhighlyprobablesalesandpurchasesinfuture
periodsarehedgedusingforeignexchangederivativeinstruments
designatedascash-flowhedges.forecastsarebasedonestimations
offuturetransactions,aforecastisthereforeperdefinitionuncertainto
somedegree.
Judgments made in relation to accounting policies appliedestablishinghighlyprobablesalesandpurchasesvolumesinvolvegathering
andevaluatingsalesandpurchasesestimatesforfutureperiodsaswell
asanalyzingactualoutcomeversusestimatesonaregularbasisinorder
tofulfilleffectivenesstestingrequirementsforhedgeaccounting.Changes
inestimatesofsalesandpurchasesmightresultinthathedgeaccounting
isdiscontinued.
forfurtherinformationregardingrisksinfinancialinstruments,seenote
C20,“financialriskmanagementandfinancialinstruments”.
56|ericssonannualreportonform20-f2010

ericssonannualreportonform20-f2010|..57
> Consumerandbusinessapplications;solutionsfortheconsumer
includeservicedeliveryplatforms,richCommunicationSuite(rCS),
messaging,asocialmediaportal,andlocation-basedservices.
enterprisemarketsolutionsincludeconvergedbusinesscommunication
solutionssuchasericssonbusinessCommunicationSuite(bCS).
brokeringsolutionsfacilitatepaymentanddistributionofcontent.
> businessSupportSystemsincludesrevenuemanagement(Pre-
paid,Post-paid,convergentChargingandbilling),CustomerCare,
Provisioning,devicemanagementandanalytics.
sony.ericsson,thejointventuredeliversinnovativeandfeature-richmobile
phonesandaccessories.theJvformsanessentialpartofourend-to-end
capabilityformobilemultimediaservices.
st-ericsson,thejointventuredevelopssemiconductorsandwireless
platformsforgSm,edge,wCdma,hSPa,td-SCdmaandltetohandset
manufacturers,aswellastomobileoperatorsanddevicemanufacturers.
Sonyericsson’sandSt-ericsson’sresultsarereportedaccordingtothe
equitymethodunder“Shareinearningsofjointventuresandassociated
companies”intheincomestatement.
unallocated
Somerevenues,costs,assetsandliabilitiesarenotidentifiedaspartofany
operatingsegmentandarethereforenotallocated.examplesofsuchitems
arecostsforcorporatestaff,itcostsandgeneralmarketingcosts.
regions
ourregionsareourprimarysaleschannel.theCompanyoperatesworld-
wideandreportsitsoperationsdividedintotenregions.otherincludes
salesofforexampleembeddedmodules,cables,powermodulesaswellas
licensingandiPr.
> northamerica
> latinamerica
> northerneurope&Centralasia
> westernandCentraleurope
> mediterranean
> middleeast
> Sub-Saharanafrica
> india
> China&northeastasia
> Southeastasia&oceania
> other
major.customers
theCompanydoesnothaveanycustomerforwhichrevenuesfrom
transactionshaveexceeded10percentoftheCompany’stotalrevenuesfor
theyears2010,2009or2008.
wederivemostofoursalesfromlarge,multi-yearagreementswith
alimitednumberofsignificantcustomers.outofacustomerbaseof
approximately400,mainlynetworkoperators,the10largestcustomers
accountfor46(42)percentofournetsales.ourlargestcustomeraccounted
forapproximately8(5)percentofsalesin2010.formoreinformation,see
riskfactors,“market,technologyandbusinessrisks”.
C3 segment inFormation
operating.segmentswhendeterminingouroperatingsegments,wehavelookedatwhich
marketsandwhattypeofcustomersourproductsandservicesaimto
attractaswellaswhatdistributionchannelstheyaresoldthrough.we
havealsoconsideredcommonalityregardingtechnology,research
anddevelopment.tobestreflectourbusinessfocusandtofacilitate
comparabilitywithpeers,wereportfiveoperatingsegments:
> networks
> ProfessionalServices
> multimedia
> Sonyericsson
> St-ericsson
networksdeliversproductsandsolutionsformobileandfixedbroadband
access,corenetworks,andtransmission.theofferingincludes:
> radioaccesssolutionsthatinterconnectwithdevicessuchasmobile
phones,notebooksandPCs,supportingallmajorstandardizedmobile
technologies.
> fixedaccesssolutionsforbothfiberandcopper,suchasgPonand
dSl,increasethecustomers’abilitytomodernizefixednetworksto
enableiP-basedserviceswithhighbandwidth.
> iPcorenetworksolutions(switching,routingandcontrol)include
softswitches,iPinfrastructureforedge-andcorerouting,iPmultimedia
Subsystem(imS)andmediagateways.
> transmission/backhaul;microwave(mini-link)andopticaltransmission
solutionsformobileandfixednetworks.
> networkmanagementtools;supportingoperators’managementof
existingnetworksaswellasintroductionofnewnetworkarchitectures,
technologiesandservices.thisincludestoolsforconfiguration,
performancemonitoring,securitymanagement,inventorymanagement
andsoftwareupgrades.
global.services.deliversmanagedservices,consultingandsystems
integration,customersupportandnetworkrolloutservices.theoffering
includes:
> managedservicescomprisesolutionsfornetworkdesignandplanning,
networkoperations(themanagementofday-to-dayoperationsof
customernetworks),fieldoperationsandsitemaintenanceandshared
solutionssuchashostingofplatformsandapplications.
> ConsultingandSystemsintegration;technologyandoperational
consulting,integrationofmulti-vendorequipment,designand
integrationofnewsolutionsandhandlingoftechnologychangeand
transformationprograms,learningservicesandoptimizationservices
ensuringthebestpossibleuserexperience.industry-specificsolutions
forverticalindustriesarealsoincluded.
> Customersupport;staffworld-wideprovidearound-the-clocksupport
andadvicetoensurenetworkuptimeandperformance.
> networkrolloutservices,deployingnewnetworks,modernizingand
expandingexistingnetworks.
multimediaprovidesenablersandapplicationsforoperators.theoffering
includes:
> tvsolutions;asuiteofopen,standards-baseddigitaltvsolutionsin
hd,3gorstandardquality(real-timeandon-demand),combined
withinteractiveservices.theofferingincludesiPtvsolutions,video
compression,on-demandsolutions,contentmanagementsystems,
advertisingandinteractivetvapplicationsforoperators,service
providers,advertisersandcontentproviders.

operating.segments
2010 networksglobal.
servicesmulti-.media
sony.ericsson
st-ericsson
total.segments
unallo-cated
elimi-nations 1) group
Segmentsales 111,459 80,117 10,504 60,118 13,116 275,314 – –73,234 202,080
inter-segmentsales 1,249 6 13 60 3,403 4,731 – –3,463 1,268
net.sales 112,708 80,123 10,517 60,178 16,519 280,045 – –76,697 203,348
operating.income 12,481 6,513 –643 1,523 –3,527 16,347 –805 913 16,455
operatingmargin(%) 11% 8% –6% 3% –21% 6% – – 8%
financialincome 1,047
financialexpenses –1,719
income.after.financial.items 15,783
taxes –4,548
net.income 11,235
other.segment.items
Shareinearningsofjointventuresandassociatedcompanies –64 –17 –2 664 –1,763 –1,182 10 – –1,172
amortization –4,554 –303 –806 –25 –930 –6,618 – 955 –5,663
depreciation –2,600 –555 –144 –731 –1,022 –5,052 – 1,753 –3,299
impairmentlosses –675 –276 –52 – –61 –1,064 – 61 –1,003
reversalsofimpairmentlosses 9 2 1 – – 12 – – 12
restructuringexpenses –3,915 –2,675 –207 –402 –536 –7,735 –17 469 –7,283
gains/lossesfromdivestments 154 53 92 – – 299 59 – 3581) SonyericssonandSt-ericssonareaccountedforinaccordancewiththeequitymethod.thedifferencebetweenwhatisreportedtotheCodmandexternallyiseliminatedinthe
eliminationscolumn.
regions
2010 net.salesnon-current.
assets 3)
northamerica 49,473 7,251
Of which the United States 46,104 6,977
latinamerica 17,882 1,998
northerneurope&Centralasia1)2) 12,171 42,112
western&Centraleurope2) 19,868 8,629
mediterranean 22,628 1,523
middleeast 15,099 84
Sub-Saharanafrica 9,194 51
india 8,626 262
China&northeastasia 25,965 3,795
Of which China 14,633 1,013
Southeastasia&oceania 14,902 351
other1)2) 7,540 –
total 203,348 66,0561) Of which Sweden 4,237 41,6832) Of which EU 43,707 46,563
3) Total non-current assets excluding financial instruments, deferred tax assets, and post-employment benefit assets.
foremployeeinformation,seenoteC29,“informationregardingmembersoftheboardofdirectors,thegroupmanagementandemployees”.
58|ericssonannualreportonform20-f2010

OPERATING sEGmENTs
2009 Networks 1)
Global services 1) multi media
sony Ericsson
sT- Ericsson
Total segments Unallo cated
Elimi-nations 2) Group
Segment sales 113,339 79,038 12,996 71,984 13,535 290,892 – –85,519 205,373
Inter-segment sales 746 82 276 164 5,731 6,999 – –5,895 1,104
Net sales 114,085 79,120 13,272 72,148 19,266 297,891 – –91,414 206,477
Operating income 7,598 3) 6,271 4) 655 –10,820 –2,615 1,089 –855 5,684 5,918
Operating margin (%) 7% 8% 5% –15% –14% 0% – – 3%
Financial income 1,874
Financial expenses –1,549
Income after financial items 6,243
Taxes –2,116
Net income 4,127
Other segment items
Share in earnings of joint ventures and associated companies 37 33 –1 –5,693 –1,762 –7,386 –14 – –7,400
Amortization –2,673 –574 –910 –165 –828 –5,150 – 941 –4,209
Depreciation –2,768 –627 –155 –1,124 –997 –5,671 – 2,121 –3,550
Impairment losses –4,333 3) – –80 – –46 –4,459 – 46 –4,413
Reversals of impairment losses 38 9 2 – – 49 – – 49
Restructuring expenses –8,358 3) –2,434 –385 –1,754 –890 –13,821 –82 1,322 –12,581
Gains/losses from divestments 10 777 4) 41 – 47 875 –32 – 8431) Amounts for 2009 and 2008 have been restated to be consistent with the segment allocation method applied as from 2010.2) Sony Ericsson and ST-Ericsson are accounted for in accordance with the equity method. The difference between what is reported to the CODM and externally is eliminated in the
Eliminations column.3) Including impairment losses related to restructuring activities of SEK 4.3 billion. 4) In Q2 2009, the TEMS business was divested, resulting in a capital gain of SEK 0.8 billion.
REGIONs
2009 Net salesNon-current
assets 3)
North America 23,912 8,359
Of which the United States 21,538 8,100
Latin America 20,025 2,066
Northern Europe & Central Asia 1) 2) 11,981 44,091
Western & Central Europe 2) 22,459 11,713
Mediterranean 25,161 1,352
Middle East 18,250 115
Sub-Saharan Africa 15,341 49
India 15,262 225
China & North East Asia 25,960 988
Of which China 18,455 903
South East Asia & Oceania 20,849 417
Other 1) 2) 7,277 –
Total 206,477 69,3751) Of which Sweden 4,096 43,5742) Of which EU 49,313 49,158
3) Total non-current assets excluding financial instruments, deferred tax assets, and post-employment benefit assets.
For employee information, see Note C29, “Information Regarding Members of the Board of Directors, the Group Management and Employees”.
Ericsson Annual Report on Form 20-F 2010 | 59

OPERATING sEGmENTs
2008 Networks 1)
Global services 1) multi media 2)
sony Ericsson
Total segments Unallo cated
Elimi-nations 3) Group
Segment sales 120,504 70,467 12,614 108,492 312,077 – –108,492 203,585
Inter-segment sales 16 41 5,288 261 5,606 – –261 5,345
Net sales 120,520 70,508 17,902 108,753 317,683 – –108,753 208,930
Operating income 12,540 4,951 –118 –1,094 16,279 –618 591 16,252
Operating margin (%) 10% 7% –1% 0% 5% – – 8%
Financial income 3,458
Financial expenses –2,484
Income after financial items 17,226
Taxes –5,559
Net income 11,667
Other segment items
Share in earnings of joint ventures and associated companies –25 91 1 -503 –436 – – –436
Amortization –3,210 –368 –1,429 –53 –5,060 1 53 –5,006
Depreciation –2,347 –532 –228 –1,138 –4,245 –1 1,138 –3,108
Impairment losses –547 – –19 – –566 – – –566
Reversals of impairment losses 6 1 – – 7 – – 7
Restructuring expenses –4,870 –1,533 –337 –1,692 –8,432 –20 846 –7,606
Gains/losses from divestments 9 –16 992 – 985 113 – 1,0981) Amounts for 2009 and 2008 have been restated to be consistent with the segment allocation method applied as from 2010.2) Multimedia figures include the Mobile Platforms business which from 2009 is part of ST-Ericsson.3) Sony Ericsson is accounted for in accordance with the equity method. The difference between what is reported to the CODM and externally is eliminated in the Eliminations column.
REGIONs
2008 Net salesNon-current
assets 3)
North America 15,538 8,917
Of which the United States 14,132 8,829
Latin America 22,897 1,676
Northern Europe & Central Asia 1) 2) 14,854 47,037
Western & Central Europe 2) 21,502 5,537
Mediterranean 29,559 1,499
Middle East 17,844 70
Sub-Saharan Africa 15,339 54
India 15,204 156
China & North East Asia 22,081 816
Of which China 15,068 688
South East Asia & Oceania 20,978 464
Other 1) 2) 13,134 –
Total 208,930 66,2261) Of which Sweden 8,876 46,4582) Of which EU 57,601 52,945
3) Total non-current assets excluding financial instruments, deferred tax assets, and post-employment benefit assets.
For employee information, see Note C29, “Information Regarding Members of the Board of Directors, the Group Management and Employees”.
60 | Ericsson Annual Report on Form 20-F 2010

C4 net salesnet.sales
2010 2009 2008
Salesofproductsandnetworkrolloutservices 140,222 145,873 150,846
ofwhich:
Delivery-type contracts 140,156 144,908 148,358
Construction-type contracts 66 965 2,488
ProfessionalServicessales 58,529 56,123 48,978
licenserevenues1) 4,597 4,481 9,106
net.sales 203,348 206,477 208,930
exportsalesfromSweden 100,070 94,829 109,2541) theSt-ericssonjointventurewasformedinfebruary2009,figuresfor2008include
licensesrevenuesfrommobilePlatforms.
C5 exPenses by natureexpenses.by.nature
2010 2009 2008
goodsandservices 130,725 124,627 138,298
amortizationanddepreciation 8,962 7,759 8,114
impairmentsandobsolescenceallowances,netofreversals 966 5,637 2,680
employeeremunerations 57,183 54,877 51,297
interestexpenses 1,719 1,549 2,484
taxes 4,548 2,116 5,559
expenses.incurred 204,103 196,565 208,432
less:
inventorychanges1) 8,465 –4,784 3,761
additionstoCapitalizeddevelopment 1,647 1,443 1,409
expenses.charged.to.the.income.statement 193,991 199,906 203,2621) theinventorychangesarebasedonchangesofgrossinventoryvaluespriorto
obsolescenceallowances.
thecostreductionprogram,initiatedinfirstquarter2009,hasbeen
completedbythesecondquarter2010.totalrestructuringchargesin
2010wereSek6.8(11.3)b.Costandcapitalefficiencyremainhighon
thecompanyagendaandefficiencyworkwillcontinuealsoin2011.this
primarilyrelatestoservicedelivery,productdevelopmentandadministration.
restructuringchargesareincludedintheexpensespresentedabove.
restruCturing.Charges.by.FunCtion
2010 2009 2008
Costofsales 3,354 4,180 2,540
r&dexpenses 1,682 6,045 2,648
Sellingandadministrativeexpenses 1,778 1,034 1,572
total.restructuring.charges 6,814 11,259 6,760
C6 other oPerating inCome and exPensesother.operating.inCome.and.expenses
2010 2009 2008
gainsonsalesofintangibleassetsandPP&e 301 193 302
lossesonsalesofintangibleassetsandPP&e –422 –126 –190
gainsonsalesofinvestmentsandoperations 577 962 1,236
lossesonsalesofinvestmentsandoperations –219 –119 –138
Capitalgains/losses,net 237 910 1,210
otheroperatingrevenues 1,766 2,172 1,767
total.other.operating.income.and.expenses 2,003 3,082 2,977
ericssonannualreportonform20-f2010|..61

C8 taxes theCompany’sexpensefor2010wasSek4,548(2,116)millionor28.8
(33.9)percentoftheincomeafterfinancialitems.thetaxratemayvary
betweenyearsdependingonbusinessandgeographymix.thetaxrate
excludingjointventuresandassociatedcompanieswas25.7(25.7)percent
mainlyduetoalowertaxrateonlossesmadebythejointventure.
inCome.taxes.reCognized.in.the.inCome.statement
. 2010 2009 2008
Currentincometaxesfortheyear –4,635 –4,605 –5,574
Currentincometaxesrelatedtopreviousyears –35 441 167
deferredtaxincome/expense(–) 307 661 –297
Sub total –4,363 –3,503 –5,704
Shareoftaxesinjointventuresandassociatedcompanies –185 1,387 145
taxes –4,548 –2,116 –5,559
areconciliationbetweenactualtaxexpensefortheyearandthetheoretical
taxexpensethatwouldarisewhenapplyingstatutorytaxrateinSweden,
26.3percent,onincomebeforetaxesisshowninthetablebelow.
reConCiliation.oF.swedish.inCome.tax..to.the.aCtual.inCome.tax
. 2010 2009 2008
taxrateinSweden(26.3%) –4,150 –1,643 –4,823
effectofforeigntaxrates –405 –812 22
Of which joint ventures and associated companies –467 –550 1
Currentincometaxesrelatedtopreviousyears –35 441 167
recognition/remeasurementoftaxlossesrelatedtopreviousyears –257 8 –169
recognition/remeasurementofdeductibletemporarydifferencesrelatedtopreviousyears 172 267 62
taxeffectofnon-deductibleexpenses –830 –1,155 –986
taxeffectofnon-taxableincome 880 630 327
taxeffectofchangesintaxrates 77 148 –159
taxes –4,548 –2,116 –5,559
C7 FinanCial inCome and exPenses FinanCial.inCome.and.expenses
2010 2009 2008
.Financial.
incomeFinancial.expenses
Financial.income
Financial.expenses
Financial.income
Financial.expenses
Contractualinterestonfinancialassets 811 – 1,287 – 2,938 –
Of which on financial assets at fair value through profit or loss 304 – 814 – 2,282 –
Contractualinterestonfinancialliabilities – –1,315 – –1,616 – –2,023
Of which on financial liabilities at fair value through profit or loss – – – – – –
netgain/losson:
instrumentsatfairvaluethroughprofitorloss1) 295 –206 635 155 322 280
Of which included in fair value hedge relationships – 151 – 155 – –32
availableforsale – – – – – –
loansandreceivables –68 – –53 – 191 –
liabilitiesatamortizedcost – –4 – –2 – –656
otherfinancialincomeandexpenses 9 –194 5 –86 7 –85
total 1,047 –1,719 1,874 –1,549 3,458 –2,4841) excludingnetgainfromoperatingassetsandliabilities,Sek1,528million(netgainofSek2,247millionin2009,netlossofSek4,234millionin2008),reportedasCostofSales.
62|ericssonannualreportonform20-f2010

Changes.in.deFerred.taxes,.net
2010 2009
openingbalance,net 12,057 12,120
recognizedinincomestatement 307 661
recognizedinoCi –1,120 –1,040
acquisitions/disposalsofsubsidiaries –606 186
translationdifferences –472 130
Closing.balance,.net 10,166 12,057
taxeffectsreporteddirectlyinotherComprehensiveincomeamountto
Sek–1,120(–1,040)million,ofwhichactuarialgainsandlossesrelated
topensionsSek–836(173)million,cashflowhedgesSek–183(–1,059)
millionanddeferredtaxongains/lossesonhedgesoninvestmentsinforeign
entitiesSek–101(–154)million.
deferredtaxassetsareonlyrecognizedincountrieswheretheCompany
expectstobeabletogeneratecorrespondingtaxableincomeinthefutureto
benefitfromtaxreductions.
Significanttaxlosscarryforwardsarerelatedtocountrieswithlongor
indefiniteperiodsofutilization,mainlySwedenandtheuS.ofthetotal
deferredtaxassetsfortaxlosscarryforwards,Sek3,537million,Sek
2,222millionrelatetoSwedenwithindefinitetimeofutilization.duetothe
Company’sstrongcurrentfinancialpositionandtaxableincomeduring
2010,ericssonhasbeenabletoutilizepartofitstaxlosscarryforwards
duringtheyear.theassessmentisthatericssonwillbeabletogenerate
sufficientincomeinthecomingyearstoalsoutilizetheremainingparts.
deferredtaxassetsforSonyericssonandSt-ericssonarenotincluded,
astheyareaccountedforinaccordancewiththeequitymethod.Sony
ericssonhasinitsannualreportdeferredtaxassetsofeur574million.the
majorpartofthetaxassetsrelatestotheSwedishcompany.
investments.in.subsidiaries
duetolossesincertainsubsidiarycompanies,thebookvalueofcertain
investmentsinthosesubsidiariesarelessthanthetaxvalueofthese
investments.Sincedeferredtaxassetshavebeenreportedwithrespect
alsotolossesinthesecompanies,andduetotheuncertaintyastowhich
deductionscanberealizedinthefuture,noadditionaldeferredtaxassets
arereported.
tax.loss.CarryForwards.
deferredtaxassetsregardingtaxlosscarryforwardsarereportedtothe
extentthatrealizationoftherelatedtaxbenefitthroughfuturetaxableprofits
isprobablealsowhenconsideringtheperiodduringwhichthesecanbe
utilized,asdescribedbelow.
atdecember31,2010,theavailabletaxlosscarryforwardsamountedto
Sek13,030(14,493)million.thetaxeffectofthesetaxlosscarryforwards
arereportedasanasset.
thefinalyearsinwhichtheselosscarryforwardscanbeutilizedare
showninthefollowingtable:
tax.loss.CarryForwards.year.oF.expiration
year.of.expirationtax.loss.
carryforwardstax..
effect
2011 0 0
2012 32 7
2013 299 80
2014 898 244
2015 498 119
2016orlater 11,303 3,087
total 13,030 3,537
taxlosscarryforwardsforSonyericssonandSt-ericssonarenotincluded,
astheyareaccountedforinaccordancewiththeequitymethod.
deferred.tax.balances
taxeffectsoftemporarydifferencesandtaxlosscarryforwardsare
attributableasshowninthetablebelow:
tax.eFFeCts.oF.temporary.diFFerenCes.and.tax.loss.CarryForwards.
2010 2009
deferred.tax.assets
deferred..tax.liabilities net.balance
deferred..tax.assets
deferred..tax.liabilities net.balance
intangibleassetsandproperty,plantandequipment 543 3,725 359 3,096
Currentassets 3,398 110 2,481 53
Post-employmentbenefits 976 636 852 472
Provisions 2,019 12 2,240 –
equity 781 – 1,901 –
other 3,395 – 4,343 459
losscarryforwards 3,537 – 3,961 –
deferredtaxassets/liabilities 14,649 4,483 16,137 4,080
nettingofassets/liabilities –1,912 –1,912 –1,810 –1,810
net.deferred.tax.balances 12,737 2,571 10,166 14,327 2,270 12,057
ericssonannualreportonform20-f2010|..63
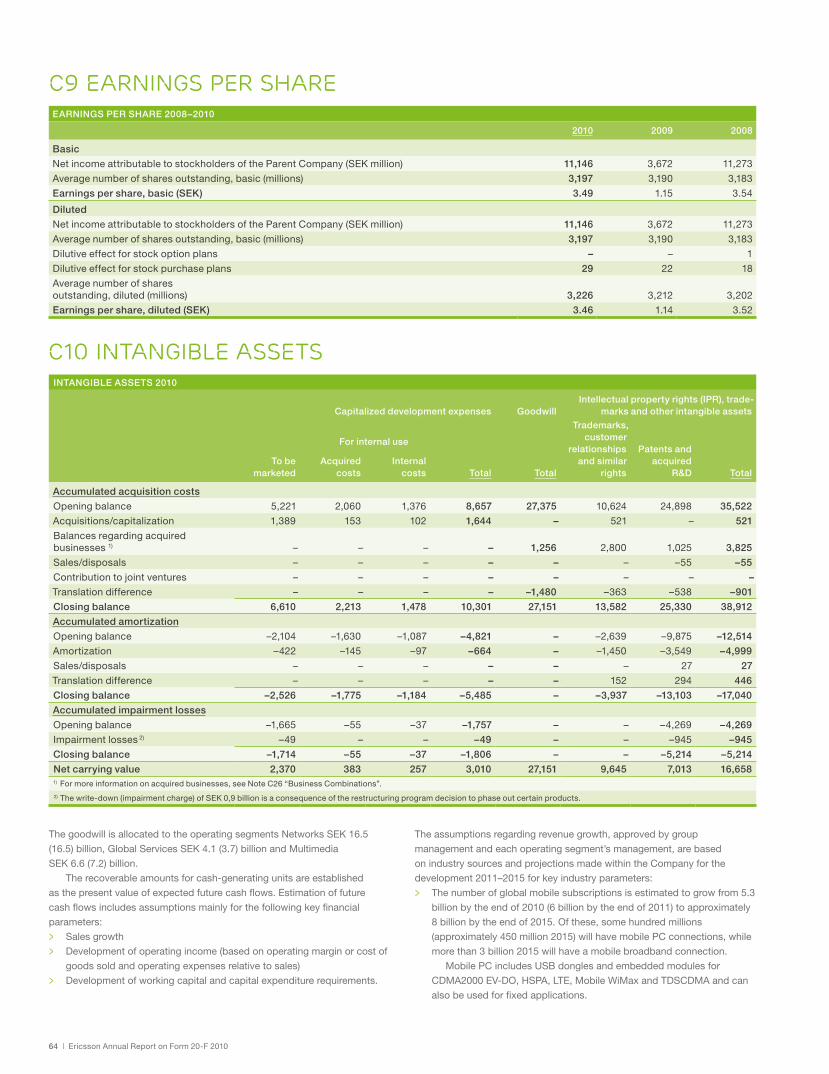
thegoodwillisallocatedtotheoperatingsegmentsnetworksSek16.5
(16.5)billion,globalServicesSek4.1(3.7)billionandmultimedia
Sek6.6(7.2)billion.
therecoverableamountsforcash-generatingunitsareestablished
asthepresentvalueofexpectedfuturecashflows.estimationoffuture
cashflowsincludesassumptionsmainlyforthefollowingkeyfinancial
parameters:
> Salesgrowth
> developmentofoperatingincome(basedonoperatingmarginorcostof
goodssoldandoperatingexpensesrelativetosales)
> developmentofworkingcapitalandcapitalexpenditurerequirements.
theassumptionsregardingrevenuegrowth,approvedbygroup
managementandeachoperatingsegment’smanagement,arebased
onindustrysourcesandprojectionsmadewithintheCompanyforthe
development2011–2015forkeyindustryparameters:
> thenumberofglobalmobilesubscriptionsisestimatedtogrowfrom5.3
billionbytheendof2010(6billionbytheendof2011)toapproximately
8billionbytheendof2015.ofthese,somehundredmillions
(approximately450million2015)willhavemobilePCconnections,while
morethan3billion2015willhaveamobilebroadbandconnection.
mobilePCincludesuSbdonglesandembeddedmodulesfor
Cdma2000ev-do,hSPa,lte,mobilewimaxandtdSCdmaandcan
alsobeusedforfixedapplications.
C10 intangible assetsintangible.assets.2010
Capitalized.development.expenses goodwillintellectual.property.rights.(ipr),.trade-
marks.and.other.intangible.assets
.........For.internal.use
total
trademarks,.customer.
rel.ation.ships.and.similar.
rights
patents.and.acquired.
r&d totalto.be.
marketedacquired.
costsinternal.
costs total
accumulated.acquisition.costs
openingbalance 5,221 2,060 1,376 8,657 27,375 10,624 24,898 35,522
acquisitions/capitalization 1,389 153 102 1,644 – 521 – 521
balancesregardingacquiredbusinesses1) – – – – 1,256 2,800 1,025 3,825
Sales/disposals – – – – – – –55 –55
Contributiontojointventures – – – – – – – –
translationdifference – – – – –1,480 –363 –538 –901
Closing.balance 6,610 2,213 1,478 10,301 27,151 13,582 25,330 38,912
accumulated.amortization
openingbalance –2,104 –1,630 –1,087 –4,821 – –2,639 –9,875 –12,514
amortization –422 –145 –97 –664 – –1,450 –3,549 –4,999
Sales/disposals – – – – – – 27 27
translationdifference – – – – – 152 294 446
Closing.balance –2,526 –1,775 –1,184 –5,485 – –3,937 –13,103 –17,040
accumulated.impairment.losses
openingbalance –1,665 –55 –37 –1,757 – – –4,269 –4,269
impairmentlosses2) –49 – – –49 – – –945 –945
Closing.balance –1,714 –55 –37 –1,806 – – –5,214 –5,214
net.carrying.value 2,370 383 257 3,010 27,151 9,645 7,013 16,6581) formoreinformationonacquiredbusinesses,seenoteC26“businessCombinations”.
2) thewrite-down(impairmentcharge)ofSek0,9billionisaconsequenceoftherestructuringprogramdecisiontophaseoutcertainproducts.
C9 earnings Per share earnings.per.share.2008–2010
2010 2009 2008
basic
netincomeattributabletostockholdersoftheParentCompany(Sekmillion) 11,146 3,672 11,273
averagenumberofsharesoutstanding,basic(millions) 3,197 3,190 3,183
earnings.per.share,.basic.(sek) 3.49 1.15 3.54
diluted
netincomeattributabletostockholdersoftheParentCompany(Sekmillion) 11,146 3,672 11,273
averagenumberofsharesoutstanding,basic(millions) 3,197 3,190 3,183
dilutiveeffectforstockoptionplans – – 1
dilutiveeffectforstockpurchaseplans 29 22 18
averagenumberofsharesoutstanding,diluted(millions) 3,226 3,212 3,202
earnings.per.share,.diluted.(sek) 3.46 1.14 3.52
64|ericssonannualreportonform20-f2010

mobilebroadbandincludesCdma2000ev-do,hSPa,lte,mobile
wimaxandtdSCdma.itincludeshandsets,uSbdonglesand
embeddedmodules.thevastmajorityishandsets.
> fixedbroadbandsubscriptionswillgrowfromaround500million
(470in2010and510in2011)toaround600millioninthesametime
perspective.fixedbroadbandincludesfiber,CableandxdSl
> mobiletrafficvolumeisestimatedtoincrease(around15times
2010–2015,around8times2011–2015),whilethefixedinternettraffic
isestimatedtoincrease(around6times2010–2015,around4times
2011–2015),howeverfromamuchlargerbase.
thedemandformultimediasolutionsisdrivenbytheopportunitiesfor
newtypesofserviceofferingsenabledbyiPtechnologyandhigh-speed
broadband.thereisstrongiPtvsubscribergrowth,rapidgrowthindigital
viewingandon-demandservices.thedevelopmentandbuildoutof
mobilebroadbandnetworksandincreasingnumberofmobilebroadband
subscriptionsdrivesgrowthinserviceintroductionandtraffic.thisputshigh
demandonchargingandpaymentsystems.thebusinessSupportSystems’
growthisdrivenbyintroductionofnewservices,newbusinessmodelsand
priceplans.
thedemandforprofessionalservicesisalsodrivenbyanincreasing
businessandtechnologycomplexity.therefore,operatorsreviewtheir
businessmodelsandlookforvendorpartnersthatcantakeonabroader
responsibility,includingoutsourcingofnetworkoperations.
theassumptionsarealsobaseduponinformationgatheredinthe
Company’slong-termstrategyprocess,includingassessmentsofnew
technology,theCompany’scompetitivepositionandnewtypesofbusiness
andcustomers,drivenbythecontinuedintegrationoftelecom,dataand
mediaindustries.
theimpairmenttestingisbasedonspecificestimatesforthefirstfive
yearsandwithareductionofnominalannualgrowthratetoanaveragegdP
growthof3(3)percentperyearthereafter.theimpairmenttestsforgoodwill
didnotresultinanyimpairment.
anumberofsensitivitytestshavebeenmade,forexampleapplying
lowerlevelsofrevenueandoperatingincome.alsowhenapplyingthese
estimatesnogoodwillimpairmentisindicated.
asperyearend2010,themarketcapitalizationoftheCompanywell
exceededthevalueoftheCompany’snetassets.
anafter-taxdiscountrateof8(12)percenthasforallcashgenerating
unitsbeenappliedforthediscountingofprojectedafter-taxcashflows.
theassumptionsfor2009aredisclosedinnoteC10intheannualreport
of2009.
theCompany´sdiscountingisbasedonafter-taxfuturecashflowsand
after-taxdiscountrates.thisdiscountingisnotmateriallydifferentfroma
discountingbasedonbefore-taxfuturecashflowsandbefore-taxdiscount
rates,asrequiredbyifrS.
innoteC1,“SignificantaccountingPolicies”,andnoteC2,“Critical
accountingestimatesandJudgments”,furtherdisclosuresaregiven
regardinggoodwillimpairmenttesting.
intangible.assets.2009
Capitalized.development.expenses goodwillintellectual.property.rights.(ipr),.trade-
marks.and.other.intangible.assets
........For.internal.use
total
trademarks,.customer.
rel.ation.ships.and.similar.
rights
patents.and.acquired.
r&d totalto.be.
marketedacquired.
costsinternal.
costs total
accumulated.acquisition.costs
openingbalance 5,518 1,821 1,217 8,556 24,877 9,429 20,450 29,879
acquisitions/capitalization 1,045 239 159 1,443 – 602 2 604
balancesregardingdivested/acquiredbusinesses1) – – – – 3,534 811 5,021 5,832
Sales/disposals – – – – –21 –142 – –142
Contributiontojointventures –1,342 – – –1,342 – – – –
translationdifference – – – – –1,015 –76 –575 –651
Closing.balance 5,221 2,060 1,376 8,657 27,375 10,624 24,898 35,522
accumulated.amortization
openingbalance –1,570 –1,562 –1,042 –4,174 – –2,425 –6,853 –9,278
amortization –534 –68 –45 –647 – –360 –3,202 –3,562
Sales/disposals – – – – – 131 – 131
translationdifference – – – – – 15 180 195
Closing.balance –2,104 –1,630 –1,087 –4,821 – –2,639 –9,875 –12,514
accumulated.impairment.losses
openingbalance –1,508 –55 –37 –1,600 – – –14 –14
impairmentlosses2) –157 – – –157 – – –4,255 –4,255
Closing.balance –1,665 –55 –37 –1,757 – – –4,269 –4,269
net.carrying.value 1,452 375 252 2,079 27,375 7,985 10,754 18,7391) during2009,ericssonacquirednortelSek8.7billion.
2) thewrite-down(impairmentcharge)ofSek4.3billionisaconsequenceoftherestructuringprogramdecisiontophaseoutcertainproducts.
ericssonannualreportonform20-f2010|..65

C11 ProPerty, Plant and equiPmentproperty,.plant.and.equipment.2010
real.estate
machinery.and.other.technical.
assets
other.equipment,.tools.and.
installations
Construction.in.process.and.
advance.payments total
accumulated.acquisition.costs
openingbalance 4,217 5,298 18,087 578 28,180
additions 283 411 1,480 1,512 3,686
balancesregardingdivested/acquiredbusinesses 14 4 473 –5 486
Sales/disposals –102 –543 –1,449 –148 –2,242
reclassifications 87 190 817 –1,094 –
translationdifference –261 –356 –832 –29 –1,478
Closing.balance 4,238 5,004 18,576 814 28,632
accumulated.depreciation
openingbalance –1,692 –3,557 –13,058 – –18,307
depreciation –361 –629 –2,309 – –3,299
balancesregardingdivestedbusinesses –2 –3 –297 – –302
Sales/disposals 60 553 1,384 – 1,997
reclassifications 4 9 –13 – –
translationdifference 122 250 598 – 970
Closing.balance –1,869 –3,377 –13,695 – –18,941
accumulated.impairment.losses
openingbalance –45 –91 –131 – –267
impairmentlosses – –6 –3 – –9
reversalsofimpairmentlosses – – 12 – 12
Sales/disposals – – – – –
translationdifference 2 2 3 – 7
Closing.balance –43 –95 –119 – –257
net.carrying.value 2,326 1,532 4,762 814 9,434Contractualcommitmentsfortheacquisitionofproperty,plantandequipmentasperdecember31,2010,amountedtoSek303(236)million.
thereversalofimpairmentlosseshavebeenreportedunderCostofsales.
property,.plant.and.equipment.2009
real.estate
machinery.and.other.technical.
assets
other.equipment,.tools.and.
installations
Construction.in.process.and.
advance.payments total
accumulated.acquisition.costs
openingbalance 4,054 6,131 18,058 795 29,038
additions 362 657 1,699 1,288 4,006
balancesregardingdivested/acquiredbusinesses – –183 –95 –1 –279
Sales/disposals –282 –1,241 –2,184 –148 –3,855
reclassifications 240 151 947 –1,338 –
translationdifference –157 –217 –338 –18 –730
Closing.balance 4,217 5,298 18,087 578 28,180
accumulated.depreciation
openingbalance –1,545 –4,211 –12,967 – –18,723
depreciation –303 –735 –2,512 – –3,550
balancesregardingdivestedbusinesses – 112 191 – 303
Sales/disposals 174 1,188 1,873 – 3,235
reclassifications –75 –51 126 – –
translationdifference 57 140 231 – 428
Closing.balance –1,692 –3,557 –13,058 – –18,307
accumulated.impairment.losses
openingbalance –47 –125 –148 – –320
impairmentlosses – – –1 – –1
reversalsofimpairmentlosses – 33 16 – 49
Sales/disposals – – – – –
translationdifference 2 1 2 – 5
Closing.balance –45 –91 –131 – –267
net.carrying.value 2,480 1,650 4,898 578 9,606Contractualcommitmentsfortheacquisitionofproperty,plantandequipmentasperdecember31,2009,amountedtoSek236(229)million.
thereversalofimpairmentlosseshavebeenreportedunderCostofsales.
66|ericssonannualreportonform20-f2010

eriCsson’s.share.oF.assets,.liabilities.and.inCome.in.Joint.venture.sony.eriCsson.mobile.CommuniCations
2010 2009 2008
non-currentassets 3,622 4,003 3,228
Currentassets 9,904 12,790 21,190
non-currentliabilities 592 130 157
Currentliabilities 10,533 14,675 17,593
net.assets 2,401 1,988 6,668
netsales 30,089 36,074 54,377
incomeafterfinancialitems 705 –5,540 –400
incometaxes –231 1,252 151
net.income 474 –4,288 –249
netincomeattributableto:
StockholdersoftheParentCompany 433 –4,441 –353
non-controllinginterest 41 153 104
assetspledgedascollateral – 182 –
Contingentliabilities 16 17 20
eriCsson’s.share.oF.assets,.liabilities.and.inCome.in.assoCiated.Company.eriCsson.nikola.tesla.d.d..1)
2010 2009 2008
non-currentassets 92 311 394
Currentassets 749 754 695
non-currentliabilities 2 3 6
Currentliabilities 209 240 253
net.assets 630 822 830
netsales 784 994 1,182
incomeafterfinancialitems 17 90 139
incometaxes –1 1 –5
net.income 16 91 134
netincomeattributableto:
StockholdersoftheParentCompany 16 91 134
non-controllinginterest – – –
assetspledgedascollateral 4 5 5
Contingentliabilities 43 151 1721) ericsson’sshareis49.07percent.
allthreecompaniesapplyifrSinthereportingtoericsson.
eriCsson’s.share.oF.assets,.liabilities.and.inCome.in.Joint.venture.st-eriCsson
2010 2009
non-currentassets 6,673 7,238
Currentassets 2,249 3,856
non-currentliabilities 214 129
Currentliabilities 2,519 2,691
net.assets 6,189 8,274
netsales 8,260 9,633
incomeafterfinancialitems –1,762 –1,762
incometaxes 50 136
net.income –1,712 –1,626
netincomeattributableto:
StockholdersoftheParentCompany –1,713 –1,626
non-controllinginterest 1 –
assetspledgedascollateral 3 –
Contingentliabilities – 6
C12 FinanCial assets, non-Currentequity.in.Joint.ventures.and.assoCiated.Companies
.............Joint.ventures .....associated.companies ..total............total
2010 2009 2010 2009 2010 2009
openingbalance 10,317 6,694 1,261 1,294 11,578 7,988
Shareinearnings –1,099 –7,455 –73 55 –1,172 –7,400
taxes –181 1,388 –4 –1 –185 1,387
translationdifference –391 –277 –47 –17 –438 –294
Changeinhedgereserve 22 6 – – 22 6
Pensions –20 21 – – –20 21
dividends – – –119 –70 –119 –70
Contributionstojointventuresandassociatedcompanies – 9,941 1) 138 2 138 9,943
reclassification – –1 –1 –2 –1 –3
Closing.balance 8,648 2) 10,317 2) 1,155 3) 1,261 9,803 11,5781) includingcontributionofSek5.0billionpaidtoStmicroelectronics.2)includinggoodwillforSt-ericssonofSek1,381million(Sek1,341millionin2009).3) goodwill,net,amountstoSek16million(Sek16millionin2009).
ericssonannualreportonform20-f2010|..67

C13 inventoriesinventories
2010 2009
rawmaterials,components,consumablesandmanufacturingworkinprogress 8,509 6,190
finishedproductsandgoodsforresale 11,894 6,621
Contractworkinprogress 9,494 9,907
inventories,.net 29,897 22,718
Contractworkinprogressincludesamountsrelatedtodelivery-type
contracts,servicecontractsandconstruction-typecontractswithongoing
workinprogress.
reportedamountsarenetofobsolescenceallowancesofSek3,090
(2,961)million.
theincreaseininventoriesduring2010isduetohigherlevelofworking
progressintheregions.duringtheyearithasbeenindustrycomponent
shortagesandsupplychainbottlenecks.
movements.in.obsolesCenCe.allowanCes
2010 2009 2008
openingbalance 2,961 3,493 2,752
additions,net 250 562 1,553
utilization –165 –1,297 –1,039
translationdifference –46 2 250
balancesregardingacquired/divestedbusinesses 90 201 –23
Closing.balance 3,090 2,961 3,493
theamountofinventoriesrecognizedasexpenseandincludedinCostof
saleswasSek47,415(52,255)million.
other.FinanCial.assets,.non–Current
other.investments.in.shares.and.
participationsCustomer.finance,.
non-currentderivatives,.non-current
other..financial.assets,...................
non-current
2010 2009 2010 2009 2010 2009 2010 2009
accumulated.acquisition.costs
openingbalance 1,660 1,783 1,232 1,082 843 2,814 3,197 3,557
additions 114 1 3,562 408 – – 683 389
businesscombinations –33 – – – – – – –
disposals/repayments/deductions – –36 –3,322 –258 – – –35 –244
Changeinvalueinfundedpensionplans1) – – – – – – 726 –521
reclassifications – –1 – – – – – –
revaluation – – – – –843 –1,971 – –
translationdifference –134 –87 2 – – – –189 16
Closing.balance 1,607 1,660 1,474 1,232 – 843 4,382 3,197
accumulated.impairment.losses/allowances
openingbalance –1,404 –1,474 –402 –236 – – –1,463 –1,454
impairmentlosses/allowance –75 –3 2 –222 – – –7 –74
businesscombinations – – – – – – – –
disposals/repayments/deductions –26 – 206 56 – – – –
translationdifference 117 73 1 – – – 167 65
Closing.balance –1,388 –1,404 –193 –402 – – –1,303 –1,463
net.carrying.value 219 256 1,281 830 – 843 3,079 1,7341)thisamountincludesassetceiling.forfurtherinformation,seenoteC17,“Post-employmentbenefits”.
note.C9–C10
68|ericssonannualreportonform20-f2010

note.C9–C10
movements.in.allowanCes.For.impairment
.........trade.receivables ...........Customer.finance
. 2010 2009 2008 2010 2009 2008
openingbalance 924 1,471 1,351 772 326 275
additions 282 388 651 25 595 90
utilization –285 –583 –492 –87 –67 –3
reversalofexcessamounts –169 –312 –81 –359 –37 –74
reclassification 33 10 –69 – – –
translationdifference –19 –43 115 –30 –45 38
balancesregardingacquired/divestedbusiness – –7 –4 – – –
Closing.balance 766 924 1,471 321 772 326
aging.analysis.as.per.deCember.31,.2010
of.which.neither.
impaired..nor.past.due
of.which.impaired,.
not.past.due
of.which.past.due.in.the.following.time.intervals
of.which.past.due.and.impaired.in.the.following..
time.intervals
amountless.than.
90.days90.days.or.more
less.than.90.days
90.days.or.more
tradereceivablesexcludingassociatedcompaniesandjointventures 61,609 54,510 52 2,227 1,500 418 2,902
allowancesforimpairmentofreceivables –766 – –16 – – –90 –660
Customerfinance 4,725 3,804 528 62 85 18 228
allowancesforimpairmentofcustomerfinance –321 – –75 – – –18 –228
aging.analysis.as.per.deCember.31,.2009
of.which.neither.
impaired..nor.past.due
of.which.impaired,.
not.past.due
of.which.past.due.in.the.following.time.intervals
of.which.past.due.and.impaired.in.the.following..
time.intervals
amountless.than.
90.days90.days.or.more
less.than.90.days
90.days.or.more
tradereceivablesexcludingassociatedcompaniesandjointventures 67,133 58,727 43 2,962 2,081 774 2,546
allowancesforimpairmentofreceivables –924 – –8 – – –180 –736
Customerfinance 3,046 1,292 1,314 9 1 145 285
allowancesforimpairmentofcustomerfinance –772 – –342 – – –145 –285
C14 trade reCeivables and Customer FinanCetrade.reCeivables.and.Customer.FinanCe
2010 2009
tradereceivablesexcludingassociatedcompaniesandjointventures 61,609 67,133
allowancesforimpairment –766 –924
tradereceivables,net 60,843 66,209
tradereceivablesrelatedtoassociatedcompaniesandjointventures 284 201
trade.receivables,.total 61,127 66,410
Customerfinance 4,725 3,046
allowancesforimpairment –321 –772
Customer.finance,.net. 4,404 2,274
Of which short term 3,123 1,444
Creditcommitmentsforcustomerfinance 3,282 3,027
daysSalesoutstandingwere88(106)indecember,2010.
ericssonannualreportonform20-f2010|..69
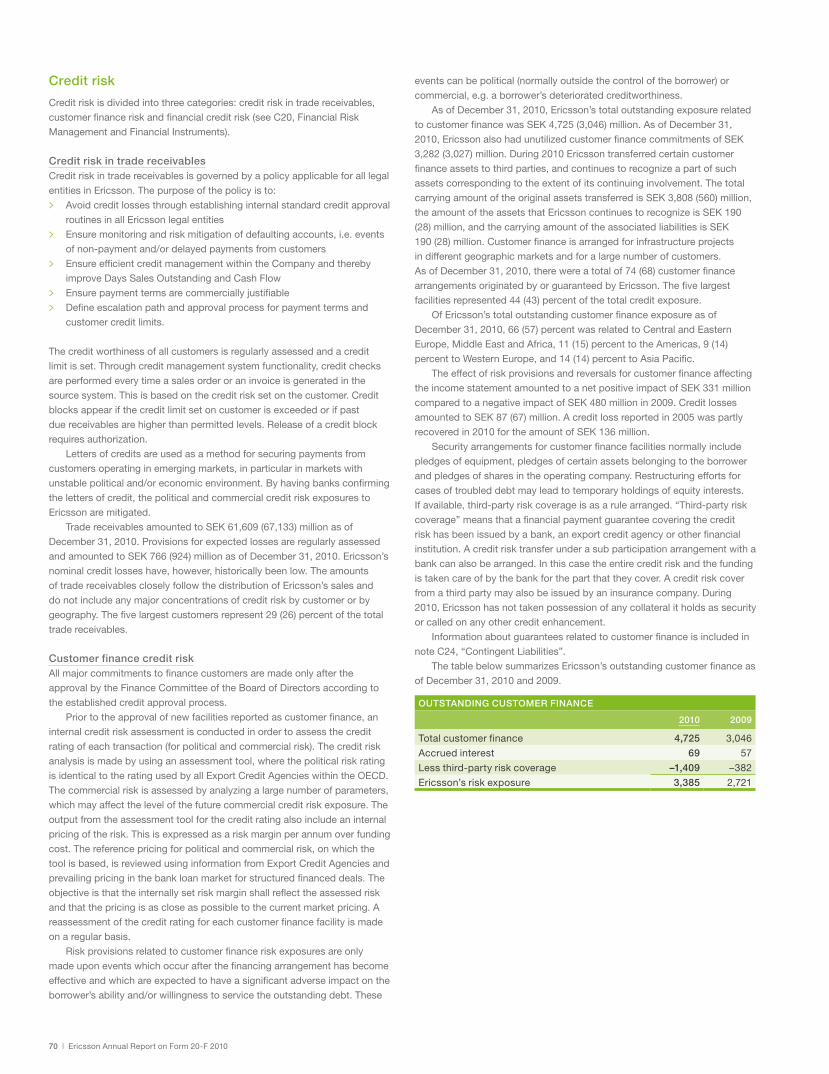
eventscanbepolitical(normallyoutsidethecontroloftheborrower)or
commercial,e.g.aborrower’sdeterioratedcreditworthiness.
asofdecember31,2010,ericsson’stotaloutstandingexposurerelated
tocustomerfinancewasSek4,725(3,046)million.asofdecember31,
2010,ericssonalsohadunutilizedcustomerfinancecommitmentsofSek
3,282(3,027)million.during2010ericssontransferredcertaincustomer
financeassetstothirdparties,andcontinuestorecognizeapartofsuch
assetscorrespondingtotheextentofitscontinuinginvolvement.thetotal
carryingamountoftheoriginalassetstransferredisSek3,808(560)million,
theamountoftheassetsthatericssoncontinuestorecognizeisSek190
(28)million,andthecarryingamountoftheassociatedliabilitiesisSek
190(28)million.Customerfinanceisarrangedforinfrastructureprojects
indifferentgeographicmarketsandforalargenumberofcustomers.
asofdecember31,2010,therewereatotalof74(68)customerfinance
arrangementsoriginatedbyorguaranteedbyericsson.thefivelargest
facilitiesrepresented44(43)percentofthetotalcreditexposure.
ofericsson’stotaloutstandingcustomerfinanceexposureasof
december31,2010,66(57)percentwasrelatedtoCentralandeastern
europe,middleeastandafrica,11(15)percenttotheamericas,9(14)
percenttowesterneurope,and14(14)percenttoasiaPacific.
theeffectofriskprovisionsandreversalsforcustomerfinanceaffecting
theincomestatementamountedtoanetpositiveimpactofSek331million
comparedtoanegativeimpactofSek480millionin2009.Creditlosses
amountedtoSek87(67)million.acreditlossreportedin2005waspartly
recoveredin2010fortheamountofSek136million.
Securityarrangementsforcustomerfinancefacilitiesnormallyinclude
pledgesofequipment,pledgesofcertainassetsbelongingtotheborrower
andpledgesofsharesintheoperatingcompany.restructuringeffortsfor
casesoftroubleddebtmayleadtotemporaryholdingsofequityinterests.
ifavailable,third-partyriskcoverageisasarulearranged.“third-partyrisk
coverage”meansthatafinancialpaymentguaranteecoveringthecredit
riskhasbeenissuedbyabank,anexportcreditagencyorotherfinancial
institution.acreditrisktransferunderasubparticipationarrangementwitha
bankcanalsobearranged.inthiscasetheentirecreditriskandthefunding
istakencareofbythebankforthepartthattheycover.acreditriskcover
fromathirdpartymayalsobeissuedbyaninsurancecompany.during
2010,ericssonhasnottakenpossessionofanycollateralitholdsassecurity
orcalledonanyothercreditenhancement.
informationaboutguaranteesrelatedtocustomerfinanceisincludedin
noteC24,“Contingentliabilities”.
thetablebelowsummarizesericsson’soutstandingcustomerfinanceas
ofdecember31,2010and2009.
outstanding.Customer.FinanCe
2010 2009
totalcustomerfinance 4,725 3,046
accruedinterest 69 57
lessthird-partyriskcoverage –1,409 –382
ericsson’sriskexposure 3,385 2,721
Credit.risk.
Creditriskisdividedintothreecategories:creditriskintradereceivables,
customerfinanceriskandfinancialcreditrisk(seeC20,financialrisk
managementandfinancialinstruments).
Credit.risk.in.trade.receivablesCreditriskintradereceivablesisgovernedbyapolicyapplicableforalllegal
entitiesinericsson.thepurposeofthepolicyisto:
> avoidcreditlossesthroughestablishinginternalstandardcreditapproval
routinesinallericssonlegalentities
> ensuremonitoringandriskmitigationofdefaultingaccounts,i.e.events
ofnon-paymentand/ordelayedpaymentsfromcustomers
> ensureefficientcreditmanagementwithintheCompanyandthereby
improvedaysSalesoutstandingandCashflow
> ensurepaymenttermsarecommerciallyjustifiable
> defineescalationpathandapprovalprocessforpaymenttermsand
customercreditlimits.
thecreditworthinessofallcustomersisregularlyassessedandacredit
limitisset.throughcreditmanagementsystemfunctionality,creditchecks
areperformedeverytimeasalesorderoraninvoiceisgeneratedinthe
sourcesystem.thisisbasedonthecreditrisksetonthecustomer.Credit
blocksappearifthecreditlimitsetoncustomerisexceededorifpast
duereceivablesarehigherthanpermittedlevels.releaseofacreditblock
requiresauthorization.
lettersofcreditsareusedasamethodforsecuringpaymentsfrom
customersoperatinginemergingmarkets,inparticularinmarketswith
unstablepoliticaland/oreconomicenvironment.byhavingbanksconfirming
thelettersofcredit,thepoliticalandcommercialcreditriskexposuresto
ericssonaremitigated.
tradereceivablesamountedtoSek61,609(67,133)millionasof
december31,2010.Provisionsforexpectedlossesareregularlyassessed
andamountedtoSek766(924)millionasofdecember31,2010.ericsson’s
nominalcreditlosseshave,however,historicallybeenlow.theamounts
oftradereceivablescloselyfollowthedistributionofericsson’ssalesand
donotincludeanymajorconcentrationsofcreditriskbycustomerorby
geography.thefivelargestcustomersrepresent29(26)percentofthetotal
tradereceivables.
Customer.finance.credit.riskallmajorcommitmentstofinancecustomersaremadeonlyafterthe
approvalbythefinanceCommitteeoftheboardofdirectorsaccordingto
theestablishedcreditapprovalprocess.
Priortotheapprovalofnewfacilitiesreportedascustomerfinance,an
internalcreditriskassessmentisconductedinordertoassessthecredit
ratingofeachtransaction(forpoliticalandcommercialrisk).thecreditrisk
analysisismadebyusinganassessmenttool,wherethepoliticalriskrating
isidenticaltotheratingusedbyallexportCreditagencieswithintheoeCd.
thecommercialriskisassessedbyanalyzingalargenumberofparameters,
whichmayaffectthelevelofthefuturecommercialcreditriskexposure.the
outputfromtheassessmenttoolforthecreditratingalsoincludeaninternal
pricingoftherisk.thisisexpressedasariskmarginperannumoverfunding
cost.thereferencepricingforpoliticalandcommercialrisk,onwhichthe
toolisbased,isreviewedusinginformationfromexportCreditagenciesand
prevailingpricinginthebankloanmarketforstructuredfinanceddeals.the
objectiveisthattheinternallysetriskmarginshallreflecttheassessedrisk
andthatthepricingisascloseaspossibletothecurrentmarketpricing.a
reassessmentofthecreditratingforeachcustomerfinancefacilityismade
onaregularbasis.
riskprovisionsrelatedtocustomerfinanceriskexposuresareonly
madeuponeventswhichoccurafterthefinancingarrangementhasbecome
effectiveandwhichareexpectedtohaveasignificantadverseimpactonthe
borrower’sabilityand/orwillingnesstoservicetheoutstandingdebt.these
70|ericssonannualreportonform20-f2010

C15 other Current reCeivables other.Current.reCeivables
2010 2009
Prepaidexpenses 2,369 2,403
accruedrevenues 1,850 1,538
advancepaymentstosuppliers 881 776
derivativeswithapositivevalue1) 3,042 1,760
taxes 5,439 4,830
other 3,565 3,839
total 17,146 15,1461)alsoseenoteC20“financialriskmanagementandfinancialinstruments”
C16 equity and other ComPrehensive inCome Capital.stock.2010.Capitalstockatdecember31,2010,consistedofthefollowing:
Capital.stoCk
parent.Companynumber.
of.sharesCapital.
stock
Classashares 261,755,983 1,309
Classbshares 3,011,595,752 15,058
total 3,273,351,735 16,367
thecapitalstockoftheParentCompanyisdividedintotwoclasses:Class
ashares(quotavalueSek5.00)andClassbshares(quotavalueSek5.00).
bothclasseshavethesamerightsofparticipationinthenetassetsand
earnings.Classashares,however,areentitledtoonevotepersharewhile
Classbsharesareentitledtoonetenthofonevotepershare.
atdecember31,2010,thetotalnumberoftreasuryshareswas
73,088,516(78,978,533in2009and61,066,097in2008)Classbshares.
ericssondidnotrepurchasesharesin2010,inrelationtotheStock
PurchasePlan.
reConCiliation.oF.number.oF.shares
number.of.shares Capital.stock
numberofsharesJan1,2010 3,273,351,735 16,367
numberofsharesdec31,2010 3,273,351,735 16,367
forfurtherinformationaboutnumberofshares,seechapterShare
information.
dividend.proposal
theboardofdirectorswillproposetotheannualgeneralmeeting2011a
dividendofSek2.25pershare(2.00in2010and1.85in2009).
additional.paid.in.capital.
relatestopaymentsmadebyownersandincludessharepremiumspaid.
revaluation.of.other.investments.in.shares.and.participations.
thefairvaluereservecomprisesthecumulativenetchangeinthefairvalue
ofavailable-for-salefinancialassetsuntiltheinvestmentsarederecognized
orimpaired.
Cash.flow.hedges
thecashflowhedgereservecomprisestheeffectiveportionofthe
cumulativenetchangeinthefairvalueofcash-flow-hedginginstruments
relatedtohedgedtransactionsthathavenotyetoccurred.
Cumulative.translation.adjustments
thecumulativetranslationadjustmentscomprisesallforeigncurrency
differencesarisingfromthetranslationofthefinancialstatementsofforeign
operations,changesregardingrevaluationofgoodwillinlocalcurrency
aswellasfromthetranslationofliabilitiesthathedgetheCompany’snet
investmentinforeignsubsidiaries.
retained.earnings
retainedearnings,includingnetincomefortheyear,comprisetheearned
profitsoftheParentCompanyanditsshareofnetincomeinsubsidiaries,
jointventuresandassociatedcompanies.actuarialgainsandlossesrelated
topensionsareincludedinretainedearnings.
ericssonannualreportonform20-f2010|..71

equity.and.other.Comprehensive.inCome.2010
2010Capital.
stock
addi.tional.paid.in.capital
revalua-tion.of.other.
invest-ments.in.
shares.and.
partici-pations
Cash.flow.hedges
Cumula-tive.
transla-tion.
adjust-ments
retained.earnings
stock-holders’.
equity
non-control-
ling.interest.
(nCi)total.
equity
January.1,.2010 16,367 24,731 –4 78 663 98,035 139,870 1,157 141,027
net.income
group – – – – – 12,503 12,503 89 12,592
Jointventuresandassociatedcompanies – – – – – –1,357 –1,357 – –1,357
other.comprehensive.income
actuarialgainsandlosses,andtheeffectoftheassetceiling,relatedtopensions
group – – – – – 3,892 3,892 – 3,892
Jointventuresandassociatedcompanies – – – – – –27 –27 – –27
revaluationofotherinvestmentsinsharesandparticipations
fairvalueremeasurement
group – – 7 – – – 7 – 7
Jointventuresandassociatedcompanies – – – – – – – – –
Cashflowhedges
gains/lossesarisingduringtheyear
group – – – 966 – – 966 – 966
Jointventuresandassociatedcompanies – – – 31 – – 31 – 31
reclassificationadjustmentsforgains/lossesincludedinprofitorloss – – – –238 1) – – –238 – –238
adjustmentsforamountstransferredtoinitialcarryingamountofhedgeditems – – – –136 – – –136 – –136
Changesincumulativetranslationadjustments
group – – – – –3,269 2) – –3,269 10 –3,259
Jointventuresandassociatedcompanies – – – – –438 – –438 – –438
taxonitemsrelatingtocomponentsofoCi3) – – –3 –183 –101 4) –833 –1,120 – –1,120
totalothercomprehensiveincome – – 4 440 –3,808 3,032 –332 10 –322
total.comprehensive.income – – 4 440 –3,808 14,178 10,814 99 10,913
transactions.with.owners
Stockissue – – – – – – – – –
Saleofownshares – – – – – 52 52 – 52
StockPurchasePlan
group – – – – – 762 762 – 762
Jointventuresandassociatedcompanies – – – – – – – – –
dividendspaid – – – – – –6,391 –6,391 5) –286 –6,677
businesscombinations – – – – – – – 708 708
december.31,.2010 16,367 24,731 – 518 –3,145 106,636 145,106 1,679 146,7851) Sek1,139millionisrecognizedinnetSales,Sek–586millionisrecognizedinCostofSalesandSek–315millionisrecognizedinr&dexpenses.2)ChangesincumulativetranslationadjustmentsincludechangesregardingrevaluationofgoodwillinlocalcurrencyofSek–1,480million(Sek–1,015millionin2009,Sek2,993millionin
2008),gain/lossfromhedgingactivitiesofforeignentities,Sek385million(Sek586in2009,Sek–660millionin2008)andSek140million(Sek10millionin2009,Sek13millionin2008)ofrealizedgain/lossesnetfromsold/liquidatedcompanies.
3) forfurtherdisclosures,seenoteC8“taxes”.4) deferredtaxongains/lossesonhedgesoninvestmentsinforeignentities.5) dividendspaidpershareamountedtoSek2.25(Sek2.00in2009andSek1.85in2008).
72|ericssonannualreportonform20-f2010

equity.and.other.Comprehensive.inCome.2009
Capital.stock
addi.tional.paid.in.capital
revalua-tion.of.other.
invest-ments.in.
shares.and.
partici-pations
Cash.flow.hedges
Cumula-tive.
transla-tion.
adjust-ments
retained.earnings
stock-holders’.
equity
non-controlling.
interest.(nCi)
total.equity
January.1,.2009 16,232 24,731 –1 –2,356 2,124 100,093 140,823 1,261 142,084
net.income
group – – – – – 9,685 9,685 455 10,140
Jointventuresandassociatedcompanies – – – – – –6,013 –6,013 – –6,013
other.comprehensive.income
actuarialgainsandlosses,andtheeffectoftheassetceiling,relatedtopensions
group – – – – – –633 –633 – –633
Jointventuresandassociatedcompanies – – – – – 28 28 – 28
revaluationofotherinvestmentsinsharesandparticipations
fairvalueremeasurement
group – – –2 – – – –2 – –2
Jointventuresandassociatedcompanies – – – – – – – – –
Cashflowhedges
gains/lossesarisingduringtheyear
group – – – 665 – – 665 – 665
Jointventuresandassociatedcompanies – – – 7 – – 7 – 7
reclassificationadjustmentsforgains/lossesincludedinprofitorloss – – – 3,850 – – 3,850 – 3,850
adjustmentsforamountstransferredtoinitialcarryingamountofhedgeditems – – – –1,029 – – –1,029 – –1,029
Changesincumulativetranslationadjustments
group – – – – –1,013 – –1,013 –54 –1,067
Jointventuresandassociatedcompanies – – – – –294 – –294 – –294
taxonitemsrelatingtocomponentsofoCi – – –1 –1,059 –154 174 –1,040 – –1,040
totalothercomprehensiveincome – – –3 2,434 –1,461 –431 539 –54 485
total.comprehensive.income – – –3 2,434 –1,461 3,241 4,211 401 4,612
transactions.with.owners
Stockissue 135 – – – – – 135 – 135
Saleofownshares – – – – – 75 75 – 75
repurchaseofownshares – – – – – –135 –135 – –135
StockPurchaseandStockoptionPlans
group – – – – – 658 658 – 658
Jointventuresandassociatedcompanies – – – – – – – – –
dividendspaid – – – – – –5,897 –5,897 –421 –6,318
businesscombinations – – – – – – – –84 –84
december.31,.2009 16,367 24,731 –4 78 663 98,035 139,870 1,157 141,027
ericssonannualreportonform20-f2010|..73

equity.and.other.Comprehensive.inCome.2008
Capital.stock
addi.tional.paid.in.capital
revalua-tion.of..other.
invest-ments.in.
shares.and.
partici-pations
Cash..flow.hedges
Cumula-tive.
transla-tion.
adjust-ments
retained.earnings
stock-holders’.
equity
non-controlling.
interest.(nCi)
total.equity
January.1,.2008 16,132 24,731 5 307 –6,345 99,282 134,112 940 135,052
net.income
group – – – – – 11,564 11,564 394 11,958
Jointventuresandassociatedcompanies – – – – – –291 –291 – –291
other.comprehensive.income
actuarialgainsandlossesrelatedtopensions
group – – – – – –4,019 –4,019 – –4,019
Jointventuresandassociatedcompanies – – – – – 4 4 4
revaluationofotherinvestmentsinsharesandparticipations
fairvalueremeasurement
group – – –6 – – – –6 – –6
Jointventuresandassociatedcompanies – – –1 – – – –1 – –1
Cashflowhedges
gains/lossesarisingduringtheyear
group – – – –5,116 – – –5,116 – –5,116
Jointventuresandassociatedcompanies – – – 36 – – 36 – 36
reclassificationadjustmentsforgains/lossesincludedinprofitorloss – – – 1,192 – – 1,192 – 1,192
adjustmentsforamountstransferredtoinitialcarryingamountofhedgeditems – – – – – – – – –
Changesincumulativetranslationadjustments
group – – – – 7,081 – 7,081 233 7,314
Jointventuresandassociatedcompanies – – – – 1,214 – 1,214 – 1,214
taxonitemsrelatingtocomponentsofoCi – – 1 1,225 174 930 2,330 – 2,330
totalothercomprehensiveincome – – –6 –2,663 8,469 –3,085 2,715 233 2,948
total.comprehensive.income – – –6 –2,663 8,469 8,188 13,988 627 14,615
transactions.with.owners
Stockissue 100 – – – – – 100 – 100
Saleofownshares – – – – – 88 88 – 88
repurchaseofownshares – – – – – –100 –100 – –100.
StockPurchaseandStockoptionPlans
group – – – – – 589 589 – 589
Jointventuresandassociatedcompanies – – – – – – – – –
dividendspaid – – – – – –7,954 –7,954 –286 –8,240
businesscombinations – – – – – – – –20 –20
december.31,.2008 16,232 24,731 –1 –2,356 2,124 100,093 140,823 1,261 142,084
74|ericssonannualreportonform20-f2010

C17 Post-emPloyment beneFitsericssonsponsorsanumberofpost-employmentbenefitplansthroughout
theCompany,whichareinlinewithmarketpracticeineachcountry.the
year2010wascharacterizedbytheoverallincreaseindiscountrates,and
ahigherthanexpectedreturnonplanassets.Consequently,theCompany
experiencedadecreaseinthenetpensionliability,andanactuarialgain.
section.one:.amount.recognized.in.the.Consolidated.balance.sheet
amount.reCognized.in.the.Consolidated.balanCe.sheet
sweden. uk euro.zone us other total
2010
definedbenefitobligation(dbo)1) 14,980 5,437 3,163 2,693 2,437 28,710
fairvalueofplanassets2) 12,389 5,691 2,514 2,048 2,793 25,435
deficit/Surplus(+/–) 2,591 –254 649 645 –356 3,275
unrecognizedpastservicecosts – – 5 – –60 –55
Closingbalance 2,591 –254 654 645 –416 3,220
Planswithnetsurplusexcludingassetceiling3) – 290 643 – 939 1,872
provision.for.post-employment.benefits.4) 2,591 36 1,297 645 523 5,092
2009
definedbenefitobligation(dbo)1) 16,150 5,688 3,840 2,781 2,258 30,717
fairvalueofplanassets2) 10,927 5,336 2,406 1,974 2,563 23,206
deficit/Surplus(+/–) 5,223 352 1,434 807 –305 7,511
unrecognizedpastservicecosts – – –14 – –79 –93
Closingbalance 5,223 352 1,420 807 –384 7,418
Planswithnetsurplusexcludingassetceiling3) – 190 29 – 896 1,115
provision.for.post-employment.benefits.4) 5,223 542 1,449 807 512 8,5331) fordetailsondbo,pleaserefertosectionthreeofthisnote.2) fordetailsonplanassets,pleaserefertosectionfourofthisnote.3) Planswithanetsurplus,i.e.whereplanassetsexceeddbo,arereportedasotherfinancialassets,non-current(pleaseseenoteC12“financialassets”).4) PlanswithnetliabilitiesarereportedinthebalancesheetasPost-employmentbenefits,non-current.
Contentsamount.reCognized.in.the..Consolidated.balanCe.sheet. 75
total.pension.expenses.reCognized..in.the.inCome.statement. 76
Change.in.the.deFined.beneFit..obligation,.dbo. 77
Change.in.the.plan.assets. 78
aCtuarial.gains.and.losses..reported.direCtly.in.other..Comprehensive.inCome. 79
aCtuarial.assumptions. 79
inFormation.on.issues.aFFeCting.the..net.pension.liability.For.the.year. 80
ericssonannualreportonform20-f2010|..75

section.two:.total.pension.expenses.recognized.in.the.income.statement
theexpensesforpost-employmentbenefitswithinericssonare
distributedbetweendefinedcontributionplansanddefinedbenefit
plans,withatrendtowarddefinedcontributionplans.
pension.Costs.For.deFined.Contribution.plans.and.deFined.beneFit.plans
sweden. uk euro.zone us other total
2010
Pensioncostfordefinedcontributionplans 1,037 95 433 244 192 2,001
Pensioncostfordefinedbenefitplans1) 762 153 159 30 –14 1,090
total 1,799 248 592 274 178 3,091
totalpensioncostexpressedasapercentageofwagesandsalaries 7.1%
2009
Pensioncostfordefinedcontributionplans 1,686 73 385 124 185 2,453
Pensioncostfordefinedbenefitplans1) 674 66 202 49 144 1,135
total 2,360 139 587 173 329 3,588
totalpensioncostexpressedasapercentageofwagesandsalaries 8.7%
2008
Pensioncostfordefinedcontributionplans 1,607 40 345 114 72 2,178
Pensioncostfordefinedbenefitplans1) 625 156 179 35 33 1,028
total 2,232 196 524 149 105 3,206
totalpensioncostexpressedasapercentageofwagesandsalaries 8.3%1) Seecostdetailsintablebelow.
Cost.details.For.deFined.beneFit.plans.reCognized.in.the.inCome.statement
sweden. uk euro.zone us other total
2010
Currentservicecost 631 161 129 32 140 1,093
interestcost 643 314 182 159 172 1,470
expectedreturnonplanassets –511 –322 –141 –130 –253 –1,357
Pastservicecost – – 33 – 9 42
Curtailments,settlementsandother –1 – –44 –31 –82 –158
total 762 153 159 30 –14 1,090
2009
Currentservicecost 594 205 138 35 131 1,103
interestcost 590 284 194 171 155 1,394
expectedreturnonplanassets –366 –270 –125 –156 –208 –1,125
Pastservicecost – – 5 – 25 30
Curtailments,settlementsandother –144 –153 –10 –1 41 –267
total 674 66 202 49 144 1,135
2008
Currentservicecost 539 186 141 29 122 1,017
interestcost 549 299 160 142 133 1,283
expectedreturnonplanassets –431 –310 –143 –137 –201 –1,222
Pastservicecost – – 11 – 8 19
Curtailments,settlementsandother –32 –19 10 1 –29 –69
total 625 156 179 35 33 1,028
76|ericssonannualreportonform20-f2010
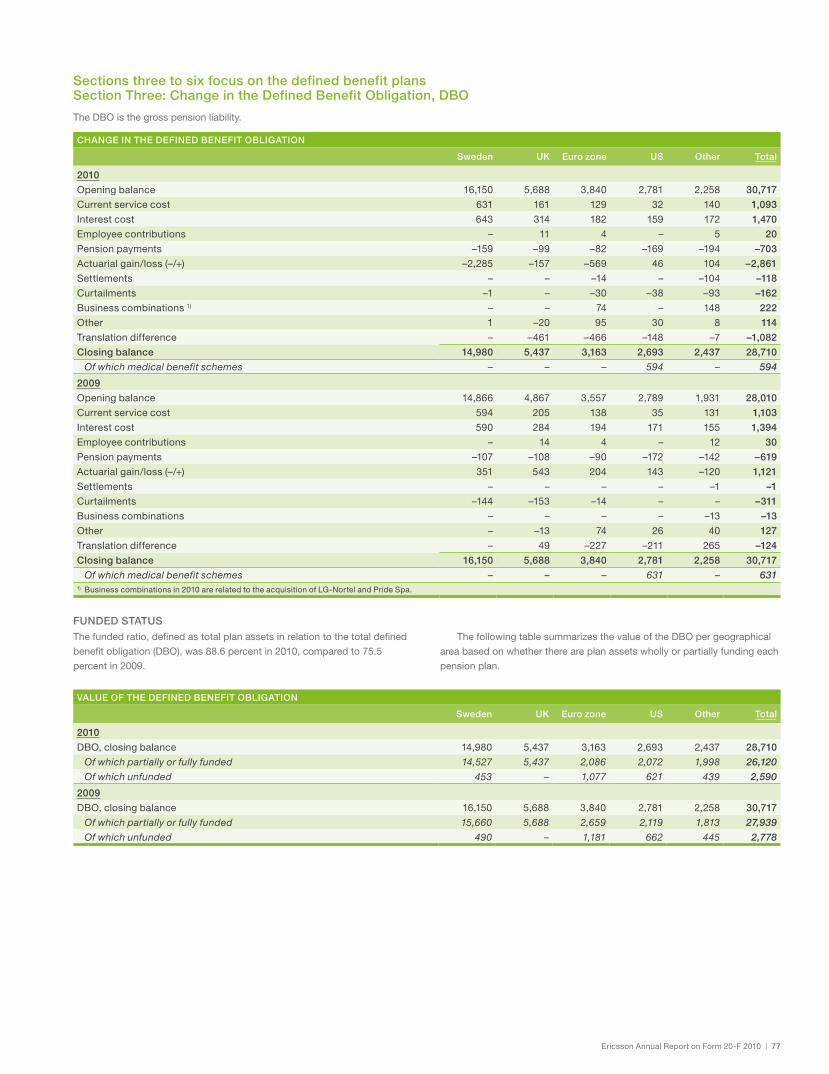
sections.three.to.six.focus.on.the.defined.benefit.plans..section.three:.Change.in.the.defined.benefit.obligation,.dbo
thedboisthegrosspensionliability.
Change.in.the.deFined.beneFit.obligation
sweden. uk euro.zone us other total
2010
openingbalance 16,150 5,688 3,840 2,781 2,258 30,717
Currentservicecost 631 161 129 32 140 1,093
interestcost 643 314 182 159 172 1,470
employeecontributions – 11 4 – 5 20
Pensionpayments –159 –99 –82 –169 –194 –703
actuarialgain/loss(–/+) –2,285 –157 –569 46 104 –2,861
Settlements – – –14 – –104 –118
Curtailments –1 – –30 –38 –93 –162
businesscombinations1) – – 74 – 148 222
other 1 –20 95 30 8 114
translationdifference – –461 –466 –148 –7 –1,082
Closing.balance. 14,980 5,437 3,163 2,693 2,437 28,710
Of which medical benefit schemes – – – 594 – 594
2009
openingbalance 14,866 4,867 3,557 2,789 1,931 28,010
Currentservicecost 594 205 138 35 131 1,103
interestcost 590 284 194 171 155 1,394
employeecontributions – 14 4 – 12 30
Pensionpayments –107 –108 –90 –172 –142 –619
actuarialgain/loss(–/+) 351 543 204 143 –120 1,121
Settlements – – – – –1 –1
Curtailments –144 –153 –14 – – –311
businesscombinations – – – – –13 –13
other – –13 74 26 40 127
translationdifference – 49 –227 –211 265 –124
Closing.balance. 16,150 5,688 3,840 2,781 2,258 30,717
Of which medical benefit schemes – – – 631 – 6311) businesscombinationsin2010arerelatedtotheacquisitionoflg-nortelandPrideSpa.
Funded.statusthefundedratio,definedastotalplanassetsinrelationtothetotaldefined
benefitobligation(dbo),was88.6percentin2010,comparedto75.5
percentin2009.
thefollowingtablesummarizesthevalueofthedbopergeographical
areabasedonwhetherthereareplanassetswhollyorpartiallyfundingeach
pensionplan.
value.oF.the.deFined.beneFit.obligation
sweden. uk euro.zone us other total
2010
dbo,closingbalance 14,980 5,437 3,163 2,693 2,437 28,710
Of which partially or fully funded 14,527 5,437 2,086 2,072 1,998 26,120
Of which unfunded 453 – 1,077 621 439 2,590
2009
dbo,closingbalance 16,150 5,688 3,840 2,781 2,258 30,717
Of which partially or fully funded 15,660 5,688 2,659 2,119 1,813 27,939
Of which unfunded 490 – 1,181 662 445 2,778
ericssonannualreportonform20-f2010|..77

section.Four:.Change.in.the.plan.assets
amajorityofpensionplanshaveassetsmanagedbylocalPension
trustfunds,whosesolepurposeistosecurethefuturepension
paymentstotheemployees.
Change.in.the.plan.assets
sweden. uk euro.zone us other total
2010
openingbalance 10,927 5,336 2,406 1,974 2,563 23,206
expectedreturnonplanassets 511 322 141 130 253 1,357
actuarialgain/loss(+/–) 222 265 105 103 –42 653
employercontributions 729 343 173 58 93 1,396
employeecontributions – 11 3 – 5 19
Pensionpayments – –119 –43 –103 –119 –384
Settlements – – – – –104 –104
businesscombinations1) – – – – 164 164
other – – 53 – –4 49
translationdifference – –467 –324 –114 –16 –921
Closing.balance 12,389 5,691 2,514 2,048 2,793 25,435
2009
openingbalance 8,181 4,407 2,330 2,289 1,830 19,037
expectedreturnonplanassets 366 270 125 156 208 1,125
actuarialgain/loss(+/–) 1,076 342 –136 –253 162 1,191
employercontributions 1,305 387 213 49 122 2,076
employeecontributions – 14 4 – 12 30
Pensionpayments – –122 –75 –115 –125 –437
Settlements – – – – – –
businesscombinations – – –1 – –11 –12
other –1 – 90 – –2 87
translationdifference – 38 –144 –152 367 109
Closing.balance 10,927 5,336 2,406 1,974 2,563 23,2061) businesscombinationsin2010arerelatedtotheacquisitionoflg-nortel.
aCtual.return.on.plan.assets
sweden. uk euro.zone us other total
2010 733 587 246 233 211 2,010
2009 1,441 612 –10 –97 370 2,316
asset.alloCation
sweden. uk euro.zone us other total
2010
equities 4,326 2,028 1,277 1,134 458 9,223
interest-bearingsecurities 7,508 3,207 970 870 1,837 14,392
other 555 456 267 44 498 1,820
total. 12,389 5,691 2,514 2,048 2,793 25,435
Of which Ericsson securities – – – – – –
2009
equities 3,824 1,825 1,094 1,069 394 8,063
interest-bearingsecurities 7,103 2,801 1,051 741 1,747 13,586
other – 710 261 164 422 1,557
total. 10,927 5,336 2,406 1,974 2,563 23,206
Of which Ericsson securities – – – – – –
equityinstrumentsamountto36(35)percentofthetotalassets,interest
bearinginstrumentsamountto57(59)percentofthetotalassets,andother
instrumentsamountto7(6)percentofthetotalassets.
thecontributionstothedefinedbenefitplansfortheupcomingyear
willbebasedonthedevelopmentofthefinancialmarketsaswellasonthe
growthofthepensionliability,andhowthesedevelopmentsaffectthetarget
fundingratiooftheCompany.
refundsfromorreductionsinfuturecontributionstoplanassetsare
recognizediftheyareavailableandfirmlydecided.
78|ericssonannualreportonform20-f2010

aCtuarial.gains.and.losses.reported.direCtly.in.other.Comprehensive.inCome
2010 2009
Cumulativegain/loss(–/+)atbeginningofyear 5,326 5,402
recognizedgain/loss(–/+)duringtheyear –3,514 –70
translationdifference 37 –6
Cumulativegain/loss(–/+)atendofyear 1,849 5,326
SinceJanuary1,2006,ericssonappliesimmediaterecognitionofactuarial
gainsandlossesdirectlyinthestatementofotherComprehensiveincome.
actuarialgainsandlossesmayarisefromeitherachangeinactuarial
assumptionsorindeviationsbetweenestimatedandactualoutcome.
actuarialgains/losses(–/+)relatedtoifriC14“thelimitonadefined
benefitasset,minimumfundingrequirementsandtheirinteraction”,had
aneffectonothercomprehensiveincomeamountingtoSek29millionin
2010(Sek662millionin2009).forfurtherdetails,seenoteC12,“financial
assets,non-Current”.
multi-year.summary
2010 2009 2008 2007 2006
Planassets 25,435 23,206 19,037 20,236 18,395
dbo 28,710 30,717 28,010 25,226 24,612
deficit/Surplus(–/+) –3,275 –7,511 –8,973 –4,990 –6,217
actuarial.gains.and.losses.(–/+)
experience-basedadjustmentsofpensionobligations 177 310 57 –76 232
experience-basedadjustmentsofplanassets –653 –1,191 2,952 59 –358
section.six:.actuarial.assumptions
aCtuarial.assumptions
sweden. uk euro.zone. 1) us.1) other. 1)
2010
discountrate 4.80% 5.40% 5.59% 5.73% 8.55%
expectedreturnonplanassetsfortheyear 4.55% 6.00% 6.27% 7.00% 9.91%
futuresalaryincreases 3.25% 4.50% 2.91% 4.50% 5.70%
inflation 2.00% 3.50% 2.00% 2.50% 3.50%
healthcarecostinflation,currentyear n/a n/a n/a 9.00% n/a
lifeexpectancyafterage65inyears,males 21 22 22 18 19
lifeexpectancyafterage65inyears,females 24 24 25 20 22
2009
discountrate 4.00% 5.60% 5.26% 5.89% 8.91%
expectedreturnonplanassetsfortheyear 4.55% 6.00% 6.31% 7.00% 9.34%
futuresalaryincreases 3.25% 4.90% 2.92% 4.50% 6.77%
inflation 2.00% 3.60% 2.17% 2.50% 3.80%
healthcarecostinflation,currentyear n/a n/a n/a 9.00% n/a
lifeexpectancyafterage65inyears,males 21 21 22 18 18
lifeexpectancyafterage65inyears,females 24 24 25 20 221) weightedaverage.
> actuarialassumptionsareassessedonaquarterlybasis.
> thediscountrateforeachcountryisdeterminedbyreferencetomarket
yieldsonhigh-qualitycorporatebonds.
> theoverallexpectedlong-termreturnonplanassetsisaweighted
averageofeachassetcategory’sexpectedrateofreturn.theexpected
returnoninterest-bearinginvestmentsissetinlinewitheachcountry’s
marketyield.expectedreturnonequitiesisderivedfromeachcountry’s
riskfreeratewiththeadditionofariskpremium.
> Salaryincreasesarepartiallyaffectedbyfluctuationsininflationrate.
> thenetperiodicpensioncostandthepresentvalueofthedbofor
currentandformeremployeesarecalculatedusingtheProjectedunit
Credit(PuC)actuarialcostmethod,wheretheobjectiveistospread
thecostofeachemployee’sbenefitsovertheperiodthattheemployee
worksfortheCompany.
sensitivity.analysis.For.mediCal.beneFit.sChemes
theeffect(inSekmillion)ofaonepercentagepointchangeintheassumed
trendrateofmedicalcostwouldhavethefollowingeffect:
sensitivity.analysis.For.mediCal.beneFit.sChemes
1.percent.increase
1.percentdecrease
netperiodicpost-employmentmedicalcost 3 –3
accumulatedpost-employmentbenefitobligationformedicalcosts 54 –46
section.Five:.actuarial.gains.and.losses.reported.directly.in.other.Comprehensive.income
ericssonannualreportonform20-f2010|..79

section.seven:.information.on.issues.affecting.the.net.pension.liability.for.the.year
sweden
in2010,theSwedishdefinedbenefitobligationhasbeencalculatedusing
adiscountratebasedonyieldsofcoveredbonds,whichishigherthana
discountratebasedonyieldsofgovernmentbonds.theSwedishcovered
bondsareconsideredhighqualitybonds,mainlyaaa-rated,astheyare
securedwithassets,andthemarketforcoveredbondsisconsidereddeep
andliquid,therebymeetingiaS19requirements.
asbefore,ericssonhassecuredthedisability-andsurvivors’pension
partoftheitPPlanthroughaninsurancesolutionwiththeinsurance
companyalecta.althoughthispartoftheplanisclassifiedasamulti-
employerdefinedbenefitplan,ithasnotbeenpossibleforericssontoget
sufficientinformationtoapplydefinedbenefitaccounting,andtherefore,it
hasbeenaccountedforasadefinedcontributionplan.
alectahasacollectivefundingratiowhichisabufferforitsinsurance
commitmentstoprotectagainstfluctuationsininvestmentreturnand
insurancerisks.alecta’stargetratiois140percentandreflectsthefair
valueofalecta’splanassetsasapercentageofplancommitments,then
measuredinaccordancewithalecta’sactuarialassumptions,whichare
differentfromthoseiniaS19.alecta’scollectivefundingratiowas146in
2010(141in2009).
80|ericssonannualreportonform20-f2010

Provisionswillfluctuateovertimedependingonbusinessmix,marketmix
aswellastechnologyshifts.riskassessmentintheongoingbusinessis
performedmonthlytoidentifytheneedfornewadditionsandreversals.
managementusesitsbestjudgmenttoestimateprovisionsbasedonthis
assessment.incertaincircumstances,provisionsarenolongerrequireddue
tomorefavorableoutcomesthananticipated,whichaffecttheprovisions
balanceasareversal.inothercasestheoutcomecanbenegative,andifso,
achargeisrecordedintheincomestatement.
for2010,neworadditionalprovisionsamountingtoSek6.7billion
weremade,andSek1.9billionwerereversed.theactualcashoutlaysfor
2010wasSek7.2billioncomparedwiththeestimatedSek8billion.the
expectedcashoutlaysin2011isapproximatelySek8billion.
ofthetotalprovisions,Sek353(461)millionareclassifiedasnon-
current.formoreinformation,seenoteC1,“Significantaccounting
Policies”andnoteC2,“CriticalaccountingestimatesandJudgments”.
warranty.provisions
warrantyprovisionsarebasedonhistoricqualityratesforestablished
productsaswellasestimatesregardingqualityratesfornewproducts
andcoststoremedythevarioustypesoffaultspredicted.theactualcash
outlaysfor2010wasSek1.5billionandinlinewiththeexpectedSek2
billion.ProvisionsamountingtoSek1.7billionweremadeandduetomore
favorableoutcomesincertaincasesreversalsofSek0.3billionweremade.
thecashoutlaysofwarrantyprovisionsduringyear2011isestimatedto
approximatelySek2billion.
restructuring.provisionsthecostreductionprograminitiatedinthefirstquarter2009wascompleted
bythesecondquarter2010.thetotalrestructuringchargesforthe
programwasSek15.5billionofwhichSek6.9billionwereprovidedforas
restructuringprovisions.inthesecondhalfoftheyearthecostreduction
continuedandprimarilyrelatestocontinuousefficiencyactivitiesinservice
deliveryanddevelopment,transformationinmanagedservicescontracts
andproductrationalization.in2010Sek2.6billion(4.9)inprovisionwere
made.thecashoutlayswere3.3billion(4.2)forthefullyearandSek0.7
billionwererelatedtorestructuringprogramsbefore2009.thecashoutlay
for2011isestimatedtoapproximatelySek3billion.
project.related.provisions
Projectprovisionsrelatetoestimatedlossesononerouscontracts,
includingprobablecontractualpenalties.thecashoutlaysofprojectrelated
provisionswereSek1.5billionandinlinewiththeestimatedSek1billion.
ProvisionsamountingtoSek1.3billionweremadeandSek0.4billionwere
reversedduetoamorefavorableoutcomethanexpected.thecashoutlays
for2011isestimatedtobeapproximatelySek1billion.
other.provisions
otherprovisionsincludeprovisionsfortaxissues,litigations,supplierclaims,
andother.thecashoutlayswasSek0.9billionin2010comparedtothe
estimateofSek2billion.during2010,newprovisionsamountingtoSek
1.0billionweremadeandSek0.9billionwerereversedduringtheyear
duetoamorefavorableoutcome.for2011,theestimatedcashoutlaysis
approximatelySek2billion.
C18 Provisionsprovisions
warranty restruc.turing project.related other total
2010
openingbalance 2,533 4,299 1,694 3,905 12,431
additions 1,743 2,640 1,285 1,046 6,714
reversalofexcessamounts –297 –335 –353 –869 –1,854
Negative effect on Income Statement 4,860
Cashout/utilization –1,466 –3,261 –1,547 –880 –7,154
balancesregardingdivested/acquiredbusinesses 182 – 28 – 210
reclassification –182 176 62 –200 –144
translationdifferences –44 –289 –64 –62 –459
Closing.balance 2,469 3,230 1,105 2,940 9,744
2009
openingbalance 1,931 3,830 3,794 4,795 14,350
additions 2,141 4,920 1,952 2,129 11,142
reversalofexcessamounts –171 –210 –451 –915 –1,747
Negative effect on Income Statement 9,395
Cashout/utilization –1,427 –4,248 –3,459 –1,595 –10,729
balancesregardingdivested/acquiredbusinesses 96 – – 16 112
reclassification 19 146 –128 –595 –558
translationdifferences –56 –139 –14 70 –139
Closing.balance 2,533 4,299 1,694 3,905 12,431
ericssonannualreportonform20-f2010|..81

C19 interest-bearing liabilitiesasofdecember31,2010,ericsson’soutstandinginterest-bearingliabilities
wereSek30.8(32.1)billion.
interest-bearing.liabilities
2010 2009
borrowings,.current
Currentpartofnon-currentborrowings1) 760 684
othercurrentborrowings 3,048 1,440
total.current.borrowings 3,808 2,124
borrowings,.non-current
notesandbondloans 20,646 23,801
otherborrowings,non-current 6,309 6,195
totalnon-currentinterest-bearingliabilities 26,955 29,996
total.interest-bearing.liabilities 30,763 32,1201) includingnotesandbondloansofSek0(0)million.
alloutstandingnotesandbondloansareissuedbytheParentCompany
underitseuromedium-termnote(emtn)program.bondsissuedata
fixedinterestrateareswappedtoafloatinginterestrateusinginterestrate
swaps,resultinginaweightedaverageinterestrateof2.65(2.88)percent
atdecember31,2010.thesebondsarerevaluedbasedonchangesin
benchmarkinterestratesaccordingtothefairvaluehedgemethodology
stipulatediniaS39.
ondecember23,2010,theuSd625millionbilateralloanwithSwedish
exportCreditCorporation(Sek)wasrenegotiatedtoreduceinterest
expenseandtoprolongthematurityprofile.uSd325millionwasamortized.
theremaininguSd300millionwillmaturein2016accordingtotheoriginal
plan.atthesametimeanewbilateralbondofuSd170millionwasissued
withmaturity2020.ConsequentlygrosscashwasreducedbyuSd155
million.thenewbondisnotguaranteedbyekn(theSwedishexportCredit
guaranteeboard).
in2008ericssonsignedasevenyearloanofSek4.0billionwiththe
europeaninvestmentbank.theloansupportsericsson’sr&dactivities
todevelopthenextgenerationofmobilebroadbandtechnologyatsitesin
kista,gothenburgandlinköpinginSweden.
notes.and.bond.loans
issued–maturingnominal.amount Coupon Currency
book.value.(sek.m.)
maturity.date.
(yy-mm-dd)
unrealized.hedge.gain/loss.(incl..in.book.value)
2004–2012 450 2.420% Sek 450 12-12-07 2)
2007–2012 1,000 5.100% Sek 1,035 12-06-29 –35
2007–2012 2,000 2.200% Sek 2,000 12-06-29 3)
2007–2014 375 1.314% eur 3,383 14-06-27 4)
2007–2017 500 5.380% eur 5,059 1) 17-06-27 –571
2009–2013 600 5.000% eur 5,521 1) 13-06-24 –129
2009–2016 300 3.35281% uSd 2,041 16-06-23 5)
2010–2020 170 2.69281% uSd 1,157 20-12-23 6)
total 20,646 –7351) interestrateswapsaredesignatedasfairvaluehedges.2) nextcontractualrepricingdate2011-06-03(semiannual).3) nextcontractualrepricingdate2011-03-25(quarterly).4) nextcontractualrepricingdate2011-03-24(quarterly).5)nextcontractualrepricingdate2011-03-21(quarterly).6)nextcontractualrepricingdate2011-03-18(quarterly).
82|ericssonannualreportonform20-f2010

C20 FinanCial risk management and FinanCial instrumentsericsson’sfinancialriskmanagementisgovernedbyapolicyapprovedby
theboardofdirectors.thefinanceCommitteeoftheboardofdirectorsis
responsibleforoverseeingthecapitalstructureandfinancialmanagement
oftheCompanyandapprovingcertainmatters(suchasacquisitions,
investments,customerfinancecommitments,guaranteesandborrowing)
andiscontinuouslymonitoringtheexposuretofinancialrisks.
ericssondefinesitsmanagedcapitalasthetotalCompanyequity.for
ericsson,arobustfinancialpositionwithastrongequityratio,investment
graderating,lowleverageandampleliquidityisdeemedimportant.this
providesfinancialflexibilityandindependencetooperateandmanage
variationsinworkingcapitalneedsaswellastocapitalizeonbusiness
opportunities.
ericsson’soverallcapitalstructureshouldsupportthefinancialtargets:
togrowfasterthanthemarket,deliverbest-in-classmarginsandgenerate
ahealthycashflow.thecapitalstructureismanagedbybalancingequity,
debtfinancingandliquidityinsuchawaythattheCompanysecurefunding
ofoperationsatareasonablecostofcapital.regularborrowingsare
complementedwithcommittedcreditfacilitiestogiveadditionalflexibilityto
manageunforeseenfundingneeds.ericssonstrivetofinancegrowth,normal
capitalexpendituresanddividendstoshareholdersbygeneratingsufficient
positivecashflowsfromoperatingactivities.
ericsson’scapitalobjectivesare:
> anequityratioabove40percent.
> acashconversionrateabove70percent.
> tomaintainapositivenetcashposition.
> tomaintainasolidinvestmentgraderatingbymoody’sandStandard&
Poor’s.
Capital.obJeCtives.related.inFormation
2010 2009
Capital(Sekbillion) 147 141
equityratio(percent) 52 52
Cashconversionrate(percent) 112 117
Positivenetcash(Sekbillion) 51.3 36.1
Credit.rating
moody’s baa1 baa1
Standard&Poor’s bbb+ bbb+
ericssonhasatreasuryfunctionwiththeprincipalroletoensurethat
appropriatefinancingisinplacethroughloansandcommittedcredit
facilities,toactivelymanagetheCompany’sliquidityaswellasfinancial
assetsandliabilities,andtomanageandcontrolfinancialriskexposuresin
amannerconsistentwithunderlyingbusinessrisksandfinancialpolicies.
hedgingactivities,cashmanagementandinsurancemanagementare
largelycentralizedtothetreasuryfunctioninStockholm.
ericssonalsohasacustomerfinancefunctionwiththemainobjectiveto
findsuitablethird-partyfinancingsolutionsforcustomersandtominimize
recoursetoericsson.totheextentcustomerloansarenotprovideddirectly
bybanks,theParentCompanyprovidesorguaranteesvendorcredits.the
customerfinancefunctionmonitorstheexposurefromoutstandingvendor
creditsandcreditcommitments.
ericssonclassifiesfinancialrisksas:
> foreignexchangerisk
> interestraterisk
> Creditrisk
> liquidityandrefinancingrisk
> marketpriceriskinownandotherequityinstruments.
theboardofdirectorshasestablishedrisklimitsfordefinedexposuresto
foreignexchangeandinterestraterisksaswellastopoliticalrisksincertain
countries.
forfurtherinformationaboutaccountingpolicies,pleaseseenoteC1,
“SignificantaccountingPolicies”.
Foreign.exchange.risk
ericssonisaglobalcompanywithsalesmainlyoutsideSweden.revenues
andcostsaretoalargeextentincurrenciesotherthanSekandtherefore
thefinancialresultsoftheCompanyareimpactedbycurrencyfluctuations.
ericssonreportsthefinancialaccountsinSekandmovementsin
exchangeratesbetweencurrencieswillaffect:
> Specificlineitemssuchasnetsalesandoperatingincome.
> thecomparabilityofourresultsbetweenperiods.
> thecarryingvalueofassetsandliabilities.
> reportedcashflows.
netsalesandoperatingincomeareaffectedbychangesinforeign
exchangeratesfromtwodifferentkindsofexposures,translationexposure
andtransactionexposure.intheoperatingincomeweareprimarilyexposed
totransactionexposurewhichispartiallyaddressedbyhedging.
CurrenCy.exposure
exposure..currency
translation.exposure
transaction.exposure
net..exposure
net.expo.sure,.
percent..of.total
net.sales
uSd 46.6 40.8 87.4 43%
eur 27.4 10.5 37.9 19%
Cny 13.5 –0.3 13.2 6%
JPy 8.8 0.6 9.4 5%
inr 8.3 –1.1 7.2 4%
gbP 7.8 –1.5 6.3 3%
brl 5.9 –0.2 5.7 3%
Sek 41.7 –37.6 4.1 2%
other 42.2 –11.2 31.0 15%
pre-hedge.total 202.2 0.0 202.2 100%
hedge 1.1
total.net.sales 203.3
net.cost
uSd –45.9 –14.7 –60.6 33%
Sek –32.8 –15.3 –48.1 26%
eur –25.8 –4.5 –30.3 16%
Cny –12.8 1.1 –11.7 6%
inr –9.0 3.6 –5.4 3%
brl –5.9 0.7 –5.2 3%
JPy –8.4 4.3 –4.1 2%
gbP –7.5 6.8 –0.7 0%
other –37.9 18.0 –19.9 11%
pre-hedge.total –186.0 0.0 –186.0 100%
hedge –0.8
total.net.cost –186.8
operating.income 16.5
translation.exposure.
translationexposurerelatestoSalesandCostofSalesinforeignentities
whentranslatedintoSekuponconsolidation.theseexposurescannot
beaddressedbyhedging,butastheincomeStatementistranslatedusing
averagerate,theimpactofvolatilityinforeigncurrencyratesisreduced.
ericssonannualreportonform20-f2010|..83

transaCtion.exposuretransactionexposurerelatestoSalesandCostofsalesinnon-reporting
currenciesinindividualgroupcompanies.foreignexchangeriskisasfar
aspossibleconcentratedtoSwedishgroupcompanies,primarilyericsson
ab.Salestoforeignsubsidiariesarenormallydenominatedinthefunctional
currencyofthereceivingentity,andexportsalesfromSwedentoexternal
customersarenormallydenominatedinuSdorotherforeigncurrency.
inordertolimittheexposuretowardexchangeratefluctuationsonfuture
revenuesandcosts,committedandforecastedfuturesalesandpurchases
inmajorcurrenciesarehedged,forthecoming6–12months.
accordingtoCompanypolicy,transactionexposureinsubsidiaries’
balancesheets(i.e.tradereceivablesandpayablesandcustomerfinance
receivables)shouldbefullyhedged,exceptfornon-tradablecurrencies.
grouptreasuryhasamandatetoleaveselectedtransactionexposuresin
subsidiaries’balancesheetsunhedgeduptoanaggregatevalueatrisk
(var)ofSek20million,givenaconfidencelevelof99percentanda1-day
horizon.
foreignexchangeexposuresinbalancesheetitemsarehedgedthrough
offsettingbalancesorderivatives.
asofdecember31,2010,outstandingforeignexchangederivatives
hedgingtransactionexposureshadanetmarketvalueofSek0.6(0.3)
billion.themarketvalueispartlydeferredinthehedgereserveinoCito
offsetthegains/lossesonhedgedfuturesalesinforeigncurrency.
Cash.flow.hedgesthepurposeofhedgingforecastedrevenuesandcostsistoreduce
volatilityintheincomestatement.hedgingisdonebysellingorbuying
foreigncurrenciesagainstthefunctionalcurrencyofthehedgingentityusing
fxforwards.
hedgingisdonebasedonarolling12-monthexposureforecast.
ericssonusesalayeredhedgingapproach,wheretheclosestquartersare
hedgedtoahigherdegreethanlaterquarters.eachconsecutivequarter
isherebyhedgedonseveraloccasionsandiscoveredbyanaggregateof
hedgingcontractsinitiatedatvariouspointsintime,whichsupportsthe
objectiveofreducingvolatilityintheincomestatementfromchangesin
foreignexchangerates.
translation.exposure.in.net.assets
ericssonhasmanysubsidiariesoperatingoutsideSwedenwithother
functionalcurrenciesthanSek.theresultsandnetassetsofsuch
companiesareexposedtoexchangeratefluctuations,whichaffectthe
consolidatedincomestatementandbalancesheetwhentranslatedtoSek.
translationriskrelatedtoforecastedresultsfromforeignoperationscannot
behedged,butnetassetscanbeaddressedbyhedging.
translationexposureinforeignsubsidiariesishedgedaccordingtothe
followingpolicyestablishedbytheboardofdirectors:
translationriskrelatedtonetassetsinforeignsubsidiariesishedgedup
to20percentinselectedcompanies.thetranslationdifferencesreported
inoCiduring2010werenegative,Sek3.7billion,includinghedginggainof
Sek0.4billion.
interest.rate.risk
ericssonisexposedtointerestrateriskthroughmarketvaluefluctuationsin
certainbalancesheetitemsandthroughchangesininterestrevenuesand
expenses.thenetcashpositionwasSek51.3(36.1)billionattheendof
2010,consistingofcash,cashequivalentsandshort-terminvestmentsof
Sek87.2(76.7)billionandinterest-bearingliabilitiesandpost-employment
benefitsofSek35.9(40.7)billion.
ericssonmanagestheinterestrateriskby(i)matchingfixedandfloating
interestratesininterest-bearingbalancesheetitemsand(ii)avoiding
significantfixedinterestrateexposureinericsson’snetcashposition.the
policyisthatinterest-bearingassetsshallhaveanaverageinterestduration
between10and14monthsandinterest-bearingliabilitiesanaverage
interestdurationshorterthan6months,takingderivativeinstruments
intoconsideration.treasuryhasamandatetodeviatefromtheasset
managementbenchmarkgivenbytheboardandtakefxpositionsuptoan
aggregateriskofvarSek30milliongivenaconfidencelevelof99percent
anda1-dayhorizon.
asofdecember31,2010,97(88)percentofericsson’sinterest-bearing
liabilitiesand90(61)percentofericsson’sinterest-bearingassetshad
floatinginterestrates,i.e.interestperiodsoflessthan12months.
whenmanagingtheinterestrateexposure,ericssonusesderivative
instruments,suchasinterestrateswaps.derivativeinstrumentsusedfor
convertingfixedratedebtintofloatingratedebtaredesignatedasfair
valuehedges.
Fair.value.hedgesthepurposeoffairvaluehedgesistohedgethevariabilityinthefairvalueof
fixed-ratedebt(issuedbonds)fromchangesintherelevantbenchmarkyield
curveforitsentiretermbyconvertingfixedinterestpaymentstoafloating
rate(e.g.Stibororlibor)byusinginterestrateswaps(irS).thecredit
risk/spreadisnothedged.
thefixedlegoftheirSismatchedagainstthecashflowsofthehedged
bond.herebythefixed-ratebond/debtisconvertedintoafloating-ratedebt
inaccordancewiththepolicy.
outstanding.derivatives.1)
2010 2009
Fair.value asset liability asset liability
Currency.derivatives
maturitywithin3months 581 1,086 580 500
maturitybetween3and12months 945 505 910 423
maturity1to3years 2 21 90 44
maturity3to5years – – 84 –
maturitymorethan5years – – 3 –
total.currency.derivatives 1,528 1,613 2) 1,666 3) 967
Of which designated in cash flow hedge relations 662 – 96 –
Of which designated in net investment hedge relations – 3 – 62
interest.rate.derivatives
maturitywithin3months 6 28 – –
maturitybetween3and12months 76 61 28 40
maturity1to3years 544 118 49 151
maturity3to5years 184 34 175 40
maturitymorethan5years 705 87 685 58
totalinterestratederivatives 1,515 329. 2) 937 3) 289
Of which designated in fair value hedge relations 862 – 845 –
1) Someofthederivativeswithshortmaturitiesarerecognizedinthebalancesheetasnon-currentduetohedgeaccounting.
2)ofwhichSek902millionisreportedasnon-currentliabilities.3)ofwhichSek843millionisreportedasnon-currentassets.
sensitivity.analysis
ericssonusesthevarmethodologytomeasureforeignexchangeand
interestraterisksinportfoliosmanagedbytreasury.thisstatisticalmethod
expressesthemaximumpotentiallossthatcanarisewithacertaindegree
ofprobabilityduringacertainperiodoftime.forthevarmeasurement,
ericssonhaschosenaprobabilitylevelof99percentanda1-daytime
horizon.thedailyvarmeasurementusesmarketvolatilitiesandcorrelations
basedonhistoricaldailydata(oneyear).
theaveragevarcalculatedfor2010wasfortheinterestratemandate
Sek20.3(14.3)millionandforthetransactionexposuremandateSek9.8
(13.9)million.novar-limitswereexceededduring2010.
84|ericssonannualreportonform20-f2010

repayment.sChedule.oF.long-term.borrowings.1)
nominal..amount..(sek.billion)
Current.maturities.
of.long-.term.debt
notes.and.bonds.
(non-current)
liabilities.to.financial.institutions.
(non-current) total
2011 0.8 – – 0.8
2012 – 3.5 0.9 4.4
2013 – 5.4 – 5.4
2014 – 3.4 – 3.4
2015 – – 4.1 4.1
2016 – 2.0 – 2.0
2017 – 4.5 – 4.5
2018 – – – –
2019 – – – –
2020 – 1.2 – 1.2
total 0.8 20.0 5.0 25.81) excludingfinanceleasesreportedinnoteC27,“leasing”.
debtfinancingismainlycarriedoutthroughborrowingintheSwedishand
internationaldebtcapitalmarkets.
bankfinancingisusedforcertainsubsidiaryfundingandtoobtain
committedcreditfacilities.
Funding.programs.1)
amount utilized unutilized
euromedium-termnoteprogram(uSdmillion) 5,000 3,003 1,997
euroCommercialPaperprogram(uSdmillion) 1,500 – 1,500
SwedishCommercialPaperprogram(Sekmillion) 5,000 – 5,000
long-termCommittedCreditfacility(uSdmillion) 2,000 – 2,000
indianCommercialPaperprogram(inrmillion) 5,000 3,200 1,8001) therearenofinancialcovenantsrelatedtotheseprograms.
atyear-end,ericsson’screditratingsremainedatbaa1(baa1)bymoody’s
andbbb+(bbb+)byStandard&Poor’s,bothconsideredtobe“Solid
investmentgrade”.
Financial.instruments.carried.at.other.than.fair.valuethefairvalueofthemajorityoftheCompany’sfinancialinstrumentsare
determinedbasedonquotedmarketpricesorrates.inthefollowingtables,
carryingamountsandfairvaluesoffinancialinstrumentsthatarecarried
inthefinancialstatementsatotherthanfairvaluesarepresented.assets
valuedatfairvaluethroughprofitorlossshowedanetgainofSek1.1
billion.forfurtherinformationaboutvaluationprinciples,pleaseseenote
C1,“Significantaccountingpolicies”.
FinanCial.instruments.Carried.at.other.than.Fair.value.1)
.Carrying.amount Fair.value
sek.billion 2010 2009 2010 2009
Currentmaturitiesofnon-currentborrowings 0.8 0.7 0.8 0.7
notesandbonds 20.6 23.8 20.5 22.8
otherborrowingsnon-current 5.1 4.8 5.0 4.0
total 26.5 29.3 26.3 27.51) excludingfinanceleasesreportedinnoteC27,“leasing”.
financialinstrumentsexcludedfromthetables,suchastradereceivables
andpayables,arecarriedatamortizedcostwhichisdeemedtobeequal
tofairvalue.whenamarketpriceisnotreadilyavailableandthereis
insignificantinterestrateexposureaffectingthevalue,thecarryingvalueis
consideredtorepresentareasonableestimateoffairvalue.
Financial.credit.risk
financialinstrumentscarryanelementofriskinthatcounterpartsmay
beunabletofulfilltheirpaymentobligations.thisexposurearisesinthe
investmentsincash,cashequivalents,short-terminvestmentsandfrom
derivativepositionswithpositiveunrealizedresultsagainstbanksand
othercounterparties.
ericssonmitigatestheserisksbyinvestingcashprimarilyinwell-rated
securitiessuchastreasurybills,governmentbonds,commercialpapers,
andmortgagecoveredbondswithshort-termratingsofatleasta-1/P-1
andlong-termratingsofaaa.Separatecreditlimitsareassignedtoeach
counterpartinordertominimizeriskconcentration.wehavehadno
sub-primeexposureinourinvestments.allderivativetransactionsare
coveredbyiSdanettingagreementstoreducethecreditrisk.nocredit
losseswereincurredduring2010,neitheronexternalinvestmentsnoron
derivativepositions.
atdecember31,2010,thecreditriskinfinancialcashinstruments
wasequaltotheinstruments’carryingvalue.Creditexposureinderivative
instrumentswasSek3.0(2.6)billion.
liquidity.risk
liquidityriskisthatericssonisunabletomeetitsshort-termpayment
obligationsduetoinsufficientorilliquidcashreserves.
ericssonminimizestheliquidityriskbymaintainingasufficientnet
cashposition.thisismanagedthroughcentralizedcashmanagement,
investmentsinhighlyliquidinterest-bearingsecurities,andbyhaving
sufficientcommittedcreditlinesinplacetomeetpotentialfundingneeds.
forinformationaboutcontractualobligations,pleaseseenoteC32,
“Contractualobligations”.thecurrentcashpositionisdeemedtosatisfyall
short-termliquidityrequirements.
during2010,cashandbankandshort-terminvestmentsincreasedby
Sek10.5billiontoSek87.2billion.theincreasewasmainlyduetopositive
operatingcashflow.
Cash,.Cash.equivalents.and.short-term.investments
remaining.time.to.maturity
(sek.billion)<.3.
months<.1.
year1–5.
years>5.
years total
bankdeposits 29.4 0.1 – – 29.5
type.of.issuer/counterpart
governments – 9.3 23.5 2.9 35.7
banks 1.5 – 4.0 – 5.5
Corporations – – – – –
mortgageinstitutes – – 15.3 1.2 16.5
2010 30.9 9.4 42.8 4.1 87.2
2009 31.8 2.6 34.4 7.9 76.7
theinstrumentsareeitherclassifiedasheldfortradingorasassets
availableforsalewithmaturitylessthanoneyearandthereforeshort-term
investments.Cash,Cashequivalentsandshort-terminvestmentsaremainly
heldinSekunlessoff-setbyeur-funding.
reFinanCing.risk
refinancingriskistheriskthatericssonisunabletorefinanceoutstanding
debtatreasonabletermsandconditions,oratall,atagivenpointintime.
ericssonannualreportonform20-f2010|..85

C22 trade Payables
trade.payables
2010 2009
Payablestoassociatedcompaniesandjointventures 157 1,186
other 24,802 17,678
total 24,959 18,864
C23 assets Pledged as Collateral assets.pledged.as.Collateral
2010 2009
Chattelmortgages 191 167
bankdeposits 467 383
total 658 550
FinanCial.instruments,.Carrying.amounts
sek.billion
Customer.finance.
C14
trade.receiv-
ables..C14
short-term.
invest-ments
Cash.equiva-
lents
borrow-ings.C19
trade.payables.
C22
other.financial.
assets..C12
other.current.receiv-
ables.C15
other.current.
liabilities.C21
other.non-
current.liabilities 2010 2009
assetsatfairvaluethroughprofitorloss – – 56.3 1.5 – – – 3.0 –1.0 –0.9 58.9 56.0
loansandreceivables 4.4 61.1 – 2.1 – – 2.7 – – – 70.3 73.7
availableforsaleassets – – – – – – – – – – – –
financialliabilitiesatamortizedcost – – – – –30.8 –25.0 – – – – –55.8 –51.0
total 4.4 61.1 56.3 3.6 –30.8 –25.0 2.7 3.0 –1.0 –0.9 73.4 78.7
C21 other Current liabilities other.Current.liabilities
2010 2009
incometaxliabilities 2,228 1,890
advancesfromcustomers 5,946 4,903
liabilitiestoassociatedcompaniesandjointventures 115 152
accruedinterest 349 378
accruedexpenses,ofwhich 31,463 29,957
Employee related 10,063 10,137
Supplier related 12,273 10,769
Other 1) 9,127 9,051
deferredrevenues 11,415 8,267
derivativeswithanegativevalue2) 1,039 1,255
other3) 6,050 5,727
total 58,605 52,5291) majorbalancerelatestoaccruedexpensesforcustomerprojects.2) SeenoteC20,“financialriskmanagementandfinancialinstruments”.3) includesitemssuchasvatandwithholdingtaxpayablesandotherpayrolldeductions,
andliabilitiesforgoodsreceivedwhereinvoiceisnotyetreceived.
86|ericssonannualreportonform20-f2010
generatefundstocoveralsosocialsecuritypayments,andthroughthe
purchaseofcalloptionsonericssonClassbshares.forfurtherinformation
aboutthestockoptionandstockpurchaseplans,pleaseseenoteC29,
“informationregardingmembersoftheboardofdirectors,thegroup
managementandemployees”.
market.price.risk.in.own.shares.and.other.listed.equity.investmentsrisk.related.to.our.own.share.priCe.
ericssonisexposedtothedevelopmentofitsownsharepricethrough
stockoptionandstockpurchaseplansforemployeesandsyntheticshare-
basedcompensationstotheboardofdirectors.theobligationtodeliver
shares,orpaycompensationamounts,undertheseplansiscoveredby
holdingericssonClassbsharesastreasurystockandwarrantsforissuance
ofnewericssonClassbsharesorprovisions.anincreaseintheshare
pricewillresultinsocialsecuritycharges,whichrepresentsarisktoboth
incomeandcashflow.thecashflowexposureisfullyhedgedthrough
theholdingofericssonClassbsharesastreasurystocktobesoldto

C24 Contingent liabilitiesContingent.liabilities
2010 2009
Contingentliabilities 875 1,245
total 875 1,245
Contingentliabilitiesassumedbyericssonincludeguaranteesofloansto
othercompaniesofSek25(76)million.ericssonhasSek413(542)million
issuedtoguaranteetheperformanceofathirdparty.allongoinglegaland
taxproceedingshavebeenevaluated,theirpotentialeconomicoutflowsand
probabilityestimatedandnecessaryprovisionsmade.
financialguaranteesforthirdpartyamountedtoSek191(52)millionas
ofdecember31,2010.maturitydateformajorpartoftheissuedguarantees
occursin2019atlatest.
SonyericssonmobileCommunicationsab(SemC)hasbeengranted
termloansandcreditfacilitiesofSek3,157million,ofwhichSek2,106
millionwereutilizedasofdecember31,2010.theparentcompaniesof
ericssonandSonyCorporationhaveissuedguaranteesfortheseterm
loansandcreditfacilitiesona50/50basis,withoutjointresponsibility.
thusericsson’sguaranteedamountismaximumSek1,579million
excludinginterest.asofdecember31,2010,ericsson’spartofthe
outstandingamountisSek1,037millionexcludingaccruedinterestofSek
16million.maturitydatesfortheissuedguaranteesare2011(Sek
1,128million)and2012(Sek451million).SeealsonoteC30,“related
Partytransactions”.
C25 statement oF Cash Flowsinterestpaidin2010wasSek977million(Sek772millionin2009,Sek
1,689millionin2008)andinterestreceivedwasSek1,083million(Sek
1,900millionin2009,Sek2,375millionin2008).taxespaid,including
withholdingtax,wereSek4,808million(Sek4,427millionin2009,Sek
4,274millionin2008).
CashandcashequivalentsincludescashofSek27,231million(Sek
18,372millionin2009)andtemporaryinvestmentsofSek3,633million
(Sek4,426millionin2009).formoreinformationregardingthedisposition
ofcashandcashequivalentsandunutilizedcreditcommitments,seenote
C20,“financialriskmanagementandfinancialinstruments”.
Cashrestrictedduetocurrencyregulationsorotherlegalrestrictions
incertaincountriesamountedtoSek10,836million(Sek8,907millionin
2009,Sek8,197millionin2008).
adJustments.to.reConCile.net.inCome.to.Cash
2010 2009 2008
property,.plant.and.equipment
depreciation 3,299 3,550 3,108
impairmentlosses/reversalsofimpairments –3 –48 –3
total. 3,296 3,502 3,105
intangible.assets
Amortization
Capitalizeddevelopmentexpenses 664 647 1,726
intellectualPropertyrights,brandsandotherintangibleassets 4,999 3,562 3,280
totalamortization 5,663 4,209 5,006
Impairments
Capitalizeddevelopmentexpenses 49 157 562
intellectualPropertyrights,brandsandotherintangibleassets 945 4,255 –
total. 6,657 8,621 5,568
total.depreciation,.amortization.and.impairment.losses.on.property,.plant.and.equipment.and.intangible.assets. 9,953 12,123 8,673
taxes 351 –1,011 1,032
dividendsfromjointventures/associatedcompanies1) 119 70 3,863
undistributedearningsinjointventures/associatedcompanies1) 1,357 6,013 291
gains/lossesonsalesofinvestmentsandoperations,intangibleassetsandPP&e,net2) –237 –910 –1,210
othernon-cashitems2)3) 947 571 1,669
total.adjustments.to.reconcile.net.income.to.cash 12,490 16,856 14,3181)SeealsonoteC12,“financialassets,non-Current”.2)SeealsonoteC26,“businessCombinations”.3)refersmainlytounrealizedforeignexchange,gains/lossesonfinancialinstruments.
aCquisitions/divestments.oF.subsidiaries.and.other.operations
acquisitions divestments
2010
Cashflowfrombusinesscombinations1) –3,286 454
total –3,286 454
2009
Cashflowfrombusinesscombinations1) –9,633 1,239
Capitalcontributiontojointventure –9,688 –
total –19,321 1,239
2008
Cashflowfrombusinesscombinations1) –74 654
otherinvestments – 1,256
total –74 1,9101)SeealsonoteC26,“businessCombinations”.
ericssonannualreportonform20-f2010|..87

C26 business Combinationsacquisitions.and.divestments
aCquisitions
aCquisitions.2008–2010
2010 2009 2008
Cash 3,789 9,633 74
total.consideration 3,789 9,633 74
acquisition-related.costs 67 1) – –
.net.asset.acquired
Cashandcashequivalents 570 5 –
Property,plantandequipment 205 297 –
intangibleassets 3,825 5,832 –209
investmentsinassociates 138 – –
otherassets 2,506 1,235 887
Provision,incl.post-employmentbenefits –390 – –
otherliabilities –3,573 –1,270 278
total.identifiable.net.assets 3,281 6,099 956
.non-controlling.interest –748 – –
goodwill 1,256 3,534 –882
3,789 9,633 741)acquisition-relatedcostsareincludedinSellingandadministrativeexpensesinthe
consolidatedincomestatement.
in2010,ericssonmadeacquisitionswithacashfloweffectamountingto
Sek3,286(9,633)million,primarily:
> inCode:.onSeptember7,2010,theCompanyannouncedthatithad
enteredintoanassetpurchaseagreementtoacquirecertainassets
ofinCode’sStrategyandtechnologygroup,apremierprofessional
servicesfirmprovidingstrategicbusinessandconsultingservices
toleadingnorthamericantelecommunicationsclients.inCodeis
consolidatedbytheCompanyasofSeptember302010.thepurchase
pricewasuSd12milliononacashanddebtfreebasis.theacquisition
includescertainassetsofinCode’sStrategyandtechnologygroup,
includingcontracts,technologyandintellectualproperty,andabout45
employeesthroughouttheuSandCanada.
> lg-nortel:.onapril21,2010,theCompanyannouncedthatithad
enteredintoasharepurchaseagreementtoacquirenortel’smajority
shareholding(50percent+1share)inlg-nortel,thejointventureof
lgelectronicsandnortelnetworks.in2009,lg-nortelgenerated
approximatelyuSd650millionofsales.thepurchasepricewas
uSd234milliononacashanddebtfreebasis.theacquisitionhas
significantlyexpandedtheCompany’sfootprintinthekoreanmarket
andprovidedwellestablishedsaleschannelandstrongr&dcapability
inthecountry.furthermore,theacquisitionprovidedtheCompanywith
anindustrialbaseandtheabilitytobuildnewcustomerrelationships.
Partoftheacquisitioncostsisrecognizedasgoodwillduetothe
competenceacquired.thenon-controllinginterestismeasuredatthe
non-controllinginterest’sshareoftheacquiree’snetassets.netSales
foracquiredlg-nortelbusinessamountedtoapproximatelySek2,322
millionfortheperiodJuly1–december31,2010.iflg-nortelhad
beenconsolidatedfromJanuary1,2010,thesaleshadamountedto
approximatelySek3,820million.theacquiredlg-nortelbusinesshad
apositiveimpactontheresult.approximately1,300employeeswere
transferred.lg-nortelisconsolidatedbytheCompanyasofJune30,
2010,andisincludedinsegmentnetworks.thenewnameofthejoint
ventureislg-ericsson.transactioncostsfortheacquisitionamounted
toSek24million.
> nortel.gsm:.onnovember25,2009,theCompanyannouncedithad
enteredtoacquirecertainassetsoftheCarriernetworksdivisionof
nortelrelatingtonortel’sgSmbusinessintheuSandCanada.nortel
gSmwasconsolidatedbytheCompanyasofmarch31,2010.the
acquisitionfurtherstrengthenstheCompany’sabilitytoservenorth
americasleadingwirelessoperators.thepurchasewasstructuredas
anassetsaleatacashpurchasepriceofuSd79milliononacash
anddebtfreebasis.approximately350employeesweretransferred
toericsson.transactioncostsfortheacquisitionamountedtoSek22
million
> optimi:.ondecember22,2010,theCompanyannouncedthe
acquisitionofoptimiCorporation,auS-Spanishtelecommunications
vendorprovidingproductsandserviceswithinthenetworksoptimization
andmanagementsectortoleadingclientsintelecommunications.the
purchasepricewasuSd99milliononacashanddebtfreebasis.
approximately200highlyskilledprofessionalsandacompleteportfolio
ofservicesandtoolsweretransferredtotheCompany.optimiis
consolidatedbytheCompanyasofdecember31.
> pride:.onJanuary12,2010,theCompanyannouncedithadacquired
allsharesinitalianPrideSpa,aconsultingandsystemsintegration
company,operatinginitaly.thepurchasepricewaseur66million
onacashanddebtfreebasis.theaimwastofurtherstrengthenthe
Company’sofferinginthesystemsintegrationandconsultancyfield.
Prideemploysabout1,000employees.goodwillisrelatedtobusiness
footprintandcriticalmassinSystemsintegration.Prideisconsolidated
bytheCompanyasofJanuary29,2010.
thepreliminarypurchasepriceallocationmadein2009relatedtonortel
Cdmawerefinalized2010withthefollowingeffects:anincreasein
inventoryofSek114million,adecreaseinotherassetsofSek191million,
anincreaseofotherliabilitiesofSek67million,anincreaseofintangible
assetsofSek281mSekandadecreaseingoodwillofSek137million.
nortel.Cdma.business.(2009)
net.assets.acquiredbook.value
Fair.value.adjustments Fair.value
intangible.assets
intellectualpropertyrights – 4,979 4,979
Customerrelationships – 811 811
goodwill – 2,957 2,957
other.assets.and.liabilities
inventory 187 – 187
Property,plantandequipment 261 – 261
otherassets 392 – 392
otherliabilities –1,242 – –1,242
total.purchase.price 8,345
less:
Cashandcashequivalents – – –
Cash.flow.effect 8,345thedeterminationofpurchasepriceallocationandfairvaluesofassetsacquiredandliabilitiesassumedisbasedonpreliminaryappraisal;therefore,thesevaluesmaybesubjecttoadjustments.
88|ericssonannualreportonform20-f2010

aCquisitions.2008–2010
Company descriptiondate.of.announcement
optimi auS-Spanishtelecommunicationsvendorprovidingproductsandserviceswithinthenetworksoptimizationandmanagementsectorwitharound200employees.
dec22,2010
inCode anassetpurchaseagreementofcertainassetswitharound45employees.apremierprofessionalservicesfirmprovidingstrategicbusinessandconsultingservices.
Sep7,2010
lg-nortel nortel’smajorityshareholding(50percent+1share)inlg-nortelwitharound1,300employees. apr21,2010
Pride italianconsultingandsystemsintegrationcompanywitharound1,000employees. Jan12,2010
nortelgSm anassetpurchaseagreementoftheCarriernetworksdivisionofnortelrelatingtogSmbusiness. nov25,2009
nortel anassetpurchaseagreementoftheCarriernetworksdivisionofnortelrelatingtoCdmaandltetechnology.
nov13,2009
elcoteq estonianelectronicsmanufacturingservicecompanywitharound1,200employees. June17,2009
bizitek turkishsystemsintegratorofbusinesssupportsystemswitharound116employees. may28,2009
mobeon Swedishcompany.acquisitionofshares. mar31,2008
divestments.2008–2010
Company description date.of.announcement
efi Saleofericssonfederalinc.(efi). Jan3,2011
temS toolsforairinterfacemonitoringandradionetworkplanning. mar23,2009
enterprise Pbxsolutionsbusiness. may1,2008
ericssonannualreportonform20-f2010|..89
divestmentsin2009refermainlytotemSwithagainamountingtoSek777
millionandacashfloweffectofSek926million.
tems.business.(2009)
net.assets.disposed.of 2009
Property,plantandequipment 5
otherassets 276
otherliabilities –38
243
netgainsfromdivestments 777
less:
Cashandcashequivalents 94
Cash.flow.effect 926
divestments
divestments.2008–2010
2010 2009 2008
Cash 454 1,239 654
.net.assets.disposed.of
Property,plantandequipment 21 5 3
otherassets 372 586 1,005
otherliabilities –183 –38 –456
210 553 552
netgainsfromdivestments 357 780 296
lessCashandcashequivalents –113 –94 –194
Cash.flow.effect 454 1,239 654
in2010,theCompanymadedivestmentswithacashfloweffectamounting
toSek454(1,239)million.
> ericsson.Federal.inc..(eFi):.onJanuary3,2011,theCompany
announcedthecompletionofthesaleof100percentoftheshares
inefitotailwindCapital,aprivateequityfirmfocusedongrowing
companies.efiwasconsolidatedbytheCompanyuntilthesaleinthe
endofdecember2010.thesaleresultedinagainamountingtoSek
216millionandacashfloweffectofSek360million.

C27 leasing leasing.with.the.Company.as.lessee.
assetsunderfinanceleases,recordedasproperty,plantandequipment,
consistof:
FinanCe.leases
2010 2009
acquisition.costs
realestate 1,846 1,942
machinery 3 4
1,849 1,946
accumulated.depreciation
realestate –687 –662
machinery –3 –4
–690 –666
accumulated.impairment.losses
realestate –54 –49
net.carrying.value 1,105 1,231
asofdecember31,2010,futureminimumleasepaymentobligationsfor
leasesweredistributedasfollows:
Future.minimum.lease.payment.obligations.For.leases
Finance.leases.
operating.leases
2011 155 3,097
2012 153 2,586
2013 151 1,754
2014 230 1,203
2015 131 722
2016andlater 997 2,216
total 1,817 11,578
futurefinancecharges1) –568 n/a
Presentvalueoffinanceleaseliabilities 1,249 11,5781)averageeffectiveinterestrateonleasepayablesis5.87percent.
expensesin2010forleasingofassetswereSek3,675(3,839)million,of
whichvariableexpenseswereSek51(0)million.theleasingcontractsvary
inlengthfrom1to18years.
theCompany’sleaseagreementsnormallydonotincludeany
contingentrents.inthefewcasestheyoccur,theyrelatetochargesfor
heatinglinkedtotheoilpriceindex.mostoftheleasesofrealestatecontain
termsofrenewal,givingthecompanytherighttoprolongtheagreementin
questionforapredefinedperiodoftime.allofthefinanceleasesoffacilities
containpurchaseoptions.onlyaverylimitednumberoftheCompany’s
leaseagreementscontainrestrictionsonstockholders’equityorother
meansoffinance.themajoragreementcontainsarestrictionstatingthat
theParentCompanymustmaintainastockholders’equityofatleastSek
25billion.
leases.with.the.Company.as.lessor.
leasingincomemainlyrelatestosubleasingofrealestate.theseleasing
contractsvaryinlengthfrom1to11years.
atdecember31,2010,futureminimumpaymentreceivableswere
distributedasfollows:
Future.minimum.payment.reCeivables
Finance.leases.
operating.leases
2011 – 52
2012 – 13
2013 – 13
2014 – 13
2015 – 13
2016andlater – 38
total – 142
unearnedfinancialincome – n/a
uncollectibleleasepayments – n/a
net.investments.in.financial.leases – n/a
leasingincomein2010wasSek94(181)million.
C28 tax assessment values in sweden tax.assessment.values.in.sweden
2010 2009
landandlandimprovements 65 58
buildings 295 265
total 360 323
90|ericssonannualreportonform20-f2010

C29 inFormation regarding members oF the board oF direCtors, the grouP management and emPloyees
remuneration.to.the.board.of.directors
remuneration.to.members.oF.the.board.oF.direCtors
board.fees
number.of.synthetic.
shares/portion.of.board.fee
value.at.grant.date.of.
synthetic.shares.
allocated.2010
number.of.previously.allocated.synthetic.
shares
net.change..in.value..of.
allocated.synthetic.
shares. 1).Committee..
fees
total.fees.paid.
in.cash 2)..
total.remuneration...
2010. .
a b C (a+b+C).
board.member
michaeltreschow 3,750,000 32,856/75% 2,812,474 79,070.80 948,927 250,000 1,359,509 3) 5,120,910
marcuswallenberg 750,000 2,190/25% 187,464 5,270.80 63,256 125,000 687,500 938,220
Sverkermartin-löf 750,000 0/0% – – – – 750,000 750,000
roxanneS.austin 750,000 6,571/75% 562,478 15,813.60 189,779 250,000 437,500 1,189,756
SirPeterl.bonfield 750,000 2,190/25% 187,464 5,270.80 63,256 250,000 812,500 1,063,220
börjeekholm 750,000 6,571/75% 562,478 15,813.60 189,779 125,000 312,500 1,064,756
ulfJ.Johansson 750,000 6,571/75% 562,478 15,813.60 189,779 350,000 615,357 3) 1,367,613
nancymckinstry 750,000 4,380/50% 374,928 13,097.60 167,534 125,000 500,000 1,042,462
andersnyrén 750,000 0/0% – – – 125,000 875,000 875,000
Carl-henricSvanberg 750,000 4,380/50% 374,928 – –32,631 – 375,000 717,297
hansvestberg – – – – – – – –
michelangelovolpi 750,000 4,380/50% 374,928 – –32,631 – 375,000 717,297
Employee Representatives
monicabergström 4,500 – – – – – 4,500 4,500
PehrClaesson 15,000 – – – – – 15,000 15,000
kristinadavidsson 15,000 – – – – – 15,000 15,000
annaguldstrand 15,000 – – – – – 15,000 15,000
Janhedlund 15,000 – – – – – 15,000 15,000
karinlennartsson 10,500 – – – – – 10,500 10,500
karinÅberg 15,000 – – – – – 15,000 15,000
total 11,340,000 70,089 5,999,618 150,150.80 1,747,048 1,600,000 7,189,866 14,936,533 4)
1)thedifferenceinvalueasofdecember31,2010,comparedtodecember31,2009(forsyntheticsharesallocated2008and2009),andcomparedtograntdate2010(forsyntheticsharesallocated2010).thevalueofsyntheticsharesallocatedin2008and2009includesrespectivelySek1.85andSek2.00pershareincompensationfordividendsresolvedbytheannualgeneralmeetings2009and2010.
2)Committeefeeandcashportionoftheboardfee.3) includinganamountcorrespondingtostatutorysocialchargesinrespectofthepartofthefeethathasbeeninvoicedthroughalimitedliabilitycompany.4) excludingsocialsecuritychargesintheamountofSek3,077,266
Comments.to.the.table
> theChairmanoftheboardwasentitledtoaboardfeeof
Sek3,750,000andafeeofSek125,000foreachboardcommittee
onwhichheserved.
> theotherdirectorsappointedbytheannualgeneralmeetingwere
entitledtoafeeofSek750,000each.inaddition,eachnon-employed
directorservingonaboardcommitteereceivedafeeofSek125,000
foreachcommittee.however,theChairmanoftheauditCommittee
receivedafeeofSek350,000andtheothernon-employedmembersof
theauditCommitteereceivedafeeofSek250,000each.
> membersoftheboard,whoarenotemployeesoftheCompany,have
notreceivedanyremunerationotherthanthefeesandsyntheticshares
asabove.noneofthedirectorshaveenteredintoaservicecontract
withtheParentCompanyoranyofitssubsidiaries,providingfor
terminationbenefits.
> membersanddeputymembersoftheboardwhoareericsson
employeesreceivednoremunerationorbenefitsotherthantheir
entitlementsasemployees.however,afeeofSek1,500perattended
boardmeetingwaspaidtoeachemployeerepresentativeontheboard
andtheirdeputies.
> accordingtonewrulesithasbeenpossibleforboardmembersfulfilling
certaincriteriatoinvoicetheamountoftheboardandCommittee
fee.theboardmemberisallowedtoaddtotheinvoiceanamount
correspondingtosocialcharges.thesocialchargesthusincludedinthe
Contentsremuneration.to.the.board..oF.direCtors.. 91
remuneration.to.the.group..management. 92
long-term.variable.remuneration. 93
employee.numbers,.wages..and.salaries. 96
ericssonannualreportonform20-f2010|..91

weighedaveragepriceforsharesofClassbduringthefivetrading
daysimmediatelyfollowingthepublicationoftheyear-endfinancial
statement.
Syntheticshareswereallocatedtomembersoftheboardforthefirst
time2008,onequaltermsandconditionsasresolved2009and2010.
Paymentbasedonsyntheticsharesmaythusoccurforthefirsttimein
2013withrespecttothesyntheticsharesallocated2008.thevalueof
alloutstandingsyntheticsharesfluctuatesinlinewiththemarketvalue
ofericsson’sClassbshareandmaydifferfromyeartoyearcompared
totheoriginalvalueontheirrespectivegrantdates.thechangeinvalue
oftheoutstandingsyntheticsharesisestablishedeachyearandaffects
thetotalrecognizedcoststhatyear.asperdecember31,2010thetotal
numberofsyntheticsharesundertheprogramsis220,239.80andthe
totalaccounteddebtisSek17,649,112.
remuneration.to.the.group.management
remuneration.Costs.
thetotalremunerationtothePresidentandCeoandtoothermembersof
thegroupmanagement,hereafterpresentedastheexecutiveleadership
team(elt)includesfixedsalary,short-termandlong-termvariable
remuneration,pensionandotherbenefits.theseremunerationelementsare
basedontheguidelinesforremunerationandotheremploymentconditions
forseniormanagementasapprovedatagm2010,seetheapproved
guidelinesinsection“2010remunerationPolicy”.
invoicedamountarenothigherthanthegeneralpayrolltaxthatwould
otherwisehavebeenpaidbytheCompany.theentireamount,e.g.the
cashportionoftheboardfeeandthecommitteefee,includingsocial
charges,constitutestheinvoicedboardfee
> theannualgeneralmeeting2010resolvedthatnon-employeddirectors
maychoosetoreceivetheboardfee,(i.e.exclusiveofcommitteefee)
asfollows:i)25percentoftheboardfeeincashand75percentinthe
formofsyntheticshares,withavaluecorrespondingto75percentof
theboardfeeatthetimeofallocation,ii)50percentincashand50
percentintheformofsyntheticshares,oriii)75percentincashand25
percentintheformofsyntheticshares.directorsmayalsochoosenotto
participateinthesyntheticshareprogramandreceive100percentofthe
boardfeeincash.Committeefeesarealwayspaidincash.
thenumberofsyntheticsharesisbasedonavolume-weighed
averageofthemarketpriceofericssonClassbsharesonthenaSdaq
omxStockholmexchangeduringthefivetradingdaysimmediately
followingthepublicationofericsson’sinterimreportforthefirstquarter
of2010:Sek85.60.thenumberofsyntheticsharesisroundeddownto
thenearestwholenumberofshares.
thesyntheticsharesarevestedduringthedirectors’termofoffice
andtherighttoreceivepaymentwithregardtotheallocatedsynthetic
sharesoccursafterthepublicationoftheCompany’syear-endfinancial
statementduringthefifthyearfollowingtheannualgeneralmeeting
whichresolvedonthesyntheticshareprogram,i.e.in2015.
theamountpayableshallbedeterminedbasedonthevolume-
remuneration.Costs.inCurred.during.2010.For.the.president.and.Ceo.and.other.members.oF.exeCutive.leadership.team
sek the.presidentother.members..
of.elt total.2010 total.2009
Salary 12573789 84697698 97.271.487 61653309
Provisionsforannualvariableremunerationearned2010tobepaid2011 6737556 26592809 33.330.365 21364557
long-termvariableremunerationprovision 1253262 6467584 7.720.846 3172351
Pensioncosts 5586760 24994073 30.580.833 47573897
otherbenefits 80962 4142484 4.223.446 2423437
Socialchargesandtaxes 7842186 30246918 38.089.103 36674431
total. 34.074.515 177.141.565 211.216.080 172.861.982
Comments.to.the.table > asofJanuary1,2010,hansvestbergwasappointedPresidentand
Ceo.
> during2010,thereweretwoexecutivevicePresidents,appointedbythe
boardofdirectors.noneofthemhasactedasdeputytothePresident
andCeoduringtheyear.theexecutivevicePresidentsareincludedin
thegroup“othermembersofelt”.
> thegroup“othermembersofelt”comprisesthefollowingpersons:
Janfrykhammar,Johanwibergh,Janwäreby,magnusmandersson,
Cesareavenia,Carlolofblomqvist,håkaneriksson,douglasgilstrap,
henrySténson,maritahellberg(uptoJune30),torbjörnPossne(upto
September30),rimaqureshi(fromfebruary1),matsh.olsson(from
february8),angelruiz(fromfebruary8)andbinaChaurasia(from
november15).
> includedin“salary”forthePresidentandCeoisvacationpayanda
one-offcostofSek2millioninconnectionwithchangingthetermsand
conditionsofthePresidentandCeo’slong-termvariableremuneration
arrangements2010.
> theelthasasignificantlydifferentcompositioncomparedto2009,with
morediversityastonationalities,genderandexperience,bothonlocal
contractsaswellasexpatriatecontracts.tobeabletoattractandretain,
decisionsonlong-termcompensationcommitmentshavebeenmade
during2010,costforthesecommitmentsareincludedinsalaryforother
membersofelt.for2009therewerenosuchcommitments.
> thesalarystatedinthetableforothermembersoftheeltincludes
vacationpaypaidduring2010aswellasothercontractedcompensation
whichwerepaidduring2010orprovisionedfor2010.deferredsalary,
earned2010tobepaid12monthsorlaterafterperiodendamountsto
Sek6,097,404.
> “long-termvariableremunerationprovisions”referstothe
compensationcostsduring2010foralloutstandingshare-basedplans.
foradescriptionofcompensationcost,includingaccountingtreatment,
seenoteC1,“SignificantaccountingPolicies”,sectionShare-based
compensationtoemployeesandtheboardofdirectors.
> forthePresidentandCeoandothermembersofeltemployedin
Swedenasupplementaryplanisappliedinadditiontotheoccupational
pensionplanforsalariedstaffontheSwedishlabormarket(itP)with
pensionfrom60years.thesepensionplansarenotconditionalupon
futureemploymentatericsson.
> ericsson’scommitmentsforbenefitbasedpensionsperdecember31,
2010,underiaS19amountedtoSek5,177,173forthePresidentand
CeowhichincludesitPplanandtemporarydisabilityandsurvivor’s
pension.forothermembersofelttheCompany’scommitments
amountedtoSek45,368,650ofwhichSek35,087,673referstothe
92|ericssonannualreportonform20-f2010
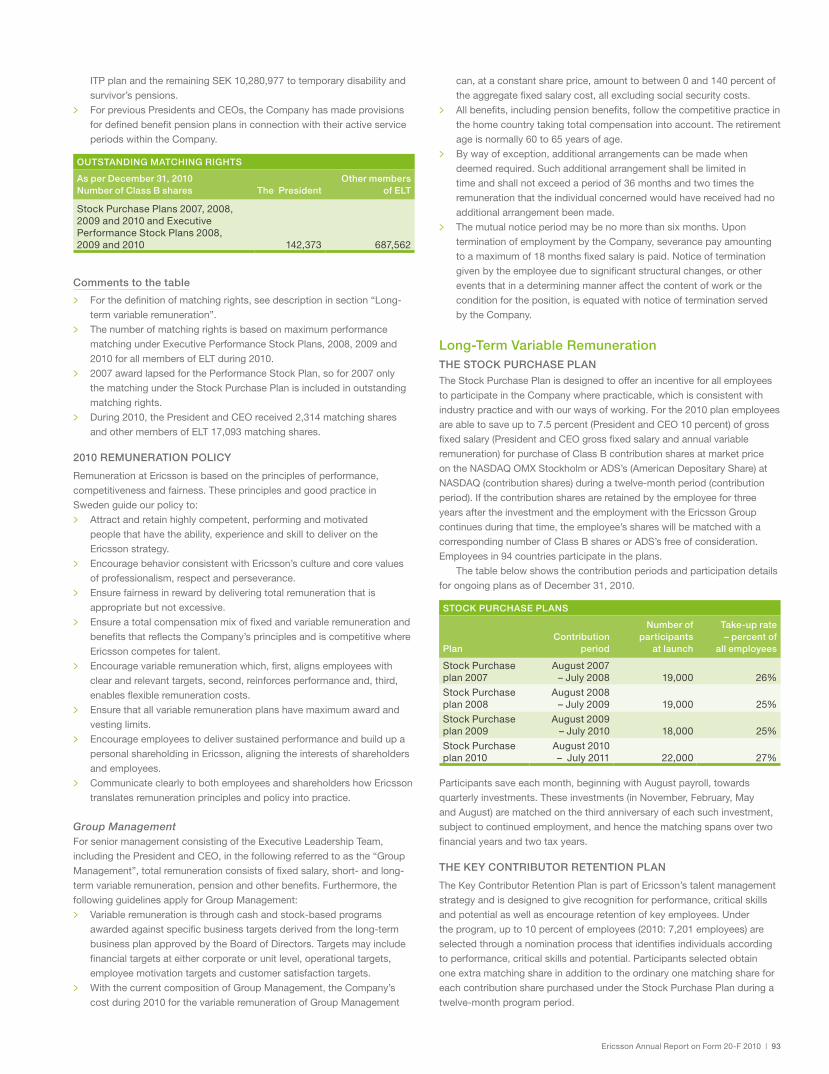
ericssonannualreportonform20-f2010|..93
can,ataconstantshareprice,amounttobetween0and140percentof
theaggregatefixedsalarycost,allexcludingsocialsecuritycosts.
> allbenefits,includingpensionbenefits,followthecompetitivepracticein
thehomecountrytakingtotalcompensationintoaccount.theretirement
ageisnormally60to65yearsofage.
> bywayofexception,additionalarrangementscanbemadewhen
deemedrequired.Suchadditionalarrangementshallbelimitedin
timeandshallnotexceedaperiodof36monthsandtwotimesthe
remunerationthattheindividualconcernedwouldhavereceivedhadno
additionalarrangementbeenmade.
> themutualnoticeperiodmaybenomorethansixmonths.upon
terminationofemploymentbytheCompany,severancepayamounting
toamaximumof18monthsfixedsalaryispaid.noticeoftermination
givenbytheemployeeduetosignificantstructuralchanges,orother
eventsthatinadeterminingmanneraffectthecontentofworkorthe
conditionfortheposition,isequatedwithnoticeofterminationserved
bytheCompany.
long-term.variable.remunerationthe.stoCk.purChase.plan
theStockPurchasePlanisdesignedtoofferanincentiveforallemployees
toparticipateintheCompanywherepracticable,whichisconsistentwith
industrypracticeandwithourwaysofworking.forthe2010planemployees
areabletosaveupto7.5percent(PresidentandCeo10percent)ofgross
fixedsalary(PresidentandCeogrossfixedsalaryandannualvariable
remuneration)forpurchaseofClassbcontributionsharesatmarketprice
onthenaSdaqomxStockholmoradS’s(americandepositaryShare)at
naSdaq(contributionshares)duringatwelve-monthperiod(contribution
period).ifthecontributionsharesareretainedbytheemployeeforthree
yearsaftertheinvestmentandtheemploymentwiththeericssongroup
continuesduringthattime,theemployee’sshareswillbematchedwitha
correspondingnumberofClassbsharesoradS’sfreeofconsideration.
employeesin94countriesparticipateintheplans.
thetablebelowshowsthecontributionperiodsandparticipationdetails
forongoingplansasofdecember31,2010.
stoCk.purChase.plans
planContribution.
period
number.of.participants..
at.launch
take-up.rate..–.percent.of..
all.employees
StockPurchaseplan2007
august2007–July2008 19,000 26%
StockPurchaseplan2008
august2008–July2009 19,000 25%
StockPurchaseplan2009
august2009–July2010 18,000 25%
StockPurchaseplan2010
august2010–July2011 22,000 27%
Participantssaveeachmonth,beginningwithaugustpayroll,towards
quarterlyinvestments.theseinvestments(innovember,february,may
andaugust)arematchedonthethirdanniversaryofeachsuchinvestment,
subjecttocontinuedemployment,andhencethematchingspansovertwo
financialyearsandtwotaxyears.
the.key.Contributor.retention.plan
thekeyContributorretentionPlanispartofericsson’stalentmanagement
strategyandisdesignedtogiverecognitionforperformance,criticalskills
andpotentialaswellasencourageretentionofkeyemployees.under
theprogram,upto10percentofemployees(2010:7,201employees)are
selectedthroughanominationprocessthatidentifiesindividualsaccording
toperformance,criticalskillsandpotential.Participantsselectedobtain
oneextramatchingshareinadditiontotheordinaryonematchingsharefor
eachcontributionsharepurchasedundertheStockPurchasePlanduringa
twelve-monthprogramperiod.
itPplanandtheremainingSek10,280,977totemporarydisabilityand
survivor’spensions.
> forpreviousPresidentsandCeos,theCompanyhasmadeprovisions
fordefinedbenefitpensionplansinconnectionwiththeiractiveservice
periodswithintheCompany.
outstanding.matChing.rights.
as.per.december.31,.2010.number.of.Class.b.shares the..president
other.members.of.elt
StockPurchasePlans2007,2008,2009and2010andexecutivePerformanceStockPlans2008,2009and2010 142,373 687,562
Comments.to.the.table
> forthedefinitionofmatchingrights,seedescriptioninsection“long-
termvariableremuneration”.
> thenumberofmatchingrightsisbasedonmaximumperformance
matchingunderexecutivePerformanceStockPlans,2008,2009and
2010forallmembersofeltduring2010.
> 2007awardlapsedforthePerformanceStockPlan,sofor2007only
thematchingundertheStockPurchasePlanisincludedinoutstanding
matchingrights.
> during2010,thePresidentandCeoreceived2,314matchingshares
andothermembersofelt17,093matchingshares.
2010.remuneration.poliCy
remunerationatericssonisbasedontheprinciplesofperformance,
competitivenessandfairness.theseprinciplesandgoodpracticein
Swedenguideourpolicyto:
> attractandretainhighlycompetent,performingandmotivated
peoplethathavetheability,experienceandskilltodeliveronthe
ericssonstrategy.
> encouragebehaviorconsistentwithericsson’scultureandcorevalues
ofprofessionalism,respectandperseverance.
> ensurefairnessinrewardbydeliveringtotalremunerationthatis
appropriatebutnotexcessive.
> ensureatotalcompensationmixoffixedandvariableremunerationand
benefitsthatreflectstheCompany’sprinciplesandiscompetitivewhere
ericssoncompetesfortalent.
> encouragevariableremunerationwhich,first,alignsemployeeswith
clearandrelevanttargets,second,reinforcesperformanceand,third,
enablesflexibleremunerationcosts.
> ensurethatallvariableremunerationplanshavemaximumawardand
vestinglimits.
> encourageemployeestodeliversustainedperformanceandbuildupa
personalshareholdinginericsson,aligningtheinterestsofshareholders
andemployees.
> Communicateclearlytobothemployeesandshareholdershowericsson
translatesremunerationprinciplesandpolicyintopractice.
Group Managementforseniormanagementconsistingoftheexecutiveleadershipteam,
includingthePresidentandCeo,inthefollowingreferredtoasthe“group
management”,totalremunerationconsistsoffixedsalary,short-andlong-
termvariableremuneration,pensionandotherbenefits.furthermore,the
followingguidelinesapplyforgroupmanagement:
> variableremunerationisthroughcashandstock-basedprograms
awardedagainstspecificbusinesstargetsderivedfromthelong-term
businessplanapprovedbytheboardofdirectors.targetsmayinclude
financialtargetsateithercorporateorunitlevel,operationaltargets,
employeemotivationtargetsandcustomersatisfactiontargets.
> withthecurrentcompositionofgroupmanagement,theCompany’s
costduring2010forthevariableremunerationofgroupmanagement

exeCutive.perFormanCe.stoCk.plans
planbase.year.
eps 1)
target.average.annual..eps.growth.range 2)
matching.share..vesting.range 3).
maximum.opportunity.as.percentage..of.fixed.salary 4)
executivePerformanceStockPlan20075)
8.83 5%to15% 0.67to41to6
1.33to8
30%45%72%
executivePerformanceStockPlan2008 4.43 5%to15% 0.67to41to6
1.33to8
30%45%72%
executivePerformanceStockPlan2009 2.90 5%to15% 0.67to41to6
1.33to8
30%45%72%
executivePerformanceStockPlan2010 1.14 5%to15% 0.67to41to6
1.5to9
30%45%
162%1)SumoffourquartersuptoJune30ofplanyears,uptoandincluding2009.for2010planthesumof4quartersuptodecember31,2010.2)ePSrangefoundfromthree-yearaverageePSofthetwelvequarterstotheendoftheperformanceperiodandcorrespondinggrowthtargets.3) CorrespondingtoePSrange(noPerformanceSharePlanmatchingbelowthisrange).matchingsharespercontributionshareinvestedinadditiontoStockPurchasePlanmatching
accordingtoprogramofupto4,6or9matchingshares.4)atfullinvestment,fullvestingandconstantshareprice.excludesStockPurchasePlanmatching.5) the2007executivePerformanceStockPlandidnotvest.allawardshavealsolapsedforthematchingsharevestingrange1.33to8sharesforthe2008and2009plansfollowingtheonly
participant,theformerPresidentandCeo,leavingtheCompany.
94|ericssonannualreportonform20-f2010
upto10percentoffixedsalaryandShort-termvariableremuneration
incontributionsharesandmayobtainuptonineperformancematching
sharesinadditiontotheStockPurchasePlanmatchingshareforeach
contributionshare.theperformancematchingissubjecttothefulfillment
ofaperformancetargetofaverageannualearningsperShare(ePS)
growth.thetableshowsallexecutivePerformanceStockPlansasper
december31,2010.
the.exeCutive.perFormanCe.stoCk.plan
theexecutivePerformanceStockPlanisdesignedtofocusthe
managementondrivingearningsandprovidecompetitiveremuneration.
Seniorexecutives,includingelt,areselectedtoobtainuptofourorsix
extrashares(performancematchingshares)inadditiontotheordinaryone
matchingshareforeachcontributionsharepurchasedundertheStock
PurchasePlan.upto0.5percentofemployees(2010:264executives)are
offeredtoparticipateintheplan.thePresidentandCeoisallowedtoinvest

shares.For.all.plans
plan.(million.shares)originally.
designated .1).
outstanding..beginning.........
of.2010awarded..
during.2010
exercised/matched..
during.2010
Forfeited/expired..
during.2010outstanding.end.of.2010
Compensation.costs.charged.
during.2010.(msek)
a b C d e F=b+C-d-e g
2006StockPurchasePlan,keyContributorretentionPlanandexecutivePerformanceStockPlans 6.4 3.3 – 2.7 0.6 – 18 3)
2007StockPurchasePlan,keyContributorretentionPlanandexecutivePerformanceStockPlans 9.7 8.6 – 1.4 0.1 7.1 2) 130 3)
2008StockPurchasePlan,keyContributorretentionPlanandexecutivePerformanceStockPlans 16.5 11.3 – 0.1 0.2 11.0 2) 247 3)
2009StockPurchasePlan,keyContributorretentionPlanandexecutivePerformanceStockPlans 22.4 2.5 7.6 0.1 0.1 9.9 2) 351 3)
2010StockPurchasePlan,keyContributorretentionPlanandexecutivePerformanceStockPlans 19.4 – 3.0 – – 3.0 2) 11 3)
total 74.4 25.7 10.6 4.3 1.0 31.0 757 4)
1)adjustedforrightsofferingandreversesplitwhenapplicable.2)PresumingmaximumperformancematchingundertheexecutivePerformanceStockPlans.the2006and2007planshavelapsed.3)fairvalueiscalculatedasthesharepriceontheinvestmentdate,reducedbythenetpresentvalueofthedividendexpectationsduringthethree-yearvestingperiod.netpresentvalue
calculationsarebasedondatafromexternalparty.fairvalueisalsoadjustedforparticipantsfailingtokeepholdoftheircontributionsharesduringthevestingperiod.forsharesundertheexecutivePerformanceStockPlans,theCompanyassessestheprobabilityofmeetingtheperformancetargetswhencalculatingthecompensationcost.fairvalueoftheClassbshareateachinvestmentdateduring2010was:february15Sek64.47,may15Sek75.26,august15Sek67.44andnovember15Sek62.57.
4)totalcompensationcostschargedduring2009:Sek529million,2008:Sek572million.
ericssonannualreportonform20-f2010|..95
thetableaboveshowshowshares(representingmatchingrights
butexcludingsharesforsocialsecurityexpenses)arebeingusedforall
outstandingplans.fromlefttorightthetableincludes(a)thenumberof
sharesoriginallyapprovedbytheannualgeneralmeeting,adjustedfor
reversesplitwhereapplicable;(b)thenumberoforiginallydesignatedshares
thatwereoutstandingatthebeginningof2010;(C)thenumberofshares
awardsthatweregrantedduring2010;(d)thenumberofsharesmatched
during2010;(e)thenumberofsharesforfeitedbyparticipantsorexpired
undertheplanrulesduring2010;(f)thebalanceleftasoutstandingatthe
endof2010,havingaddednewawardstothesharesoutstandingatthe
beginningoftheyearanddeductedthesharesrelatedtoawardsmatched,
forfeitedandexpired.thefinalcolumn(g)showsthecompensationcosts
chargedtotheaccountsduring2010foreachplan,calculatedasfairvalue
inSek.
foradescriptionofcompensationcost,includingaccountingtreatment,
seenoteC1,“SignificantaccountingPolicies”,sectionShare-based
compensationtoemployeesandtheboardofdirectors.
shares.For.all.plansallplansarefundedwithtreasurystockandareequitysettled.treasury
stockforallplanshasbeenissuedindirectedcashissuesofClassC
sharesatthequotientvalueandpurchasedunderapublicofferingat
thesubscriptionpriceplusapremiumcorrespondingtothesubscribers’
financingcosts,andthenconvertedtoClassbshares.
forallplans,additionalshareshavebeenallocatedforfinancingof
socialsecurityexpenses.treasurystockissoldonthenaSdaqomx
Stockholmtocoversocialsecuritypaymentswhenarisingduetomatching
ofshares.during2010,669,700sharesweresoldatanaveragepriceof
Sek77.09.Saleofsharesisrecognizeddirectlyinequity.
if,asofdecember31,2010,allsharesallocatedforfuturematching
undertheStockPurchasePlanweretransferred,andsharesdesignated
tocoversocialsecuritypaymentsweredisposedofasaresultofthe
exerciseandthematching,approximately50millionClassbshareswould
betransferred,correspondingto1.5percentofthetotalnumberofshares
outstanding,3,200million.asofdecember31,2010,73millionClassb
shareswereheldastreasurystock.

employee.numbers,.wages.and.salariesemployee.numbers
average.number.oF.employees
2010 2009
men women total men women total
northamerica 11,005 2,770 13,775 9,366 2,358 11,724
latinamerica 5,326 1,328 6,654 5,876 1,254 7,130
northerneurope&Centralasia1)2) 15,227 5,821 21,048 16,271 6,082 22,353
western&Centraleurope2) 9,338 1,817 11,155 10,003 2,021 12,024
mediterranean2) 9,034 2,670 11,704 7,956 2,403 10,359
middleeast 3,544 468 4,012 3,541 428 3,969
SubSaharanafrica 1,331 359 1,690 1,716 412 2,128
india 5,783 835 6,618 3,818 370 4,188
China&northeastasia 6,867 2,948 9,815 4,897 2,113 7,010
Southeastasia&oceania 3,976 1,378 5,354 4,155 1,320 5,475
total 71,431 20,394 91,825 67,599 18,761 86,3601)Of which
Sweden 13,066 4,355 17,421 13,930 4,591 18,5212)Of which EU 32,045 9,843 41,888 32,970 10,055 43,025
number.oF.employees.at.year.end
2010 2009
employees.by.region
northamerica 13,498 11,222
latinamerica 7,181 6,055
northerneurope&Centralasia1)2) 21,425 21,993
western&Centraleurope2) 10,818 11,622
mediterranean2) 10,795 9,509
middleeast 3,982 3,744
SubSaharanafrica 1,626 2,104
india 6,710 4,184
China&northeastasia 9,807 6,894
Southeastasia&oceania 4,419 5,166
total 90,261 82,4931)Of which Sweden 17,848 18,2172)Of which EU 40,743 41,396
employees.by.gender.and.age.at.year.end.2010..
Female malepercent.of.total
under25yearsold 1,385 3,911 6%
26–35yearsold 6,976 24,369 35%
36–45yearsold 7,317 26,135 37%
46–55yearsold 3,264 12,668 18%
over55yearsold 908 3,328 5%
percent.of.total 22% 78% 100%
number.oF.employees.related.to.Cost.oF.sales..and.operating.expenses
2010 2009 2008
Costofsales 45,628 41,521 35,717
operatingexpenses 44,633 40,972 43,023
total 90,261 82,493 78,740
employee.movements.
2010 2009
headcountatyear-end 90,261 82,493
employeeswhohavelefttheCompany 10,066 9,147
employeeswhohavejoinedtheCompany 17,834 12,900
temporaryemployees 978 693
employee.wages.and.salaries
wages.and.salaries.and.soCial.seCurity.expenses.
2010 2009
wagesandsalaries 43,390 41,247
Socialsecurityexpenses 13,793 13,630
Of which pension costs 3,091 3,588
amountsrelatedtothePresidentandCeoandthegroupmanagement
teamareincluded.
wages.and.salaries.per.region
2010 2009
northamerica3) 10,236 6,358
latinamerica 2,269 2,181
northerneurope&Centralasia1)2) 11,464 11,918
western&Centraleurope2) 6,153 7,063
mediterranean2) 5,053 5,619
middleeast 1,680 1,865
SubSaharanafrica 849 974
india 881 674
China&northeastasia 2,923 2,393
Southeastasia&oceania 1,882 2,202
total 43,390 41,2471)Of which Sweden 10,086 10,3242)Of which EU 21,858 23,7343)Of which the United States 8,098 4,928
remunerationinforeigncurrencyhasbeentranslatedtoSekataverageexchangeratesfortheyear.
remuneration.to.board.members.and.presidents.in.subsidiaries
2010 2009
Salaryandotherremuneration 289 315
Of which annual variable remuneration 43 42
Pensioncosts 29 34
board.members,.presidents.and.group.management..by.gender.at.year.end
2010 2009
Females males Females males
parent.Company
boardmembersandPresident 33% 67% 38% 62%
groupmanagement 14% 86% 8% 92%
subsidiaries
boardmembersandPresidents 10% 90% 10% 90%
96|ericssonannualreportonform20-f2010

majortransactionsareasfollows:
> sales.ericssonprovidesSt-ericssonwithservicesintheareasofr&d,
hr,itandfacilities.
> purchases..majorpartofericsson’spurchasesfromSt-ericsson
consistsofchipsetsandr&dservices.
> dividends.bothownersofSt-ericssonreceivedividends,whenso
decidedbytheboardofdirectors.during2010ericssonreceivedno
dividendsfromSt-ericsson.
st-eriCsson
2010 2009
related.party.transactions
Sales 403 740
Purchases 629 624
ericsson’sshareofdividends – –
related.party.balances
receivables 53 244
liabilities 48 365
St-ericssonhasbeengrantedarevolvingcreditfacilityofuSd200
million,whichisequallysharedbyericssonandStmicroelectronics.asof
december31,2010,theamountdrawnonthefacilitywasSek1,030million.
eachparentlentSek515million.
ericssondoesnothaveanycontingentliabilities,assetspledgedas
collateralorguaranteestowardsSt-ericsson.
ericsson.nikola.tesla.d.d.
ericssonnikolateslad.d.isajointstockcompanyfordesign,salesand
serviceoftelecommunicationsystemsandequipment,andanassociated
memberoftheericssongroup.ericssonnikolateslad.d.islocatedin
Zagreb,Croatia.ericssonholds49.07percentoftheshares.
majortransactionsareasfollows:
> sales..ericssonsellstelecommunicationequipmenttoericssonnikola
teslad.d.
> license.revenues..ericssonreceiveslicenserevenuesforericsson
nikolateslad.d.’susageoftrademarks.
> purchases..ericssonpurchasesdevelopmentresourcesfromericsson
nikolateslad.d.
> dividends..ericssonreceiveddividendsfromericssonnikolateslad.d.
during2010.
eriCsson.nikola.tesla.d.d.
2010 2009 2008
related.party.transactions
Sales 563 654 1,020
licenserevenues 2 7 9
Purchases 566 569 547
ericsson’sshareofdividends 104 66 227
related.party.balances
receivables 120 93 85
liabilities 75 70 58
ericssondoesnothaveanycontingentliabilities,assetspledgedas
collateralorguaranteestowardericssonnikolateslad.d.
C30 related Party transaCtionsduring2010,variousrelatedpartytransactionswereexecutedpursuant
tocontractsbasedontermscustomaryintheindustryandnegotiated
onanarm’slengthbasis.forinformationregardingequityandericsson’s
shareofassets,liabilitiesandincomeinjointventuresandassociated
companies,seenoteC12,“financialassets,non-Current”.forinformation
regardingtransactionswithseniormanagement,seenote29,“information
regardingmembersoftheboardofdirectors,thegroupmanagementand
employees”.
sony.ericsson.mobile.Communications.ab.(semC)
inoctober2001,SemCwasestablishedasajointventurebetweenSony
Corporationandericsson,andasubstantialportionofericsson’shandset
operationswassoldtoSemC.thejointventureisheadquarteredinlondon,
unitedkingdom.aspartoftheformationofthejointventure,contractswere
enteredintobetweenericssonandSemC.
majortransactionsareasfollows:
> license.revenues..bothownersofSemC,SonyCorporationand
ericsson,receivelicenserevenuesforSemC’susageoftrademarksand
intellectualpropertyrights.thedeclineinlicenserevenuesduring2009
isaconsequenceoftheformationofSt-ericsson.
> purchases..ericssonpurchasesmobilephonesfromSemCtosupport
contractswithanumberofcustomersformobilesystemswhichalso
includelimitedquantitiesofphones.
> dividends..bothownersofSemCreceivedividends,whensodecided
bytheboardofdirectors.during2010ericssonreceivednodividends
fromSemC.
sony.eriCsson.mobile.CommuniCations
2010 2009 2008
related.party.transactions
licenserevenues 1,255 1,746 5,856
Purchases 61 164 261
ericsson’sshareofdividends – – 3,627
related.party.balances
receivables 258 369 1,002
liabilities 8 14 176
SemChasbeengrantedtermloansandcreditfacilitiesofSek3,157
million,ofwhichSek2,106millionwereutilizedasofdecember31,2010.
theparentcompaniesofericssonandSonyCorporationhaveissued
guaranteesforthesetermloansandcreditfacilitiesona50/50basis,
withoutjointresponsibility.thusericsson’sguaranteedamountismaximum
Sek1,579millionexcludinginterest.asofdecember31,2010,ericsson’s
partoftheoutstandingamountisSek1,037millionexcludingaccrued
interestofSek16million.maturitydatesfortheissuedguaranteesare
2011(Sek1,128million)and2012(Sek451million).SeealsonoteC24,
“Contingentliabilities”.
st-ericsson.
St-ericsson,thejointventurebetweenericssonandStmicroelectronics,
wasformedonfebruary2,2009,bymergingericssonmobilePlatforms
withSt-nxPwireless.thejointventureisequallyownedbyericsson
andStmicroelectronics.St-ericssonisanindustryleaderindesign,
developmentandthecreationofcutting-edgemobileplatformsandwireless
semiconductors.St-ericssonisakeysuppliertofouroftheindustry’stop
fivehandsetmanufacturers,whotogetherrepresentabout80percentof
globalhandsetshipments,aswellastootherleadingcompaniesinthe
industry.thejointventureisheadquarteredingeneva,Switzerland,and
employsapproximately8,000persons.
ericssonannualreportonform20-f2010|..97

C32 ContraCtual obligationsCONTRACTUAL OBLIGATIONS 2010
Payment due by period
SEK billion<1
year1–3
years3–5
years>5
yearsTotal 2010
Long-term debt 1) 2) 1.6 10.7 7.9 8.1 28.3
Finance lease obligations 3) 0.1 0.3 0.4 1.0 1.8
Operating leases 3) 3.1 4.3 1.9 2.2 11.5
Other non-current liabilities 0.0 0.4 0.2 1.8 2.4
Purchase obligations 4) 7.7 – – – 7.7
Trade Payables 25.0 – – – 25.0
Commitments for customer financing 5) 3.3 – – – 3.3
Total 40.8 15.7 10.4 13.1 80.01) Including interest payments.2) See also Note C20, “Financial Risk Management and Financial Instruments”. 3) See also Note C27, “Leasing”.4) The amounts of purchase obligations are gross, before deduction of any related
provisions.5) See also Note C14, “Trade Receivables and Customer Financing”.
For information about financial guarantees, see Note C24, “Contingent
Liabilities”
Except for those transactions described in this report, Ericsson has not
been a party to any material contracts over the past three years other than
those entered into during the ordinary course of business.
C33 events after the balanCe sheet dateOn March 16, 2011, Ericsson made a statement regarding the situation in
Japan following the earthquake on March 11.
The Company focuses on supporting customers in securing functionality
of vital telecommunication services. Ericsson states that, as Japan is a large
supplier to the global market for semiconductors and other components, it
is reasonable to expect an effect on supply but it is too early to say to what
extent. The situation in Japan is not expected to have material impact on
Ericsson’s Q1 2011 sales.
C31 fees to auditors FEES TO AUDITORS
PwC Others Total
2010
Audit fees 79 5 84
Audit related fees 17 1 18
Tax services fees 16 2 18
Other fees 7 2 9
Total 119 10 129
2009
Audit fees 1) 88 3 91
Audit related fees 1) 18 – 18
Tax services fees 16 2 18
Other fees 1) 3 2 5
Total 125 7 132
2008
Audit fees 1) 88 4 92
Audit related fees 1) 15 – 15
Tax services fees 14 2 16
Other fees 1) 2 5 7
Total 119 11 1301) Allocation of fees to auditors is based on the requirements in the Swedish Annual
Accounts Act. 2008 and 2009 figures are restated for comparability.
During the period 2008–2010, in addition to audit services, PwC provided
certain audit related services, tax and other services to the Company.
The audit related services include quarterly reviews, SAS 70 reviews and
services in connection with issuing of certificates and opinions. The tax
services include general expatriate services and corporate tax compliance
work. Other services include consultation on financial accounting, services
related to acquisitions, operational effectiveness and assessments of
internal control.
Audit fees to other auditors largely consist of local statutory audits for
minor companies.
98 | Ericsson Annual Report on Form 20-F 2010

Ericsson Annual Report on Form 20-F 2010 | 99
>> Risks of excess and obsolete inventories and excess manufacturing capacity and risk of financial difficulties or failures among our suppliers.
>> Increased demand for customer finance, difficulties in collection of accounts receivable and increased risk of counterpart failures.
>> Risk of impairment losses related to our intangible assets as a result of lower forecasted sales of certain products.
>> Increased difficulties in forecasting sales and financial results as well as increased volatility in our reported results.
>> Decline in the value of the assets in the Company’s pension plans.
Short-term volatility has an impact
Our sales to network operators represent a mix of equipment, software and services, which normally generate different gross margins. Third party products normally have lower margins than own products. As a consequence, reported gross margin in a specific period will be affected by the overall mix of products and services as well as the relative content of third party products. Network expansions and upgrades have much shorter lead times for delivery than initial network buildouts. Such orders are normally placed with short notice by customers, i.e. less than a month, and consequently variations in demand are difficult to forecast. As a result, changes in our product and service mix may affect our ability to accurately forecast sales and margins or detect in advance whether actual results will deviate from market consensus.
Convergence brings opportunity and risk
We are affected by market conditions within the telecom industry, including the convergence of the telecom, data and media industries. The convergence is largely driven by technological development related to IP-based communications. This change increases our addressable market, changes the competitive landscape, and affects our objective setting, risk assessment and strategies. If we fail to understand the market development, acquire the necessary competence or develop and market products, services and solutions that are competitive in this changing market, our future results will suffer.
You should carefully consider all the information in this Annual Report and in particular the risks and uncertainties outlined below. Any of the factors described below, or any other risk factors discussed elsewhere in this report, could have a material negative effect on our business, operational and after-tax results, financial position, cash flow, liquidity, credit rating, brand and/or our share price. Furthermore, our operational results may have a greater variability than in the past and we may have difficulties in accurately predicting future developments. See also “Forward-Looking Statements”.
Market,>technology>>and>Business>risks>Demand is difficult to predict
Adverse economic conditions could cause network operators to postpone investments or initiate other cost-cutting initiatives to improve their financial position. This could result in significantly reduced expenditures for network infrastructure and services, in which case our operating results would suffer. We have established flexibility to cost-effectively accommodate fluctuations in demand. However, if demand were to fall in the future, we may experience material adverse effects on our revenues, cash flow, capital employed and value of our assets and we may even incur operating losses. If demand is significantly weaker or more volatile than expected, this may have a material adverse impact on our credit rating, borrowing opportunities and costs as well as on the trading price of our shares. When deemed necessary, we undertake specific restructuring or cost saving initiatives, however, there are no guarantees that such initiatives are sufficient, successful or executed in time to deliver necessary improvements in earnings.
Some of the risk factors we are exposed to may exacerbate in an adverse condition in the financial market. Most of our customers are financially stable and have networks with good utilization. However, some operators, in particular in markets with weak currencies, may incur borrowing difficulties and lower traffic than expected, which may affect their investment plans. The potential adverse effects of an economic downturn include:
>> Reduced demand for products and services, resulting in increased price competition or deferrals of purchases, with lower revenues not being possible to compensate with reduced costs.
risk>factors contentsMARket, teChnoLogY AnD BuSineSS RiSkS 99
ReguLAtoRY, CoMpLiAnCe AnD CoRpoRAte goveRnAnCe RiSkS 103
RiSkS ASSoCiAteD with owning eRiCSSon ShAReS 104

100 | Ericsson Annual Report on Form 20-F 2010
Vendor consolidation may lead to a new competitive landscape
Industry convergence and consolidation among equipment suppliers could potentially result in stronger competitors that are competing as end-to-end suppliers as well as competitors more specialized in particular areas. Consolidation may also result in competitors with greater resources than we have or in reduction of our current scale advantages. This could have a material adverse effect on our business, operating results, and financial condition.
Operator consolidation may increase our dependence on a limited number of customers
We derive most of our business from large, multi-year agreements with a limited number of significant customers. Although no single customer currently represents more than 8 percent of sales, a loss of or a reduced role with a key customer could have a significant adverse impact on sales, profit and market share for an extended period.
In recent years, network operators have undergone significant consolidation, resulting in a large number of operators with activities in several countries. This trend is expected to continue, and also intra-country consolidation is likely to accelerate as a result of competitive pressure.
A market with fewer and larger operators will increase our reliance on key customers and may negatively impact our bargaining position and profit margins. Moreover, if the combined companies operate in the same geographic market, networks may be shared and less network equipment and associated services will be required. Another possible consequence of customer consolidation could be a delay in network investments pending negotiations of e.g. merger/acquisition agreements, securing necessary approvals, or integration of their businesses. Recently, network operators have started to share parts of their network infrastructure through cooperation agreements rather than legal consolidations, which may adversely affect demand for network equipment.
Long-term frame agreements can expose us to risk
Long-term agreements are typically awarded on a competitive bidding basis. In some cases, such agreements also include commitments to future price reductions. In order to maintain the gross margin with such price reductions, we continuously strive to reduce the costs of our products. We reduce costs through design improvements, negotiation of better purchase prices, allocation of more production to low-cost countries and increased productivity in our own production. However, there can be no assurance that our actions to reduce costs will be sufficient or quick enough to maintain our gross margin in such contracts.
We depend on growth and the success of new services
Most of our business depends on continued growth in mobile communications in terms of both number of subscriptions and usage per subscriber, which in turn requires the continued deployment and evolution of our network systems by customers. If operators are not successful in their attempts to increase the number of subscribers and/or stimulate increased usage, our business and operational results could be materially adversely affected. Also, if operators experience a decline in ARPU or profitability despite the introduction of new non-voice services, their willingness for further investments will be reduced and thus adversely affect our business.
Fixed and mobile networks converge and new technologies, such as IP and broadband, enable operators to deliver a range of new types of services in both fixed and mobile networks. We are dependent upon the market acceptance of such services, e.g. music, internet and navigation in the handset, and on the outcome of regulatory and standardization activities in this field, such as spectrum allocation. If delays in standardization or market acceptance occur, this could adversely affect our business and operational results.
We operate in a highly competitive industry
The markets we operate in are highly competitive in price, functionality and service quality as well as in the timing of development and introduction of new products and services.
We face intense competition from significant competitors and Chinese companies in particular have become relatively stronger in recent years. Our competitors may implement new technologies before we do, offer more attractively priced or enhanced products, services or solutions, or they may offer other incentives that we do not provide. Some of our competitors may have greater resources in certain business segments or geographic markets than we do. We may also encounter increased competition from new market entrants, alternative technologies or evolving industry standards. The rapid technological change also results in shorter life-cycles for products, increasing the risk in all product investments.
Continuous price erosion is a symptom of this rapid technological change and we must counteract this by introducing new products to the market and by continuously enhancing the functionality while reducing the cost of new and existing products. Our operating results depend largely on our ability to compete in this market environment.

Ericsson Annual Report on Form 20-F 2010 | 101
A limited number of suppliers of components, production capacity and R&D and it services
Our ability to deliver according to market demands and contractual commitments depends significantly on obtaining timely and adequate supply of materials, components and production capacity and other vital services on competitive terms. Although we strive to avoid single-source supplier solutions, this is not always possible. Failure by any of our suppliers could interrupt our product supply or operations and significantly limit our sales or increase our costs. To find an alternative supplier or re-design products to replace components may take significant time. If we fail to anticipate customer demand properly, an over/under-supply of components and production capacity could occur. In many cases, some of our competitors utilize the same contract manufacturers and if they have purchased capacity ahead of us we could be blocked from acquiring the needed products. This factor could limit our ability to supply our customers or could increase our costs. At the same time, we commit to certain capacity levels or component quantities, which, if unused, will result in charges for unused capacity or scrapping costs. We are also exposed to financial counterpart risks to suppliers where we pay in advance. We conduct regular supplier audits and evaluations to mitigate the risks mentioned as well as brand risks related to the suppliers’ compliance with e.g. labor and environmental regulations.
product or service quality issues
Sales contracts normally include warranty undertakings for faulty products and often also provisions regarding penalties and/or termination rights in the event of a failure to deliver ordered products or services on time or with required quality. Although we undertake a number of quality assurance measures to reduce such risks, product quality or service performance issues may affect our results negatively.
Significant foreign exchange exposures
With the majority of our cost base in SEK and a very large share of sales in other currencies, and significant operations outside Sweden, our foreign exchange exposures are significant. Currency exchange rate fluctuations affect our consolidated income statement, balance sheet and cash flows when foreign currencies are exchanged or translated to SEK, which increases volatility in reported results.
As market prices are predominantly established in USD or EUR, and with a net revenue exposure in foreign currencies, a stronger SEK exchange rate would generally have a negative effect on our reported results. Our attempts to reduce the effects of exchange rate fluctuations through a variety of hedging activities may not be sufficient or successful, resulting in an adverse impact on our results.
transforming into a more service-based company
Operators are increasingly outsourcing parts of their operations as a way to reduce cost and focus on new services. This has opened up a market which we have addressed. The growth rate is difficult to forecast and each new contract carries a risk that transformation and integration of the operations is not as fast or smooth as planned. Early contract margins are generally lower and the mix of new/old contracts may affect reported results negatively in a given period. Contracts normally cover several years and revenues are of a recurring nature. However, sometimes contract scopes are reduced with negative impact on sales and earnings. Ericsson is the market leader in managed services but competition in this area is increasing, which may have adverse effects on growth and profitability.
Success of R&D investments is uncertain
To be a player in our industry requires large investments in technology and creates exposure to rapid technological and market changes. We spend significant amounts and resources in innovation work for new technology, products and solutions. In order for us to be successful, those technologies, products and solutions must be accepted by relevant standardization bodies and by the industry as a whole. If we invest in the development of technologies, products and solutions that do not function as expected, are not adopted by the industry, are not ready in time or are not successful in the marketplace our sales and earnings may suffer.
Acquisitions and divestments
In addition to in-house innovation efforts, we make strategic acquisitions in order to obtain various benefits, e.g. to reduce time-to-market, to gain access to technology and/or competence, to increase our scale or to broaden our product portfolio or expand our customer base. From time to time we also divest parts of our operations to optimize our product portfolio or operations. There are no guarantees that such acquisitions or divestments are successful or that we will succeed in integrating the acquired entities to gain the expected benefits within the time frame we expect or at all.
Joint ventures and partnerships
If our partnering arrangements fail to perform as expected (whether through an incorrect assessment of our needs or the capabilities or financial stability of our strategic partners), our ability to work with these partners or develop new products and solutions may be constrained and this may harm our competitive position in the market. Additionally, our share of any losses from, or commitments to contribute additional capital to, such partnerships may adversely affect our results of operations or financial position.
102 | Ericsson Annual Report on Form 20-F 2010
material adverse effect on our business, reputation, operating results, or financial condition.
As a publicly listed company, Ericsson may be exposed to lawsuits, in which plaintiffs allege that the Company or its officers have failed to comply with securities laws, stock market regulation or other laws, regulations or requirements. Whether or not there is merit to such claims, the time and costs incurred to defend the Company and its officers and the potential settlement or compensation to the plaintiffs may have significant impact on our reported results and reputation. For additional information regarding certain of the lawsuits in which we are involved, see “Legal and Tax Proceedings” in the Board of Directors’ Report.
Business interruption
Our business operations rely on complex operations and communications networks, which are vulnerable to damage or disturbance from a variety of sources. Having outsourced a significant portion of our IT operations, we depend partly on security and reliability measures of external companies. Regardless of protection measures, essentially all systems and communications networks are susceptible to disruption due to failure, vandalism, computer viruses, security breaches, natural disasters, power outages and other events. We also have a concentration of operations on certain sites, e.g. for R&D, production, network operation centers, logistic centers and shared services centers, where business interruptions could cause material damage and costs. Transport of goods from suppliers, and to customers, could also be hampered for the reasons stated above. Although we have assessed these risks, implemented controls, performed business continuity planning and selected reputable companies for outsourced services, we cannot be sure that interruptions with material adverse effects will not occur.
Attract and retain highly qualified employees
We believe that our future success largely depends on our continued ability to hire, develop, motivate and retain engineers and other qualified personnel needed to develop successful new products, support our existing product range and provide services to our customers. Competition for skilled personnel and highly qualified managers in the telecommunications industry remains intense. We are continuously developing our corporate culture, remuneration, promotion and benefit policies as well as other measures aimed at empowering our employees and reducing employee turnover. However, there are no guarantees that we will be successful in attracting and retaining employees with appropriate skills in the future.
Access to short-term and long-term capital
If we do not generate sufficient amounts of capital to support our operations, service our debt and continue our research and development and customer finance programs, or if we cannot raise sufficient amounts of capital at the times and on the terms
intellectual property rights (ipR)
Although we have a large number of patents, there can be no assurance that they will not be challenged, invalidated, or circumvented, or that any rights granted in relation to our patents will in fact provide competitive advantages to us.
In 2005, the European Union considered placing restrictions on the patentability of software. Although the European Union ultimately rejected this proposal, we cannot guarantee that they will not revisit this issue in the future. We rely on many software patents, and any limitations on the patentability of software may materially affect our business.
We utilize a combination of trade secrets, confidentiality policies, non-disclosure and other contractual arrangements in addition to relying on patent, copyright and trademark laws to protect our intellectual property rights. However, these measures may not be adequate to prevent or deter infringement or other misappropriation. Moreover, we may not be able to detect unauthorized use or take appropriate and timely steps to establish and enforce our proprietary rights. In fact, existing laws of some countries in which we conduct business offer only limited protection of intellectual property rights, if at all.
Our solutions may also require us to license technologies from third parties. It may be necessary in the future to seek or renew licenses and there can be no assurance that they would be available on acceptable terms, or at all. Moreover, the inclusion in our products of software or other intellectual property licensed from third parties on a non-exclusive basis could limit our ability to protect proprietary rights in our products.
Many key aspects of telecommunications and data network technology are governed by industry-wide standards usable by all market participants. As the number of market entrants and the complexity of technology increases, the possibility of functional overlap and inadvertent infringement of intellectual property rights also increases. Third parties have asserted, and may assert in the future, claims, directly against us or indirectly against our customers, alleging infringement of their intellectual property rights. Defending such claims may be expensive, time-consuming and divert the efforts of our management and/or technical personnel. As a result of litigation, we could be required to pay damages and other compensation directly or indemnifying our customers for such damages and other compensation, develop non-infringing products/technology or enter into royalty or licensing agreements. However, we cannot be certain that such licenses will be available to us on commercially reasonable terms or at all.
Litigations
In the normal course of our business we are involved in legal proceedings. Litigation can be expensive, lengthy and disruptive to normal business operations. Moreover, the results of complex legal proceedings are difficult to predict. An unfavorable resolution of a particular lawsuit could have a

Ericsson Annual Report on Form 20-F 2010 | 103
Changes in regulatory requirements, tariffs and other trade barriers, price or exchange controls or other governmental policies in the countries where we do business could limit our operations and make the repatriation of profits difficult. In addition, the uncertainty of the legal environment in some regions could limit our ability to enforce our rights. In addition we must comply with the export control regulations of the countries and any trade embargoes in force at the time of sale and/or delivery. Although we seek to comply with all such regulations, even unintentional violations could have material adverse effects on our business, operational results and brand.
Compliance with high standards of corporate governance
Ericsson applies mandatory corporate governance statutes and rules, such as the Swedish Corporate Governance Code and is also committed to several corporate responsibility and environmental initiatives. To ensure that our operations are executed in accordance with these requirements, our management system includes a robust corporate culture and a Code of Business Ethics as well as policies and directives to govern our processes and operations. We regularly perform communication and training in these areas, and we monitor and audit internal compliance with the policies and directives as well as our suppliers’ adherence to our Supplier Code of Conduct. There is however no guarantee that violations will not occur, which could have material adverse effects on our brand, reputation and business.
Compliance with environmental, health and safety regulations
We are subject to certain environmental, health and safety laws and regulations that affect our operations, facilities and products in each of the jurisdictions in which we operate. We believe that we are in compliance with all material laws and regulations. However, there is a risk that we may have to incur expenditures to cover environmental and health liabilities to maintain compliance with current or future laws and regulations or to undertake any necessary remediation. It is difficult to reasonably estimate the future impact of environmental matters, including potential liabilities. This is due to several factors, particularly the length of time often involved in resolving such matters.
potential health risks related to electromagnetic fields
The mobile telecommunications industry is subject to claims that mobile handsets and other devices that generate electromagnetic fields expose users to health risks. At present, a substantial number of scientific studies conducted by various independent research bodies have indicated that electromagnetic fields, at levels within the limits prescribed by public health authority safety standards and recommendations, cause no adverse effects to human health. However, any
required by us, our business is likely to be adversely affected. Access to short-term funding may decrease or become more expensive as a result of our operational and financial condition and market conditions or due to deterioration in our credit rating. We cannot assure that additional sources of funds that we from time to time may need will be available or available on reasonable terms.
regulatory,>coMpliance>and>corporate>governance>risksRegulatory environment changes
Telecommunications is an industry subject to particular regulation and regulatory changes affect both our customers’ and our own operations. For example, regulations imposing more stringent, time-consuming or costly planning and zoning requirements or building approvals for radio base stations and other network infrastructure could adversely affect the timing and costs of network construction or expansion, and ultimately the commercial launch and success of these networks. Similarly, tariff and roaming regulations or rules on network neutrality could also affect operators’ ability or willingness to invest in network infrastructure, which in turn could affect the sales of our systems and services. Also radio frequency spectrum allocation between different types of usage may affect operator spending adversely or force us to develop new products to be able to compete.
License fees, environmental, health and safety, privacy and other regulatory changes, in general or particular to our industry, may increase costs and restrict operations for network operators and service providers or us. Also indirect impacts of such changes could affect our business adversely even though the specific regulations may not apply directly to our products or us.
Country-specific political, economic and regulatory risks
We conduct business throughout the world and are subject to the effects of general global economic conditions as well as conditions unique to a specific country or region. We conduct business in more than 180 countries, with a significant proportion of our sales to emerging markets in Asia Pacific, Latin America, Eastern Europe, the Middle East and Africa. We expect that sales to such emerging markets will represent an increasing portion of total sales, as developing nations and regions around the world increase their investments in telecommunications. We already have extensive operations in many of these countries, which involve certain risks, including volatility in gross domestic product, civil disturbances, economic and political instability, nationalization of private assets and the imposition of exchange controls.

104 | Ericsson Annual Report on Form 20-F 2010
>> Financial difficulties for our customers
>> Awards of large supply or service contracts
>> Speculation in the press or investment community about the business level or growth in the market for mobile communications
>> Technical problems, in particular those relating to the introduction and viability of new network systems like LTE/4G and new platforms such as the RBS 6000 (multi-standard radio base station) platform
>> Actual or expected results of ongoing or potential litigation
>> Announcements concerning bankruptcy or investigations into the accounting procedures of other telecommunications companies, even if we are not involved
>> Our ability to forecast and communicate our future results in a manner consistent with investor expectations.
Currency fluctuations may adversely affect share value or value of dividends
Because our shares are quoted in SEK on NASDAQ OMX Stockholm (our primary stock exchange), but in USD on NASDAQ (ADSs), fluctuations in exchange rates between SEK and USD may affect the value of your investment. In addition, because we pay cash dividends in SEK, fluctuations in exchange rates may affect the value of distributions if arrangements with your bank, broker or depositary call for distributions to you in currencies other than SEK. An increasing part of the trade in our shares is carried out on alternative exchanges or markets, which may lead to less accurate share price information on NASDAQ OMX Stockholm or NASDAQ.
perceived risk or new scientific findings of adverse health effects of mobile communication devices and equipment could adversely affect us through a reduction in sales or through liability claims. Although Ericsson’s products are designed to comply with all current safety standards and recommendations regarding electromagnetic fields, we cannot guarantee that we or the jointly owned Sony Ericsson Mobile Communications or ST-Ericsson will not become the subject of product liability claims or be held liable for such claims or be required to comply with future regulatory changes that may have an adverse effect on our business.
Risks>associated>with>owning>eRicsson>shaResOur share price has been and may continue to be volatile
Our share price has been volatile partly due to the high volatility in the securities markets generally and for telecommunications and technology companies in particular. The share price is also likely to be affected by the development in our market, our reported financial results and the expectations of financial analysts, as well as statements and market speculation regarding our future prospects or the timing or content of any profit warning by us or our competitors.
Factors other than our financial results that may affect our share price include, but are not limited to:
>> A weakening of our brand name or other circumstances with adverse effects on our reputation
>> Announcements by our customers, competitors or us regarding capital spending plans of network operators

Ericsson Annual Report on Form 20-F 2010 | 105
including partnerships, acquisitions and divestments;
>> financial risks, including changes in foreign exchange rates or interest rates, lack of liquidity or access to financing, changes in tax liabilities, credit risks in relation to counterparties, customer defaults under significant customer finance arrangements and risks of confiscation of assets in foreign countries;
>> the impact of the consolidation in the industry, and the resulting (i) reduction in the number of customers, and adverse consequences of a loss of, or significant decline in, our business with a major customer; (ii) increased strength of a competitor or the establishment of new competitors;
>> the impact of changes in product demand, price erosion, competition from existing or new competitors or new technologies or alliances between vendors of different types of technology and the risk that our products and services may not sell at the rates or levels we anticipate;
>> the product mix and margins of our sales;
>> the volatility of market demand and difficulties to forecast such demand;
>> our ability to develop commercially viable products, systems and services, to acquire licenses of necessary technology, to protect our intellectual property rights through patents and trademarks and to license them to others and defend them against infringement, and the results of patent litigation;
>> supply constraints, including component or production capacity shortages, suppliers’ abilities to cost effectively deliver quality products on time and in sufficient volumes, and risks related to concentration of proprietary or outsourced production in a single facility or sole source situations with a single vendor;
>> our ability to successfully manage operators’ networks to their satisfaction with satisfactory margins;
>> our ability to maintain a strong brand and good reputation and to be acknowledged for good corporate governance;
>> our ability to recruit and retain qualified management and other key employees.
Certain of these risks and uncertainties are described further in “Risk Factors”. We undertake no obligation to publicly update or revise any forward-looking statements included in this Annual Report, whether as a result of new information, future events or otherwise, except as required by applicable law or stock exchange regulation.
This Annual Report includes forward-looking statements, including statements reflecting management’s current views relating to the growth of the market, future market conditions, future events and expected operational and financial performance. The words “believe”, “expect”, “foresee”, “anticipate”, “assume”, “intend”, “may”, “could”, “plan”, “estimate”, “will”, “should”, “could”, “aim”, “target”, “might” or, in each case, their negative, and similar words are intended to help identify forward-looking statements. Forward-looking statements may be found throughout this document, but in particular in the chapter “Board of Directors’ Report” and include statements regarding:
>> our goals, strategies and operational or financial performance expectations;
>> development of corporate governance standards, stock market regulations and related legislation;
>> the growth of the markets in which we operate;
>> our liquidity, capital resources, capital expenditures, our credit ratings and the development in the capital markets, affecting our industry or us;
>> the expected demand for our existing as well as new products and services;
>> the expected operational or financial performance of our joint ventures and other strategic cooperation activities;
>> the time until acquired entities will be accretive to income;
>> technology and industry trends including regulatory and standardization environment, competition and our customer structure;
>> our plans for new products and services including research and development expenditures.
Although we believe that the expectations reflected in these and other forward-looking statements are reasonable, we cannot assure you that these expectations will materialize. Because forward-looking statements are based on assumptions, judgments and estimates, and are subject to risks and uncertainties, actual results could differ materially from those described or implied herein. Important factors that could affect whether and to what extent any of our forward-looking statements materialize include, but are not limited to:
>> our ability to respond to changes in the telecommunications market and other general market conditions in a cost effective and timely manner;
>> developments in the political, economic or regulatory environment affecting the markets in which we operate, including trade embargoes, changes in tax rates, changes in patent protection regulations, allegations of health risks from electromagnetic fields, cost of radio licenses for our customers, allocation of radio frequencies for different purposes and results of standardization activities;
>> the effectiveness of our strategies and their execution,
forward-looking>stateMents

106 | Ericsson Annual Report on Form 20-F 2010
data collected from external survey providers and can call on other independent expertise, should it so require. The Chairman continues to ensure that contact is maintained, as necessary and appropriate, with principal shareholders on the subject of remuneration.
The purpose and function of the Remuneration Committee will continue going forward and its responsibilities can be found on the Ericsson website (www.ericsson.com). These responsibilities, together with the remuneration policy, are reviewed and evaluated annually in light of matters such as changes to corporate governance best practice or changes to accounting, legislation, political opinion or business practices among peers. This helps to ensure that the policy continues to provide Ericsson with a competitive remuneration strategy. The policy for Group management remuneration is, in accordance with Swedish law, brought to shareholders annually for approval.
RemuneRation 2010The Remuneration Committee met nine times during the year. The winter meetings focused on following-up results from the 2009 variable remuneration programs and preparing proposals to shareholders for the 2010 Annual General Meeting (AGM). During winter and spring the committee considered the new Regional organization and new members in the Executive Leadership Team (ELT). In the fall the work began with a review of the remuneration strategy with focus on the Long-Term Variable remuneration, the Short-Term Variable remuneration plans and levels of fixed compensation. Feedback from meetings with investors, market analysis and global trend analyses served as input to the remuneration strategy discussion. As is illustrated above, the Committee has also considered market trends, existing and potential remuneration risks, target setting, its working arrangements and corporate governance.
intRoductionThis report outlines how the remuneration policy is implemented throughout Ericsson in line with corporate governance best practice, with specific references to Group management. To begin with, the work of the Remuneration Committee 2010 and the remuneration policy are explained, followed by descriptions of plans and approaches. This report also includes information on how the remuneration programs have been evaluated and conclusions from that. More details of the remuneration of Group management and Board members’ fees can be found in the Notes to the Consolidated Financial Statements – Note C29, “Information regarding members of the Board of Directors, the Group management and employees” (“Note C29”).
the RemuneRation committeeThe Remuneration Committee advises the Board of Directors on an ongoing basis on the remuneration of the Group management, hereafter referred to as the Executive Leadership Team (ELT). This includes fixed salaries, pensions, other benefits and short-term and long-term variable remuneration, all in the context of pay and employment conditions throughout Ericsson. The Remuneration Committee also approves variable remuneration outcomes, prepares remuneration related proposals for Board and shareholder approval and develops and monitors the remuneration policy, strategies and general guidelines for employee remuneration.
The Remuneration Committee’s work is the foundation for the governance of our remuneration processes together with our internal systems and audit controls. The Committee is chaired by Michael Treschow and its other members are Nancy McKinstry, Börje Ekholm and Karin Åberg. All the members are non-executive directors, independent (except for the employee representative) as required by the Swedish Corporate Governance Code and have relevant knowledge and experience of remuneration matters.
The Company’s General Counsel acts as secretary to the Committee. The Chief Executive Officer, the Senior Vice President Human Resources & Organization and the Vice President Compensation & Benefits attend the Remuneration Committee meetings by invitation and assist the Committee in its considerations, except when issues relating to their own remuneration are being discussed.
The Remuneration Committee has appointed an independent expert advisor, Gerrit Aronson, to assist and advise the Committee. Gerrit Aronson provided no other services to the Company during 2010. The Remuneration Committee is also provided with national and international pay
RemuneRation RepoRt
RemuneRation policyRemuneration at Ericsson is based on the principles of performance, competitiveness and fairness. Our remuneration policy together with the mix of remuneration elements are designed to reflect these remuneration principles by creating a balanced remuneration package. The policy for 2010 can be found in Note C29. The auditors’ opinion on how we have followed our policy during 2010 is posted on the website.

Ericsson Annual Report on Form 20-F 2010 | 107
AnnuAl cycle of the remunerAtion committee’s work
our key employees, the voluntary attrition rate among Key Contributors being about two thirds compared to total number of employees.
A survey of Ericsson’s managers in January 2011 verified that over half of managers think the Long-Term Variable and Short-Term Variable remuneration plans are “effective” or “very effective” in meeting the purpose of the plans.
This confirms earlier third-party research that has shown that the Long-Term Variable plans drive the right values and enhance retention. The plans remain competitive by Swedish standards. The participation rate among Key Contributors remains high compared with international benchmarks.
However, the evaluation has also shown that the Executive Performance Stock Plan has had limited success in terms of meeting the purpose of rewarding long-term financial performance. The performance target has proved to be more binary than anticipated, where the 2004 program vested in full and the programs for 2005, 2006 and 2007 did not vest. Extensive work has been conducted to define how the plan should be developed and this has identified the need to secure clear targets that are more aligned with strategy and value creation. Based on this, the Board has evaluated targets and target levels to identify those that best support the long-term strategy and value creation of the company and will propose these targets for the 2011 Executive Performance Stock Plan to the AGM.
total RemuneRationWhen we consider the remuneration of an individual, it is the total remuneration that matters. We first consider the total annual cash compensation, looking at target level of short-term variable remuneration plus fixed salary. We then add target long-term variable remuneration to get total target remuneration and, finally, pension and other benefits to arrive at the total package.
evaluation of remuneration policy and plansThe Remuneration Committee has supported the Board with the review and evaluation of the remuneration policy and practice. As described later in this report, all remuneration elements and levels are evaluated through benchmarking against market data provided by external sources. Analyses of market data, as well as of attrition data, show that Ericsson is in general competitive in local markets and that total remuneration is appropriate but not excessive.
The remuneration policy is evaluated annually in light of the long-term strategy and the Remuneration Committee’s overview of total remuneration and each individual remuneration element. The Committee has concluded and the Board has decided that the remuneration policy remains valid and right for Ericsson and should not be materially changed for 2011.
Evaluation through employee surveys show that the common understanding of Ericsson’s remuneration policy could be improved. To enhance the understanding of how Ericsson translates remuneration principles and policy into practice, a Remuneration website has been launched in January 2011. This is a training program containing e-learning and training targeted at line managers to support more informed decisions and better communication to the wider employee population.
Extensive analyses of local market data for each position in the Executive Leadership Team have been conducted and decisions on budget and increases for ELT have been taken by Remuneration Committee. The work is also reviewed by the independent advisor to the Committee.
The evaluation of Long-Term Variable remuneration plans concluded that the objectives of the Stock Purchase Plan to promote “One Ericsson” and align the interests of employees with those of shareholders have been successful. The participation rate has increased from 25 percent to 27 percent over the year. The evaluation conducted also confirms that the Key Contributor Retention Plan meets the purpose to retain
AUGUST–OCTOBER > Review of committee working arrangements > Issues, trends and market practice analyses > Review of Executive Performance Stock Plan
target achievement and vesting decision > Review of risks associated with remuneration > Review of remuneration policy, package
con struction and design of individual elements
MAY–JULY > Review of appropriateness of targets
NOVEMBER–FEBRUARY > Salary review for Executive Leadership Team (ELT) and
other senior executives > Review of target achievements for Short-Term Variable
plan, vesting and target setting decisions > Target setting for Long-Term Variable plan > Proposals for AGM > Communications to investors, including Annual Report > Review of total remuneration outcomes and costs
> MARCH–APRIL > Annual General Meeting of shareholders
Annual cycle of the Remuneration Committee’s work
Jan
Feb
Mar
Apr
JunJul
Aug
Sep
Oct
Nov
Dec
May
Q4 Q1
Q2Q3

108 | Ericsson Annual Report on Form 20-F 2010
For the ELT, remuneration consists of fixed salary, short-term and long-term variable remuneration, pension and other benefits. If the size of any one of these elements is increased or decreased, at least one other element has to change where the competitive position should remain unchanged.
The remuneration costs for the CEO and the ELT are reported in Note C29.
fixed salaryFixed salaries are set to be competitive within an individual’s home market. When setting fixed salaries the Remuneration Committee considers the impact on total remuneration, including pension and associated costs. The absolute levels are determined by the size and complexity of the position and the year-to-year performance of the individual. Together with other elements of remuneration, the ELT salaries are subject to an annual review by the Remuneration Committee, which considers external pay data to ensure that levels of pay remain competitive and appropriate to the remuneration policy.
Variable remunerationAt Ericsson we strongly believe that, where possible, we should encourage variable compensation as integral part of total target remuneration approach. First and foremost this aligns
employees with clear and relevant targets but it also enables more flexible payroll costs and emphasizes the link between performance and pay. All variable remuneration plans have maximum award and vesting limits.
short-term VAriAble remunerAtion
The annual variable remuneration is delivered through cash-based programs. Specific business targets are derived from the annual business plan approved by the Board of Directors and, in turn, defined by the Company’s long-term strategy. Ericsson strives to grow faster than the market with best-in-class margins and strong cash conversion and therefore the starting point is to have these as three core targets:
> Sales Growth
> Operating Income
> Cash Flow
For the ELT, targets are thus predominantly financial targets at either Group level or at the individual unit level and may also include operational targets like customer satisfaction and employee motivation. Targets are cascaded to all managers and will vary depending on the specific position. All variable remuneration targets have to be objective and measurable
summAries of 2010 short- AnD lonG-term VAriAble remunerAtion
what we call it what is it? what is the objective? who participates? how is it earned?
short-term: remuneration delivered over 12 months or less
Fixed salary Fixed remuneration paid at set times
Attract and retain employees, delivering part of annual remuneration in a predictable format
All employees Market appropriate levels set according to position and evaluated according to individual performance
Short-Term Variable remuneration (STV)
A variable plan that is measured and paid over a single year
Align employees with clear and relevant targets, providing an earnings opportunity in return for performance and flexible cost
Managers, including Executive Leadership Team
Achievements against set targets. Reward can increase to up to twice the target level and decrease to zero, depending on performance
Local and Sales Incentive Plans
Tailored versions of the STV As for STV, tailored for local or business requirements, such as sales
Most employees Similar to STV. All plans have maximum award and vesting limits
long-term: remuneration delivered over 3 years or more
Stock Purchase Plan (SPP) All-employee stock-based plan
Reinforce a “One Ericsson” and align employees’ interests with those of shareholders
All employees are eligible Buy one share and it will be matched by one share after 3 years if still employed
Key Contributor Retention Plan (KC)
Share-based plan for selected individuals
Recognize, retain and motivate key contributors for performance, critical skills and potential
Up to 10 percent of employees
If selected, get one more matching share in addition to the SPP one
Executive Performance Stock Plan (EPSP)
Share-based plan for senior executives
Remuneration for long-term commitment and earnings performance
Senior executives, including Executive Leadership Team
Get up to 4, 6 or, for CEO, 9 further matching shares to the SPP one for long-term performance.
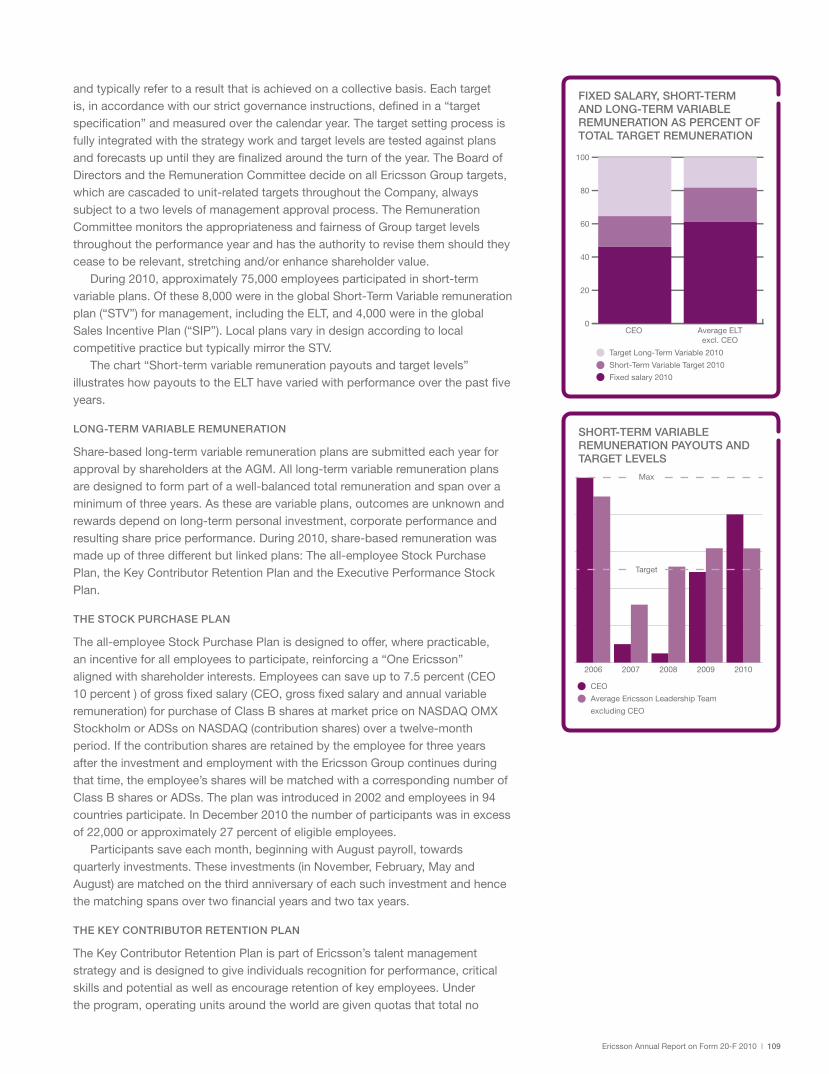
Ericsson Annual Report on Form 20-F 2010 | 109
and typically refer to a result that is achieved on a collective basis. Each target is, in accordance with our strict governance instructions, defined in a “target specification” and measured over the calendar year. The target setting process is fully integrated with the strategy work and target levels are tested against plans and forecasts up until they are finalized around the turn of the year. The Board of Directors and the Remuneration Committee decide on all Ericsson Group targets, which are cascaded to unit-related targets throughout the Company, always subject to a two levels of management approval process. The Remuneration Committee monitors the appropriateness and fairness of Group target levels throughout the performance year and has the authority to revise them should they cease to be relevant, stretching and/or enhance shareholder value.
During 2010, approximately 75,000 employees participated in short-term variable plans. Of these 8,000 were in the global Short-Term Variable remuneration plan (“STV”) for management, including the ELT, and 4,000 were in the global Sales Incentive Plan (“SIP”). Local plans vary in design according to local competitive practice but typically mirror the STV.
The chart “Short-term variable remuneration payouts and target levels” illustrates how payouts to the ELT have varied with performance over the past five years.
lonG-term VAriAble remunerAtion
Share-based long-term variable remuneration plans are submitted each year for approval by shareholders at the AGM. All long-term variable remuneration plans are designed to form part of a well-balanced total remuneration and span over a minimum of three years. As these are variable plans, outcomes are unknown and rewards depend on long-term personal investment, corporate performance and resulting share price performance. During 2010, share-based remuneration was made up of three different but linked plans: The all-employee Stock Purchase Plan, the Key Contributor Retention Plan and the Executive Performance Stock Plan.
the stock PurchAse PlAn
The all-employee Stock Purchase Plan is designed to offer, where practicable, an incentive for all employees to participate, reinforcing a “One Ericsson” aligned with shareholder interests. Employees can save up to 7.5 percent (CEO 10 percent ) of gross fixed salary (CEO, gross fixed salary and annual variable remuneration) for purchase of Class B shares at market price on NASDAQ OMX Stockholm or ADSs on NASDAQ (contribution shares) over a twelve-month period. If the contribution shares are retained by the employee for three years after the investment and employment with the Ericsson Group continues during that time, the employee’s shares will be matched with a corresponding number of Class B shares or ADSs. The plan was introduced in 2002 and employees in 94 countries participate. In December 2010 the number of participants was in excess of 22,000 or approximately 27 percent of eligible employees.
Participants save each month, beginning with August payroll, towards quarterly investments. These investments (in November, February, May and August) are matched on the third anniversary of each such investment and hence the matching spans over two financial years and two tax years.
the key contributor retention PlAn
The Key Contributor Retention Plan is part of Ericsson’s talent management strategy and is designed to give individuals recognition for performance, critical skills and potential as well as encourage retention of key employees. Under the program, operating units around the world are given quotas that total no
fixeD sAlAry, short-term AnD lonG-term VAriAble remunerAtion As Percent of totAl tArGet remunerAtion
short-term VAriAble remunerAtion PAyouts AnD tArGet leVels
0,0
0,2
0,4
0,6
0,8
1,0
20102009200820072006
CEO
Average Ericsson Leadership Team
excluding CEO
Target
Max
0
20
40
60
80
100
Target Long-Term Variable 2010
Short-Term Variable Target 2010
Fixed salary 2010
CEO Average ELTexcl. CEO

110 | Ericsson Annual Report on Form 20-F 2010
benefits and terms of employmentPension benefits follow the competitive practice in the employee’s home country and may contain various supplementary plans, in addition to any national system for social security. Where possible, pension plans are operated on a defined contribution basis. Under these plans, Ericsson pays contributions into a plan but does not guarantee the ultimate benefit, unless local regulations or legislation prescribe that defined benefit plans that do give such guarantees have to be offered.
For the CEO and other members of the ELT employed in Sweden a supplementary pension plan is applied in addition to the occupational pension plan for salaried staff on the Swedish labor market (ITP). The pension age is according to local practice, for ELT members normally 60 years. The pensionable salary for ELT members on local contract in Sweden consists of the annual fixed salary including vacation pay and the target value of the Short-Term Variable remuneration. For members of the ELT who are not employed in Sweden, local market competitive pension arrangements apply.
Other benefits, such as company car and medical insurance, are also set to be competitive in the local market. ELT members may not receive loans from the Company.
ELT members locally employed in Sweden have a mutual notice period of up to six months. Upon termination of employment by the Company, severance pay can amount to up to 18 months fixed salary. For other ELT members different notice period and severance pay agreement apply, however no agreements exceeds the notice period of 6 months or the severance pay of 18 months.
RemuneRation of the BoaRd of diRectoRsThe remuneration of Directors not employed by Ericsson is handled separately by the Nomination Committee and approved by the Annual General Meeting of shareholders. The remuneration consists of fees for Board and committee work, part of which can be delivered under a synthetic share program. The synthetic shares, which are valued in line with Ericsson’s Class B shares, vest in cash after the publication of the year-end financial statement during the fifth year after award.
more than 10 percent of employees world-wide. Each unit nominates individuals that have been identified according to performance, critical skills and potential. The nominations are calibrated in management teams locally and reviewed by both local and corporate Human Resources to ensure that there is a minimum of bias and a strong belief in the system. Participants selected obtain one extra matching share in addition to the one matching share for each contribution share purchased under the Stock Purchase Plan during a twelve-month program period. The plan was introduced in 2004.
the executiVe PerformAnce stock PlAn
The Executive Performance Stock Plan was also first introduced in 2004. The plan is designed to focus management on driving long-term financial performance and provide market competitive remuneration. Senior executives, including the ELT, are selected to obtain up to four or six extra shares (performance matching shares). This is in addition to the one matching share for each contribution share purchased under the all employee Stock Purchase Plan and the performance matching is subject to the fulfillment of an Earnings per Share (EPS) performance target. Since 2010, the CEO may obtain up to nine performance matching shares in addition to the Stock Purchase Plan matching share for each contribution share.
The Remuneration Committee has been satisfied that the use of an EPS performance target has been an appropriate measure to date. However, following its evaluation, the Remuneration Committee and the Board have decided to propose to the 2011 AGM a new set of performance measures for the 2011 Executive Performance Stock Plan.
The performance targets are not capable of being retested after the end of the three-year performance period. If the minimum required performance is not achieved, all matching shares subject to performance will lapse. The Board may also reduce the number of performance matching shares, if deemed appropriate, considering the Company’s financial results and position, conditions on the stock market and other relevant circumstances at the time of matching. The Remuneration Committee analyzes the financial results against those of competitors in the industry.
short-term VAriAble remunerAtion structure
short-term Variable remuneration as percentage of fixed salary
Percentage of short-term Variableremuneration opportunity
target level
maximumlevel
Actual paidfor 2010
Group financialtargets
unit/functionalfinancial targets
non-financialtargets
CEO 2010 40% 80% 64% 90% 0% 10%
CEO 2011 40% 80% – 90% 0% 10%
Average ELT 2010 1) 31% 62% 46% 73% 16% 11%
Average ELT 2011 1) 34% 68% – 61% 23% 16%1) Excludes CEO – differences in target and maximum levels from year to year are due to changes in the composition of the ELT.
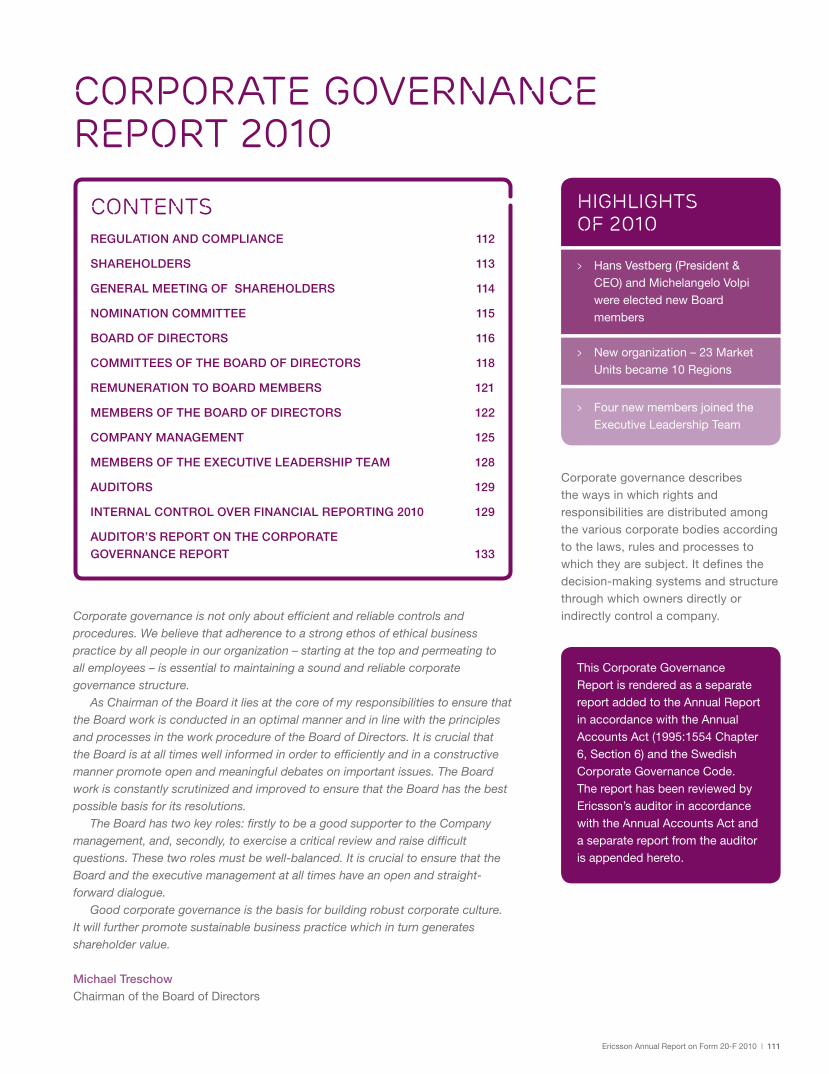
Ericsson Annual Report on Form 20-F 2010 | 111
Corporate governance is not only about efficient and reliable controls and procedures. We believe that adherence to a strong ethos of ethical business practice by all people in our organization – starting at the top and permeating to all employees – is essential to maintaining a sound and reliable corporate governance structure.
As Chairman of the Board it lies at the core of my responsibilities to ensure that the Board work is conducted in an optimal manner and in line with the principles and processes in the work procedure of the Board of Directors. It is crucial that the Board is at all times well informed in order to efficiently and in a constructive manner promote open and meaningful debates on important issues. The Board work is constantly scrutinized and improved to ensure that the Board has the best possible basis for its resolutions.
The Board has two key roles: firstly to be a good supporter to the Company management, and, secondly, to exercise a critical review and raise difficult questions. These two roles must be well-balanced. It is crucial to ensure that the Board and the executive management at all times have an open and straight-forward dialogue.
Good corporate governance is the basis for building robust corporate culture. It will further promote sustainable business practice which in turn generates shareholder value.
Michael TreschowChairman of the Board of Directors
Corporate governance describes the ways in which rights and responsibilities are distributed among the various corporate bodies according to the laws, rules and processes to which they are subject. It defines the decision-making systems and structure through which owners directly or indirectly control a company.
Corporate governanCe report 2010
This Corporate Governance Report is rendered as a separate report added to the Annual Report in accordance with the Annual Accounts Act (1995:1554 Chapter 6, Section 6) and the Swedish Corporate Governance Code. The report has been reviewed by Ericsson’s auditor in accordance with the Annual Accounts Act and a separate report from the auditor is appended hereto.
Highlights of 2010
> Hans Vestberg (President & CEO) and Michelangelo Volpi were elected new Board members
> New organization – 23 Market Units became 10 Regions
> Four new members joined the Executive Leadership Team
ContentsRegulaTion and coMpliance 112
ShaReholdeRS 113
geneRal MeeTing of ShaReholdeRS 114
noMinaTion coMMiTTee 115
BoaRd of diRecToRS 116
coMMiTTeeS of The BoaRd of diRecToRS 118
ReMuneRaTion To BoaRd MeMBeRS 121
MeMBeRS of The BoaRd of diRecToRS 122
coMpany ManageMenT 125
MeMBeRS of The execuTive leadeRShip TeaM 128
audiToRS 129
inTeRnal conTRol oveR financial RepoRTing 2010 129
audiToR’S RepoRT on The coRpoRaTe goveRnance RepoRT 133

112 | Ericsson Annual Report on Form 20-F 2010
Regulation and complianceexternal rules As a Swedish public limited liability company with securities quoted on NASDAQ OMX Stockholm as well as on NASDAQ New York, Ericsson is subject to a variety of rules that affect its governance. Major external rules include:
> The Swedish Companies Act
> Rulebook for issuers of NASDAQ OMX Stockholm
> The Swedish Corporate Governance Code (the “Code”) which is found on the website of the Swedish Corporate Governance Board who administrates the Code (www.corporategovernanceboard.se)
> NASDAQ New York Stock Market Rules – including applicable NASDAQ New York corporate governance requirements, subject to certain exemptions principally reflecting mandatory Swedish legal requirements
> Applicable requirements of the US Securities and Exchange Commission.
internal rules In addition, to ensure compliance with legal and regulatory requirements and the high ethical standards that we set for ourselves, Ericsson has internal rules that include:
> Code of Business Ethics
> Group Steering Documents including Group policies and directives, instructions and business processes for approval, control and risk management
> Code of Conduct to be applied in the product development, production, supply and support of Ericsson products and services worldwide.
The Board of Directors has also included internal rules in its work procedure.
compliance with the swedish corporate Governance codeThe Code has been applied by Ericsson since July 2005. Ericsson is committed to complying with best-practice corporate governance on a global level wherever possible. This includes continued compliance with the Code. Ericsson has not deviated from any of the provisions of the Code.
compliance with applicable stock exchange rulesThere has been no infringement of applicable stock exchange rules and Ericsson has complied with good stock market practice.
code of business ethicsEricsson’s Code of Business Ethics sets out how the Group achieves and maintains its high ethical standards. It summarizes the Group’s fundamental policies and directives.
The ethical code has been translated into 25 languages. This ensures that it is accessible to all employees and underpins the importance of ethical conduct in all business activities. During recruitment, employees sign a form to acknowledge that they are aware of the principles of the Code of Business Ethics. This procedure is repeated at regular intervals throughout the term of employment.
Through this process, Ericsson strives to ensure that high ethical standards are continuously upheld. All employees have an individual responsibility to ensure that business practice adheres to the rules of the Code of Business Ethics.
The Code of Business Ethics can be found at www.ericsson.com/article/code-of-business-ethics_429026570_c
Information on the Ericsson website does not form part of this Report.
CODE OF BUSINESS
ETHICS

Ericsson Annual Report on Form 20-F 2010 | 113
GoVernAnce structure
ownershiP PercentAGe (VotinG riGhts)
shaReholdeRs ownership structureAs of December 31, 2010 Telefonaktiebolaget LM Ericsson (the “Parent Company”), had 630,592 shareholders (according to the share register kept by Euroclear Sweden AB). Institutions, both Swedish and international, own almost 78 percent of the shares. The largest shareholders are Industrivärden, holding 19.39 percent of the votes (together with Handelsbankens Pensionsstiftelse and Pensionskassan SHB Försäkringsförening) and Investor, holding 19.33 percent of the votes.
A significant number of the shares held by foreign investors are nominee-registered, i.e. held off-record by banks, brokers and/or nominees. This means that the actual shareholder is not displayed in the share register or included in the shareholding statistics.
More information on Ericsson’s shareholders can be found in the chapter “Share Information” in the Annual Report.
shares and voting rightsThe share capital of the Parent Company consists of two classes of listed shares: A and B. Each Class A share carries one vote and each Class B share carries one tenth of one vote. Class A and B shares entitle the holder to the same proportion of assets and earnings. They also carry equal rights in terms of dividends.
The Parent Company may also issue Class C shares in order to create treasury stock to hedge variable remuneration programs resolved by the General Meeting. The Class C shares are converted into Class B shares before they are transferred to participants of the variable remuneration programs.
The members of the Board of Directors and the Executive Leadership Team have the same voting rights on shares as other shareholders.
Retail Swedish investors: 7.40%
Other: 3.63%
Foreign investors: 28.07%
Swedish institutions. 60.90%, of which: – Investor: 19.33% – Industrivärden: 19.39%
13,8
0%
53%
11%
XX%
19,33%
Unions
Board of Directors12 Directors elected by the Shareholders’ Meeting
3 Directors and 3 Deputies appointed by the Unions
President and CEO
Management
Audit Committee
Finance Committee
Remuneration Committee
NominationCommittee
ExternalAuditor
Shareholders’ MeetingAnnual General Meeting/
Extraordinary General Meeting
Source: Capital Precision

114 | Ericsson Annual Report on Form 20-F 2010
geneRal meeting of shaReholdeRsDecision making at General meetingsThe decision-making rights of Ericsson’s shareholders are exercised at General Meetings. Most resolutions at General Meetings are passed by a simple majority. However, the Swedish Companies Act requires qualified majorities in certain cases, for example:
> Amending the articles of association
> The resolution to transfer own shares to employees participating in employee share plans
the Annual General meeting of shareholdersThe Annual General Meeting (AGM) is held in Stockholm. The date and venue for the meeting is announced on the Ericsson website no later than in conjunction with the release of the third-quarter report.
Shareholders who cannot participate in person may be represented by proxy. Only named shareholders registered in the share register have voting rights. Nominee-registered shareholders who wish to vote may request to be entered into the share register by the record date for the AGM.
The AGM is held in Swedish and is simultaneously interpreted into English. All documentation provided by the Company is available in both Swedish and English.
The AGM gives shareholders the opportunity to raise questions relating to the operations of the Group. Ericsson always strives to ensure that the members of the Board of Directors and the Group management (the Executive
Leadership Team) are present to answer such questions. Shareholders and other interested parties may also correspond in writing with the Company at any time.
The auditor is always present at the AGM.
ericsson’s Annual General meeting 20101,836 shareholders attended the AGM held on April 13, 2010, including shareholders represented by proxy, representing approximately 62 percent of the votes.
The meeting was also attended by the Board of Directors, members of the Executive Leadership Team and the external auditor.
Decisions of the AGM 2010 included:
> Payment of a dividend of SEK 2.00 per share for 2009
> Re-election of Chairman of the Board of Directors, Michael Treschow
> Re-election of members of the Board of Directors, Roxanne S. Austin, Sir Peter L. Bonfield, Börje Ekholm, Ulf J. Johansson, Sverker Martin-Löf, Marcus Wallenberg, Nancy McKinstry, Anders Nyrén and Carl-Henric Svanberg
> Election of Hans Vestberg and Michelangelo Volpi as new members of the Board of Directors
> Board of Directors’ fees to remain unchanged:– Chairman: SEK 3,750,000– Other non-employed Board members: SEK 750,000 each– Chairman of the Audit Committee: SEK 350,000– Other non-employed members of the Audit Committee:
SEK 250,000 each– Chairmen and other non-employed members of the
Finance and Remuneration committees: SEK 125,000 each
> Approval for part of the Directors’ fees to be paid in the form of synthetic shares
> Approval of the remuneration policy for senior management
> Implementation of a Long-Term Variable Remuneration Program.
The minutes of the AGM 2010 are available at: www.ericsson.com/res/investors/docs/2010/agm/101119_minutes_agm.pdf. (Information on the Ericsson website does not form part of this Report).
annual general meeting 2011Ericsson’s Annual General Meeting 2011 will take place on April 13, at the Annex to the Ericsson Globe Arena in Stockholm.Shareholders who wish to have a matter considered at the AGM should make a written request to the Board in due time before the AGM. Further information on Ericsson’s website.
how to contact the Board of directors Telefonaktiebolaget LM EricssonThe Board of Directors’ SecretariatSE-164 83 Stockholm, [email protected]

Ericsson Annual Report on Form 20-F 2010 | 115
nomination committeeA Nomination Committee was elected by the AGM for the first time in 2001. Since then, each AGM has appointed a Nomination Committee, or resolved on the procedure for appointing the Nomination Committee.
The AGM 2010 resolved that the Nomination Committee shall consist of:
> Representatives of the four largest shareholders by voting power by the end of the month in which the AGM was held
> The Chairman of the Board of Directors.
However, as described in the procedure for appointing members, the Nomination Committee may include additional members following a request by a shareholder. The request must be justified by changes in the shareholder’s share ownership and be received by the Nomination Committee no later than December 31.
members of the nomination committeeIn addition to the Chairman of the Board of Directors, the current Nomination Committee consists of the four representatives appointed by the four shareholders with the largest voting power as of April 30, 2010:
> Jacob Wallenberg (Investor AB, Chairman of the Nomination Committeee)
> Carl-Olof By (AB Industrivärden, Svenska Handelsbankens Pensionsstiftelse and Pensionskassan SHB Försäkringsförening)
> Caroline af Ugglas (Livförsäkringsaktiebolaget Skandia)
> Marianne Nilsson (Swedbank Robur Fonder).
the tasks of the nomination committeeOver the years the tasks of the Nomination Committee have evolved to comply with the requirements of the Code. However, the main task of the Committee remains to propose candidates for election to the Board of Directors. In doing this, the Committee must not only orientate itself on the Company’s strategy and future challenges to be able to assess the competence and experience that is required by the Board, but also consider all applicable rules on the independence of the Board of Directors.
It also prepares remuneration proposals for resolution by the AGM for:
> Non-employed Directors elected by the AGM
> The auditor
> Members of the Nomination Committee.
To date, the Committee has not proposed that it should be paid any fees. When proposing auditors, the Nomination Committee selects candidates in cooperation with the Audit Committee of the Board.
The Committee also proposes a candidate for election of the Chairman of General Meetings.
work of the nomination committee for the AGm 2011
The Nomination Committee starts its work by going through a checklist of all its duties according to the Code and its procedure resolved by the AGM. It also sets a time plan for its work ahead. As understanding of Ericsson’s business is paramount to the members of the Committee, both the Chairman of the Board and the President and CEO have presented their views to the Committee on the Company’s position and strategy.
The Committee has also been thoroughly informed of the results of the evaluation of the Board work and procedures, including the performance of the Chairman of the Board. From this basis the Committee is able to make assessments on the competence and experience required by the Board members.
The Committee has also acquainted itself with the assessments made by the Company and the Audit Committee in terms of quality and efficiency of external auditor work, including recommendations regarding auditors and audit fees. Following the Chairman of the Boards’ announcement of his intention to resign from the Board, one main focus for the Nomination Committee this year has been to nominate a successor. As of February 21, 2011 the Nomination Committee has held 8 meetings.
Shareholders may submit proposals to the Nomination Committee at any time, but should do so in due time before the AGM to ensure that they are considered by the Committee. Further information is available on Ericsson’s website.
hoW to contact the nomination committeeTelefonaktiebolaget LM EricssonThe Nomination Committeec/o General Counsel’s OfficeSE-164 83 Stockholm, [email protected]

116 | Ericsson Annual Report on Form 20-F 2010
BoaRd of diRectoRs The Board of Directors is ultimately responsible for the organization of Ericsson and the management of its operations. It develops guidelines and instructions for day-to-day operations, managed by the President and CEO. In turn, the President and CEO ensures the Board is updated regularly on events of importance to the Group. This includes business development, results, financial position and the liquidity of the Group.
According to the Articles of Association, the Board of Directors shall consist of no less than 5 and no more than 12 directors, with no more than 6 deputies. In addition, under Swedish law, trade unions have the right to appoint three directors and their deputies to the Board.
Directors will serve from the close of one AGM to the close of the next, but can serve any number of consecutive terms.
While the President and CEO may be elected as a director of the Board, the Swedish Companies Act prohibits the President of a public company from being elected Chairman of the Board.
rules and regulationsEricsson strictly follows rules and regulations regarding conflicts of interest. Directors are disqualified from participating in any decision regarding agreements between themselves and Ericsson. The same applies for agreements between Ericsson and any third party or legal entity in which the Board member has an interest.
In order to ensure compliance with NASDAQ Stock Market Rules, the Audit Committee has implemented a procedure on related-party transactions. Furthermore, the Audit Committee has established a pre-approval process for non-audit services carried out by the external auditor.
composition of the board of Directors
The Board of Directors consists of 12 Directors, including the Chairman of the Board, elected by the shareholders at the AGM 2010, for the period until the close of the AGM 2011. It also includes three employee representatives, each with a deputy, appointed by the trade unions for the same period of time. The President and CEO, Hans Vestberg, is the only Board member who was also a member of Ericsson’s management during 2010.
work procedurePursuant to the Swedish Companies Act, the Board of Directors has adopted a work procedure that outlines rules for the distribution of tasks between the Board and its Committees as well as between the Board, its Committees and the President and CEO. This complements the regulation in the Swedish Companies Act and the Articles of Association of the Company. The work procedure is reviewed, evaluated and adopted by the Board at least once a year as required.
independenceThe Board of Directors and its Committees are subject to a variety of independence requirements. Ericsson applies independence rules in applicable Swedish law, the Swedish Corporate Governance Code, the NASDAQ Stock Market Rules and in the Sarbanes-Oxley Act of 2002. However, Ericsson has sought and received exemptions from certain requirements in the Sarbanes-Oxley Act and in the NASDAQ Stock Market Rules that are contrary to Swedish law.
The composition of the Board of Directors meets all applicable independence criteria.
The Nomination Committee concluded before the AGM 2010 that, for the purposes of the Code, at least six of the persons nominated to the Board were independent of Ericsson, its senior management and its major shareholders. These were Roxanne S. Austin, Sir Peter L. Bonfield, Ulf J. Johansson, Nancy McKinstry, Michael Treschow and Michelangelo Volpi.

Ericsson Annual Report on Form 20-F 2010 | 117
structure of the work of the board of Directors
The work of the Board follows a yearly cycle in order to address each of the duties of the Board appropriately and to be able to keep strategy, risk assessment and value creation high on the agenda.
> statutory meeting The yearly cycle starts with the statutory Board meeting which is held in connection with the AGM. At this meeting, members of each of the three Committees are appointed and the Board resolves on matters such as signatory power.
> first interim report meetingAt the next ordinary meeting, the Board handles the first interim report for the year.
> main strategy meetingVarious strategic issues are addressed in most of the Board meetings. However, in accordance with the annual cycle for the strategy process, this Board meeting is in essence dedicated to short and long-term strategies of the Group. Following the Board’s input and approval of the overall strategy, the strategy is cascaded throughout the entire organization, starting at the Global Leadership Summit with the top 250 managers in Ericsson.
> second interim report meeting In July, the Board convenes to handle the interim report for the second quarter of the year.
> follow-up on strategy & risk management meeting Following the summer, this meeting addresses particular strategy matters in further detail and finally confirms the Group strategy. The meeting also addresses the overall risk management of the Group.
> third interim report meeting and board evaluation A Board meeting is held at the end of October to handle the third-quarter interim report. The results of the Board evaluation are presented and discussed by the Board during this meeting.
> budget and financial outlook meetingThe last meeting of the calendar year addresses budget and financial outlook and a further analysis of internal and external risks.
> full-year financial results meetingAt the first meeting of the calendar year the Board focuses on the financial result of the entire year and handles the fourth-quarter report.
> Annual report meetingAt the second Board meeting in February, which closes the yearly cycle of work, the Board concludes the Annual Report.
As the Board is responsible for financial oversight, financials are presented and evaluated at each Board meeting. Each Board meeting generally also includes reports on committee work by the Chairman of each committee. In addition, minutes from the committee meetings are distributed to all Directors prior to the Board meeting.
At each Board meeting the President and CEO reports on business and market developments as well as the financial performance of the Company. The Board is regularly informed of developments in legal and regulatory matters of importance.
Q4 meeting– Financial result of the entire year
Board meetings
– annual cycle
Jan
Feb
Mar
Apr
JunJul
Aug
Sep
Oct
Nov
Dec
May
Q4 Q1
Q2Q3
Budget and financial outlook meeting
Annual report meeting– Board signs the annual report– Board training
Statutory meeting (in connection with AGM)– Appointment of Committee Members– Authorization to sign for the Company
Q1 meeting– Q1 Financial report
Q3 meeting– Q3 Financial report– Board work evaluation– Board training
Q2 meeting – Q2 Financial report
Main Strategy meeting
Follow-up Strategy & Risk Management Meeting
the boArD’s AnnuAl work cycle

118 | Ericsson Annual Report on Form 20-F 2010
Auditor involvement
The Board meets with Ericsson’s external auditor at least once a year to receive and consider the auditor’s observations. The auditor prepares reports for the management on the accounting and financial reporting practices of the Group.
The Audit Committee also meets with the auditor to receive and consider observations on the interim reports. The auditor has been instructed to report on whether the accounts, the management of funds and the general financial position of the Group are well controlled in all material respects.
The Board also reviews and assesses the process for financial reporting, as described later in “Internal control over financial reporting 2010”. Combined with the internal controls, the Board’s and the auditor’s review of interim and annual reports are deemed to give reasonable assurance on the quality of the financial reporting.
training of the board of Directors All new Directors receive comprehensive training tailored to their individual requirements. Introductory training typically includes meetings with the heads of the major businesses and functions and training arranged by NASDAQ OMX Stockholm on listing issues and insider rules. In addition, full-day training sessions are held twice a year for all Directors. The sessions enhance their knowledge of specific operations and issues as appropriate to ensure that the Board has knowledge and understanding at the forefront of technical development.As a rule, the Board receives Sustainability and Corporate Responsibility training at least once a year. Key focus areas in Board training 2010 were:
> Radio Technology, including R&D strategy and intellectual property rights
> Major trends impacting the competitive landscape.
work of the board of Directors in 2010Ten Board meetings were held in 2010. For attendance at Board meetings see the table on page 143. Among the matters addressed by the Board this year (apart from regular matters in the annual Board work cycle) were :
> A more consolidated and efficient go-to-market model with 10 Regions instead of 23 Market Units
> A redefined management team, the Executive Leadership Team, including two regional heads
> Continued effects of the general financial uncertainty in the market
> The causes and consequences of the general shortage of components that telecom equipment providers, including Ericsson, have experienced during the year
> The rollout of the multi-standard radio base station RBS 6000 – Ericsson’s first multi-standard base station.
> A number of acquisitions and divestments, including the acquisition of Nortel’s stake in the joint venture LG-Nortel.
board work evaluation
A key objective of the Board evaluation is to ensure that the Board is functioning well. This includes gaining an understanding of the issues which the Board thinks warrant greater scope and determining areas within the Board where additional competence is needed. The evaluation also serves as guidance for the work of the Nomination Committee.
Each year, the Chairman of the Board initiates and leads the evaluation of Board and Committee work and procedures. The evaluation tools include detailed questionnaires, interviews and discussions.
In 2010, the Chairman held individual meetings with all the Directors, following their response to two separate written questionnaires, one covering the Board work in general and the other the Chairman’s performance. The Chairman was not involved in the development, compilation or evaluation of the questionnaire which related to his performance, nor was he present when his performance was evaluated. The evaluations were thoroughly discussed and an action plan was developed in order to further improve the work of the Board.
committees of the BoaRd of diRectoRsThe Board of Directors has established three Committees: the Audit Committee, the Finance Committee and the Remuneration Committee. Members of each Committee are appointed for one year amongst the Board members in accordance with the principles set forth in the Swedish Companies Act and the Code.
The work of the Committees is mainly to prepare matters for final resolution by the Board. However, the Board has authorized each Committee to determine certain issues in limited areas. It may also on occasion provide extended authorization to determine specific matters.
If deemed appropriate, the Board of Directors and each Committee have the right to engage external expertise, either in general or in respect to specific matters.
Prior to every Board meeting, each Committee submits, in addition to minutes, a written summary to the Board on the issues handled or resolved since the previous ordinary Board meeting. In addition to the minutes and the written summary, the Chairman of the Committee also reports on the Committee work at each Board meeting.

Ericsson Annual Report on Form 20-F 2010 | 119
Audit committee
On behalf of the Board, the Audit Committee monitors the following:
> The scope and correctness of the financial statements
> Compliance with legal and regulatory requirements
> Internal control over financial reporting
> Risk management.
The Audit Committee also reviews the annual and interim financial reports and oversees the external audit process, including audit fees. This involves:
> Reviewing, with management and the external auditor, the financial statements. This includes conformity with generally accepted accounting principles
> Reviewing, with management, the reasonableness of significant estimates and judgments made in preparing the financial statements, as well as the quality of the disclosures in the financial statements
> Reviewing matters arising from reviews and audits performed.
The Audit Committee itself does not perform audit work. Ericsson has an internal audit function which reports to the Audit Committee and performs independent audits.
When applicable, the Committee is also involved in the preparatory work of proposing candidates for the election of the auditor. It also monitors Group transactions and the ongoing performance and independence of the auditor. This avoids conflicts of interest.
In order to ensure the auditor’s independence, the Audit Committee has established pre-approval policies and procedures for non-audit related services to be performed by the external auditor. Pre-approval authority may not be delegated to management.
Also in place are the following:
> A process for reviewing transactions with related parties
> A whistleblower procedure for the reporting of violations relating to accounting, internal control and auditing matters.
Alleged violations are investigated by Ericsson’s internal audit function in conjunction with the relevant Group Function. Information regarding any incidents are reported to the Audit Committee. The report includes measures taken, details of the responsible Group Function and the status of any investigation.
members of the AuDit committee
The Audit Committee consists of four Board members appointed by the Board. In 2010, the Audit Committee comprised Ulf J. Johansson (Chairman of the Committee), Roxanne S. Austin, Sir Peter L. Bonfield and Jan Hedlund.
All members are independent from the Company and senior management, except Jan Hedlund, who is appointed Board member by the unions pursuant to Swedish mandatory law. Each member is financially literate and familiar with the accounting practices of an international company such as Ericsson. At least one member must be an audit committee financial expert, in accordance with the Sarbanes-Oxley Act, Section 407. The Board of Directors has determined that Ulf J. Johansson, Roxanne S. Austin and Sir Peter L. Bonfield all satisfy this requirement.
Former authorized public accountant, Peter Markborn, is appointed external expert advisor to assist and advise the Audit Committee.
work of the AuDit committee
The Audit Committee held eight meetings in 2010. Directors’ attendance is reflected in the table on page 143. During the year, the Audit Committee reviewed the scope and results of external financial audits and the independence of the external auditor. It also monitored the external audit fees and approved non-audit services performed by the external auditor.
Certain additional non-audit services performed by the external auditor were approved by the Audit Committee Chairman under the Committee’s pre-approval policies and procedures. The Committee approved the annual audit plan for the internal audit function and reviewed its reports. Prior to publishing, the Committee also reviewed and discussed each interim report with the external auditor.
The Committee monitored the continued compliance with the Sarbanes-Oxley Act and the internal control and risk management process. It has also reviewed certain related-party transactions in accordance with its established process.
orGAnizAtion of the boArD work
FinanceCommittee(4 Directors)
> Financing
> Investing
> Customer credits
RemunerationCommittee(4 Directors)
> Remuneration policy
> Long-Term Variable Remuneration
> Executive compensation
AuditCommittee(4 Directors)
> Oversight over financial reporting
> Oversight over internal control
> Oversight over auditing
Board of Directors15 Directors

120 | Ericsson Annual Report on Form 20-F 2010
finance committee
The Finance Committee is primarily responsible for:
> Handling matters related to acquisitions and divestments
> Handling capital contributions to companies inside and outside the Ericsson Group
> Raising of loans, issuances of guarantees and similar undertakings, and the approval of financial support to customers and suppliers
> Continuously monitoring the Group’s financial risk exposure.
The Finance Committee is authorized to determine matters such as:
> Direct or indirect financing
> Provision of credits
> Granting of securities and guarantees
> Certain investments, divestments and financial commitments.
members of the finAnce committee
The Finance Committee consists of four Board members as appointed by the Board. In 2010, the Finance Committee comprised: Marcus Wallenberg (Chairman of the Committee), Anna Guldstrand, Anders Nyrén and Michael Treschow.
work of the finAnce committee in 2010
The Finance Committee held nine meetings in 2010. Directors’ attendance is reflected in the table on page 143. During the year the Finance Committee has approved numerous customer finance and credit facility arrangements with a continued focus on capital structure, cash flow and cash generating ability. It has also continuously monitored Ericsson’s financial position and credit exposure.
remuneration committeeThe Remuneration Committee’s main responsibility is to prepare for resolution by the Board of Directors matters regarding salary and other remuneration. This includes pension benefits of the President and CEO, the Executive Vice Presidents and other officers who report directly to the President and CEO. Other responsibilities include:
> Developing, monitoring and evaluating strategies and general guidelines for employee remuneration, including short-term variable remuneration and pension benefits
> Reviewing the results of short-term variable remuneration plans before pay out
> Preparation of the long-term variable remuneration program for referral to the Board and resolution by the General Meeting
> Preparation of targets for short-term variable remuneration for the following year, for resolution by the Board.
To achieve this, the Committee holds annual remuneration reviews with Company representatives. These reviews determine the strategic direction, and align program designs and pay policies with the business objectives.
Consideration is given to trends in remuneration, legislative changes, disclosure rules and the general global environment surrounding executive pay. The Committee reviews salary survey data before approving any salary adjustment for CEO direct reports. In addition the Committee prepares salary adjustments for the President and CEO for resolution by the Board.
members of the remunerAtion committee
The Remuneration Committee consists of four Board members as appointed by the Board. In 2010, the Remuneration Committee comprised: Michael Treschow (Chairman of the Committee), Börje Ekholm, Nancy McKinstry, and Karin Åberg.
Gerrit Aronson is appointed by the Remuneration Committee as an independent expert advisor to assist the Committee, particularly regarding international trends and developments.
work of the remunerAtion committee in 2010
The Remuneration Committee held eight meetings in 2010. Directors’ attendance is reflected in the table on page 143.
The Committee reviewed and prepared for resolution by the Board a proposal for the Long-Term Variable Remuneration Program 2010. This was approved by the AGM 2010. The Committee further resolved on salaries and short term variable pay for 2010 for CEO direct reports and prepared for resolution by the Board remuneration to the President and CEO, Hans Vestberg. The Committee also prepared a remuneration policy which was subsequently referred by the Board to the AGM for approval.
Towards the end of the year, the Committee concluded its analysis of the current long-term variable remuneration structure and remuneration policy. The resulting proposals will be referred to the AGM 2011 for resolution.
For further information on remuneration, fixed and variable pay, please see Note C29 “Information Regarding Members of the Board of Directors, the Group management and Employees” in the Annual Report and the “Remuneration Report” included the Annual Report.
members of the committees
FinanceCommittee
> Marcus Wallenberg (Chairman)
> Anna Guldstrand
> Anders Nyrén
> Michael Treschow
RemunerationCommittee
> Michael Treschow (Chairman)
> Börje Ekholm
> Nancy McKinstry
> Karin Åberg
AuditCommittee
> Ulf J Johansson (Chairman)
> Roxanne S. Austin
> Sir Peter L. Bonfield
> Jan Hedlund
Members of the Committees of the Board of Directors 2010

Ericsson Annual Report on Form 20-F 2010 | 121
RemuneRation to BoaRd memBeRsRemuneration to Board members not employed by the Company is proposed by the Nomination Committee for resolution by the Annual General Meeting.The Annual General Meeting 2010 approved the Nomination Committee’s proposal for fees to the non-employed Board members for Board and Committee work. For information on Board of Directors’ fees 2010, please refer to Notes to the Consolidated Financial Statements – Note C29 “Information Regarding Members of the Board of Directors, the Group Management and Employees” in the Annual Report. The Annual General Meeting 2010 also approved the Nomination Committee’s proposal that Board members may be paid part of their Board fee in the form of synthetic shares. A synthetic share gives the right to receive a future cash payment of an amount which corresponds to the market value of a class B share in Ericsson at the time of payment. The purpose of paying part of the Board of Director’s fee in the form of synthetic shares is to further align the Directors’ interest with shareholder interest. For more information on the terms and conditions of the synthetic shares, please refer to the notice convening the Annual General Meeting 2010 at www.ericsson.com/thecompany/investors/general-meetings. (Information on the Ericsson website does not form part of this document.)
Directors’ AttenDAnce AnD fees 2010
fees resolved by the AGm 2010 number of board/committee meetings attended
board member board fees 1) committee fees board Audit committee finance committee remuneration committee
Michael Treschow 3,750,000 250,000 10 9 8
Sverker Martin-Löf 750,000 10
Marcus Wallenberg 750,000 125,000 9 9
Roxanne S. Austin 750,000 250,000 7 6
Sir Peter L. Bonfield 750,000 250,000 10 8
Börje Ekholm 750,000 125,000 9 7
Ulf J. Johansson 750,000 350,000 10 8
Nancy McKinstry 750,000 125,000 10 7
Anders Nyrén 750,000 125,000 10 9
Carl-Henric Svanberg 750,000 8
Hans Vestberg – 8
Michelangelo Volpi 2) 750,000 6
Anna Guldstrand 15,000 5) 10 9
Jan Hedlund 15,000 5) 10 8
Karin Åberg 15,000 5) 10 8
Monica Bergström 3) 4,500 5) 3
Pehr Claesson 15,000 5) 10
Kristina Davidsson 15,000 5) 10
Karin Lennartsson 4) 10,500 5) 7
total number of meetings 10 8 9 81) Non-employed Directors can choose to receive part of their Board fee (exclusive of Committee fees) in the form of synthetic shares.2) Elected as Board member as of April 13, 2010.3) Resigned as Deputy employee representative as of April 13, 2010.4) Deputy employee representative as of April 13, 2010.
5) Employee representative Board members and their deputies are not entitled to a Board fee but a compensation in the amount of SEK 1,500 per attended Board meeting.

122 | Ericsson Annual Report on Form 20-F 2010
roxanne s. Austin (first elected 2008). Member of the Audit Committee.Born 1961. B.B.A. in Accounting, University of Texas, San Antonio, USA.board member: Abbott Laboratories, Teledyne Technologies Inc. and Target Corporation. holdings in ericsson 1): 3,000 Class B shares.Principal work experience and other information: President of Austin Investment Advisors since 2004. President and CEO of Move Networks Inc. 2009–2010. President and CEO of DIRECTV 2001–2003. Corporate Senior Vice President and Chief Financial Officer of Hughes Electronics Corporation 1997–2000, which she joined in 1993. Previously a partner at Deloitte & Touche. Member of the board of trustees of the California Science Center. Member of the California State Society of certified Public Accountants and the American Institute of Certified Public Accountants.
sir Peter l. bonfield (first elected 2002). Member of the Audit Committee.Born 1944. Honors degree in Engineering, Loughborough University, Leicestershire, UK. board chairman: NXP Semiconductors.Deputy chairman: British Quality Foundation.board member: Mentor Graphics Inc., Sony Corporation, TSMC and Actis Capital LLP.holdings in ericsson 1): 4,400 Class B shares.Principal work experience and other information: CEO and Chairman of the Executive Committee of British Telecommunications plc. 1996–2002. Chairman and CEO of ICL plc 1990–1996. Positions with STC plc and Texas Instruments Inc. Member of the Advisory Boards of New Venture Partners LLP, the Longreach Group and Apax Partners LLP. Board Mentor of CMi. Senior Advisor, Rothschild, London. Fellow of the Royal Academy of Engineering.
börje ekholm (first elected 2006) Member of the Remuneration Committee.Born 1963. Master of Science in Electrical Engineering, Royal Institute of Technology, Stockholm. Master of Business Administration, INSEAD, France.board chairman: Royal Institute of Technology, Stockholm.board member: Investor AB, AB Chalmersinvest, EQT Partners AB, Husqvarna AB, Lindorff Group AB, the Royal Institute of Technology, Stockholm and Scania. holdings in ericsson 1): 30,760 Class B shares.Principal work experience and other information: President and CEO of Investor AB since 2005. Formerly Head of Investor Growth Capital Inc. and New Investments. Previous positions at Novare Kapital AB and McKinsey & Co Inc.
memBeRs of the BoaRd of diRectoRsboard members elected by the Annual General meeting 2010
michael treschow (first elected 2002). Chairman of the Board of Directors.Chairman of the Remuneration Committee. Member of the Finance Committee.Born 1943. Master of Science, Lund Institute of Technology, Sweden. board chairman: Unilever NV, and Unilever PLC. board member: ABB Ltd and the Knut and Alice Wallenberg Foundation.holdings in ericsson 1): 164,008 Class B shares.Principal work experience and other information: Board Chairman of the Confederation of Swedish Enterprise 2004–2007. President and CEO of AB Electrolux 1997–2002 and Chairman of its Board of Directors 2004–2007. Earlier experience includes positions in Atlas Copco, where he served as President and CEO 1991–1997. Member of the Royal Academy of Engineering Sciences.
marcus wallenberg (first elected 1996). Deputy Chairman of the Board of Directors. Chairman of the Finance Committee. Born 1956. Bachelor of Science of Foreign Service, Georgetown University, USA.board chairman: Skandinaviska Enskilda Banken, Saab AB and AB Electrolux.board member: AstraZeneca PLC, Stora Enso Oy, the Knut and Alice Wallenberg Foundation and Temasek Holdings Limited. holdings in ericsson 1): 1,200 Class A shares and 140,800 Class B shares.Principal work experience and other information: Positions in Investor AB, wherehe served as President and CEO 1999–2005. Prior to this he was Executive Vice President at Investor. Previous employers include Stora Feldmühle AG, Citicorp, Citibank and Deutsche Bank.
sverker martin-löf (first elected 1993). Deputy Chairman of the Board of Directors.Born 1943. Doctor of Technology and Master of Engineering, Royal Institute ofTechnology, Stockholm.board chairman: Skanska AB, Svenska Cellulosa Aktiebolaget SCA, SSAB and AB Industrivärden. board member: Svenska Handelsbanken.holdings in ericsson 1): 10,400 Class B shares.Principal work experience and other information: President and CEO of Svenska Cellulosa Aktiebolaget SCA 1990–2002, where he was employed 1977–1983 and 1986–2002. Previous positions at Sunds Defibrator and Mo och Domsjö AB.

Ericsson Annual Report on Form 20-F 2010 | 123
carl-henric svanberg (first elected 2003)Born 1952. Master of Science, Linköping Institute of Technology. Bachelor of Science in Business Administration, University of Uppsala. board chairman: BP p.l.c. board member: Melker Schörling AB and University of Uppsala.holdings in ericsson 1): 3,234,441 Class B shares.Principal work experience and other information: President and CEO of Telefonaktiebolaget LM Ericsson 2003-2009. President and CEO of Assa Abloy AB 1994–2003. Various positions within Securitas AB 1986–1994 and Asea Brown Boveri (ABB) 1977–1985. Member of the Steering Committee of the Global Alliance for Information and Communication Technologies and Development (GAID), the External Advisory Board of the Earth Institute at Columbia University and the Advisory Board of Harvard Kennedy School. Holds Honorary Doctorates at Luleå University of Technology and Linköping University and is the recipient of the King of Sweden’s medal for his contribution to Swedish industry.
hans Vestberg (first elected 2010)Born 1965. Bachelor of Business Administration and Economics, University of Uppsala.board chairman: ST-Ericsson and Svenska Handbollförbundet.board member: Sony Ericsson Mobile Communications AB and Thernlunds AB. holdings in ericsson 1): 54,368 Class B shares.Principal work experience and other information: President and CEO as of January 1, 2010. First Executive Vice President until December 31, 2009. Chief Financial Officer and Head of Group Function Finance until October 31, 2009. Previously Executive Vice President and Head of Business Unit Global Services. Has held various positions in the Company since 1988, including Vice President and Head of Market Unit Mexico and Head of Finance and Control in USA, Brazil and Chile.
michelangelo Volpi (first elected 2010)Born 1966. Bachelor of Science in Mechanical Engineering and Masters in Manufacturing Systems Engineering from Stanford University, USA. MBA from the Stanford Graduate School of Business, USA. board member: None.holdings in ericsson 1): None.Principal work experience and other information: Partner at Index Ventures since July 2009. Previously CEO of Joost Inc.. Employed by Cisco from 1994-2007 in positions including Senior Vice President & General Manager of the Routing and Service Provider Technology Group and Chief Strategy Officer. Has also worked for Hewlett Packard in the optoelectronics division.
ulf J. Johansson (first elected 2005) Chairman of the Audit Committee.Born 1945. Doctor of Technology and Master of Science in Electrical Engineering,Royal Institute of Technology, Stockholm. board chairman: Acando AB, Eurostep Group AB, Novo A/S,Novo Nordisk Foundation, and Trimble Navigation Ltd. board member: Jump Tap Inc.holdings in ericsson 1): 6,435 Class B shares.Principal work experience and other information: Founder of Europolitan Vodafone AB, where he was the Chairman of the Board 1990–2005. Previous positions at Spectra-Physics AB as President and CEO and at Ericsson Radio Systems AB. Member of the Royal Academy of Engineering Sciences.
nancy mckinstry (first elected 2004) Member of the Remuneration Committee.Born 1959. Master of Business Administration in Finance and Marketing, Columbia University, USA. Bachelor of Arts in Economics, University of Rhode Island, USA.board chairman: CEO and Chairman of the Executive Board of Wolters Kluwer n.v.board member: TiasNimbas Business School.holdings in ericsson 1): 4,000 Class B shares.Principal work experience and other information: CEO and Chairman of the Executive Board of Wolters Kluwer n.v. President and CEO of CCH Legal Information Services 1996–1999. Previous positions at Booz, Allen & Hamilton, and New England Telephone Company. Member of the Advisory Board of the University of Rhode Island, the Advisory Council of the Amsterdam Institute of Finance, the Dutch Advisory Council of INSEAD, the Board of Overseers of Columbia Business School and the Advisory Board of the Harrington School of Communication and Media.
Anders nyrén (first elected 2006) Member of the Finance Committee.Born 1954. Graduate of Stockholm School of Economics, Master of Business Administration from Anderson School of Management, UCLA, USA.board chairman: Sandvik AB. Vice Chairman Svenska Handelsbanken.board member: Svenska Cellulosa Aktiebolaget SCA, AB Industrivärden, SSAB, AB Volvo, Ernströmgruppen and Stockholm School of Economics. holdings in ericsson 1): 6,686 Class B shares.Principal work experience and other information: President and CEO of Industrivärden since 2001. CFO and EVP of Skanska AB 1997–2001. Director Capital Markets of Nordbanken 1996–1997. CFO and EVP of Securum AB 1992–1996. Managing Director of OM International AB 1987–1992. Earlier positions at STC Scandinavian Trading Co AB and AB Wilhelm Becker.
business DriVers 2009

124 | Ericsson Annual Report on Form 20-F 2010
memBeRs of the BoaRd of diRectoRsboard members and deputies appointed by the unions
Jan hedlund (first appointed 1994)Employee representative, Member of the Audit CommitteeBorn 1946. Appointed by the IF Metall union. holdings in ericsson 1): 964 Class B shares. Employed since 1982. Previously working with model production mechanics within Business Unit Networks and currently working full time as union representative.
Anna Guldstrand (first appointed 2004)Employee representative, Member of the Finance CommitteeBorn 1964. Appointed by the union The Swedish Association of Graduate Engineers. holdings in ericsson 1): 1,667 Class B shares.Employed since 1996. Working as knowledge manager within Business Unit Global Services.
karin Åberg (first appointed 2007)Employee representative, Member of the Remuneration CommitteeBorn 1959. Appointed by the union Unionen. holdings in ericsson 1): 1,900 Class B shares.Employed since 1995. Working as Service Engineer within Business Unit Global Services.
kristina Davidsson (first appointed 2006)Deputy employee representativeBorn 1955. Appointed by the IF Metall union. holdings in ericsson 1): 1,146 Class B shares. Employed since 1995. Previously working as repairman within Business Unit Networks and currently working full time as union representative.
Pehr claesson (first appointed 2008)Deputy employee representative Born 1966. Appointed by the union The Swedish Association of Graduate Engineers. holdings in ericsson 1): 619 Class B sharesEmployed since 1997. Working with marketing and communication for Consulting and Systems Integration within Business Unit Global Services.
karin lennartsson (first appointed 2010)Deputy employee representativeBorn 1957. Appointed by the Unionen union. holdings in ericsson 1): 328 Class B shares.Employed since 1976. Working as Process Expert within Group Function Finance – Process and Quality.
Hans Vestberg was the only Director who held an operational management position at Ericsson in 2010. No Director has been elected pursuant to an arrangement or understanding with any major shareholder, customer, supplier or other person.
1) The number of Class B shares (and Class A shares, if applicable) includes holdings by related natural or legal persons and American Depositary Receipts, where applicable.

Ericsson Annual Report on Form 20-F 2010 | 125
ericsson GrouP mAnAGement system
company managementthe President/ceo and Group management
The Board of Directors appoints the President and CEO and the Executive Vice Presidents. The President and CEO is responsible for the management of day-to-day operations and is supported by the Group management, called the Executive Leadership Team (ELT). In addition to the President and CEO, the ELT consists of heads of Group functions, heads of business units, two regional heads and the Chief Brand Officer.The role of the ELT is to:
> Establish a long-term vision, a strong corporate culture and group strategies and policies, all based on objectives stated by the Board
> Determine targets for operational units, allocate resources and monitor unit performance
> Secure operational excellence and realize global synergies through efficient organization of the Group.
remuneration of the executive leadership team A Remuneration policy including guidelines on remuneration and other employment terms for the ELT were approved by the AGM 2010. For further information on fixed and variable remuneration, see the Remuneration Report and Notes to the Consolidated Financial Statements – Note C29, “Information Regarding Members of the Board of Directors, the Group management and Employees” in the Annual Report.
the ericsson Group management system The CEO and heads of Group functions have implemented a management system to ensure that the business is managed:
> So that the objectives of Ericsson’s major stakeholders (customers, shareholders, employees) are fulfilled
> Within established risk limits and with reliable internal control
> So the Company is compliant with applicable laws, listing requirements and governance codes and fulfills its corporate social responsibilities.
Ericsson is ISO 9001 (quality) and ISO 14001 (environment)globally certified and ISO 27001 (information security) certified in selected units. Certification to OHSAS 18001 (health & safety) is ongoing. The management system is an important foundation and is continuously evaluated and improved in line with ISO requirements.
The Ericsson Group Management System comprises three elements:
> Management and control: corporate culture, objective setting, strategy formulation and steering documents such as Group policies and directives
> Operational processes and IT tools: to support operational excellence and leverage Ericsson’s scale advantages
> Organization and resources.
Risk management is an integrated part of the Ericsson Group Management System.
mAnAGement AnD control
strategy, targets and monitoring
Ericsson uses balanced scorecards as tools for translating strategic objectives into a set of performance indicators for its operational units. These focus primarily on:
> Market and customer performance
> Competitive position
> Internal efficiency
> Financial performance
> Employee satisfaction and empowerment.
Based on the annual strategy work, these scorecards are updated with targets for each unit for the next year and communicated throughout the organization. The balanced scorecard is also used as a management tool to align operating unit and individual goals to Company goals, follow up progress and monitor identified risks.
CustomersKey Stakeholders
Business Environment
The Ericsson Business Processes
Organization and Resources
Management and ControlVision Policies and Directives
Corporate Culture
PerformanceEvaluation
PerformanceImprovement
ObjectivesStrategies
Results
IT
Satisfaction through Value Deliverables
Demands and Expectations

126 | Ericsson Annual Report on Form 20-F 2010
corporate culture
Corporate culture has long been acknowledged as an important factor for driving behavior, not only for compliance but also in communication, decision making, efficiency and reaching objectives. Respect, professionalism and perseverance are the values that underpin Ericsson’s culture, guiding daily work, relationships and business. Consequently, executive management makes the communication and development of Ericsson’s culture a key task in the management of the Group.
Group policies and directives
Group-wide policies and directives govern how the organization works. These include a Code of Business Ethics, policies on roles and responsibilities, segregation of duties, capital expenditures, management of intellectual property rights, financial reporting, environmental matters, and risk management.
operational processes and it tools
As a market leader, Ericsson tries to utilize the competitive advantages that are gained through scale and has implemented common processes and IT tools across all its operational units. Through management and continuous improvement of these processes and IT tools, Ericsson reduces costs with standardized internal controls and performance indicators.
organization and resources
Ericsson is operated in two dimensions:
> Legal entities: more than 200 companies in more than 100 countries
> Operational units: Four business units and ten regions.
In addition, Group functions coordinate Ericsson’s strategies, operations and resource allocation and define the necessary directives, processes and organization for the effective governance of the Group.
risk management
Ericsson’s risk management is integrated with the business and its operational processes and is a part of the Ericsson Group Management System to ensure accountability, effectiveness, efficiency, business continuity and compliance with corporate governance, legal and other requirements. The Board of Directors is also actively engaged in the Company’s risk management. Risks related to set long-term objectives are discussed and strategies are formally approved by the Board as part of the annual strategy process. Risks related to annual targets for the Company are also reviewed by the Board and then monitored continuously during the year. Certain transactional risks require specific Board approval, e.g. acquisitions, management remuneration, borrowing or customer finance in excess of pre-defined limits.
strAteGic AnD tActicAl risks
Strategic risks constitute the highest risk to the Company if not managed properly as they could have a long-term impact. Ericsson therefore reviews its long-term objectives, main strategies and business scope on an annual basis and continuously works on the tactics to reach these objectives and mitigate any risks identified.
ericsson’s core VAlues
Target Setting (12 month horizon) Related risk identification and mitigation
Board Target ApprovalReview of one-year risks
Board Follow-up Strategy and Risk Management meeting
Board Main Strategy Meeting
Group Management Strategy directives Quantitative and qualitative situation analysis
Group Strategy Development (five year perspective)
New Business Development
Jan
Feb
Mar
Apr
JunJul
Aug
Sep
Oct
Nov
Dec
May
Q4 Q1
Q2Q3
Quarterly risk monitoring
Business Unit & Group Function Strategy planningStrategic risk identification and mitigation
Global Strategy Conference for senior management
strAteGic, tArGet settinG AnD risk mAnAGement cycle
ProfessionalismRespect
Perseverance

Ericsson Annual Report on Form 20-F 2010 | 127
In the annual strategy and target setting process, objectives are set for the next five years, risks and opportunities are assessed and strategies are developed to achieve the objectives. The strategy process in the Company is well established and involves regions, business units and Group functions. The strategy is finally summarized and discussed in a yearly senior management meeting with approximately 250 managers from all parts of the business. By involving all parts of the business in the process, potential risks are identified early and mitigating actions can be incorporated in the strategy and in the annual target process following the finalization of the strategy.
Technology development, industry and market fundamentals as well as the development of the economy are key components in the evaluation of risks related to Ericsson’s long-term objectives.
The outcome from the strategy process forms the basis for the annual target process which involves regions, business units and Group functions. Risks and opportunities linked to the targets are identified as part of this process together with actions to mitigate the identified risks. Follow-up of targets, risks and mitigating actions are reported and discussed continuously in business unit and region steering groups as well as being reviewed by the Board of Directors.
The Company has been using the Balanced Scorecard concept to structure its targets, risks and opportunities for many years. For 2010 risks and opportunities were identified and analyzed in the five balanced scorecard perspectives. For more information on risks related to Ericsson’s business, see Risk Factors.
oPerAtionAl AnD finAnciAl risks
Operational risks are owned and managed by operational units. Risk management is embedded in various process controls, such as decision tollgates and approvals. Certain cross-process risks, such as information security/IT, corporate
responsibility & business continuity and insurable risks are centrally coordinated. Financial risk management is governed by a Group policy and carried out by the Treasury and Customer Finance functions, both supervised by the Finance Committee. The policy governs risk exposures related to foreign exchange, liquidity/financing, interest rates, credit risk and market price risk in equity instruments. For further information on financial risk management, see Notes to the Consolidated Financial Statements – Note C14, “Trade Receivables and Customer Finance”, Note C19, “Interest-Bearing Liabilities” and Note C20, “Financial Risk Management and Financial Instruments”.
comPliAnce risks
Ericsson has implemented Group policies and directives to ensure compliance with applicable laws and regulations, including a Code of Business Ethics and a Code of Conduct. Risk management is integrated in the Company’s business processes. Policies and controls are implemented to ensure compliance with financial reporting standards and stock marketregulations, e.g. the US Sarbanes-Oxley Act.
monitorinG AnD AuDits
Company management monitors the compliance with policies, directives and processes through internal self-assessment within all units. This is complemented by internal and external audits. External financial audits are performed by PwC, and ISO/management system audits by Det Norske Veritas, DNV. Internal audits are performed by the company’s internal audit function which reports to the Audit Committee. Audits of suppliers are also conducted in order to secure compliance with agreed key performance indicators and Ericsson’s Code of Conduct which is mandatory for suppliers to the Ericsson Group.
Preparations Establish gross list Prioritize risks Assign responsibility Manage risks
Leadership Team meeting and workshop
Compile input:> Business plan/Growth plan
SWOT and risks> Previously identified risks> Scorecard and target
descriptions> Preparatory meeting/
workshop> BCM for local operation
Consider each scorecard perspectiveConsider risk areas to make additions to list:> External environment
(e.g. political risk)> Customers> Competitors> Suppliers/subcontractors> Internal operations> Competence> Contractual conditions> Product roadmaps
> Group similar risks together> Rank> Prioritize
Assign responsibility for managing each top risk to a Leadership Team member
Develop mitigation actions (Leadership Team member)Secure risk reviews in connection with performance reviews
Process to iDentify AnD mAnAGe oPerAtionAl risks for reGions AnD business units

128 | Ericsson Annual Report on Form 20-F 2010
HansVestberg PresidentandCEO(since January 1, 2010). Born 1965. Bachelor of Business Administration, University of
Uppsala. Boardmember: Sony Ericsson Mobile Communications
AB and Thernlunds AB. Chairman: ST-Ericsson and Svenska Handbollförbundet. HoldingsinEricsson1): 54,368 Class B shares. Background: Chief Financial Officer and Head of Group
Function Finance until October 31, 2009. Previously Executive Vice President and Head of Business Unit Global Services. Has held various positions in the Company since 1988, including Vice President and Head of Market Unit Mexico and Head of Finance and Control in USA, Brazil and Chile.
JanFrykhammar ExecutiveVicePresidentandChiefFinancialOfficerand
HeadofGroupFunctionFinance(since 2009). Born 1965. Bachelor of Business Administration and Economics,
University of Uppsala. Boardmember: Sony Ericsson Mobile Communications
AB, ST-Ericsson. HoldingsinEricsson1): 3,650 Class B shares. Background: Previously Senior Vice President and Head
of Business Unit Global Services. Has held various positions within Ericsson such as Sales and Business Control in Business Unit Global Services, CFO in North America and Vice President, Finance and Commercial within the Global Customer Account for Vodafone.
JohanWibergh ExecutiveVicePresident(since January 1, 2010)and
HeadofBusinessUnitNetworks(since 2008). Born 1963. Master of Computer Science, Linköping Institute of
Technology. HoldingsinEricsson1): 19,967 Class B shares. Background: President of Ericsson Brazil. Has also been
President of Market Unit Nordic and Baltics, Vice President and Head of Sales at Business Unit Global Services.
CesareAvenia ChiefBrandOfficer(since 2010). Born 1950. Bachelor’s degree of Electronics engineering,
University of Naples, Italy. Boardmember: Member of the Steering Committee for
Innovation and Technology Services within the Association of Telecom service providers within Confindustria, the National Association of Industralists in Italy.
HoldingsinEricsson1): 11,618 Class B shares. Background:Previously Head of Market Unit Italy.
CarlOlofBlomqvist SeniorVicePresident,GeneralCounselandHeadof
GroupFunctionLegalAffairs(since 1999). Born 1951. Master of Law, LLM, University of Uppsala. HoldingsinEricsson1): 1,216 Class A shares and 38,914
Class B shares. Background: Previously partner of Mannheimer Swartling
law firm.
BinaChaurasia SeniorVicePresidentandHeadofGroupFunction
HumanResourcesandOrganization (since November 2010).
Born 1962. Holds a Master of Science in Management and Human
Resources from the Ohio State University and a Masters of Arts in Philosophy from the University of Wisconsin.
HoldingsinEricsson1): 11,627 Class B shares. Background: Joined Ericsson from Hewlett Packard,
where she was the Vice President of Global Talent Management. Has also held senior HR leadership roles at Gap, Sun Microsystems and PepsiCo/Yum.
HåkanEriksson SeniorVicePresident,ChiefTechnologyOfficer,Head
ofGroupFunctionTechnology&PortfolioManagement(since2003)andHeadofEricssoninSiliconValley(since January 1, 2010).
Born 1961. Master of Science and Honorary Ph D, Linköping Institute
of Technology. Boardmember: Vestas.
HoldingsinEricsson1): 32,130 Class B shares. Background: Previously Senior Vice President and Head
of Research and Development. Has held various positions within Ericsson since 1986.
MEMBERS OF THE EXECUTIVE LEADERSHIP TEAM

Ericsson Annual Report on Form 20-F 2010 | 129
DouglasL.Gilstrap SeniorVicePresidentandHeadofGroupFunction
Strategy(since 2009). Born 1963. Bachelor in accounting from the University of Richmond,
Master of Business Administration, Emory University, Atlanta.
HoldingsinEricsson1): 2,643 Class B shares. Background: CFO and Co-Founder of Asia Pacific
Exploration Consolidated (APEC), Has also held various global managerial positions in different companies within the telecommunications and IT sector for more than 15 years.
MatsH.Olsson HeadofRegionChina&NorthEastAsia
(since 2010). Born 1954. Master of Business Administration from the Stockholm
School of Economics. HoldingsinEricsson1): 43,088 Class B shares. Background: Previously Head of Market Unit Greater
China and has held various positions in Asia for Ericsson. Appointed President of Ericsson Greater China in 2004, with overall responsibility for Mainland China, Hong Kong, Macao and Taiwan.
MagnusMandersson SeniorVicePresidentandHeadofBusinessUnitGlobal
Services(since 2010). Born 1959. Bachelor of Business Administration, University of Lund. HoldingsinEricsson1): 8,605 Class B shares.
Background: Previously Head of Business Unit CDMA, Head of Market Unit Northern Europe and Global Customer Account Deutsche Telekom AG.
RimaQureshi SeniorVicePresidentandHeadofBusinessUnitCDMA
MobileSystems(since 2010). Born 1965. Holds a Bachelor’s degree of Information Systems and
a Master’s degree of administration, McGill University, Montreal, Canada.
HoldingsinEricsson1): 2,662 Class B shares Background: Also serves as head of Ericsson Response.
Previously head of the AT&T Improvement Program within Market Unit North America.
AngelRuiz HeadofRegionNorthAmerica(since 2010). Born 1956. Bachelor’s degree in Electrical Engineering from University
of Central Florida and a Master’s degree in Management Science and Information Systems from Johns Hopkins University, USA.
HoldingsinEricsson1): 21,688 Class B shares. Background: Previously Head of Market Unit North
America. He joined Ericsson in 1990 and has held a variety of sales and managerial positions within the company, including heading up the global account teams for Cingular/SBC/BellSouth (now AT&T). Appointed President of Ericsson North America in 2001.
HenrySténson SeniorVicePresidentandHeadofGroupFunction
Communications(since 2002). Born 1955. Studied law, sociology and political science, Linköping
University and at the Swedish War Academy, Karlberg, Stockholm.
Boardmember: Stronghold Invest AB. HoldingsinEricsson1): 27,855 Class B shares. Background: Previously Head of SAS Group
Communication.
JanWäreby SeniorVicePresidentandHeadofBusinessUnit
Multimedia(since 2007). Born 1956. Master of Science, Chalmers University, Göteborg. Boardmember: Sony Ericsson Mobile Communications
AB, ST-Ericsson. HoldingsinEricsson1): 47,551 Class B shares. Background: Executive Vice President and Head of Sales
and Marketing for Sony Ericsson Mobile Communications from 2002-2006.

130 | Ericsson Annual Report on Form 20-F 2010
auditoRsAccording to the Articles of Association, the Parent Company shall have no less than one and no more than three registered public accounting firms as external independent auditors. The auditors have been elected by the shareholders at the Annual General Meeting for periods of four years. However, according to a recent change in the Swedish Companies Act, the mandate period of the Auditors shall be one year, unless the Articles of Association provides for a longer mandate period up to four years. The auditors report to the shareholders at General Meetings.
The auditors:
> Update the Board of Directors regarding the planning, scope and content of the annual audit
> Examine the interim and year-end financial statements to assess accuracy and completeness of the accounts and adherence to accounting standards and policies
> Advise the Board of Directors of non-audit services performed, the consideration paid and other issues that determine the auditors’ independence.
For further information on the contacts between the Board and the auditors, please see “Work of the Board of Directors” earlier in the report.
All Ericsson’s quarterly reports are reviewed by the auditors.
current auditorPricewaterhouseCoopers AB was elected at the Annual General Meeting 2007 for a period of four years until the close of the Annual General Meeting 2011.
PricewaterhouseCoopers AB has appointed Peter Clemedtson, Authorized Public Accountant, to serve as auditor in charge. Peter Clemedtson is also auditor in charge of Skandinaviska Enskilda Banken.
fees to the auditorEricsson paid the fees (including expenses) for audit-related and other services listed in the table in Notes to the Consolidated Financial Statements – Note C31, “Fees to Auditors” in the Annual Report.
inteRnal contRol oveR financial RepoRting 2010This section has been prepared in accordance with the Annual Accounts Act and the Swedish Corporate Governance Code and is limited to internal control over financial reporting.
Since Ericsson is listed in the United States, the requirements outlined in the Sarbanes-Oxley Act (SOX) apply. These regulate the establishment and maintenance of internal controls over financial reporting as well as management’s assessment of the effectiveness of the controls.
In order to comply with SOX, the Company has implemented detailed documented controls and testing and reporting procedures based on the COSO framework for internal control. The COSO framework is issued by the Committee of Sponsoring Organizations of the Treadway Commission.
Management’s internal control report according to SOX will be included in Ericsson’s Annual Report on Form 20-F and filed with the SEC in the United States.
During 2010, the Company has included operations of acquired entities as well as continued to improve the design and execution of its financial reporting controls.
Disclosure policiesEricsson’s financial disclosure policies aim to ensure transparent, relevant and consistent communication with the equity and debt investors on a fair and equal basis. This will support a fair market value for Ericsson shares. Ericsson wants current and potential investors to have a good understanding of how the Company works, including operational performance, prospects and potential risks.
To achieve these objectives, financial reporting and disclosure must be:
> Transparent – enhancing understanding of the economic drivers and operational performance of the business, building trust and credibility
> Consistent – comparable in scope and level of detail to facilitate comparison between reporting periods
> Simple – to support understanding of business operations and performance and to avoid misinterpretations
> Relevant – with focus on what is relevant to Ericsson’s stakeholders or required by regulation or listing agreements, to avoid information overload
> Timely – with regular scheduled disclosures as well as ad-hoc information, such as press releases on important events, performed on a timely basis
> Fair and equal – where all material information is published via press releases to ensure the whole investor community receives the information at the same time
> Complete, free from material errors and a reflection of best practice – disclosure is compliant with applicable financial reporting standards and listing requirements and in line with industry norms.

Ericsson Annual Report on Form 20-F 2010 | 131
Ericsson’s website (www.ericsson.com/investors) comprises comprehensive information on the Group, including:
> An archive of annual and interim reports
> On-demand access to recent news
> Copies of presentations given by senior management at industry conferences.
(Information on the Ericsson website does not form part of this Report).
Disclosure controls and procedures Ericsson has controls and procedures in place to ensure timely information disclosure under the US Securities Exchange Act of 1934 and under agreements with NASDAQ and NASDAQ OMX Stockholm. These procedures also ensure that such information is provided to management, including the CEO and CFO, so timely decisions can be made regarding required disclosure.
The Disclosure Committee comprises 15 members with various expertise. It assists managers in fulfilling their responsibility regarding disclosures made to the shareholders and the investment community. One of the main tasks of the committee is to monitor the integrity and effectiveness of the disclosure controls and procedures.
Ericsson has investments in certain entities that the Company does not control or manage. With respect to such entities, disclosure controls and procedures are substantially more limited than those maintained with respect to subsidiaries.
During the year, Ericsson’s President and CEO and the CFO evaluated the disclosure controls and procedures and concluded that they were effective at a reasonable assurance level as at December 31, 2010.
During the period covered by the Annual Report 2010, there were no changes to the disclosure controls and procedures that have materially affected, or are likely to materially affect, the internal control over financial reporting.
internal control over financial reportingEricsson has integrated risk management and internal control into its business processes. As defined in the COSO framework, internal control includes components such as a control environment, risk assessment, control activities, information and communication and monitoring.
control environment
The Company’s internal control structure is based on the division of labor between the Board of Directors and its Committees and the President and CEO. The Company has implemented a management system that is based on:
> Steering documents, such as policies, directives and a Code of Business Ethics
> A strong corporate culture
> The Company’s organization and mode of operations, with well-defined roles and responsibilities and delegations of authority
> Several well-defined group-wide processes for planning, operations and support.
The most essential parts of the control environment relative to financial reporting are included in steering documents and processes for accounting and financial reporting. These steering documents are updated regularly to include, among other things:
> Changes to laws
> Financial reporting standards and listing requirements, such as IFRS and SOX.
The processes include specific controls to be performed to ensure high quality reports. The management of each reporting legal entity, region and business unit is supported by a financial controller function with execution of controls related to transactions and reporting. A financial controller function is also established on Group level, reporting to the CFO.
risk assessment
Risks of material misstatements in financial reporting may exist in relation to recognition and measurement of assets, liabilities, revenue and cost or insufficient disclosure. Other risks related to financial reporting include fraud, loss or embezzlement of assets and undue favorable treatment of counterparties at the expense of the Company.
Policies and directives regarding accounting and financial reporting cover areas of particular significance to support correct, complete and timely accounting, reporting and disclosure.
Identified types of risks are mitigated through well-defined business processes with integrated risk management activities, segregation of duties and appropriate delegation of authority. This requires specific approval of material transactions and ensures adequate asset management.
control activities
The Company’s business processes include financial controls regarding the approval and accounting of business transactions. The financial closing and reporting process has controls regarding recognition, measurement and disclosure. These include the application of critical accounting policies and estimates, in individual subsidiaries as well as in the consolidated accounts.
Regular analyses of the financial results for each subsidiary, region and business unit cover the significant elements of assets, liabilities, revenues, costs and cash flow. Together with further analysis of the consolidated financial statements performed at Group level, this ensures that the financial reports do not contain material errors.
For external financial reporting purposes, additional controls performed by the Disclosure Committee ensure that all disclosure requirements are fulfilled.
The Company has implemented controls to ensure that the

132 | Ericsson Annual Report on Form 20-F 2010
financial reports are prepared in accordance with its internal accounting and reporting policies and IFRS as well as with relevant listing regulations. It maintains detailed documentation on internal controls related to accounting and financial reporting. It also keeps records on the monitoring of the execution and results of such controls. This ensures that the CEO and CFO can assess the effectiveness of the controls in a way that is compliant with SOX.
Entity-wide controls, focusing on the control environment and compliance with the financial reporting policies and directives, are implemented in all subsidiaries. Detailed process controls and documentation of controls performed are also implemented in almost all subsidiaries, covering all items with significant materiality and risk.
To ensure efficient and standardized accounting and reporting processes, the Company operates several shared services centers. Based on a common IT platform, a common chart of account and common master data, the centers perform accounting and financial reporting services for most subsidiaries.
information and communication
The Company’s information and communication channels support complete, correct and timely financial reporting by making all relevant internal process instructions and policies accessible to all the employees concerned. Regular updates and briefing documents regarding changes in accounting policies, reporting and disclosure requirements are also supplied.
Subsidiaries and operating units prepare regular financial and management reports to internal steering groups and Company management. These include analysis and comments on financial performance and risks. The Board of Directors receives financial reports monthly. The Audit Committee of the Board has established a whistleblower procedure for reporting violations in accounting, internal controls and auditing matters.
monitoring
The Company’s process for financial reporting is reviewed annually by the management. This forms a basis for evaluating the internal management system and internal steering documents to ensure that they cover all significant areas related to financial reporting. The shared service center management continuously monitors accounting quality through a set of performance indicators. Compliance with policies and directives is monitored through annual self-assessments and representation letters from heads and controllers in all subsidiaries as well as in business units and regions.
The Company’s financial performance is also reviewed at each Board meeting. The committees of the Board fulfill important monitoring functions regarding remuneration, borrowing, investments, customer finance, cash management, financial reporting and internal control. The Audit Committee and the Board of Directors review all interim and annual financial reports before they are released to the market. The Company’s internal audit function, which reports to the Audit Committee, performs independent audits. The Audit Committee also receives regular reports from the external auditor. The Audit Committee follows up on any actions taken to improve or modify controls.
the boArD of Directors
Stockholm, February 21, 2011Telefonaktiebolaget LM Ericsson (publ)
Org. no. 556016–0680

Ericsson Annual Report on Form 20-F 2010 | 133
report has been prepared and is consistent with the annual accounts and the consolidated accounts, we have read the corporate governance report and assessed its statutory content based on our knowledge of the company.
In our opinion, the corporate governance report has been prepared and its statutory content is consistent with the annual accounts and the consolidated accounts.
auditoR’s RepoRt on the coRpoRate goveRnance RepoRtTo the annual meeting of the shareholders in Telefonaktiebolaget LM Ericsson (publ), corporate identity number 556016-0680
It is the Board of Directors who is responsible for the corporate governance report for the year 2010 and that it has been prepared in accordance with the Annual Accounts Act.
As a basis for our opinion that the corporate governance
Stockholm 21 February, 2011
Peter clemedtsonAuthorized Public AccountantPricewaterhouseCoopers AB
134 | Ericsson Annual Report on Form 20-F 2010
Some of the information provided in this material is or may contain forward-looking information such as statements about expectations, assumptions about future market conditions, projections or other characterizations of future events. The words “believe”, “expect”, “anticipate”, “intend”, “may”, “plan”, the negative of such terms, and similar expressions are intended to identify these statements. Although we believe that the expectations reflected in these and other forward-looking statements are reasonable, we can give no assurance that these expectations will prove to be correct and actual results may differ materially. We undertake no obligation to publicly update or revise any forward-looking statements, whether as a result of new information, future events or otherwise, except as required by law or stock exchange regulation. We
advise you that Ericsson is subject to risks both specific to our industry and specific to our company that could cause the actual results to differ materially from those contained in our projections or forward-looking statements, including, among others, changing conditions in the telecommunications industry, political economic and regulatory developments in our markets, our management’s ability to develop and execute a successful strategy, various financial risks such as interest rate changes and exchange rate changes, erosion of our market position, structure and financial strength of our customer base, our credit ratings, product development risks, supply constraints, and our ability to recruit and retain quality staff.
Uncertainties in the fUtUre

Ericsson Annual Report on Form 20-F 2010 | 135
ManageMent’s report on internal control over financial reportingEricsson’s management is responsible for establishing and maintaining adequate internal control over financial reporting for the Company. Ericsson’s internal control system related to financial reporting is designed to provide reasonable assurance regarding the reliability of financial reporting and the preparation of financial statements for external purposes in accordance with generally accepted accounting principles and includes those policies and procedures that:
> pertain to the maintenance of records that, in reasonable detail, accurately and fairly reflect the transactions and dispositions of the assets of the Company;
> provide reasonable assurance that transactions are recorded as necessary to permit preparation of financial statements in accordance with generally accepted accounting principles, and that receipts and expenditures of the Company are being made only in accordance with authorizations of management and directors of the Company; and
> provide reasonable assurance regarding prevention or timely detection of unauthorized acquisition, use or disposition of the Company’s assets that could have a material effect on the financial statements.
Although the purpose of internal control systems is to ensure adequate risk management all internal control systems, no matter how well designed, have inherent limitations which may result in that misstatements are not prevented or detected. Therefore, even systems determined to be effective can provide only reasonable assurance with respect to the reliability of
financial statement preparation and presentation. Ericsson’s management assessed the effectiveness of
Ericsson’s internal control over financial reporting as of December 31, 2010. In making this assessment, management used the criteria set forth in “Internal Control - Integrated Framework”, issued by the Committee of Sponsoring Organizations of the Treadway Commission.
Based on this assessment, management has concluded that, as of December 31, 2010, Ericsson’s internal control over financial reporting was effective. The effectiveness of the Company’s internal control over financial reporting as of December 31, 2010, has been audited by PricewaterhouseCoopers AB, an independent registered public accounting firm. PricewaterhouseCoopers AB has issued an attestation report on Ericsson’s internal control over financial reporting, which appears on page 41.

136 | Ericsson Annual Report on Form 20-F 2010
You may order any of these reports from their website www.bolagsverket.se. If you access these reports, please be aware that the information included may not be indicative of our published consolidated results in all aspects. Other than information related to the Parent Company, only consolidated numbers for the Group totals are included in our reports.Filing in the US: Annual reports and other information are filed with the Securities and Exchange Commission (SEC) in the United States, pursuant to the rules and regulations that apply to foreign private issuers. Electronic access to these documents may be obtained from the SEC’s website, www.sec.gov/edgar/searchedgar/webusers.htm, where they are stored in the EDGAR database.
coMpany history and developMentInnovating to empower people, business and society
Our origins date back to 1876 when Alexander Graham Bell filed a patent application in the United States for the telephone. The same year, Lars Magnus Ericsson opened a small workshop in Stockholm to repair telegraph instruments and sell his own telephone equipment.
Today, Ericsson is a leading provider of communications equipment, professional services and multimedia solutions. Our customers are operators of mobile and fixed networks worldwide. Over 1,000 networks in more than 180 countries
The following information is provided for purposes of complying with certain requirements of Form 20-F which are not satisfied in full by the information in the Swedish Annual Report.
general facts on the coMpanyLegal name of the Parent Company: Telefonaktiebolaget LM Ericsson (publ)Organization number: 556016-0680 Legal form of the Parent Company: A Swedish limited liability company, organized under the Swedish Companies Act. The terms “Ericsson”, “the Company”, “the Group”, “us”, “we”, and “our” all refer to Telefonaktiebolaget LM Ericsson and its subsidiaries.Country of incorporation: Sweden. Date of incorporation: The Parent Company was incorporated on August 18, 1918, as a result of a merger between AB LM Ericsson & Co. and Stockholms Allmänna Telefon AB. Domicile: Our registered office is Telefonaktiebolaget LM Ericsson, SE–164 83 Stockholm, Sweden. Our headquarters are located at Torshamnsgatan 23, Kista, Sweden. Telephone number: +46 10 719 0000 Website: www.ericsson.comAgent in the US: Ericsson Inc., Vice President Legal Affairs, 6300 Legacy Drive, Plano, Texas 75024. Telephone number:+1 972 583 0000.Shares: Ericsson’s Class A and Class B shares are traded on NASDAQ OMX Stockholm. In the US, our American Depository Shares (ADS), each representing one underlying Class B share, are traded on NASDAQ.Parent Company operations: The business of the Parent Company, Telefonaktiebolaget LM Ericsson, consists mainly of corporate management, holding company functions and internal banking activities. Parent Company operations also include customer credit management activities performed by Ericsson Credit AB on a commission basis.Subsidiaries and associated companies: For a listing of our significant subsidiaries, please see section “Investments”. In addition to our joint ventures Sony Ericsson and ST-Ericsson, we are engaged in a number of other minor joint ventures, cooperative arrangements and venture capital initiatives. For more information regarding risks associated with joint ventures, strategic alliances and third-party agreements please see Risk Factors, “Market, Technology and Business Risks”.Documents on display: We file annual reports and other information (normally in Swedish only) for certain domestic legal entities with Bolagsverket (Swedish Companies Registration Office) pursuant to Swedish rules and regulations.
sUppleMental inforMation
contentsGeneRAL FACTS On The COmPAny 136
COmPAny hISTORy AnD DeveLOPmenT 136
exChAnGe RATeS 137
PRImARy mAnUFACTURInG AnD ASSembLy FACILITIeS 137
OPeRATInG ReSULTS 137
memORAnDUm AnD ARTICLeS OF ASSOCIATIOn 139
exChAnGe COnTROLS 141
TAxATIOn 141
DePOSITARy FeeS AnD ChARGeS 144
InDePenDenCe ReqUIRemenTS 145
AUDIT COmmITTee PRe-APPROvAL POLICIeS AnD PROCeDUReS 145
InveSTmenTS 146

Ericsson Annual Report on Form 20-F 2010 | 137
Primary manufacturing and assembly facilities
2010 2009 2008
sitesthousands
of sq meters sitesthousands
of sq meters sitesthousands
of sq meters
Sweden 6 204.4 8 224.7 8 226.0
China 4 61.1 4 46.4 4 38.5
Estonia 1 20.6 1 26.6 – –
Italy 2 20.1 2 20.1 2 20.1
Brazil 1 23.3 1 23.3 1 18.0
India 1 15.6 1 13.6 1 9.0
USA – – – – 1 5.0
Other – – – – 1 0.3
total 15 345.1 17 354.7 18 316.9
Operating resultsyears ended december 31, 2009 and 2010
Please refer to Board of Directors’ Report.
years ended december 31, 2008 and 2009
net sales
consolidated
Consolidated net sales decreased by SEK 1 percent, to SEK 206.5 billion in 2009 from SEK 208.9 billion in 2008. Increased sales in the first half of 2009 were offset in the second half by the impact from the economic slowdown. Overall, sales declined marginally from last year to SEK 206.5 billion. Sales for comparable units were stable year over year, i.e. excluding SEK 2.7 billion of sales from the acquired Nortel business in North America in the fourth quarter and SEK 5.2 billion in 2008 from the divested PBX and mobile platform operations. Adjusted also for effects of exchange rates and hedging, sales declined 9 percent. Lower sales in Networks were largely offset by higher sales in Global Services and Multimedia. The economic downturn coupled with tighter credit supply impacted operator spending, in particular in certain emerging markets. The demand varied considerably between markets. Among our largest markets, the US, China, UK and Turkey had good sales increases. Australia, India and Japan were stable, whereas sales in Brazil, Indonesia, Italy, Pakistan and Spain declined.
As of January 1, 2010, Ericsson reports the following segments: Networks, Global Services, Multimedia, Sony Ericsson and ST-Ericsson. The only change compared to previous years is that Network Rollout is now included in Global Services instead of in Networks. All other segments are unchanged.
networks
Net sales in segment Networks decreased by 5 percent, to SEK 114.0 billion in 2009 from SEK 120.5 billion in 2008. Sales for comparable units declined by 5 percent, i.e. excluding SEK 2.7 billion of sales from acquired Nortel operations. Adjusted also
utilize our equipment. More than 40 percent of all mobile traffic goes through Ericsson equipment.
technical milestOnes > 1878 Telegraph to telephone > 1923 Manual switching to automatic switching > 1981 Fixed communications to mobile communications > 1998 Integration of voice and data in mobile networks > 2001 Launch of WCDMA/3G networks in Western Europe > 2006 Launch of HSPA mobile broadband networks globally > 2009 Mobile broadband traffic gains momentum and first LTE
network launched
exchange ratesThe following tables provide information with respect to the exchange rate for SEK per USD 1.00, based on the noon buying rate for cable transfers in SEK as certified for customs purposes by the Federal Reserve Bank of New York. The noon buying rate of March 25, 2011, was SEK 6.3552 per USD 1.00. The average is computed using the noon buying rate on the last business day of each month during the period indicated.
average exchange rates
year ended december 31 average
2006 7.3098
2007 6.7232
2008 6.6424
2009 7.6232
2010 7.1895
exchange rates, monthly high and low
month high low
September 2010 7.3134 6.7144
October 2010 6.7725 6.5580
November 2010 7.0130 6.5145
December 2010 6.9666 6.7571
January 2011 6.8977 6.4318
February 2011 6.5005 6.3442
We describe the effects of exchange rate fluctuations on our business in the Notes to the Consolidated Financial Statements – Note C20, “Financial Risk Management and Financial Instruments.”
primary manufacturing and assembly facilities We continuously adjust our production capacity to meet expected customer demand. At year-end 2010, our overall capacity utilization was close to 100 percent. The table “Primary manufacturing and assembly facilities” summarizes where we have major sites as well as the total floor space at year-end. In Sweden, the majority of the floor space within our production facilities is used for node assembly and verification.

138 | Ericsson Annual Report on Form 20-F 2010
compared to SEK -0.4 billion in 2008, increased restructuring charges of SEK -12.6 (-7.6) billion and the decline in gross income to SEK 70.2 (74.3) billion.
Earnings per share (EPS) diluted was SEK 1.14 (3.52) down 68 percent. The EPS decline was largely driven by the losses in our JVs and the restructuring program.
The AGM resolved on a dividend of SEK 2.00 (1.85) per share for 2009.
Financial Position
Despite strategic investments and a difficult macro-economic business environment, a healthy capital structure and equity ratio were maintained. The debt maturity profile was also significantly improved. Cash remained strong at SEK 76.7 (75.0) billion. Due to a strong cash flow, a good level of cash and short-term investments was maintained. A strong liquidity was deemed important to keep flexibility for volatility in sales and cash flows and to be able to take advantage of opportunities in the market. Net Cash was SEK 36.1 (34.7) billion Working Capital remained the same as the previous year, at SEK 99.1 (100.0) billion. Return on Equity was 2.6 (8.2) percent. The decline in return on equity (ROE) was primarily a consequence of JV losses and the restructuring charges.
cash Flow
In 2009 cash flow from operating activities was SEK 24.5 (24.0) billion. A lower net income was offset by non-cash items, such as the losses in JVs, depreciation, amortization of intangibles, largely related to restructuring, and strong working capital reductions, resulting in a similar cash flow from operations as in 2008.
Cash flow from investing activities was SEK -37.5 (-8,5) billion. Cash outlays for recurring investing activities increased slightly to SEK –4.9 billion. Acquisitions/divestments during the year were net SEK –18.1 billion, with the major items being the formation of the ST-Ericsson joint venture, the minority stake in LHS and Nortel’s CDMA and LTE businesses. Cash outflow for short-term investments for cash management purposes and other investing activities was net SEK –14.5 billion, largely attributable to SEK –17.1 billion of short-term investments driven by the strong cash flow from operations.
In 2009 the cash flow from financing activities was SEK –1.7 (–7.2) billion. Dividends paid of SEK –6.3 billion were partly offset by increased borrowings of SEK 4.3 billion and other financing activities of SEK 0.2 billion.
Restructuring in 2008 and 2009The restructuring charges in 2009 were SEK 11.3 billion compared to SEK 6.8 billion in 2008, relating to activities to reduce production costs, reduce product variants and platforms, increase the re-use of software, consolidate R&D activities, and improve administrative processes. In the beginning of 2009, a program to reduce annual run rate of costs
for currency and hedge effects, sales declined in line with the market. Lower GSM sales, particularly in high-growth markets such as China, contributed to the decline. Sales in WCDMA continued to show good growth driven by demand for mobile broadband. However, WCDMA growth did not offset the GSM decline.
Global services
Global Services sales increased by 12 (15) percent to SEK 79.2 (70.5) billion. However, sales were negatively affected by the reduced scope of a managed services agreement and somewhat lower sales of project-related services, reflecting the slowdown in network sales. Sales of related network rollout services grew 7 percent to SEK 23.1 (21.5) billion during 2009. Managed services was one of the main drivers for the sales increase, growing by 22 (17) percent to SEK 17.4 (14.3) billion, significantly outpacing the market. .
Multimedia
Multimedia sales increased 5 percent for comparable units with revenue management negatively affected during the second half of the year by lower network deployments.
GEoGRaPhical REGions
As of January 1, 2010, the geographical reporting structure was changed from five geographical areas to ten regions, mirroring the new internal geographical organization. A part called “Other” is also reported, consisting of business not reported in the geographical structure, e.g. embedded modules, cables, power modules as well as intellectual property rights and licenses.
The following regions increased their sales in 2009: North America by 54 percent, Western & Central Europe by 4 percent, Middle East by 2 percent and China & North East Asia by 18 percent. Sales in Sub Saharan Africa and India were flat. The following regions decreased their sales: Latin America by –13 percent, Northern Europe & Central Asia by –19 percent, Mediterranean by –15 percent, South East Asia & Oceania by –1 percent and region Other by –45 percent.
Financial REsults oF oPERations
The gross margin declined only slightly to 34.0 percent in 2009 compared to 35.5 percent in 2008. The decline was due to effects of price pressure, increased share of services sales and the initial transition costs for the Sprint contract, which were largely offset by cost cutting and restructuring efforts.
Operating expenses in 2009 were almost flat at SEK -60.0 billion compared to SEK -60.6 billion in 2008. Operating expenses measured as a percentage of net sales was 29.0 percent in 2009 and 29.0 percent also in 2008.
Operating income declined to SEK 5.9 (16.3) billion with an operating margin of 2.9 (7.8) percent. The main reasons were a negative contribution from joint ventures of SEK -7.4 billion,

Ericsson Annual Report on Form 20-F 2010 | 139
shareholders for subscription on a pro rata basis. If we decide to issue new shares of only one series by means of a cash issue or an issue against payment through set-off of claims, all shareholders, regardless of whether their shares are Class A, Class B or Class C, are entitled to a preferential right to subscribe for new shares in proportion to the number of shares previously held by them. Shareholders may vote to waive shareholders’ preferential rights at a general meeting.
If we decide to issue warrants or convertibles through a cash issue or an issue against payment through set-off of claims, the shareholders have preferential rights to subscribe to warrants as if the issue were of the shares that may be subscribed to pursuant to the warrant and, respectively, preferential rights to subscribe to convertibles as if the issue were of the shares that the convertibles may be converted to.
The above does not constitute any restriction to waive the shareholders’ preferential rights when deciding on either a cash issue, an issue against payment through set-off of claims, an issue of warrants or an issue of convertibles.
Dividends Our Class A and Class B shareholders have the same right to dividends, while Class C shareholders have a right to a yearly dividend as described in article 15 of our Articles of Association. No Class C shares are currently outstanding.
Under Swedish law, only a general meeting of shareholders may decide on payment of dividends, which may not exceed the amount proposed by the Board of Directors (except in certain limited circumstances), and may only be paid from funds legally available for that purpose. Under Swedish law, no interim dividends may be paid in respect of any fiscal period for which audited financial statements of the company have not yet been adopted by the annual general meeting of shareholders. The market practice in Sweden is for dividends to be paid annually. Under the Swedish Companies Act, dividends to shareholders and other transfers of value from a company - such as purchases of own shares (see below) - may only be made in case the company’s restricted equity remains fully covered after the transfer of value has been made. The calculation shall be based upon the most recently adopted balance sheet, and any changes in the restricted equity that has occurred after the balance sheet date shall be taken into account. In addition, dividends to shareholders and other transfers of value from the company may only be made if this is justifiable taken into account the type of business activities of the company, their scope and risks related thereto and the company’s need for financial resources, its liquidity and financial position. In respect of parent companies, also the business activities of the group, their scope and risks related thereto and the group’s need for financial resources, its liquidity and financial position should be taken into account.
The Company’s shares are registered in the computerized book-entry share registration system administered by Euroclear Sweden AB (“Euroclear”). The rights attached to shares eligible
by SEK 10 billion was launched, following the 2008 program aiming at SEK 6–7 billion. In the third quarter, additional SEK 5–6 billion of savings were targeted with anticipated costs of the same magnitude. This resulted in fewer platforms and solutions and was coupled with write-downs of capitalized development costs and acquired IPR assets for affected products.
MeMorandUM and articles of associationTelefonaktiebolaget LM Ericsson is entered under no. 556016–0680 in the Company Register kept by the Swedish Companies Registration Office. Our Company’s objective and purposes are described in §2 of the Articles of Association.
Our Articles of Association do not stipulate anything regarding a) a director’s power to vote on a proposal, arrangement, or contract in which the director is materially interested, b) our directors’ power to vote for compensation to themselves, c) our directors’ borrowing powers, d) retirements rules for our directors or e) the number of shares required for a director’s qualification. Applicable provisions are found in the Swedish Companies Act, as referred to in “Certain Powers of Directors and the President” below.
There are no age limit restrictions for directors and they are not required to own any shares in the Company.
Share Capital, Increases of Share Capital and Preferential Rights of ShareholdersThe Articles of Association of Ericsson provide that the share capital of the Company may not be less than SEK 6,000 million nor more than SEK 24,000 million, and that the number of shares in the Company shall amount to no less than 3,000,000,000 and no more than 12,000,000,000. The registered share capital is SEK 16,366,758,678 and the Company has in total issued SEK 3,273,351,735 shares.
The Company’s shares are divided into three series: Class A shares, Class B shares and Class C shares; however, no Class C shares are currently outstanding. Under the Swedish Companies Act of 2005, applicable as of January 1, 2006 (the “Swedish Companies Act”), shareholders must approve each issue of additional shares either by deciding on the share issue at a shareholders’ meeting, or by a shareholders’ approval of a decision on a share issue by the Board, or by giving an authorization to the Board to decide about a share issue. If we decide to issue new Class A, Class B and Class C shares by means of a cash issue, or an issue against payment through set-off of claims, Class A, Class B and Class C shareholders (except for Ericsson and its subsidiaries, in the event they hold shares in Ericsson) have a primary preferential right to subscribe for new shares of the same type in relation to the number of shares previously held by them. Shares not subscribed for through a preferential right shall be offered to all

140 | Ericsson Annual Report on Form 20-F 2010
in the register of shareholders maintained by Euroclear no later than the designated record day.
Under the Swedish Companies Act, resolutions are passed by a simple majority of votes cast at the meeting with the chairman of the meeting having a decisive vote (except in respect of elections), unless otherwise required by law or a company’s articles of association. Under the Swedish Companies Act, certain resolutions require special quorums and majorities, including, but not limited to, the following:A a resolution to amend the articles of association requires
a majority of two-thirds of the votes cast as well as two-thirds of the shares represented at the meeting, except in those circumstances described in B–D below;
b a resolution to amend the articles of association which reduces any shareholder’s rights to profits or assets, restricts the transferability of shares or alters the legal relationship between shares, normally requires the unanimous approval of the shareholders present at the meeting and who hold nine-tenths of all outstanding shares;
C a resolution to amend the articles of association for the purpose of limiting the number of shares with which a shareholder may vote at a general meeting or allocating part of the net profit for the fiscal year to a restricted fund or limiting the use of the company’s profits or assets in a liquidation or dissolution, normally requires the approval of shareholders representing two-thirds of the votes cast and nine-tenths of the shares represented at the meeting;
D a resolution of the kind referred to under B or C above may, however, be taken with a lower supermajority requirement if the amendments referred to therein will only adversely affect specific shares or classes of shares. In such cases, the requirement under a above will apply together with the following separate supermajority: (a) where only a class of shares is adversely affected, approval of the owners of one-half of all shares of such class and nine-tenths of the shares of such class represented at the meeting, or (b) where the shares adversely affected do not constitute a class of shares, the unanimous approval of all such affected outstanding shares present at the meeting and who hold nine-tenths of all outstanding shares adversely affected;
e a resolution to issue, approve or authorize the issuance for cash of new shares, warrants or convertibles with a deviation from the -preferential right for existing shareholders requires a two-thirds -majority of votes cast at the meeting as well as two-thirds of the shares represented at the meeting;
F a resolution to reduce the outstanding share capital requires a two-thirds majority of votes cast at the meeting as well as two-thirds of the shares represented at the meeting. In case there are several classes of shares in a company, the above described majority requirement shall apply also within each share class represented at the
for dividends accrue to those persons whose names are recorded in the register of shareholders on the record day. The dividends are then sent to a specified account as directed by the person registered with Euroclear, or to the address of that person. The relevant record day must, in most circumstances, be specified in the resolution declaring a dividend or resolving upon a capital increase or any similar matter in which shareholders have preferential rights, or the Board of Directors must be authorized to determine the relevant record day.
Where the registered holder is a nominee, the nominee receives, for the account of the beneficial owner, dividends and, on issues of shares with preferential rights for the shareholders, shares, as well as rights. Dividends are remitted in a single payment to the nominee who is responsible for the distribution of such dividends to the beneficial owner. A similar procedure is adopted for share issues. Specific authority to act as a nominee must be obtained from Euroclear. The nominee must issue a public report to Euroclear every third month, listing all beneficial holders of more than 500 shares. Euroclear is required to keep a register with regard to any holding on behalf of a single beneficial owner in excess of 500 shares in any one company. This list must reveal the names of the beneficial owner and must be open to public inspection.
votingIn a general meeting of Ericsson, each Class A share shall carry one vote, each Class B share one tenth of one vote and each Class C share one-thousandth of one vote.
We are required to publish notices to attend annual general meetings no earlier than six weeks and no later than four weeks prior to the general meeting and the same notice period requirements apply regarding extraordinary general meetings concerning changes in our articles of association. Notices to attend other types of extraordinary general meetings must be published no earlier than six weeks and no later than two weeks prior to the general meeting.
Directors are elected during the annual general meeting for a period of one year at a time and do not stand for reelection at staggered intervals.
A shareholder may attend and vote at the meeting in person or by proxy. For companies whose shares are registered in a central securities depositary register, proxies are valid for up to five years from the date of issuance. Any shareholder wishing to attend a general meeting must notify us no later than on the day specified in the notice, preferably before 4:00 p.m. (CET). We are required to accept all notifications of attendance received at least five business days (Saturdays normally included) prior to the meeting. A person designated in the register as a nominee (including the depositary of the ADSs) is not entitled to vote at a general meeting, nor is a beneficial owner whose share is registered in the name of a nominee (including the depositary of the ADSs) unless the beneficial owner first arranges to have such owner’s own name entered

Ericsson Annual Report on Form 20-F 2010 | 141
rule, be reported not later than the trading day following the day on which the party with a duty to report has entered into an agreement for the acquisition or transfer of shares or any other change to the shareholding has occurred.
In addition, the Act on Reporting Obligations Regarding Certain Holdings of Financial Instruments requires, among other things, certain individuals who own shares representing 10 percent or more of the share capital or the voting rights in a Swedish public limited liability company whose shares are traded on a regulated market within the EEA to report such ownership to the SFSA, which keeps a public register based on the information contained in such reports, and also to report any changes in such ownership within five business days.
exchange controlsThere is no Swedish legislation affecting a) the import or export of capital or b) the remittance of dividends, interest or other payments to non-resident holders of our securities except that, subject to the provisions in any tax treaty, dividends are subject to withholding tax.
taxationGeneral
The taxation discussion set forth below does not purport to be a complete analysis or listing of all potential tax effects relevant to the acquisition, ownership or disposition of Class B shares or ADSs. The statements of United States and Swedish tax laws set forth below are based on the laws in force as of the date of this report and may be subject to any changes in United States or Swedish law, and in any double taxation convention or treaty between the United States and Sweden, occurring after that date, which changes may then have retroactive effect.
Specific tax provisions may apply for certain categories of tax payers. Your tax treatment if you are a holder of Class B shares or ADSs depends in part on your particular situation. If you are a holder of Class B shares or ADSs, you should therefore consult a tax advisor as to the tax consequences relating to your particular circumstances resulting from the ownership of Class B shares or ADSs.
The tax consequences to holders of ADSs, as discussed below, apply equally to holders of Class B shares.
Certain Swedish Tax Considerations This section describes the material Swedish income and net wealth tax consequences for a holder of ADSs or Class B shares who is not considered to be a Swedish resident for Swedish tax purposes. This section applies to you only if you are a holder of portfolio investments representing less than 10 percent of capital and votes and is not applicable if the ADSs or Class B shares pertain to a permanent establishment or fixed place of business in Sweden.
meeting and for which the rights of the shares are adversely affected; and
G a resolution to approve a merger requires a two-thirds majority of the votes cast at the meeting and two-thirds of the shares represented at the meeting (however, under certain circumstances a higher majority is required).
At a general meeting of shareholders, a shareholder or proxy for one or more shareholders may cast full number of votes represented by the holder’s shares.
Purchase of Own SharesA Swedish public limited liability company whose shares are traded on a regulated market place within the European Economic Area (“EEA”) or a market place comparable to a regulated market place outside the EEA is entitled to purchase its own shares under certain conditions. A purchase by us of our own shares may take place only if (a) the purchase has been decided upon by a general meeting of shareholders or the Board has been authorized by a general meeting of shareholders, in both cases by a two thirds majority of votes cast at the meeting as well as two-thirds of the shares represented at the meeting, (b) the purchase is effected on a regulated market place within the EEA or a market place comparable to a regulated market place outside the EEA (in the latter case with the approval of the Swedish Financial Supervisory Authority the “SFSA”) or pursuant to an offer to all shareholders or holders of a specific class of shares, (c) the Company’s restricted equity will still be fully covered and the purchase is justifiable taken into account the type of business activities of the Company and the group, their scope and risks related thereto and the Company’s and the group’s need for financial resources, its liquidity and financial position, and (d) we and our subsidiaries do not hold or, as a result of purchase, will not hold in excess of 10 percent of all our outstanding shares. As of December 31, 2010, the Company held an aggregate of 78,978,533 treasury stock of Class B shares.
Investment RestrictionsThere are no limitations imposed by Swedish law or by our Articles of Association in respect of the rights of non-residents or foreign persons to purchase, own or sell securities issued by us.
There are, however, certain flagging and ownership examination rules that apply, irrespective of nationality.
Pursuant to the Swedish Financial Instruments Trading Act any change in a holding of shares, depository receipts with voting rights or financial instruments that entitle the holder to acquire shares in issue in a Swedish limited liability company whose shares are admitted for trading on a regulated market place within the EEA shall be reported by the holder to the company and the SFSA, where the change entails that the holder’s portion of all shares or votes in the company reaches, exceeds or falls below any of the limits of 5, 10, 15, 20, 25, 30, 50, 66 2/3 or 90 per cent. Such a change should, as a main

142 | Ericsson Annual Report on Form 20-F 2010
neT WeALTh TAxATIOn
The Swedish net wealth tax has been abolished from 1 January 2007.
Certain United States Federal Income Tax ConsequencesThe following discussion is a summary of the material United States federal income tax consequences relevant to the ownership and disposition of ADSs or Class B shares. This discussion is based on the tax laws of the United States (including the Internal Revenue Code of 1986, as amended (the “Code”), its legislative history, existing and proposed regulations thereunder, published rulings and court decisions) as in effect on the date hereof, all of which are subject to change, possibly with retroactive effect. The discussion is not a full discussion of all tax considerations that may be relevant to the ownership and disposition of ADSs or Class B shares. The discussion applies only if you will hold the ADSs and/or the Class B shares as capital assets and you use the USD as your functional currency. It does not deal with the tax treatment of investors subject to special rules, such as grantor trusts, real estate investment trusts, regulated investment companies, banks, brokers or dealers in securities, traders in securities or currencies that elect to use a mark-to-market method of recording for their securities holdings, financial institutions, insurance companies, tax-exempt entities, investors liable for alternative minimum tax, holders (either actually or constructively) of 10 percent or more of our Class B shares, persons holding ADSs and/or Class B shares as part of a hedging, straddle, conversion or constructive sale transaction and persons who are resident or ordinarily resident in Sweden. In addition, investors holding ADSs and/or Class B shares indirectly through partnerships are subject to special rules not discussed below. You should consult your own tax advisers about the United States federal, state, local and foreign tax consequences to you of the ownership and disposition of the ADSs or Class B shares.
The discussion below applies to you only if you are a beneficial owner of ADSs and/or Class B shares not resident in Sweden for purposes of the U.S. Tax Treaty and you are, for United States federal income tax purposes, (1) a citizen or resident of the United States, (2) a corporation or any other entity treated as a corporation that is organized in or under the laws of the United States or its political subdivisions, including the District of Columbia, (3) a trust if all of the trust’s substantial decisions are subject to the control of one or more United States persons and the primary supervision of the trust is subject to a United States court, or if a valid election is in effect with respect to the trust to be taxed as a United States person, or (4) an estate the income of which is subject to United States federal income taxation regardless of its source.
The discussion below assumes that the representations contained in the deposit agreement are true and that the obligations in the deposit agreement and any related agreement
TAxATIOn On CAPITAL GAInS
Generally, non-residents of Sweden are not liable for Swedish capital gains taxation with respect to the sale of ADSs or Class B shares. However, under Swedish tax law, capital gains from the sale of shares in Swedish companies and certain other securities by an individual may be taxed in Sweden at a rate of 30 percent if the seller has been a resident of Sweden or has lived permanently in Sweden at any time during the year of the sale or the 10 calendar years preceding the year of the sale (absent treaty provisions to the contrary). The provision is applicable on ADSs or Class B shares. From 1 January 2008 the rule has been extended so that it also applies to shares in foreign companies, provided that the shares were acquired during the time that the person was liable to tax in Sweden.
This provision may, however, be limited by tax treaties that Sweden has concluded with other countries. Under the tax treaty between Sweden and the United States (the “U.S. Tax Treaty”), this provision applies for ten years from the date the individual became a non-resident of Sweden.
TAxATIOn On DIvIDenDS
A Swedish dividend withholding tax at a rate of 30 percent is imposed on dividends paid by a Swedish corporation, such as us, to non-residents of Sweden. The same withholding tax applies to certain other payments made by a Swedish corporation, including payments as a result of redemption of shares and repurchase of stock through an offer directed to its shareholders. Exemption from the withholding tax or a lower tax rate may apply by virtue of a tax treaty. Under the U.S. Tax Treaty, the withholding tax on dividends paid on portfolio investments to eligible U.S. holders is reduced to 15 percent.
Under all Swedish tax treaties, except the tax treaty with Switzerland, withholding tax at the applicable treaty rate should be withheld by the payer of the dividends. With regard to dividends paid from shares in corporations registered with the Euroclear Sweden (such as our shares), a reduced rate of dividend withholding tax under a tax treaty is generally applied at the source by the Euroclear Sweden or, if the shares are registered with a nominee, the nominee, as long as the person entitled to the dividend is registered as a non-resident and sufficient information regarding the tax residency of the beneficial owner is available to the Euroclear Sweden or the nominee.
In those cases where Swedish withholding tax is withheld at the rate of 30 percent and the person who received the dividends is entitled to a reduced rate of withholding tax under a tax treaty, a refund may be claimed from the Swedish tax authorities before the end of the fifth calendar year following the year that the distribution was made.
TAxATIOn On InTeReST
No Swedish withholding tax is payable on interest paid to non-residents of Sweden.

Ericsson Annual Report on Form 20-F 2010 | 143
States federal taxable income). For foreign tax credit limitation purposes, the dividend will be income from sources without the United States, and will generally be treated as “passive category income” (or, in the case of certain holders, “general category income”).
SALe OR exChAnGe OF ADSS OR CLASS b ShAReS
Subject to the passive foreign investment company rules discussed below, you will generally recognize capital gain or loss on the sale or other disposition of the ADSs or Class B shares equal to the difference between the USD value of the amount realized and your adjusted tax basis (determined in USD) in the ADSs or Class B shares. Such gain or loss will be capital gain or loss and will generally be treated as arising from U.S. sources for foreign tax credit limitation purposes.
The amount realized on a disposition of ADSs or Class B shares will generally be the amount of cash you receive for the ADSs or Class B shares (which, in the case of payment in a non-U.S. currency, will equal the USD value of the payment received determined on (a) the date of receipt of payment if you are a cash basis taxpayer and (b) the date of disposition if you are an accrual basis taxpayer). If the ADSs or Class B shares are treated as traded on an “established securities market,” if you are a cash basis taxpayer (or, if you are an accrual basis taxpayer, if you so elect) you will determine the USD value of the amount realized by translating the amount received at the spot rate of exchange on the settlement date of the sale.
You will have a tax basis in any foreign currency received equal to the USD amount realized. Any gain or loss you realize on a subsequent conversion of foreign currency will be U.S. source ordinary income or loss.
PASSIve FOReIGn InveSTmenT COmPAny STATUS
A non-U.S. corporation is a passive foreign investment company (a “PFIC”) in any taxable year in which, after taking into account the income and assets of certain subsidiaries, either (a) at least 75 percent of its gross income is passive income or (b) at least 50 percent of the quarterly average value of its assets is attributable to assets that produce or are held to produce passive income. Based on the market value of our shares, the composition of our assets and income and our operations, we believe we were not a PFIC during the year 2010. However, whether or not we will be considered a PFIC will depend on the nature and source of our income and the value of our assets, as determined from time to time. If we are treated as a PFIC, we will not provide information necessary for the “qualified electing fund” election as the term is defined in the relevant provisions of the Code. You should consult your own tax advisors about the consequences of our potential classification as a PFIC.
If we were a PFIC, for any taxable year in which you held ADSs or Class B shares, you would be subject to special rules with respect to:
will be complied with in accordance with the terms. If you hold ADSs, you will be treated as the holder of the underlying Class B shares represented by those ADSs for United States federal income tax purposes.
TAxATIOn OF ADSS OR CLASS b ShAReS
Dividends
Subject to the passive foreign investment company rules discussed below, the gross amount of dividends paid (before reduction for any Swedish withholding taxes) with respect to the ADSs or Class B shares generally will be included in your gross income as ordinary income from foreign sources to the extent paid out of our current or accumulated earnings and profits (as determined for United States federal income tax purposes). Distributions in excess of earnings and profits will be treated as a non-taxable return of capital to the extent of your adjusted tax basis in the ADSs or Class B shares and thereafter as capital gain. The dividends will not be eligible for the dividends received deduction available to corporations in respect of dividends received from other U.S. corporations. The amount of any dividend paid in SEK will be the U.S. dollar value of the dividend payment based on the exchange rate in effect on the date of receipt by you (or constructive receipt), in the case of Class B shares or by the depositary, in the case of ADSs, whether or not the payment is converted into USD at that time. Your tax basis in the SEK received will equal such USD amount. Gain or loss, if any, recognized on a subsequent sale or conversion of the SEK will be U.S. source ordinary income or loss.
If you are a non-corporate holder of ADSs or Class B shares, dividends you receive on the ADSs or Class B shares for taxable years beginning before January 1, 2013, may be taxed at the lower applicable capital gains rate provided that (1) we are not a passive foreign investment company (as discussed below) for either our taxable year in which the dividend was paid or the preceding taxable year, (2) certain holding period requirements are met and (3) either (a) our ADSs continue to be listed on the Nasdaq Stock Market (or a national securities exchange that is registered under section 6 of the Securities Exchange Act of 1934, as amended) or (b) we are eligible for the benefits of the U.S. Tax Treaty. You should consult your own tax advisors regarding the availability of the lower rate for dividends paid with respect to ADSs or Class B shares.
Subject to certain limitations, you will generally be entitled to receive credit against your United States federal income tax liability (or a deduction against your United States federal taxable income) with respect to any Swedish tax withheld in accordance with the U.S. Tax Treaty and paid over to Sweden. If a refund of the tax withheld is available to you under the laws of Sweden or under the U.S. Tax Treaty, the amount of tax withheld that is refundable will not be eligible for such credit against your United States federal income tax liability (and will not be eligible for the deduction in computing your United
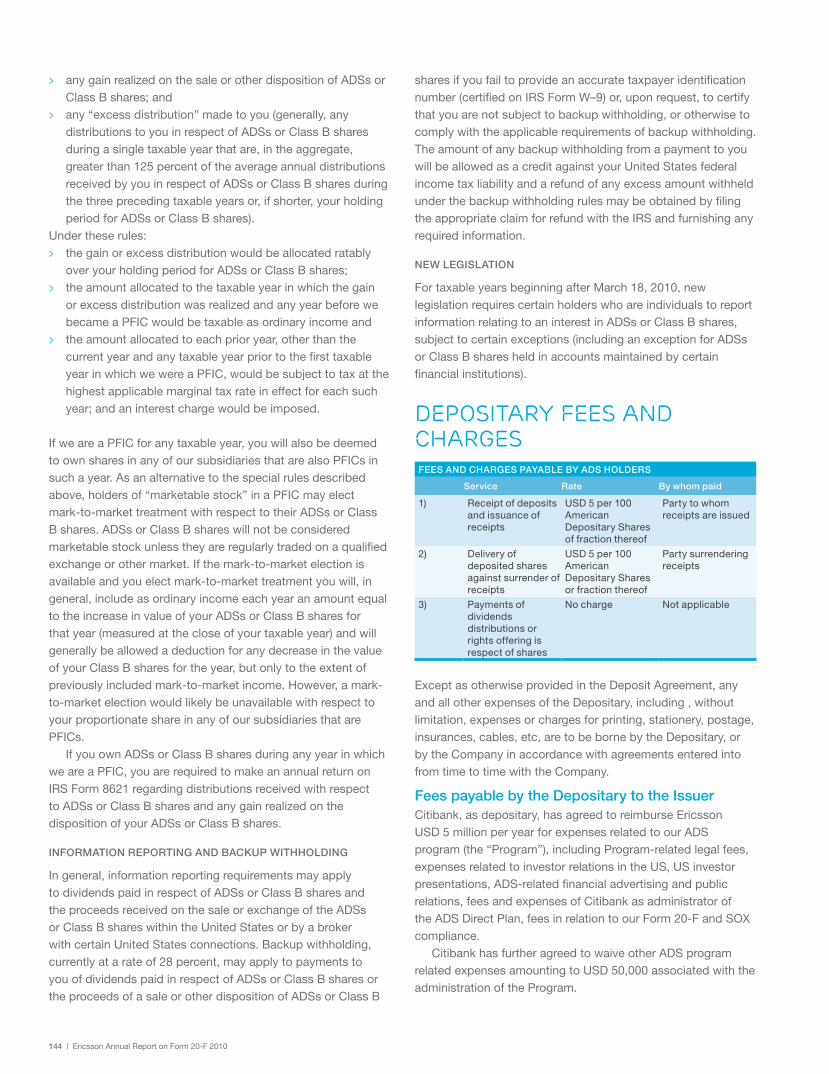
144 | Ericsson Annual Report on Form 20-F 2010
shares if you fail to provide an accurate taxpayer identification number (certified on IRS Form W–9) or, upon request, to certify that you are not subject to backup withholding, or otherwise to comply with the applicable requirements of backup withholding. The amount of any backup withholding from a payment to you will be allowed as a credit against your United States federal income tax liability and a refund of any excess amount withheld under the backup withholding rules may be obtained by filing the appropriate claim for refund with the IRS and furnishing any required information.
neW LeGISLATIOn
For taxable years beginning after March 18, 2010, new legislation requires certain holders who are individuals to report information relating to an interest in ADSs or Class B shares, subject to certain exceptions (including an exception for ADSs or Class B shares held in accounts maintained by certain financial institutions).
depositary fees and chargesFeeS AnD ChARGeS PAyAbLe by ADS hOLDeRS
Service Rate by whom paid
1) Receipt of deposits and issuance of receipts
USD 5 per 100 American Depositary Shares of fraction thereof
Party to whom receipts are issued
2) Delivery of deposited shares against surrender of receipts
USD 5 per 100 American Depositary Shares or fraction thereof
Party surrendering receipts
3) Payments of dividends distributions or rights offering is respect of shares
No charge Not applicable
Except as otherwise provided in the Deposit Agreement, any and all other expenses of the Depositary, including , without limitation, expenses or charges for printing, stationery, postage, insurances, cables, etc, are to be borne by the Depositary, or by the Company in accordance with agreements entered into from time to time with the Company.
Fees payable by the Depositary to the IssuerCitibank, as depositary, has agreed to reimburse Ericsson USD 5 million per year for expenses related to our ADS program (the “Program”), including Program-related legal fees, expenses related to investor relations in the US, US investor presentations, ADS-related financial advertising and public relations, fees and expenses of Citibank as administrator of the ADS Direct Plan, fees in relation to our Form 20-F and SOX compliance.
Citibank has further agreed to waive other ADS program related expenses amounting to USD 50,000 associated with the administration of the Program.
> any gain realized on the sale or other disposition of ADSs or Class B shares; and
> any “excess distribution” made to you (generally, any distributions to you in respect of ADSs or Class B shares during a single taxable year that are, in the aggregate, greater than 125 percent of the average annual distributions received by you in respect of ADSs or Class B shares during the three preceding taxable years or, if shorter, your holding period for ADSs or Class B shares).
Under these rules:
> the gain or excess distribution would be allocated ratably over your holding period for ADSs or Class B shares;
> the amount allocated to the taxable year in which the gain or excess distribution was realized and any year before we became a PFIC would be taxable as ordinary income and
> the amount allocated to each prior year, other than the current year and any taxable year prior to the first taxable year in which we were a PFIC, would be subject to tax at the highest applicable marginal tax rate in effect for each such year; and an interest charge would be imposed.
If we are a PFIC for any taxable year, you will also be deemed to own shares in any of our subsidiaries that are also PFICs in such a year. As an alternative to the special rules described above, holders of “marketable stock” in a PFIC may elect mark-to-market treatment with respect to their ADSs or Class B shares. ADSs or Class B shares will not be considered marketable stock unless they are regularly traded on a qualified exchange or other market. If the mark-to-market election is available and you elect mark-to-market treatment you will, in general, include as ordinary income each year an amount equal to the increase in value of your ADSs or Class B shares for that year (measured at the close of your taxable year) and will generally be allowed a deduction for any decrease in the value of your Class B shares for the year, but only to the extent of previously included mark-to-market income. However, a mark-to-market election would likely be unavailable with respect to your proportionate share in any of our subsidiaries that are PFICs.
If you own ADSs or Class B shares during any year in which we are a PFIC, you are required to make an annual return on IRS Form 8621 regarding distributions received with respect to ADSs or Class B shares and any gain realized on the disposition of your ADSs or Class B shares.
InFORmATIOn RePORTInG AnD bACkUP WIThhOLDInG
In general, information reporting requirements may apply to dividends paid in respect of ADSs or Class B shares and the proceeds received on the sale or exchange of the ADSs or Class B shares within the United States or by a broker with certain United States connections. Backup withholding, currently at a rate of 28 percent, may apply to payments to you of dividends paid in respect of ADSs or Class B shares or the proceeds of a sale or other disposition of ADSs or Class B

Ericsson Annual Report on Form 20-F 2010 | 145
The Company does not consider that reliance on the exemption from the audit committee independence requirements adversely affects the ability of the Audit Committee to act independently or satisfy other SEC requirements.
In addition, Ericsson relies on the exemption provided by the 2005 amendment to overcome the requirements regarding quorums for its General Meetings of Shareholders since they are contrary to Swedish law.
aUdit coMMittee pre-approval policies and procedUresThe Audit Committee reviews and approves the scope ofaudits to be performed (external and internal) and analyzesthe results and costs of the audits. The Committee makesrecommendations to the Board of Directors regarding theauditor’s performance. It also makes recommendations to theNomination Committee regarding the external auditor’s fees.In order to ensure the auditor’s independence, the AuditCommittee has established pre-approval policies andprocedures for non-audit related services to be performedby the external auditor. Pre-approval authority may not bedelegated to management. The policies and procedures includea list of prohibited services and services that require pre-approval by the Committee. Such services fall into twobroad categories:
> General pre-approval – certain services regarding taxes, transactions, risk management, corporate finance, attestation and accounting and so called general services.These services have received general pre-approval by the Audit Committee, provided that the estimated fee for each project does not exceed SEK 1 million. The external auditor must advise the Audit Committee of services rendered under the general pre-approval policy.
> Specific pre-approval – all other non-audit related servicesmust receive specific pre-approval. The Audit CommitteeChairman has the delegated authority for specific
preapproval in between Committee meetings, provided that the fee in each case does not exceed SEK 2.5 million. The Chairman reports any pre-approval to the Audit
Committee at its next meeting. For matters which may not be handled by the Chairman and require specific pre- approval by the Audit Committee, the auditor submits an application to the Parent Company for final approval by the Audit Committee
independence reQUireMentsThe Ericsson Board of Directors is subject to, and applies, a variety of independence requirements. However, it has sought and received exemptions from certain Sarbanes-Oxley Act and NASDAQ requirements, including those that are contrary to Swedish Law, see “NASDAQ Corporate Governance Exemptions” for more information.
nASDAq marketplace RulesIndependence requirements on the board of directors:
> A majority of the members of the board of directors must be independent in line with the NASDAQ rules. Ericsson has obtained an exemption from NASDAQ which means employee representative directors can be exempt from NASDAQ’s independence requirements.
Sarbanes-Oxley Act of 2002 and corresponding nASDAq rulesIndependence requirements on the audit committee:
> All members of the audit committee must be independent in line with the Sarbanes-Oxley Act of 2002. The Sarbanes-Oxley Act of 2002 includes a specific exemption for non-executive employee representatives. The Company does not consider that reliance on the exemption adversely affect the ability of the Audit Committee to act independently or satisfy other SEC requirements.
nASDAq Corporate Governance exemptionsFollowing a 2005 amendment to NASDAQ’s Marketplace Rules, foreign private issuers such as Ericsson may follow home-country practice in lieu of certain NASDAQ corporate governance requirements.
Before the amendment was adopted, NASDAQ’s Marketplace Rules stated that, upon application, foreign private issuers could be exempt from certain corporate governance requirements. This only applied when the requirements were contrary to the laws, rules or regulations, or generally accepted business practices of the issuer’s home jurisdiction.
Ericsson has received exemptions from NASDAQ’s corporate governance requirements under the Marketplace Rules (and is entitled to continue to rely thereon under the 2005 amendment). This is in order to allow:
> Employee representatives to be elected to the Board of Directors and serve on Committees (including the Audit Committee), in accordance with Swedish law.
> Shareholders to participate in the election of Directors and the Nomination Committee, in accordance with Swedish law and common market practice respectively.
> Employee representatives on the Board to attend all Board and Committee meetings (including those of the Audit Committee), in accordance with Swedish laws concerning attendance and decision making processes.

146 | Ericsson Annual Report on Form 20-F 2010
Accounts Act and filed with the Swedish Companies Registration Office (Bolagsverket), may be obtained upon request to: Telefonaktiebolaget LM Ericsson, External Reporting, SE-164 83 Stockholm, Sweden.
investMents The following listing shows certain shareholdings owned directly and indirectly by the Parent Company as of December 31, 2010. A complete listing of shareholdings, prepared in accordance with the Swedish Annual
ShAReS OWneD DIReCTLy by The PARenT COmPAny
Type Company Reg. no. Domicile
Percentageof ownership
Par valuein local
currency,million
Carryingvalue,
Sek million
Subsidiary companies
I Ericsson AB 556056-6258 Sweden 100 50 20,731
I Ericsson Shared Services AB 556251-3266 Sweden 100 361 2,216
I Netwise AB 556404-4286 Sweden 100 2 306
II AB Aulis 556030-9899 Sweden 100 14 6
III Ericsson Credit AB 556326-0552 Sweden 100 5 5
Other (Sweden) – – 2,083
I Ericsson Austria GmbH Austria 100 4 115
I Ericsson Danmark A/S Denmark 100 90 216
I Oy LM Ericsson Ab Finland 100 13 196
II Ericsson Participations France SAS France 100 26 524
I Ericsson GmbH Germany 100 20 4,227
I Ericsson Hungary Ltd. Hungary 100 1,301 120
II LM Ericsson Holdings Ltd. Ireland 100 2 15
I Ericsson Telecomunicazioni S.p.A. Italy 53 1) 23 3,151
II Ericsson Holding International B.V. The Netherlands 100 222 3,200
I Ericsson A/S Norway 100 75 114
II Ericsson Television AS Norway 100 161 1,788
I Ericsson Corporatia AO Russia 100 5 5
I Ericsson AG Switzerland 100 – –
II Ericsson Holding Ltd. United Kingdom 100 328 4,094
Other (Europe, excluding Sweden) – – 428
II Ericsson Holding II Inc. United States 100 2,830 29,006
I Cía Ericsson S.A.C.I. Argentina 95 2) 41 178
I Ericsson Telecom S.A. de C.V. Mexico 100 n/a 1,550
Other (United States, Latin America) – – 61
II Teleric Pty Ltd. Australia 100 20 100
I Ericsson Ltd. China 100 2 2
I Ericsson (China) Company Ltd. China 100 65 475
I Ericsson India Private Ltd. India 100 725 147
I Ericsson India Global Services PVT. Ltd India 100 389 65
I LG-Ericsson Ltd. Korea 50 100 1,943
I Ericsson (Malaysia) Sdn. Bhd. Malaysia 70 2 4
I Ericsson Telecommunications Pte. Ltd. Singapore 100 2 1
I Ericsson South Africa PTY. Ltd South Africa 100 10 108
I Ericsson Taiwan Ltd. Taiwan 80 240 20
I Ericsson (Thailand) Ltd. Thailand 49 3) 90 17
Other countries (the rest of the world) – – 349
Total – 77,566
Joint ventures and associated companies
I Sony Ericsson Mobile Communications AB 556615-6658 Sweden 50 50 4,136
II ST-Ericsson SA Switzerland 50 436 8,325
III ST-Ericsson AT SA Switzerland 51 5 275
I Ericsson Nikola Tesla d.d. Croatia 49 65 330
Total – 13,066
key to type of company I Manufacturing, distribution and development companiesII Holding companiesIII Finance companies
1) Through subsidiary holdings, total holdings amount to 100% of Ericsson Telecomunicazioni S.p.A.2) Through subsidiary holdings, total holdings amount to 100% of Cia Ericsson S.A.C.I. 3) Through subsidiary holdings, total holdings amount to 100% of Ericsson (Thailand) Ltd.

Ericsson Annual Report on Form 20-F 2010 | 147
ShAReS OWneD by SUbSIDIARy COmPAnIeS
Type Company Reg. no. DomicilePercentage
of ownership
Subsidiary companies
II Ericsson Cables Holding AB 556044-9489 Sweden 100
I Ericsson France SAS France 100
I LHS Telekommunikation GmbH & Co. KG 1) Germany 100
I LM Ericsson Ltd. Ireland 100
II Ericsson Nederland B.V. The Netherlands 100
I Ericsson Telecommunicatie B.V. The Netherlands 100
I Ericsson España S.A. Spain 100
I Ericsson Telekomunikasyon A.S. Turkey 100
I Ericsson Ltd. United Kingdom 100
I Ericsson Canada Inc. Canada 100
I Ericsson Inc. United States 100
I Ericsson IP Infrastructure Inc. United States 100
I Ericsson Services Inc. United States 100
I Drutt Corporation Inc. United States 100
I Optimi Corporation United States 100
I Redback Networks Inc. United States 100
I Ericsson Telecommunicações S.A. Brazil 100
I Ericsson Australia Pty. Ltd. Australia 100
I Ericsson (China) Communications Co. Ltd. China 100
I Nanjing Ericsson Panda Communication Co. Ltd. China 51
I Nippon Ericsson K.K. Japan 100
I Ericsson Communication Solutions Pte Ltd. Singapore 100
key to type of company I Manufacturing, distribution and development companiesII Holding companies
1) Disclosures Pursuant to Section 264b of the German Commercial Code (handelsgesetzbuch – hGb) Applying Section 264b HGB, LHS Holding GmbH & Co. KG, LHS Communication GmbH & Co. KG and LHS
Telekommunikation GmbH & Co. KG, all located in Frankfurt am Main/Germany, are exempted from the obligation to prepare, have audited and disclose financial statements and a management report in accordance with the legal requirements being applicable for German corporations.

148 | Ericsson Annual Report on Form 20-F 2010
Telefonaktiebolaget LM Ericsson’s shareholders are invited to participate in the Annual General Meeting to be held on Wednesday, April 13, 2011, at 3 p.m. at the Annex to the Ericsson Globe, Globentorget, Stockholm.
Registration and notice of attendanceShareholders who wish to attend the Annual General Meeting must
>> be recorded in the share register kept by Euroclear Sweden AB (the Swedish Securities Registry) on Thursday, April 7, 2011, and
>> give notice of attendance to the Company at the latest on Thursday, April 7, 2011. Notice of attendance can be given on Ericsson’s website: www.ericsson.com/investors, by telephone: +46 8 402 90 54 on weekdays between 10 a.m. and 4 p.m. or by fax: +46 8 402 9256.
Notice of attendance may also be given in writing to:Telefonaktiebolaget LM EricssonGeneral Meeting of ShareholdersBox 7835, SE-103 98 Stockholm, Sweden When giving notice of attendance, please state name, date of birth, address, telephone number and number of assistants.
The meeting will be conducted in Swedish and simultaneously interpreted into English.
Shares registered in the name of a nomineeIn addition to giving notice of attendance, shareholders who have their shares registered in the name of a nominee must request the nominee to temporarily enter the shareholder into the share register in order to be entitled to attend the meeting. In order for such registration to be effective on Thursday, April 7, 2011, shareholders should contact their nominee well before that day.
ProxyShareholders represented by proxy shall submit to the Company a power of attorney for the representative. A power of attorney issued by a legal entity must be accompanied by a copy of the entity’s certificate of registration (should no such certificate exist, a corresponding document of authority must be submitted). Such documents must be no more than one year old. In order to facilitate the registration at the Annual General Meeting, the power of attorney in original, certificates of registration and other documents of authority should be sent to the Company in advance. All documents should be sent to the Company at the address above for receipt by Tuesday, April 12, 2011. Forms of power of attorney in Swedish and English are available on Ericsson’s website: www.ericsson.com/investors.
DividendThe Board of Directors has decided to propose the Annual General Meeting to resolve on a dividend of SEK 2.25 per share for the year 2010 and that Monday, April 18, 2011 will be the record day for dividend.
Financial information from EricssonInterim reports 2011:
Shareholder>InformatIon
>> April 27, 2011 (Q1)
>> July 21, 2011 (Q2)>> October 20, 2011 (Q3)
>> January 25, 2012 (Q4)
Annual Report 2011: March, 20122010 Form 20-F for the US market: March, 2011
FOR PRINTED PUBLICATIONS, CONTACT:A printed copy of the Annual Report is provided on request. >> Strömberg Distribution
SE-120 88 Stockholm, Sweden Phone: +46 8 449 89 57, Email: [email protected]
>> In the United States, Ericsson’s Transfer Agent Citibank: Citibank Shareholder Services Registered holders: +1 877 881 59 69 (toll free within the U.S.) Interested investors: +1 781 575 45 55 (outside of the U.S.) Email: [email protected] www.citi.com/dr Ordering a hard copy of the Annual Report: Phone toll free: +1 866 216 046 http://proxy.georgeson.com/annualreport/ericsson.htm
WHERE YOU CAN FIND OUT MORE:It is our ambition to provide our shareholder with up to date information about Ericsson and its development. Information is available on Ericsson’s website: www.ericsson.com
On the website, the Annual Report is available as either an online version or as a pdf document. Previous Annual and Quarterly reports and other relevant shareholder information can be found on:www.ericsson.com/investors
By publishing the Annual Report on the web, we will not only reduce the cost for print and distribution, but also the impact on the environment.The Annual Report on Form 20-F (filed with the Securities and Exchange Commission, SEC) is also available www.ericsson.com/investors
CONTACT INFORMATIONHeadquartersTorshamnsgatan 23 Kista SwedenRegistered officeTelefonaktiebolaget LM EricssonSE–164 83 StockholmSwedenInvestor RelationsFor questions on the Company, please contact Investor Relations:>> Investor Relations for Europe, Middle East,
Africa and Asia Pacific: Telefonaktiebolaget LM Ericsson SE-164 83 Stockholm, Sweden Telephone: +46 10 719 00 00 Email: [email protected]
>> Investor Relations for the Americas: Ericsson, The Grace Building 1114 Ave of the Americas, Suite #3410 New York, NY 10036, USA Telephone: +1 212 685 40 30 Email: [email protected]

Ericsson Annual Report on Form 20-F 2010 | 149
GLOSSARY2GFirst digital generation of mobile systems, includes GSM, TDMA, PDC and cdmaOne.
3G3rd generation mobile system, includes WCDMA/HSPA, EDGE, CDMA2000 and TD-SCDMA.
4GSee LTE.
All-IPA single, common IP infrastructure that can handle all network services, including fixed and mobile communications, for voice and data services and also video services such as TV.
ARPUAverage Revenue Per User.
ATM(Asynchronous Transfer Mode) A communication standard for transmission and management of high-speed packet-switched networks.
BackhaulTransmission between radio base stations and the core network.
BroadbandData speeds that are high enough to allow transmission of multimedia services with good quality.
CapexCapital expenditure.
CDMA (Code division multiple access) The cdmaOne (2G) and CDMA2000 (3G) mobile communication standards are both based on CDMA.
EDGEA 3G mobile standard, developed as an enhancement of GSM. Enables the transmission of data at speeds up to 250 kbps.
Emerging marketDefined as a country that has a GNP per capita index below the World Bank average and a mobile subscription penetration below 60 percent.
Evo RANA Radio Access Network (RAN) solution to run GSM, WCDMA and LTE as a single network.
Exabyte= billion gigabytes.
FTTH(Fiber-to-the-home) refers to fiber optic broadband connections to individual homes.
GDPGross domestic product the total annual cost of all finished goods and services produced within a country.
GPON(Gigabit Passive Optical Network) Used for fiber-optic communication to the home (FTTH).
GPRS(General Packet Radio Service)A packet-switched technology (2.5G) that enables GSM networks to handle mobile data communications at rates up to 115 kbps.
HSPA(High Speed Packet Access) Enhancement of 3G/WCDMA that enables mobile broadband.
ICTInformation and Communication Technology.
IMS(IP Multimedia Subsystem) A standard for offering voice and multimedia services over mobile and fixed networks using internet technology (IP).
IP(Internet Protocol) Defines how information travels between network elements across the internet.
IPTV(IP Television) A technology that delivers digital television via fixed broadband access.
JV(Joint venture) A business enterprise in which two or more companies enter a partnership.
LTE(Long-Term Evolution) The next evolutionary step of mobile technology beyond HSPA, allowing data rates above 100 Mbps.
Managed servicesManagement of operator networks and/or hosting of their services.
OpexOperating expenses.
PenetrationThe number of subscriptions divided by the population in a geographical area.
SoftswitchA software-based system for handling call management functionality. Integrates IP-telephony and the legacy circuit-switched part of the network.
TDMTime division multiplexing, legacy technology for circuit switching.
WCDMA(Wideband Code Division Multiple Access) A 3G mobile communication standard. WCDMA builds on the same core network infrastructure as GSM.
xDSL Digital Subscriber Line technologies for broadband multimedia communications in fixed line networks. Examples: IP-DSL, ADSL and VDSL.

150 | Ericsson Annual Report on Form 20-F 2010
fInanCIal>termInoloGYCapital employedTotal assets less non-interest-bearing provisions and liabilities.
Capital turnoverNet sales divided by average Capital employed.
Cash conversionCash flow from operating activities divided by net income reconciled to cash – expressed in percent.
Cash dividends per shareDividends paid divided by average number of shares, basic.
Compound annual growth rate(CAGR)The year-over-year growth rate over a specified period of time.
Days sales outstanding (DSO)Trade receivables balance at quarter end divided by Net Sales in the quarter and multiplied by 90 days. If the amount of trade receivables is larger than last quarter’s sales, the excess amount is divided by Net Sales in the previous quarter and multiplied by 90 days, and total days outstanding (DSO) are the 90 days of the most current quarter plus the additional days from the previous quarter.
Earnings per shareBasic earnings per share; profit or loss attributable to stockholders of the Parent Company divided by the weighted average number of ordinary shares outstanding during the period. Diluted earnings per share; the weighted average number of shares outstanding are adjusted for the effects of all dilutive potential ordinary shares.
EBITA marginEarnings Before Interest, Taxes, Amortization and write-downs of acquired intangibles, as a percentage of Net Sales.
Equity ratioEquity, expressed as a percentage of total assets.
Gross CashCash and cash equivalents plus short-term investments.
Inventory turnover days(ITO-days) 365 divided by inventory turnover, calculated as total adjusted cost of sales divided by the average inventories for the year (net of advances from customers).
Net cashCash and cash equivalents plus short-term investments less interest-bearing liabilities and post-employment benefits.
Payable daysThe average balance of Trade payables at the beginning and at the end of the year divided by Cost of sales for the year, and multiplied by 365 days.
Payment readinessCash and cash equivalents and short-term investments less short-term borrowings plus long-term unused credit commitments. Payment readiness is also shown as a percentage of Net Sales.
Return on capital employedThe total of Operating income plus Financial income as a percentage of average capital employed (based on the amounts at January 1 and December 31).
Return on equityNet income attributable to stockholders of the Parent Company as a percentage of average Stockholders’ equity (based on the amounts at January 1 and December 31).
Stockholders’ equity per shareStockholders’ equity divided by the number of shares outstanding at end of period, basic.
Total Shareholder Return (TSR)The increase or decrease in share price during the period plus dividends paid, expressed as a percentage of the share price at the start of the period.
Trade receivables turnover Net sales divided by average Trade receivables.
Value at Risk (VaR)A statistical method that expresses the maximum potential loss that can arise with a certain degree of probability during a certain period of time.
Working capitalCurrent assets less current non-interest-bearing provisions and liabilities.

Ericsson Annual Report on Form 20-F 2010 | 151
SignatureS
The registrant hereby certifies that it meets all of the requirements for filing on Form 20-F and that it has duly caused and authorized the undersigned to sign this Annual Report on its behalf.
TELEFONAKTIEBOLAGET LM ERICSSON
March 30, 2011
By: /S/ ROLAND HAGMAN Roland Hagman
By: /S/ NINA MACPHERSON Nina Macpherson