Embed Size (px)
Citation preview

Virtual Crop Modeling for Genetic
Improvement and Understanding G x E
InteractionsK. J. Boote, University of Florida
Presented Oct 5, 2015, CIAT
Source: Monica Ozores-Hampton
What is it and Why Do Virtual Crop Modeling?
Virtual Crop Modeling is the use of dynamic crop growth models to hypothesize plant genetics (phenology, processes and plant architecture) that will enhance crop growth and yield in defined target environments (weather, soils, limited resource, etc.).
Why? With improved tools (molecular genetics, advanced crop models) and urgent mission of adapting to climate change and feeding increased world population, it is timely to use these tools to hypothesize genetic improvement in yield.
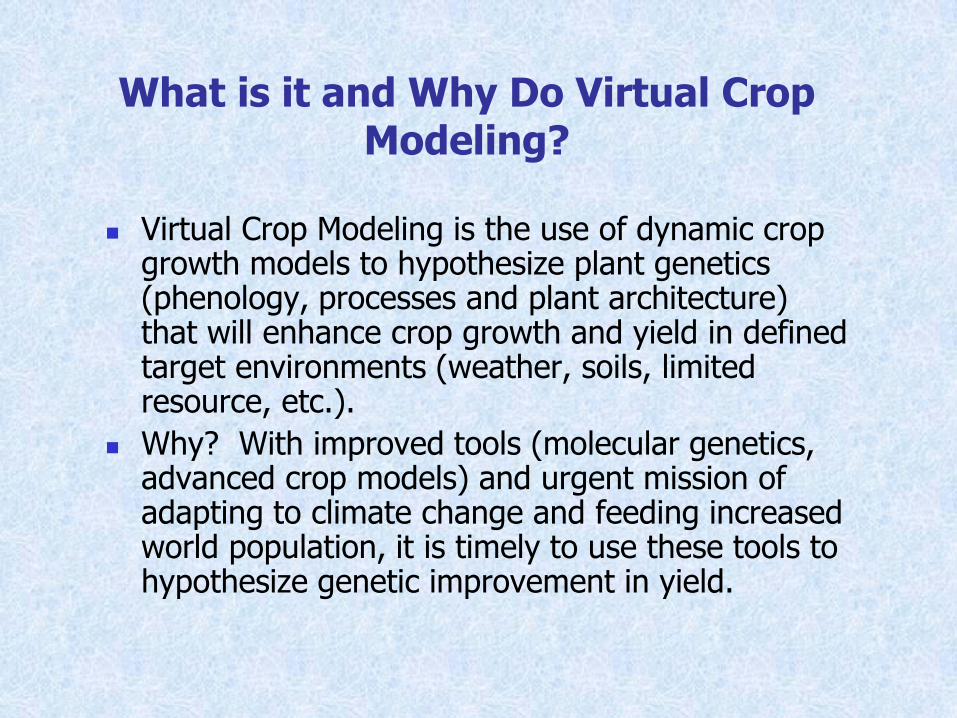
Virtual Cultivars and Technologies to Improve Food Security under Climate Change
Realistic Representation of Regions & Genetic Gain
Need observed weather & realistic GCM scenarios Soils representative of the regions (water-holding
capacity, soil organic C, crop history-soil quality, initial conditions)
Management representative of regions (sowing dates, sowing density, fertilization, manuring, pest damage)
Cultivars representative of the region (life cycle) Realistic view of genetic gain (document that the
varied traits are within range of reported values) Understand the limitations of the crop models:
Current limitations. Need new abilities/traits for water logging, salinity, soil Al saturation, etc.

University of Florida, Gainesville, Florida USA
Model Sensitivity Analyses to
Hypothesize Yield Improvement
What is model’s realism for representing each
physiological process (mode of action)?
Can only vary traits (GSPs) the model considers.
Vary traits within the range of reported values (talk to
plant breeders & review literature)
Sensitivity analysis of GSPs, single factor evaluation
Create virtual cultivars with combinations of GSPs to
improve yield for target environments
G x E interactions as emergent outcomes
Linking QTLs/genes to crop models to predict
phenotype. UF’s NSF bean project.

CROPGRO Model Structure Relative to
Genetics of each Species
CROPGRO source code: Generic for all crops
Species file: “Read-in” file for each crop, with• Initializations, compositions, photosynthesis traits, Ps
response to leaf N, vegetative partitioning, etc.
• Describes sensitivities of processes: photosynthesis, respiration, N-fixation, crop development, leaf area growth, pod addition, single seed growth rate, leaf senescence, & canopy height/width to climatic factors of temperature, water deficit, solar radiation.
Cultivar & Ecotype files: Contain Genotype-Specific Parameters (GSPs), e.g., EM-FL, SD-PM, TRIFL, WTPSD, THRSH, LFMAX, SLAVR, SDPRO, etc.
GSPs: defined at optimum thermal-light-daylength conditions.
Species file defines environmental sensitivities.
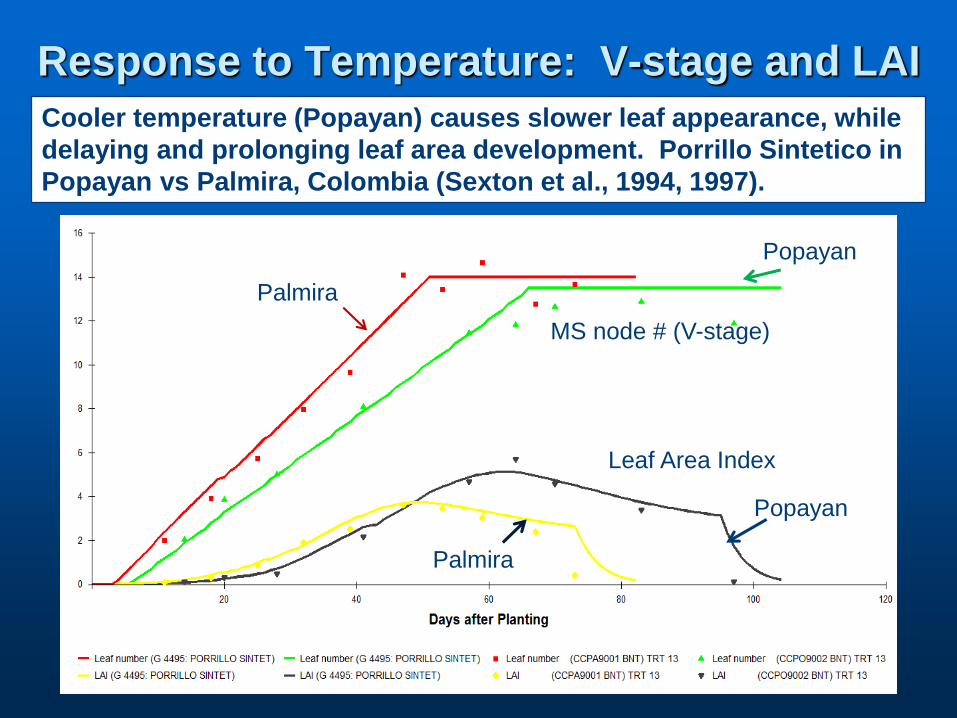
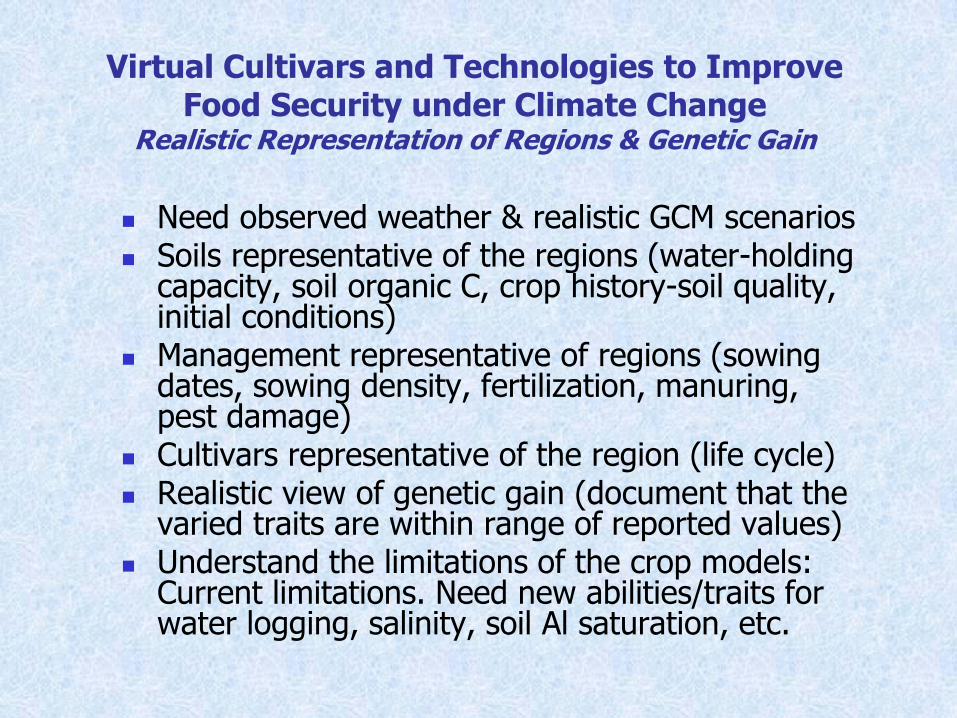
Response to Temperature: V-stage and LAI
Cooler temperature (Popayan) causes slower leaf appearance, while
delaying and prolonging leaf area development. Porrillo Sintetico in
Popayan vs Palmira, Colombia (Sexton et al., 1994, 1997).
Leaf Area Index
MS node # (V-stage)
Popayan
Popayan
Palmira
Palmira

University of Florida, Gainesville, Florida USA
Response to Temperature: Crop & pod mass
Cooler temperature (Popayan) initially delays dry matter accumulation
and delays onset of pod growth for Porrillo Sintetico in Popayan vs
Palmira, Colombia (Sexton et al., 1994, 1997). But yield is higher.
Pod Mass
Crop Biomass Popayan
Palmira
Palmira

University of Florida, Gainesville, Florida USA
Response to Water Deficit: Reduced LAI
LAI of Porrillo Sintetico grown at Gainesville, Florida, under 4-day
irrigation schedule, 8-day irrigation schedule, and rainfed.
Popayan

University of Florida, Gainesville, Florida USA
Response to Water Deficit: Crop Biomass
Total crop mass of Porrillo Sintetico grown at Gainesville, Florida,
under 4-day irrigation, 8-day irrigation schedule, and rainfed.
Popayan
University of Florida, Gainesville, Florida USA
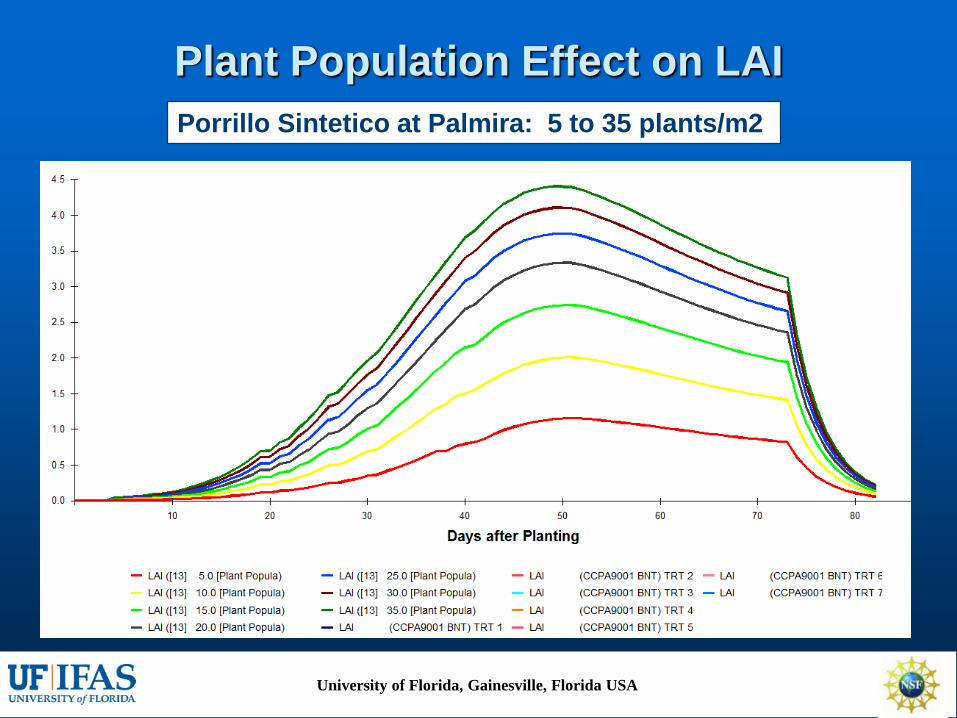
Plant Population Effect on LAI
Porrillo Sintetico at Palmira: 5 to 35 plants/m2
Leaf Area Index
MS node # (V-stage)
Popayan
Popayan

University of Florida, Gainesville, Florida USA
Plant Population Effect on Seed Yield
Leaf Area Index
Popayan
Porrillo Sintetico at Palmira: 5 to 35 plants/m2

University of Florida, Gainesville, Florida USA
CULTIVAR (GSP) Traits: Differ among cultivars
within species.
Users will change Cultivar traits
Traits that determine life cycle and phase durations, sensitivity to day length (phase modifiers)
Reproductive traits such as seed fill duration, duration of pod addition, seed size, # seeds/pod
Veg. & growth traits such as: SLA, determinacy, leaf photosynthesis rate
Seed composition (oil, protein)

University of Florida, Gainesville, Florida USA
GSPs for CROPGRO-Bean – Phase Modifiers
NAME Jatu
Rong
Porrillo
Sintet.
DEFINITION
CSDL 12.17 13.50 Critical Short Day Length below
which repr development
progresses with no day length
effect (hours)
PPSEN 0.040 0.017 Slope of the relative response of
development to photoperiod with
time (1/hour)
Jatu Rong is like Calima; Porrillo S. is like Jamapa

University of Florida, Gainesville, Florida USA
GSPs for CROPGRO-Bean – Life Cycle Duration
NAME Jatu
Rong
Porrillo
Sintet.
DEFINITION
EM-FL 23.0 31.5 Time between plant emergence
and first flower appearance (ptd)
FL-SH 2.0 3.0 Time between first flower and
first pod (ptd)
FL-SD 9.5 8.0 Time between first flower and
first seed (ptd)
SD-PM 18.5 20.5 Time between first seed and
beginning maturity (ptd)

GSPs for CROPGRO-Bean - Vegetative
NAME Jatu
Rong
Porrillo
Sintet.
DEFINITION
FL-VS 0.0 11.0 Time from first flower to MS
node termination (ptd)
FL-LF 10.0 21.0 Time from first flower to end of
leaf expansion (ptd)
LFMAX 0.99 1.00 Maximum leaf photosynthesis
rate at 30 C, 350 vpm CO2, &
high light (mg CO2/m2-s)
SLAVR 295 300 Specific leaf area of cultivar
under good conditions (cm2/g)
SIZLF 140 150 Maximum size of full trifoliate (3
leaflets) (cm2)

GSPs for CROPGRO-Bean - Reproductive
NAME Jatu
Rong
Porrillo
Sintet.
DEFINITION
XFRT 1.00 1.00 Maximum fraction of daily growth
that is partitioned to seed+shell
WTPSD 0.35 0.23 Maximum potential weight per
seed (g)
SFDUR 14.0 21.0 Seed filling duration for pod
cohort at good conditions (ptd)
SDPDV 4.30 5.20 Average seed per pod under
good conditions (#/pod)
PODUR 9.0 11.5 Time required to reach final pod
load under optimal condition
(ptd)
University of Florida, Gainesville, Florida USA
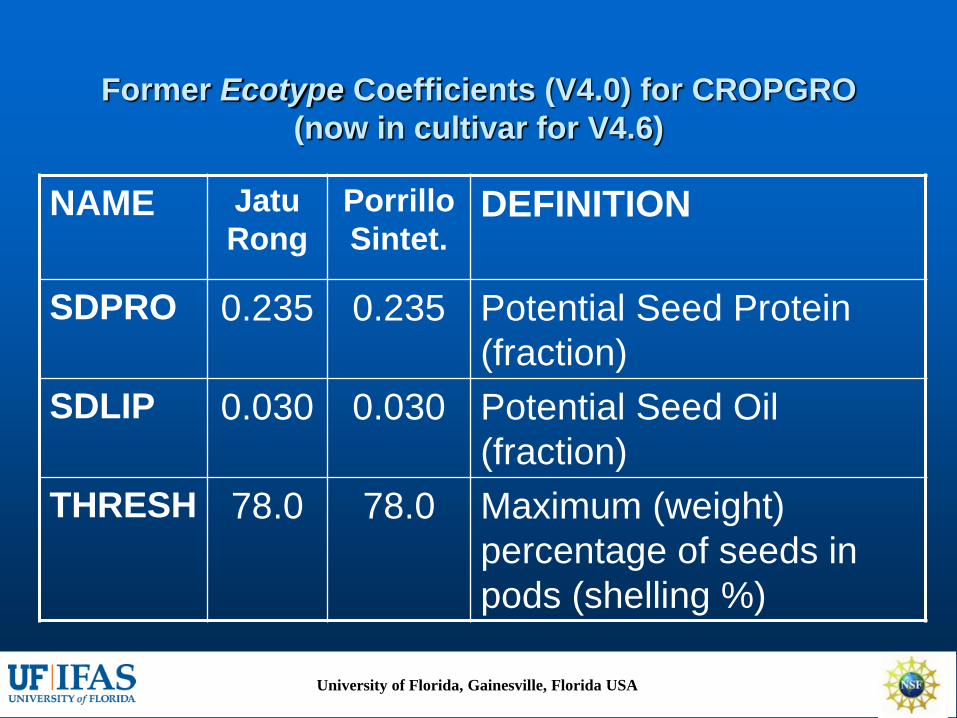
Former Ecotype Coefficients (V4.0) for CROPGRO
(now in cultivar for V4.6)
NAME Jatu
Rong
Porrillo
Sintet.DEFINITION
SDPRO 0.235 0.235 Potential Seed Protein
(fraction)
SDLIP 0.030 0.030 Potential Seed Oil
(fraction)
THRESH 78.0 78.0 Maximum (weight)
percentage of seeds in
pods (shelling %)
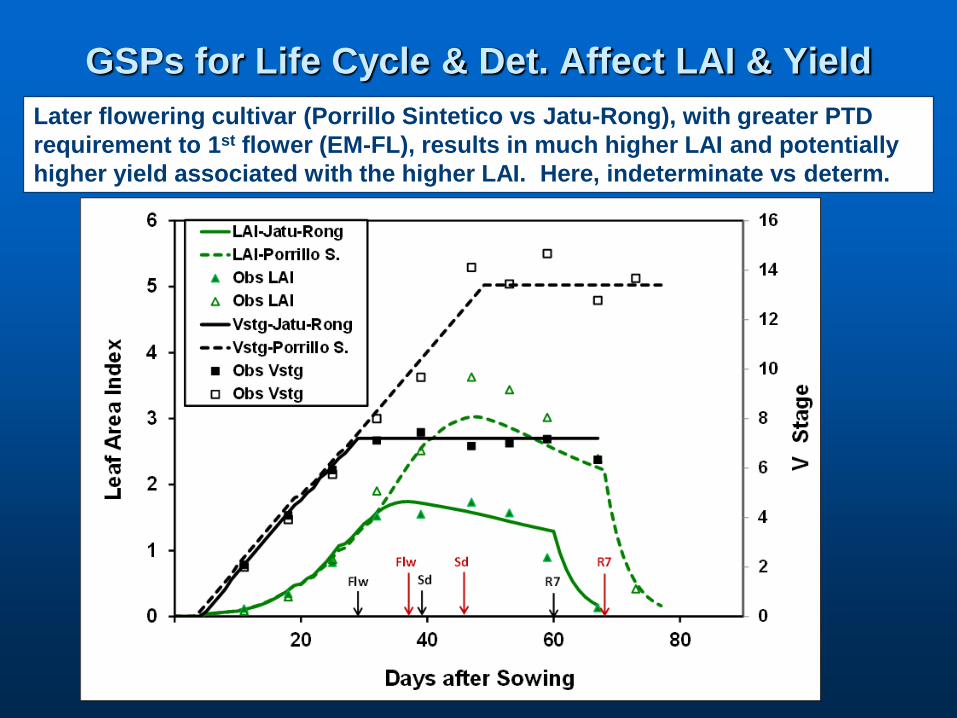
GSPs for Life Cycle & Det. Affect LAI & Yield
Later flowering cultivar (Porrillo Sintetico vs Jatu-Rong), with greater PTD
requirement to 1st flower (EM-FL), results in much higher LAI and potentially
higher yield associated with the higher LAI. Here, indeterminate vs determ.

University of Florida, Gainesville, Florida USA
Model Sensitivity Analyses to
Hypothesize Yield Improvement
What is model’s realism for representing each
physiological process (mode of action)?
Can only vary traits (GSPs) the model considers
Vary traits within the range of reported values (talk to
plant breeders & review literature)
Sensitivity analysis of GSPs, single factor evaluation

University of Florida, Gainesville, Florida USA
Soybean Yield Response to Filling Period - Iowa
0
1000
2000
3000
4000
5000
-30 -20 -10 0 10 20 30 40
Change in Filling Period, days
Se
ed
Yie
ld, k
g/h
a
Std N Mobil
20% slower N Mobil
Std - Drought Years
Soybean Yield Response to Filling Period in Iowa: With fixed season length,
longer filling period caused lower LAI, fewer MS nodes, less root, more H2O stress.
No benefit in
drought years
Range

University of Florida, Gainesville, Florida USA
Soybean Harvest Index vs. Filling Period - Iowa
0
0.1
0.2
0.3
0.4
0.5
0.6
-30 -20 -10 0 10 20 30 40
Change in Filling Period, days
Se
ed
Ha
rve
st
Ind
ex
Std N Mobil
20% slower N Mobil
Std - Drought Years
The longer filling period caused increased seed harvest index, so
HI is not an independent trait of its own.
Range

University of Florida, Gainesville, Florida USA
0
1000
2000
3000
4000
5000
0.0 0.4 0.8 1.2 1.6 2.0 2.4
Leaf Photosynthesis, mg CO2/m2/s
Gra
in Y
ield
, k
g/h
a
Ps - Not Coupled
Ps - Coupled to SLW
Genetic Range
Soybean grain yield response to increasing leaf Ps: not
coupled, or coupled to SLW, compared to genetic range.
University of Florida, Gainesville, Florida USA
Model Sensitivity Analyses to
Hypothesize Yield Improvement
Create virtual cultivars with combinations of GSPs to
improve yield for target environments

University of Florida, Gainesville, Florida USA
GSP Traits for CROPGRO-Bean: Jamapa, conservative changes
VCM-Jamapa (heat sus) EMFL FLSD SDPM LFMAX PODUR SFDUR
ptd ptd ptd mg/m2/s ptd ptd
Jamapa-baseline 29.0 10.5 20.20 1.00 11.0 20.0
Jama-10%shorter cycle 26.1 9.5 18.20 1.00 11.0 20.0
Jama-10%longer cycle 31.9 11.5 22.20 1.00 11.0 20.0
Jamapa-base+yield 29.0 10.5 20.20 1.10 10.0 22.0
Jama-10%short+yield 26.1 9.5 18.20 1.10 10.0 22.0
Jama-10%longer+yield 31.9 11.5 22.20 1.10 10.0 22.0
Repeat heat-tolerance (2C more tolerant podset,grainfill,partitioning)
Repeat with 6 VCM heat-susceptible and 6 heat-tolerant. Also, 6 with drought tolerance: with +5% (DUL-LL) & shifted rooting depth.

University of Florida, Gainesville, Florida USA
Creating the Heat-Tolerant Dry Bean Species File
Heat Susceptible (Default species file – Dry Bean) 7.0 22.0 25.0 36.0 QDR FNPDT(1-4),TYPPDT-TEMP EFFECT ON POD SET4.0 23.0 25.0 38.0 QDR FNSDT(1-4),TYPSDT-TEMP EFFECT ON SD GRWTH0.0 10.0 15.0 30.0 38.0 60.0 XXFTEM(1-6),TEMPERATURES
1.00 1.00 1.00 1.00 0.00 0.00 YXFTEM(1-6),REL CHG IN PARTIT
Heat Tolerant (Modified species file – Dry Bean) 7.0 22.0 27.0 38.0 QDR FNPDT(1-4),TYPPDT-TEMP EFFECT ON POD SET4.0 23.0 27.0 40.0 QDR FNSDT(1-4),TYPSDT-TEMP EFFECT ON SD GRWTH0.0 10.0 15.0 32.0 40.0 60.0 XXFTEM(1-6),TEMPERATURES
1.00 1.00 1.00 1.00 0.00 0.00 YXFTEM(1-6),REL CHG IN PARTIT
University of Florida, Gainesville, Florida USA
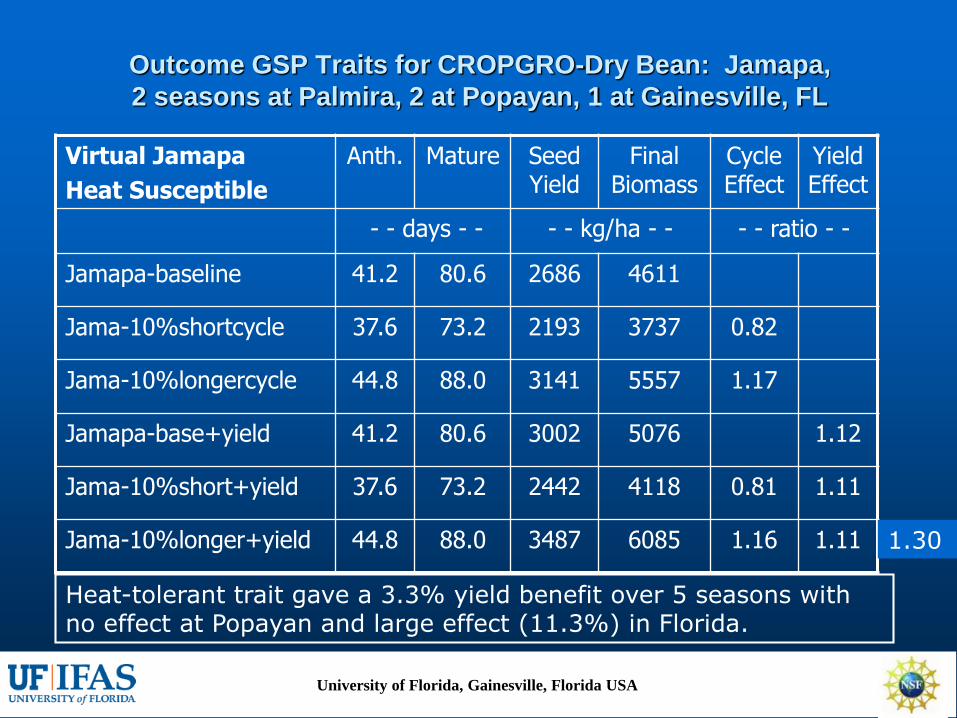
Outcome GSP Traits for CROPGRO-Dry Bean: Jamapa,
2 seasons at Palmira, 2 at Popayan, 1 at Gainesville, FL
Virtual Jamapa
Heat Susceptible
Anth. Mature Seed Yield
Final Biomass
Cycle Effect
Yield Effect
- - days - - - - kg/ha - - - - ratio - -
Jamapa-baseline 41.2 80.6 2686 4611
Jama-10%shortcycle 37.6 73.2 2193 3737 0.82
Jama-10%longercycle 44.8 88.0 3141 5557 1.17
Jamapa-base+yield 41.2 80.6 3002 5076 1.12
Jama-10%short+yield 37.6 73.2 2442 4118 0.81 1.11
Jama-10%longer+yield 44.8 88.0 3487 6085 1.16 1.11
Heat-tolerant trait gave a 3.3% yield benefit over 5 seasons with no effect at Popayan and large effect (11.3%) in Florida.
1.30

University of Florida, Gainesville, Florida USA
GSP Traits for CERES-Maize: Composite of Garst808 & WH403 for life
cycle, mid-way for G2 & G3. GSP:+5% RUE,+5% G2,+5% G3
Virtual Maize Cultivar (heat susceptible)
P1 P5 RUE G2 G3
GDD GDD g/MJ-par # G.R.
VCM-maize baseline 250 730 4.2 800 7.80
VCM-10% shorter cycle 215 650 4.2 800 7.80
VCM-10% longer cycle 285 810 4.2 800 7.80
VCM-base+yield 250 730 4.4 840 8.19
VCM-10% shorter+yield 215 650 4.4 840 8.19
VCM-10% longer+yield 285 810 4.4 840 8.19
VCM heat-tol. (RGFIL 5.5 16.0 27.0 35.0, to 5.5 16.0 29.0 37.0)
Drought-tolerance: mimic with +5% (DUL-LL) & shifted rooting.

University of Florida, Gainesville, Florida USA
Outcome GSP Traits for CERES-Maize: Tested in 7 seasons
(Ethiopia, Ghana, South Carolina, Iowa, Hawaii, 2 in Florida)
Virtual Maize Cultivar (heat susceptible)
Anth. Mature Grain Yield
Final Biomass
Cycle Effect
Yield Effect
- - days - - - - kg/ha - - - - ratio - -
VCM-maize baseline 66 115 7766 18338
VCM-10% shorter cycle 62 105 6506 16317 0.84
VCM-10% longer cycle 71 126 8634 20008 1.11
VCM-base+yield 66 115 8812 19644 1.13
VCM-10% shorter+yield 62 105 7468 17606 0.85 1.15
VCM-10% longer+yield 71 126 9768 21372 1.11 1.13 1.26
Heat-tol. trait gave 2.5% yield increase over 7 seasons, no effect for Ethiopia, Hawaii, and Iowa, but more effect (8.0%) in S. Carolina

University of Florida, Gainesville, Florida USA
Model Sensitivity Analyses to
Hypothesize Yield Improvement
G x E interactions as emergent outcomes. Additivity of
many GSPs for yield.

University of Florida, Gainesville, Florida USA
Origin of Genotype by Environment
Interactions, from Model Perspective
Different life cycles, differential phase durations… If E varies during season.
Different temperature sensitivity of a process: If temperature in E differs (for site and year). Rare?
Different rooting or WUE trait: If water deficit, but depends on timing.
Depends on whether trait/process is neutral or costly in good E.
Location (=E), vary in soil WHC, rainfall, temperature.
Management (=E), vary N supply or irrigation.
Simulated GxE is caused by CO2, water, N & temp
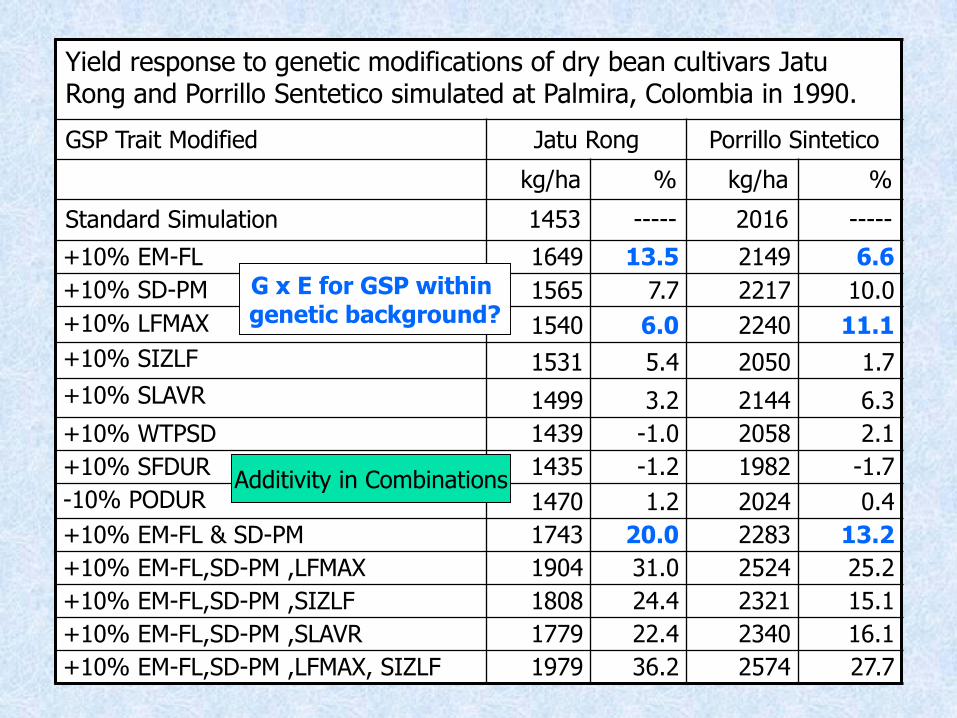
Yield response to genetic modifications of dry bean cultivars JatuRong and Porrillo Sentetico simulated at Palmira, Colombia in 1990.
GSP Trait Modified Jatu Rong Porrillo Sintetico
kg/ha % kg/ha %
Standard Simulation 1453 ----- 2016 -----
+10% EM-FL 1649 13.5 2149 6.6
+10% SD-PM 1565 7.7 2217 10.0
+10% LFMAX 1540 6.0 2240 11.1
+10% SIZLF 1531 5.4 2050 1.7
+10% SLAVR 1499 3.2 2144 6.3
+10% WTPSD 1439 -1.0 2058 2.1
+10% SFDUR 1435 -1.2 1982 -1.7
-10% PODUR 1470 1.2 2024 0.4
+10% EM-FL & SD-PM 1743 20.0 2283 13.2
+10% EM-FL,SD-PM ,LFMAX 1904 31.0 2524 25.2
+10% EM-FL,SD-PM ,SIZLF 1808 24.4 2321 15.1
+10% EM-FL,SD-PM ,SLAVR 1779 22.4 2340 16.1
+10% EM-FL,SD-PM ,LFMAX, SIZLF 1979 36.2 2574 27.7
Additivity in Combinations
G x E for GSP within genetic background?
University of Florida, Gainesville, Florida USA
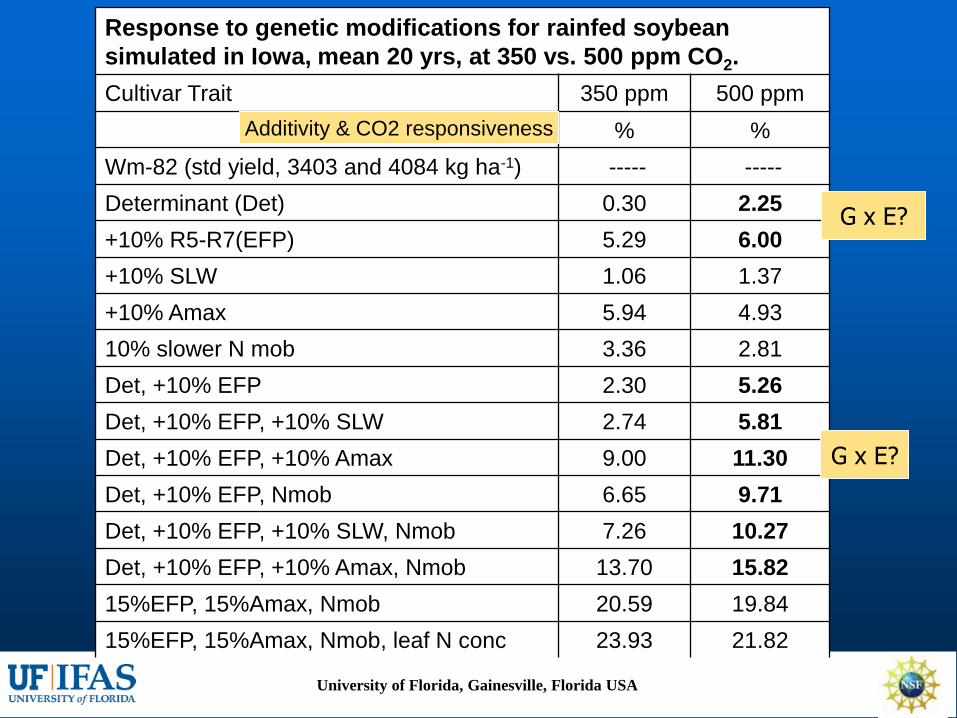
Response to genetic modifications for rainfed soybean
simulated in Iowa, mean 20 yrs, at 350 vs. 500 ppm CO2.
Cultivar Trait 350 ppm 500 ppm
% %
Wm-82 (std yield, 3403 and 4084 kg ha-1) ----- -----
Determinant (Det) 0.30 2.25
+10% R5-R7(EFP) 5.29 6.00
+10% SLW 1.06 1.37
+10% Amax 5.94 4.93
10% slower N mob 3.36 2.81
Det, +10% EFP 2.30 5.26
Det, +10% EFP, +10% SLW 2.74 5.81
Det, +10% EFP, +10% Amax 9.00 11.30
Det, +10% EFP, Nmob 6.65 9.71
Det, +10% EFP, +10% SLW, Nmob 7.26 10.27
Det, +10% EFP, +10% Amax, Nmob 13.70 15.82
15%EFP, 15%Amax, Nmob 20.59 19.84
15%EFP, 15%Amax, Nmob, leaf N conc 23.93 21.82
Additivity & CO2 responsiveness
G x E?
G x E?

Simulated peanut seed yield response to genetic modification, grown rainfed with 15 years of weather at Wa, Ghana, CROPGRO-Peanut.
Cultivar Trait Modified
Ambient380 ppm
CO2
500 ppm+3 ºCtemp
500 ppm+3 ºC
-20%RF- - - - - - - - - % change - - - - - - - - -
Chinese(90-d std) (kg ha-1) 1841 2248 1553 1770+10% Amax (leaf Ps) 7.3 6.4 6.9 5.4+10% Specific Leaf Area 0.5 0.5 0.5 0.0+10% EMFL 4.2 3.6 4.3 3.9+10% SDPM 9.0 8.3 12.6 12.4+10% EMFL & SDPM 12.4 11.1 16.1 14.6+10% WTPSD (wt/sd) 0.7 0.8 0.7 0.5-10% Pod Adding Duration 0.1 0.7 3.9 3.6+10% XFRT (partitioning) 3.4 3.8 5.3 5.7+10% SIZLF (veg. vigor) 1.5 1.4 0.9 0.8EMFL, SDPM, XFRT 16.5 15.5 21.3 19.7EMFL, SDPM, Amax 20.4 18.0 22.7 20.3EMFL,SDPM,XFRT, Amax 24.7 22.6 28.6 25.8
Additivity in all Env.
Positive Int’n.
G x E?
G x E?
Real: +80%

Response to genetic modifications of Annigeri chickpea simulated rainfed (rabi) or irrigated for 22 yrs at Patancheru, India, CROPGRO.
Cultivar Trait Rainfed (Rabi) Irrigated
kg/ha % kg/ha %
Standard Annigeri †† 773 ----- 2614 -----
+10% rate of root depth progression 791 2.3 2614 0.0
+10% Amax 783 1.3 2961 13.3
+10% SLW 916 18.5 2328 -10.9
+10% to anthesis (EM-FL) LAI Tr 669 -13.5 3016 15.4
+10% seed-fill (SD-PM) 787 1.8 2893 10.7
+10% seed size (WTPSD) 746 -3.5 2709 3.6
+10% faster pod addition (PODUR) 774 0.2 2717 3.9
†† Sown day 302 on very fine montmorillonitic clay at field capacity
Trait response depends on “water” environment: Is this G x E?
Lower LAI-conserve H2O
Same gene “action”, benefit in one E, negative in 2nd E

Yield response to genetic modifications for sorghum grown rainfed with 20 or 80 kg N ha-1 for 15 yrs at Wa, Ghana, CERES-Sorghum
Cultivar Trait Yield 20 kg N
Yield 80 kg N
LAI80 kg N
Maturity
(both)
- - % change - - m2 m2 days
Generic Indian cultivar (kg/ha) 1409 3367 3.79 101.5
P1=369 GDD (juvenile phase) 2.9 -3.9 3.14 99.4
P1=451 GDD -1.8 2.3 4.41 104.0
P5=486 GDD (grain fill period) -3.2 -2.9 3.79 98.7
P5=594 GDD 3.9 2.3 3.79 104.6
G1=0 (scalar for leaf size) 0.9 -2.5 3.35 101.5
G1=6 -0.6 0.8 4.05 101.5
G2=5 (scalar: partition to grain) -5.8 -9.2 3.79 101.5
G2=6 6.0 6.3 3.79 101.5
PHINT=44 GDD (phyll. interv.) -1.6 1.7 4.27 101.8
PHINT=54 GDD 1.5 -3.2 3.16 101.5
P1=451, P5=594 1.4 4.6 4.41 106.8
P1=451, P5=594, G2=6 7.7 10.0 4.41 106.8
G x E depends on N rateAdditivity (more at high N)

University of Florida, Gainesville, Florida USA
Model Sensitivity Analyses to
Hypothesize Yield Improvement
Linking QTLs/genes to crop models to predict
phenotype. UF’s NSF bean project.
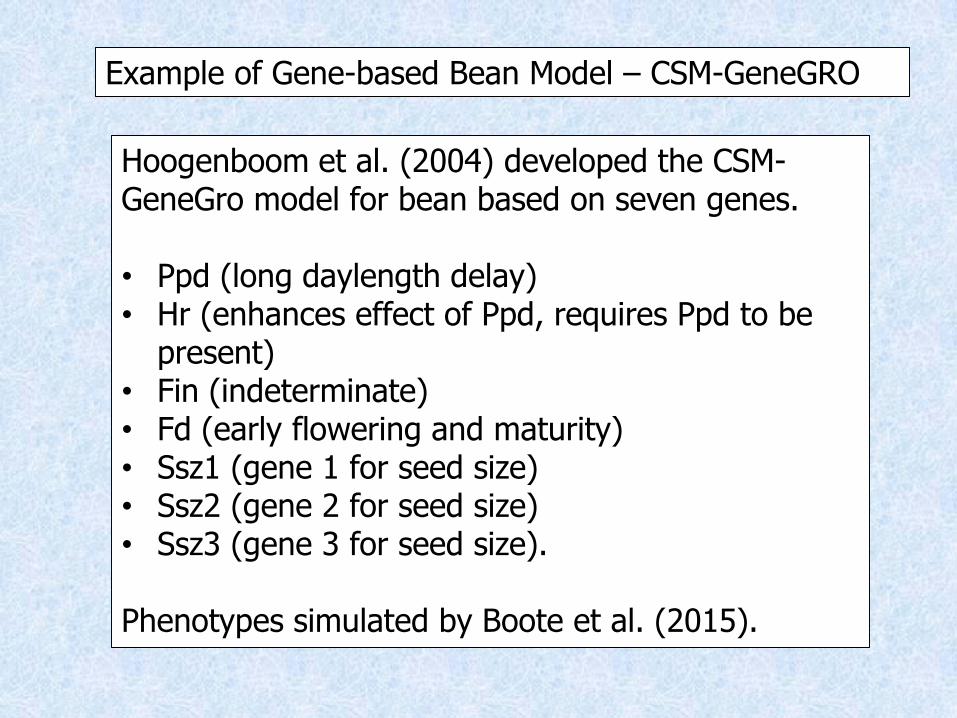
Hoogenboom et al. (2004) developed the CSM-GeneGro model for bean based on seven genes.
• Ppd (long daylength delay)• Hr (enhances effect of Ppd, requires Ppd to be
present)• Fin (indeterminate)• Fd (early flowering and maturity)• Ssz1 (gene 1 for seed size)• Ssz2 (gene 2 for seed size)• Ssz3 (gene 3 for seed size).
Phenotypes simulated by Boote et al. (2015).
Example of Gene-based Bean Model – CSM-GeneGRO

GSPs as a function of 7 genes. Other GSPs (not shown) also affected
• PPSEN = 0.004 + 0.0154 Ppd + 0.036 Hr – 0.0104 Ppd Hr
• EM-FL = 26.77 + 4.886 Fin – 5.88 Fd
• FL-SH = 4.63 + 0.972 Ssz1 – 0.98 Ssz2 – 1.8 Ssz3
• FL-SD = 10.61 + 2.028 Ssz2 – 2.1 Ssz3
• SD-PM = 21.027 - 0.11 Ssz1 + 4.13 Hr
• FL-VS = 7.00 + 4.76 Fin – 2.75 Ssz2 – 1.02 Fin Ssz2
• FL-LF = 18.0 + 3.8 Fd – 6.9 Ssz2
• SLAVR = 322 + 41 Ssz1 – 38 Ssz2 – 25.3 Ssz3
• WTPSD = 0.22 + 0.21 Ssz1 + 0.07 Ssz2
• SDPDVR = 5.14 - 0.2 Fin - 1.9 Ssz1 + 0.24 Ssz3
Example of Gene-based Bean Model – CSM-Gene-GRO

A) Node number on main stem as affected by genes in four gene-based dry bean cultivars grown at Palmira, Colombia (from Boote et al., 2015).
B) Node number on main stem as affected by genes in two gene-based dry bean cultivars compared to data for Jatu Rong (Calima-like) and Porrillo Sintetico at Palmira (from Boote et al., 2015).

A) Leaf area index as affected by genes in four gene-based dry bean cultivars grown at Palmira, Colombia (from Boote et al., 2015).
B) Leaf area index as affected by genes in two gene-based dry bean cultivars compared to data for Jatu Rong(Calima-like) and Porrillo Sintetico at Palmira (from Boote et al., 2015).

A) Seed mass over time as affected by genes in four gene-based dry bean cultivars grown at Palmira, Colombia (from Boote et al., 2015).
B) Seed growth pattern as affected by genes in two gene-based dry bean cultivars compared to data for Jatu Rong(Calima-like) and Porrillo Sintetico at Palmira (from Boote et al., 2015).

NSF-Bean Genomics Project at UF
Location Country Latitude MASL (m)Temperature
(°C)a
Palmira Colombia 03° 29’ N 1000 29/19
Popayan Colombia 02° 25’ N 1800 22/16
Isabela Puerto Rico 18° 28’ N 128 29/19
Gainesville, FL
USA 29° 39’ N 60 30/16
Fargo, ND USA 46o 52’ N 280 21/8
188 Recombinants in F11-14 from cross of Jamapa x Calima
Determine QTLs, & Measure Phenotype at 5 Sites
42
Vallejos, Jones, Boote, Correll, Gezan, Wu
Link QTLs to GSPs of crop model, predict phenotype

NSF Project: GSP Estimation & Linkage to QTLs
RILs
GSPs
Bean Crop
Model
Multi-Location
Experiments
Phenotypic
DataQTLs(~traits)
QTLs(~GSPs)
Environment,
Management Data
Sim Phenotypic
Responses
Iter
ativ
e Es
tim
atio
n
Link QTLs to GSPs
University of Florida, Gainesville, Florida USA
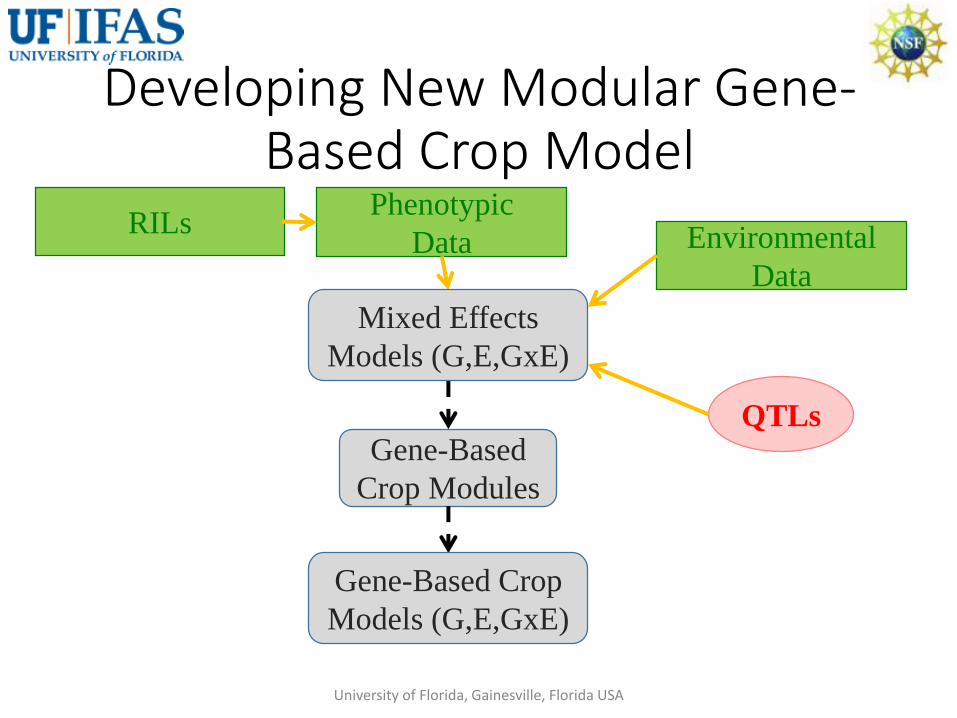
Developing New Modular Gene-Based Crop Model
Gene-Based
Crop Modules
Phenotypic
Data
QTLs
Environmental
Data
Mixed Effects
Models (G,E,GxE)
RILs
Gene-Based Crop
Models (G,E,GxE)
University of Florida, Gainesville, Florida USA

NSF Project: Direct Linkage to QTLs
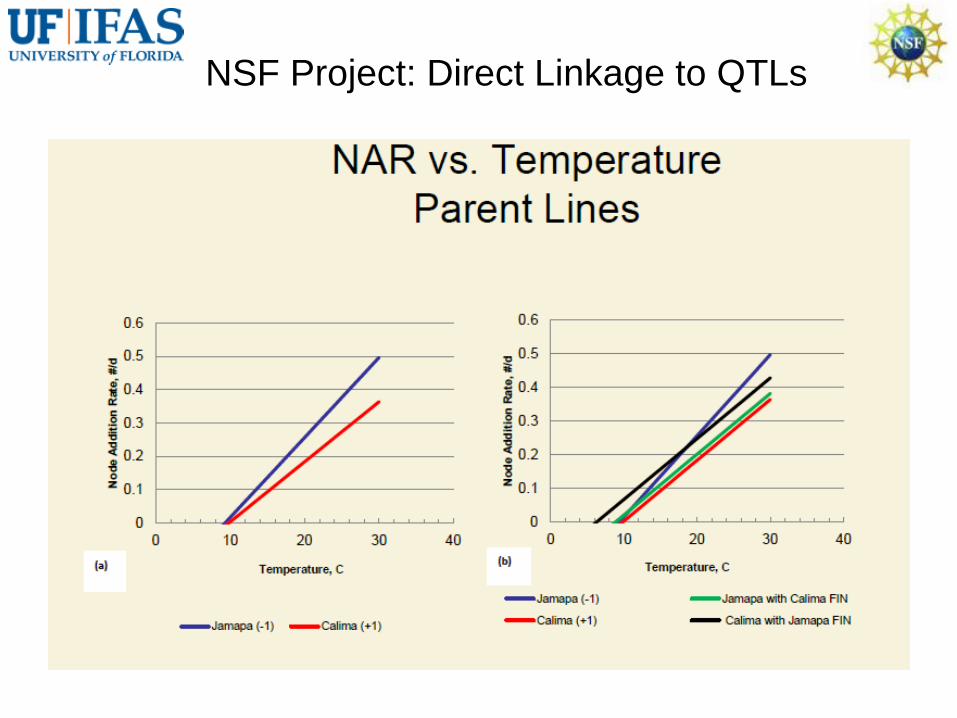
NSF Project: Direct Linkage to QTLs

Designing Cultivars for Target Environments
Consider the limiting factors, e.g., Rainfall? Season length? Elevated temperature? Cool temperature?
Run multiple years of simulations with Seasonal Analysis to evaluate probability of weather risk.
Target GSPs, within feasible genetic range, to improve production for that target environment.
Examples:
Water-limited: deeper rooting? Increased SLW?
Terminal drought: early onset of pod/seed, shorter cycle
Elevated temperature: sow early & early flowering to escape. Heat tolerance?
Irrigated region: long cycle, high photosynthesis

Future Progress: Linking Genes/QTLs to GSPs in Crop Models
Need morel phenotyping data on additional RILs in multiple diverse environments (discover the QTLs, and better define sensitivity to environment).
Re-explore crop model code: where should new and different GSPs be created or moved from species parameters to GSPs.
Re-imagine linking of GSPs to QTL/genes, whether Messina et al. (2006), or with mixed statistical model results adapted to the whole crop model.
G x E interactions should be emergent outcomes, with a minimum of artificial contrivance.
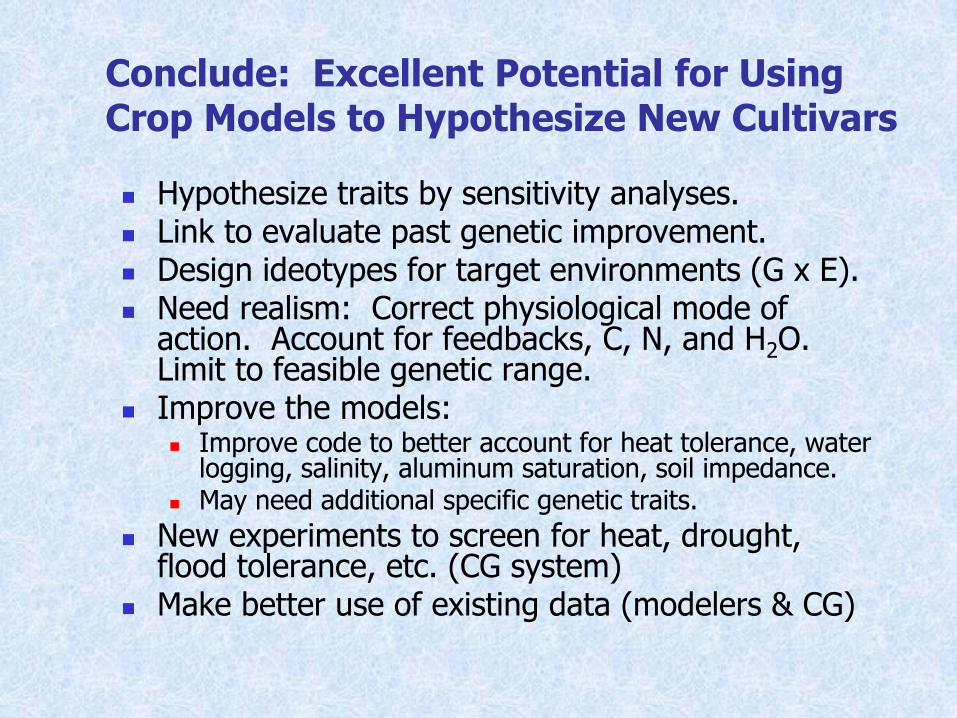
Conclude: Excellent Potential for Using Crop Models to Hypothesize New Cultivars
Hypothesize traits by sensitivity analyses. Link to evaluate past genetic improvement. Design ideotypes for target environments (G x E). Need realism: Correct physiological mode of
action. Account for feedbacks, C, N, and H2O. Limit to feasible genetic range.
Improve the models: Improve code to better account for heat tolerance, water
logging, salinity, aluminum saturation, soil impedance. May need additional specific genetic traits.
New experiments to screen for heat, drought, flood tolerance, etc. (CG system)
Make better use of existing data (modelers & CG)