Embed Size (px)
Citation preview
COMPARISON OF STATISTICAL AND MATHEMATICAL METHODS IN SUPPORT OF EQUIVALENCE TESTING
Rana Tayyarah TSRC 2015 # 62
Contact: [email protected]
2
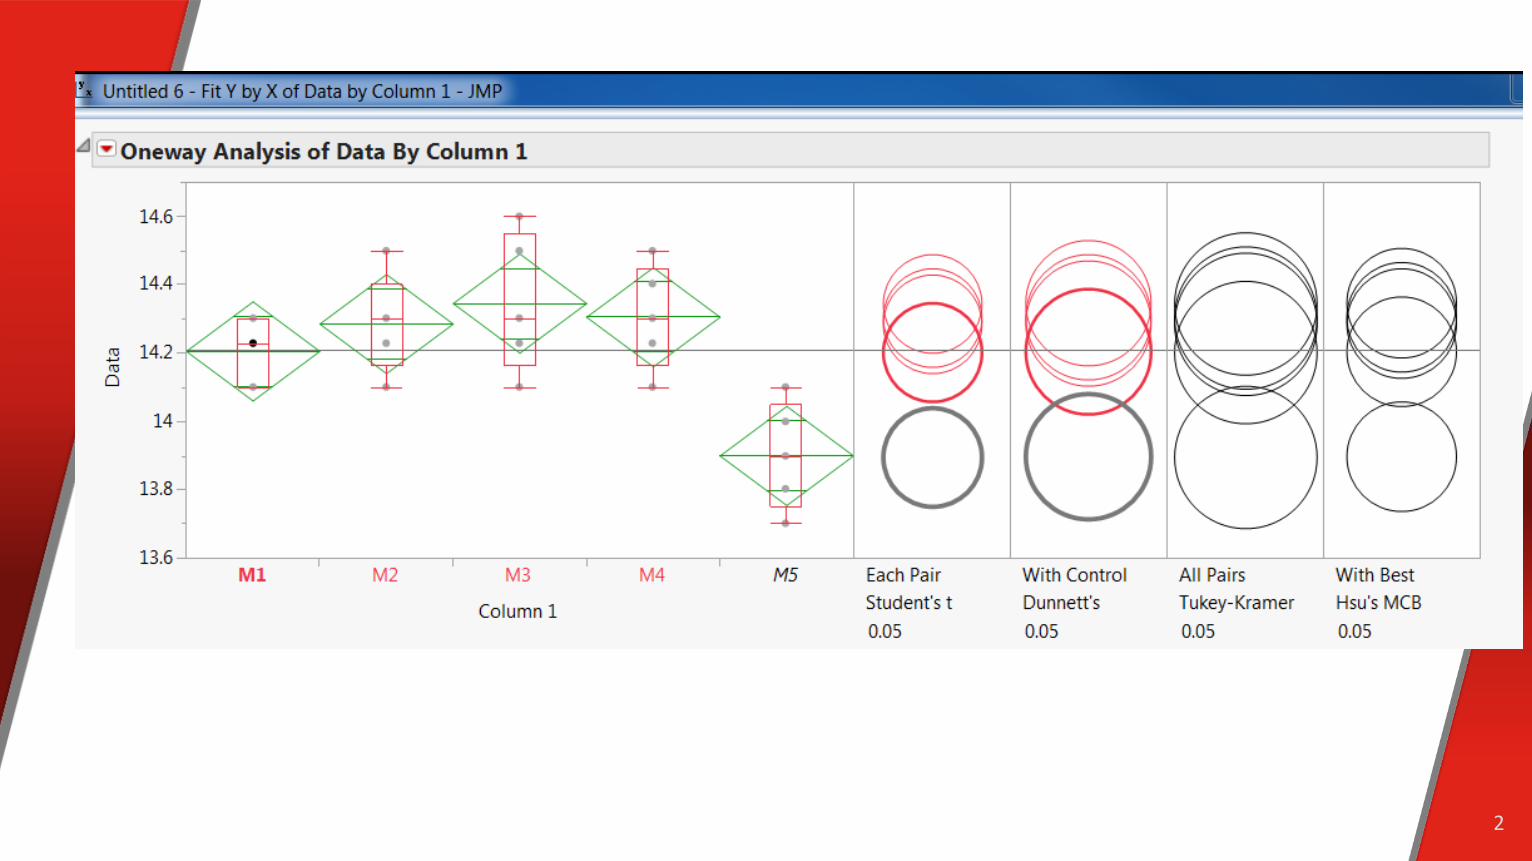
Where the t-test Fails
• Precision is very good • Precision is poor • n is small
• Hypothesis is that the means are similar
3
Hypothesis Testing
• X is Different – Control versus purposeful change – Suspect value – Student’s t-test, ANOVA
• X is Equivalent/Not Different – Process scale-up – Methods transfer – Equivalent materials substitution – Batch to batch comparisons
4
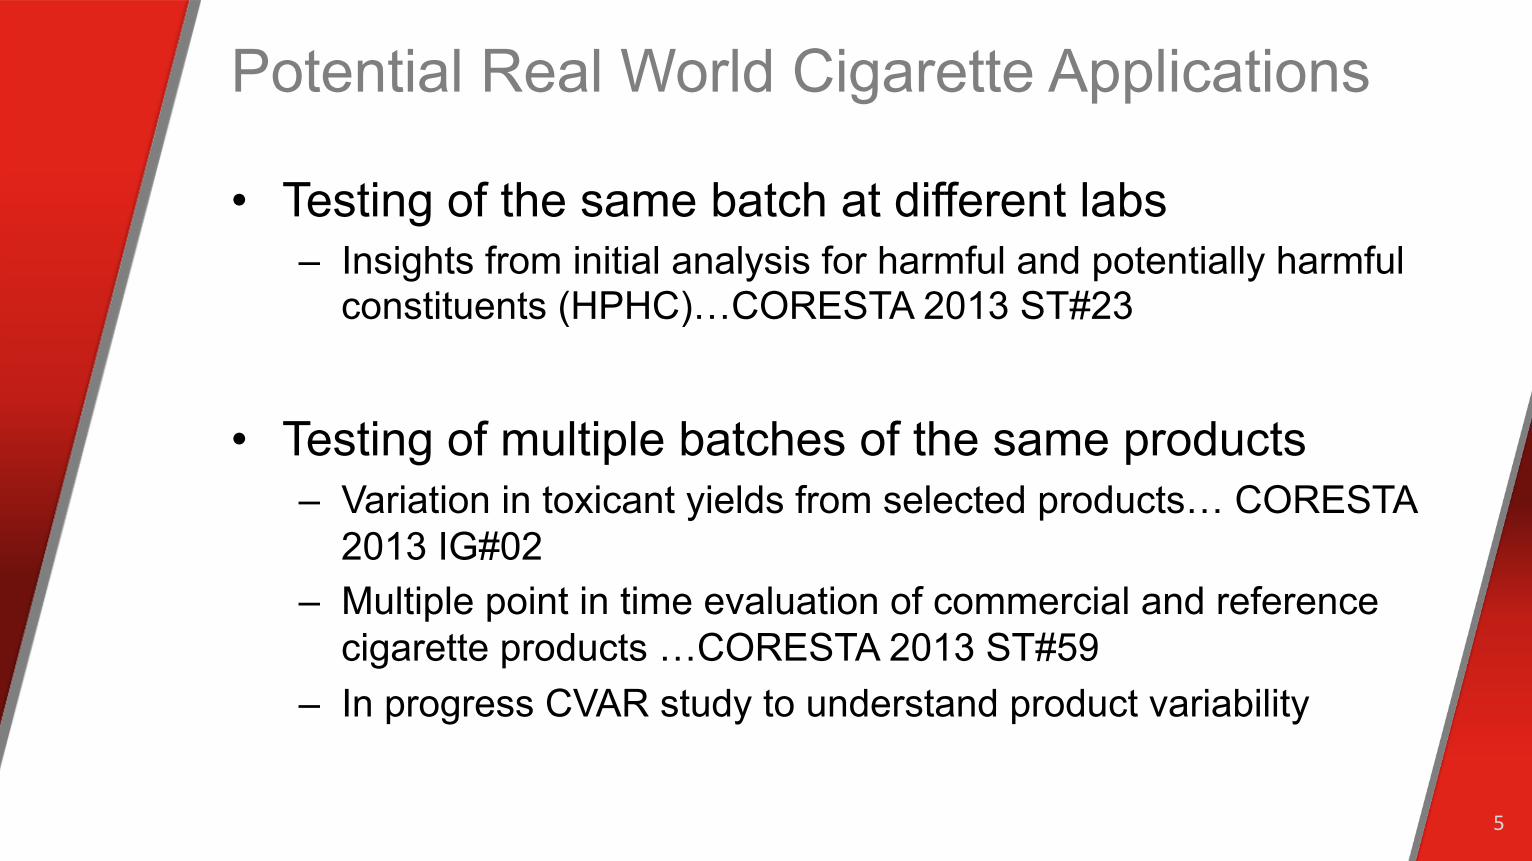
Potential Real World Cigarette Applications
• Testing of the same batch at different labs – Insights from initial analysis for harmful and potentially harmful
constituents (HPHC)…CORESTA 2013 ST#23
• Testing of multiple batches of the same products – Variation in toxicant yields from selected products… CORESTA
2013 IG#02 – Multiple point in time evaluation of commercial and reference
cigarette products …CORESTA 2013 ST#59 – In progress CVAR study to understand product variability
5
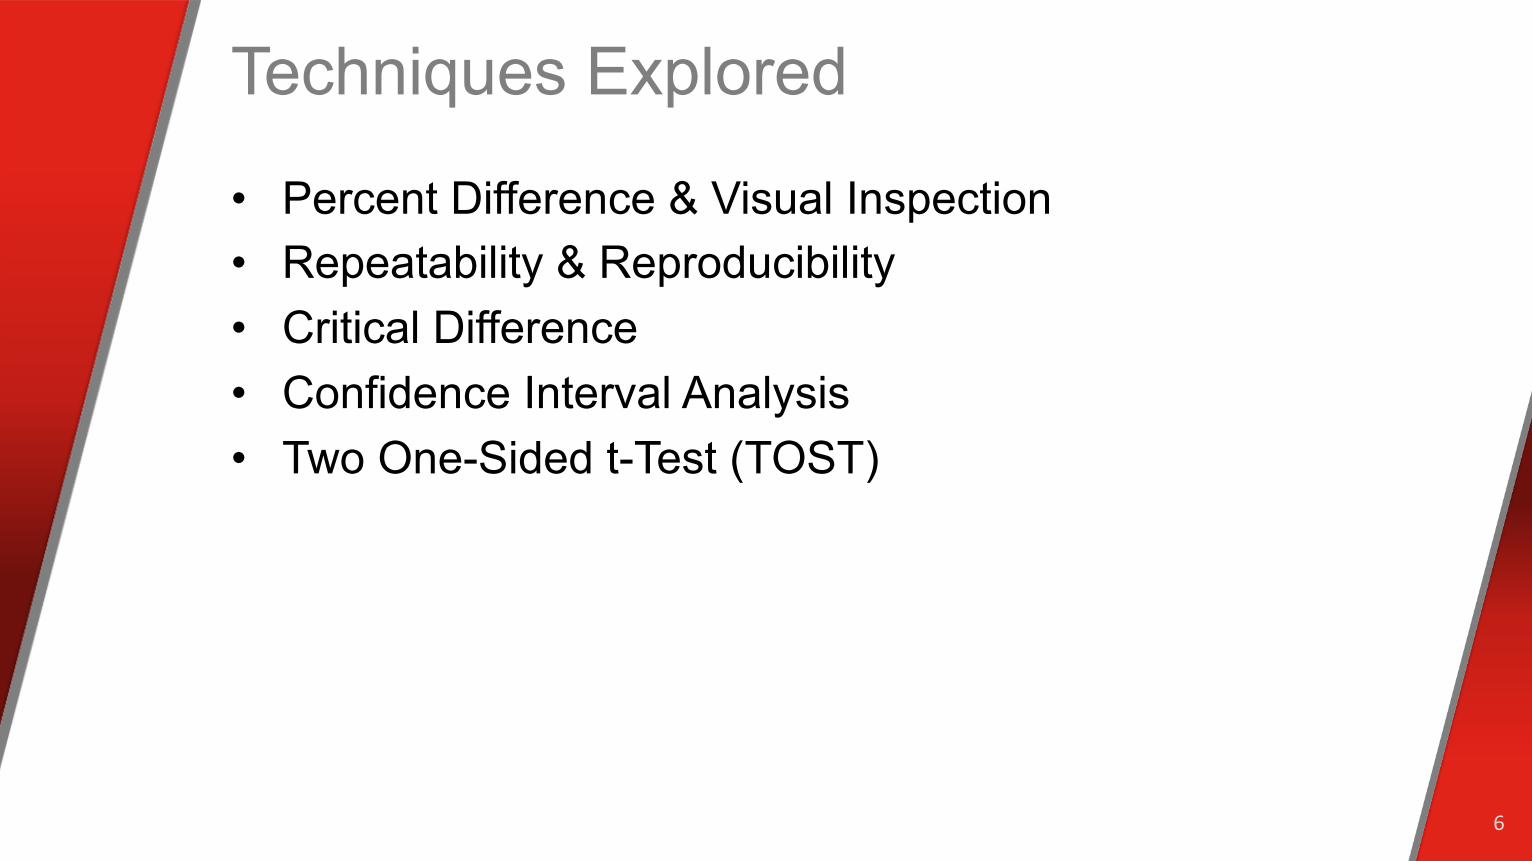
Techniques Explored
• Percent Difference & Visual Inspection • Repeatability & Reproducibility • Critical Difference • Confidence Interval Analysis • Two One-Sided t-Test (TOST)
6
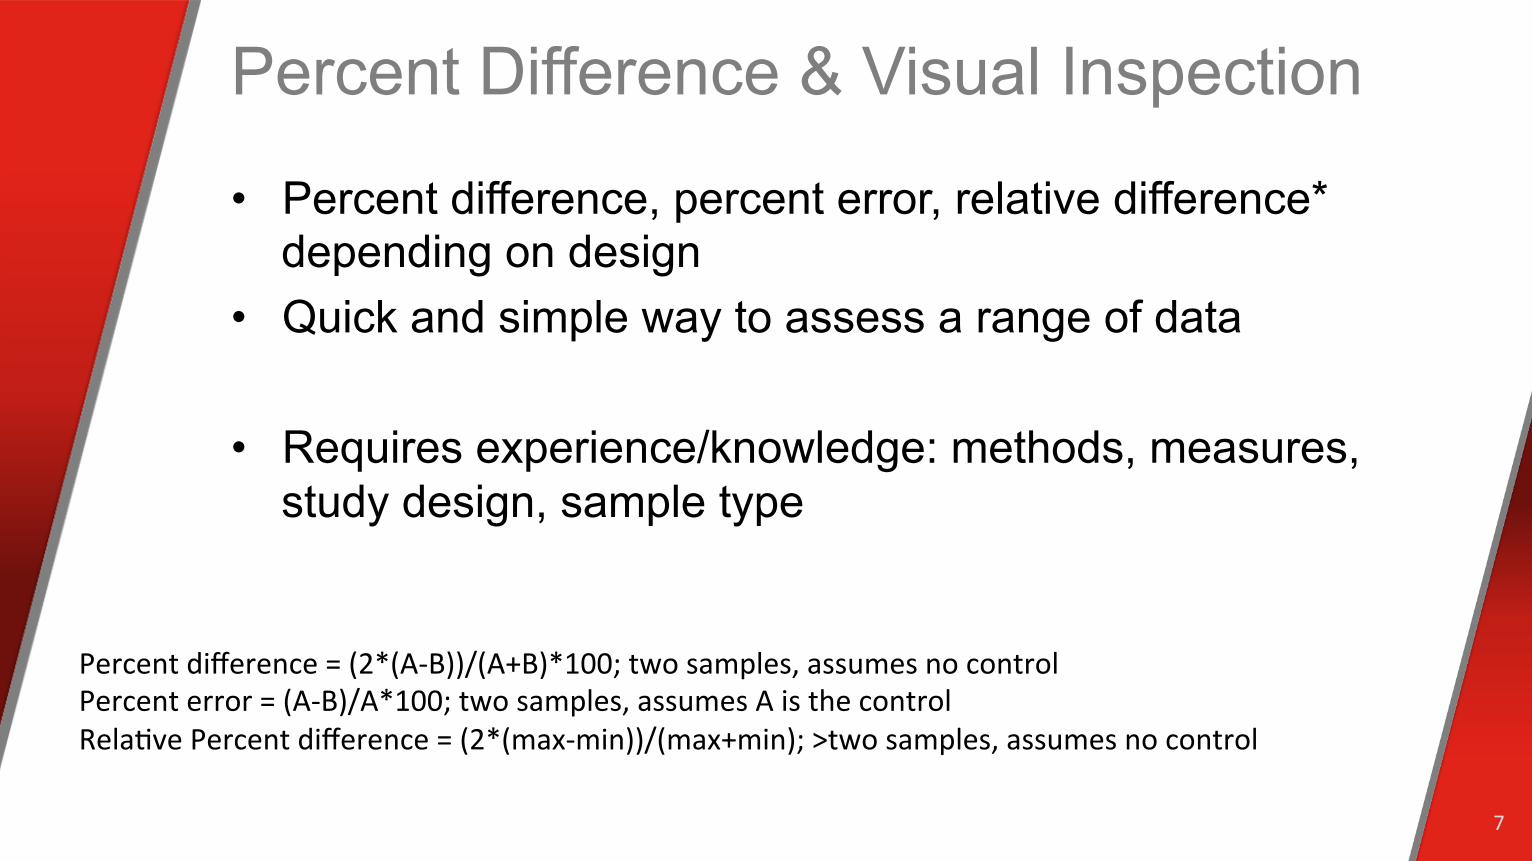
Percent Difference & Visual Inspection
• Percent difference, percent error, relative difference* depending on design
• Quick and simple way to assess a range of data
• Requires experience/knowledge: methods, measures, study design, sample type
7
Percent difference = (2*(A-‐B))/(A+B)*100; two samples, assumes no control Percent error = (A-‐B)/A*100; two samples, assumes A is the control RelaOve Percent difference = (2*(max-‐min))/(max+min); >two samples, assumes no control
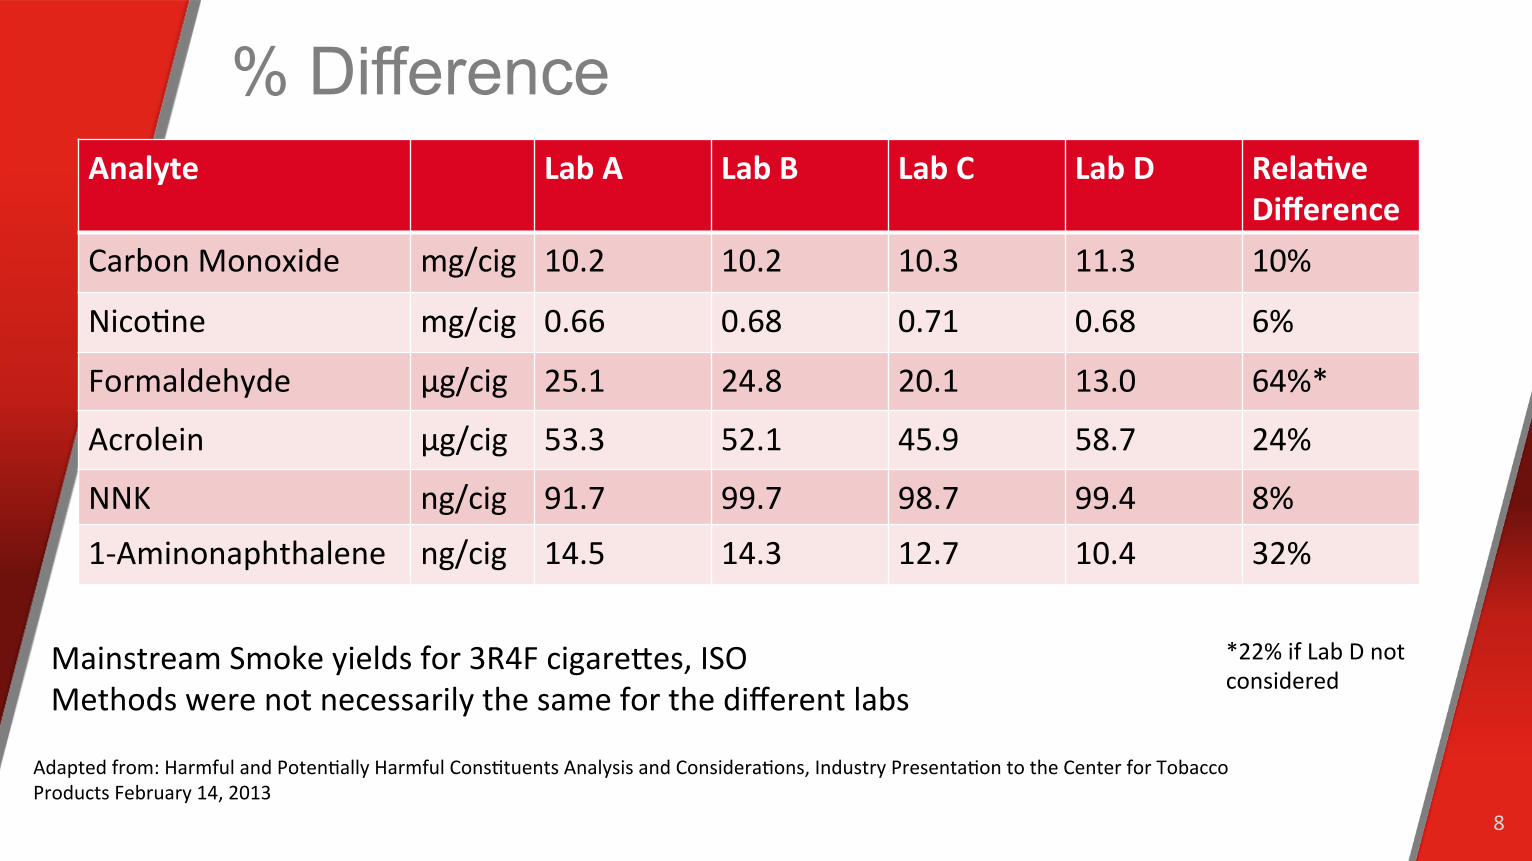
% Difference
8
Analyte Lab A Lab B Lab C Lab D Rela/ve Difference
Carbon Monoxide mg/cig 10.2 10.2 10.3 11.3 10%
NicoOne mg/cig 0.66 0.68 0.71 0.68 6%
Formaldehyde µg/cig 25.1 24.8 20.1 13.0 64%*
Acrolein µg/cig 53.3 52.1 45.9 58.7 24%
NNK ng/cig 91.7 99.7 98.7 99.4 8%
1-‐Aminonaphthalene ng/cig 14.5 14.3 12.7 10.4 32%
*22% if Lab D not considered
Adapted from: Harmful and PotenOally Harmful ConsOtuents Analysis and ConsideraOons, Industry PresentaOon to the Center for Tobacco Products February 14, 2013
Mainstream Smoke yields for 3R4F cigareces, ISO Methods were not necessarily the same for the different labs
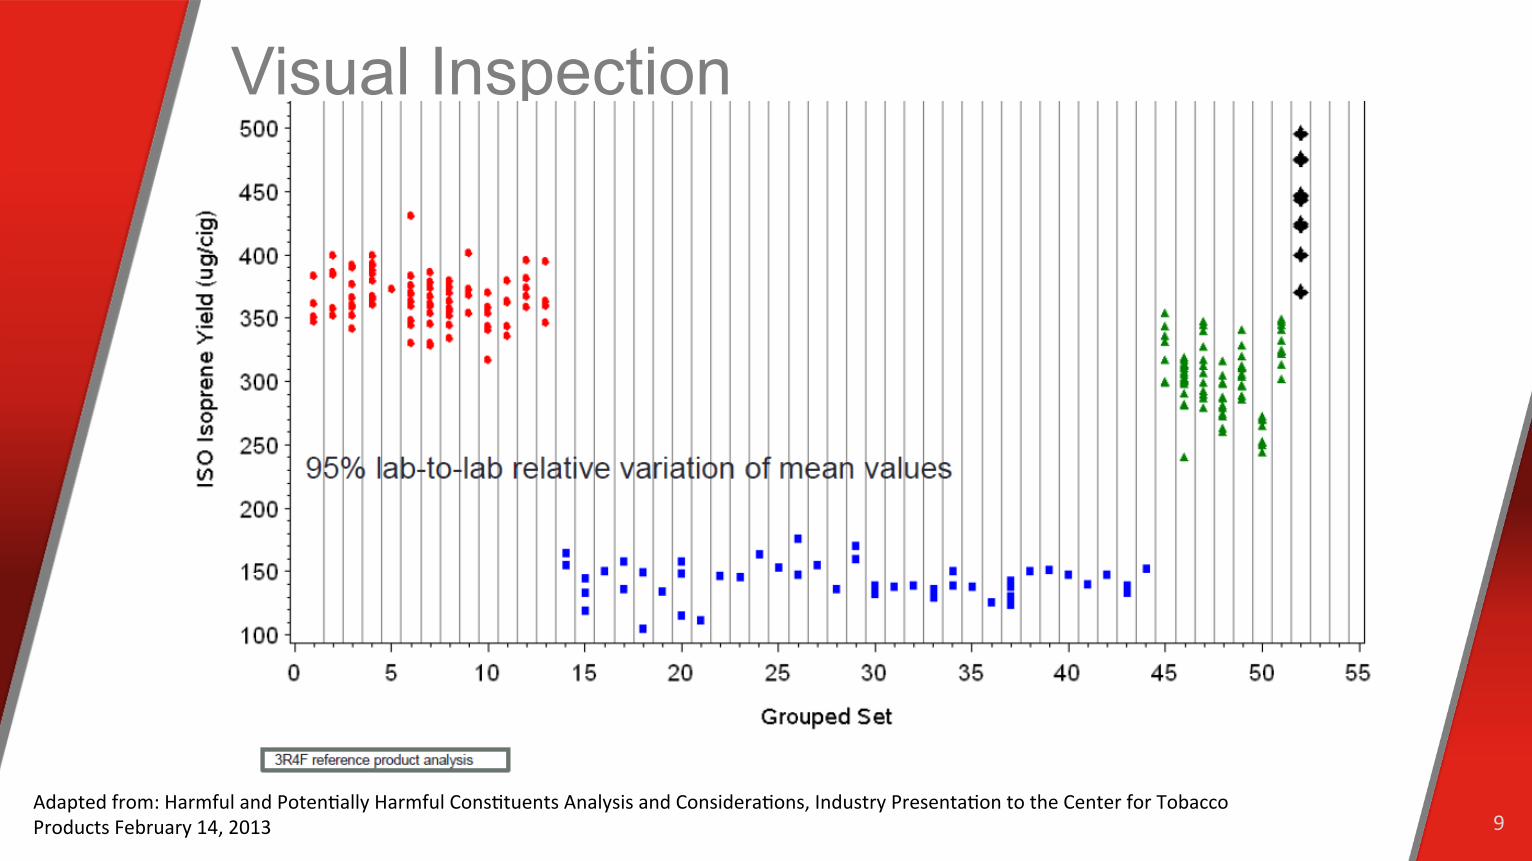
Visual Inspection
9 Adapted from: Harmful and PotenOally Harmful ConsOtuents Analysis and ConsideraOons, Industry PresentaOon to the Center for Tobacco Products February 14, 2013
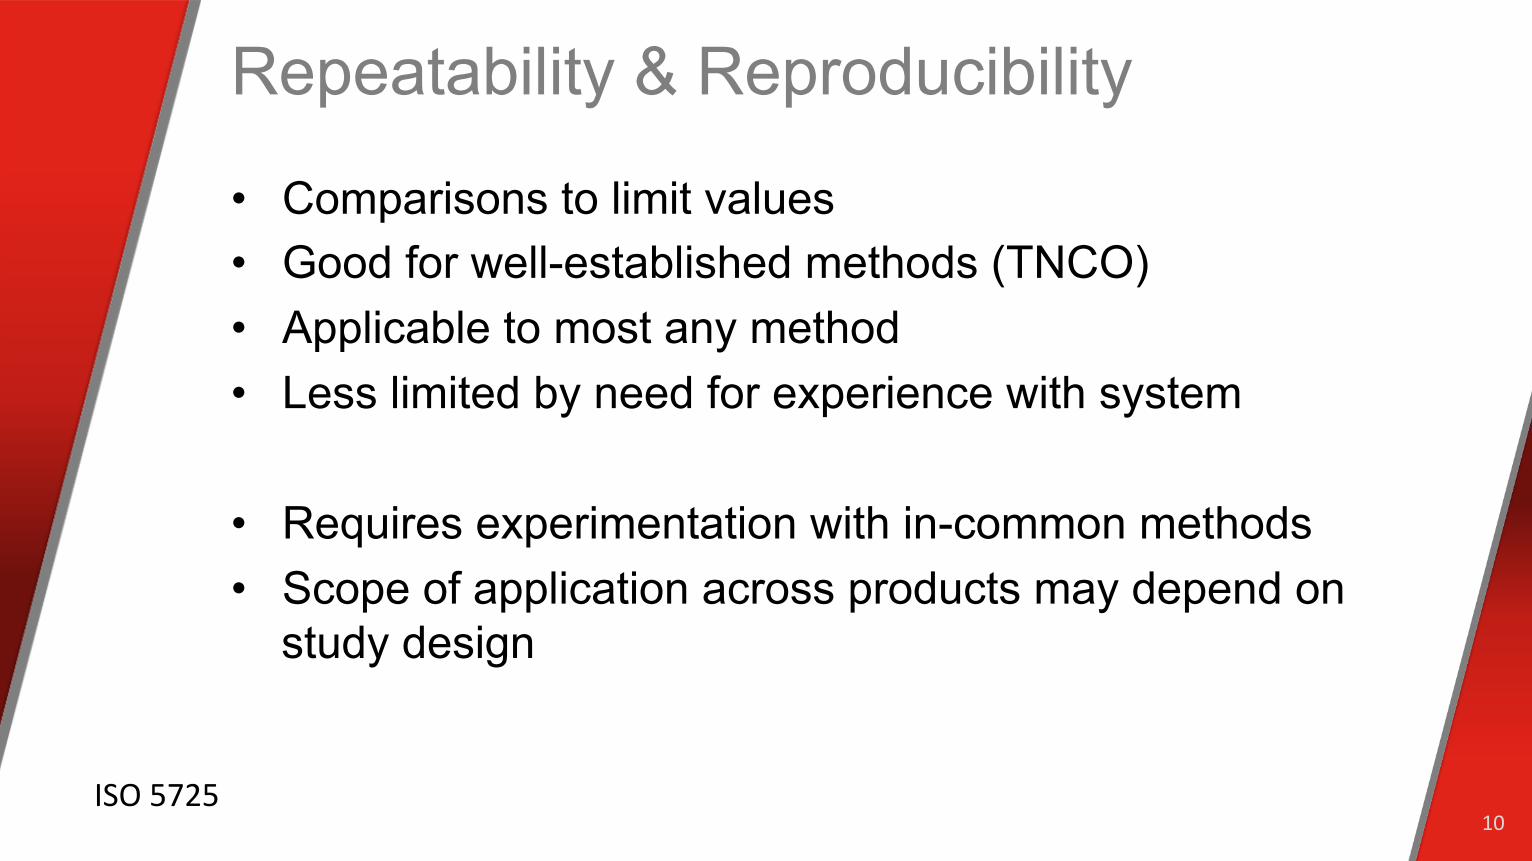
Repeatability & Reproducibility
• Comparisons to limit values • Good for well-established methods (TNCO) • Applicable to most any method • Less limited by need for experience with system
• Requires experimentation with in-common methods • Scope of application across products may depend on
study design
10 ISO 5725
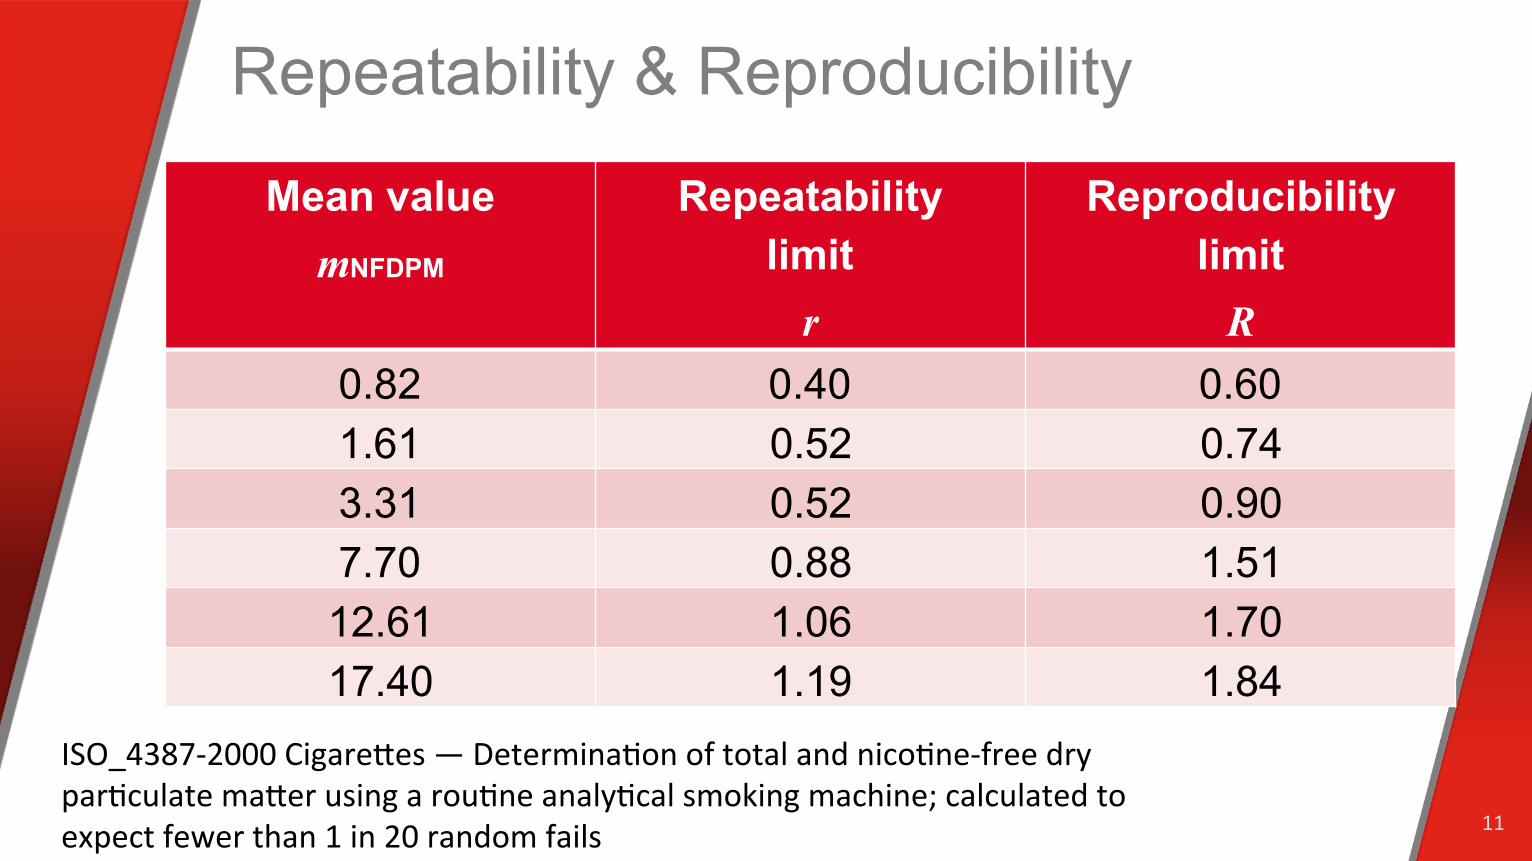
Repeatability & Reproducibility
11
Mean value
mNFDPM Repeatability
limit
r
Reproducibility limit
R
0.82 0.40 0.60 1.61 0.52 0.74 3.31 0.52 0.90 7.70 0.88 1.51 12.61 1.06 1.70 17.40 1.19 1.84
ISO_4387-‐2000 Cigareces — DeterminaOon of total and nicoOne-‐free dry parOculate macer using a rouOne analyOcal smoking machine; calculated to expect fewer than 1 in 20 random fails
Critical Difference
• Maximum difference expected between two final values with a specified probability
• Calculated from r&R values and intermediate precision • Compare actual difference to CD
12 ISO_5725 part 6
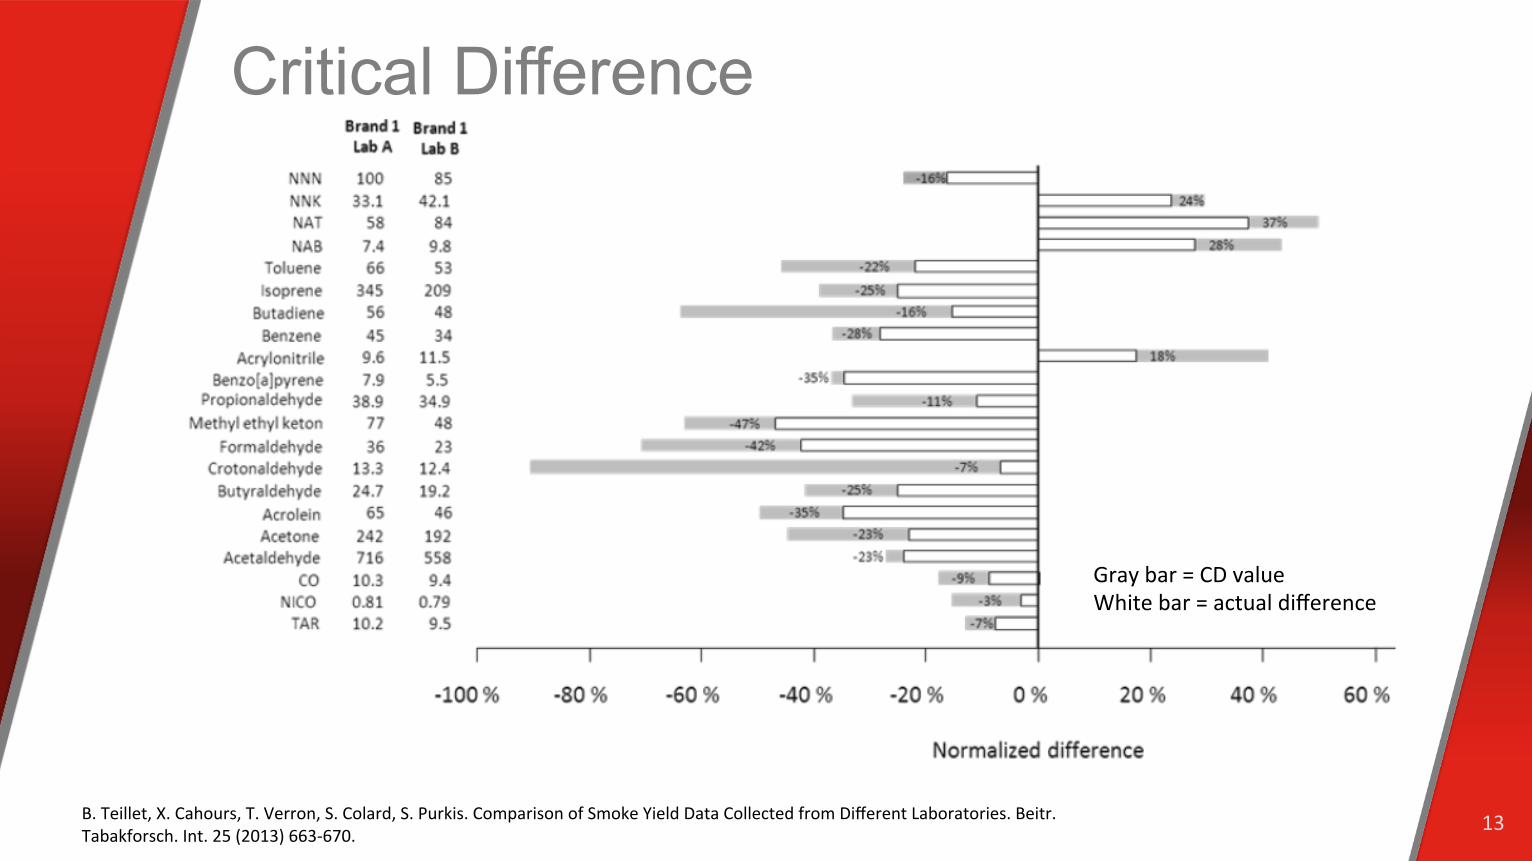
Critical Difference
13 B. Teillet, X. Cahours, T. Verron, S. Colard, S. Purkis. Comparison of Smoke Yield Data Collected from Different Laboratories. Beitr. Tabakforsch. Int. 25 (2013) 663-‐670.
Gray bar = CD value White bar = actual difference
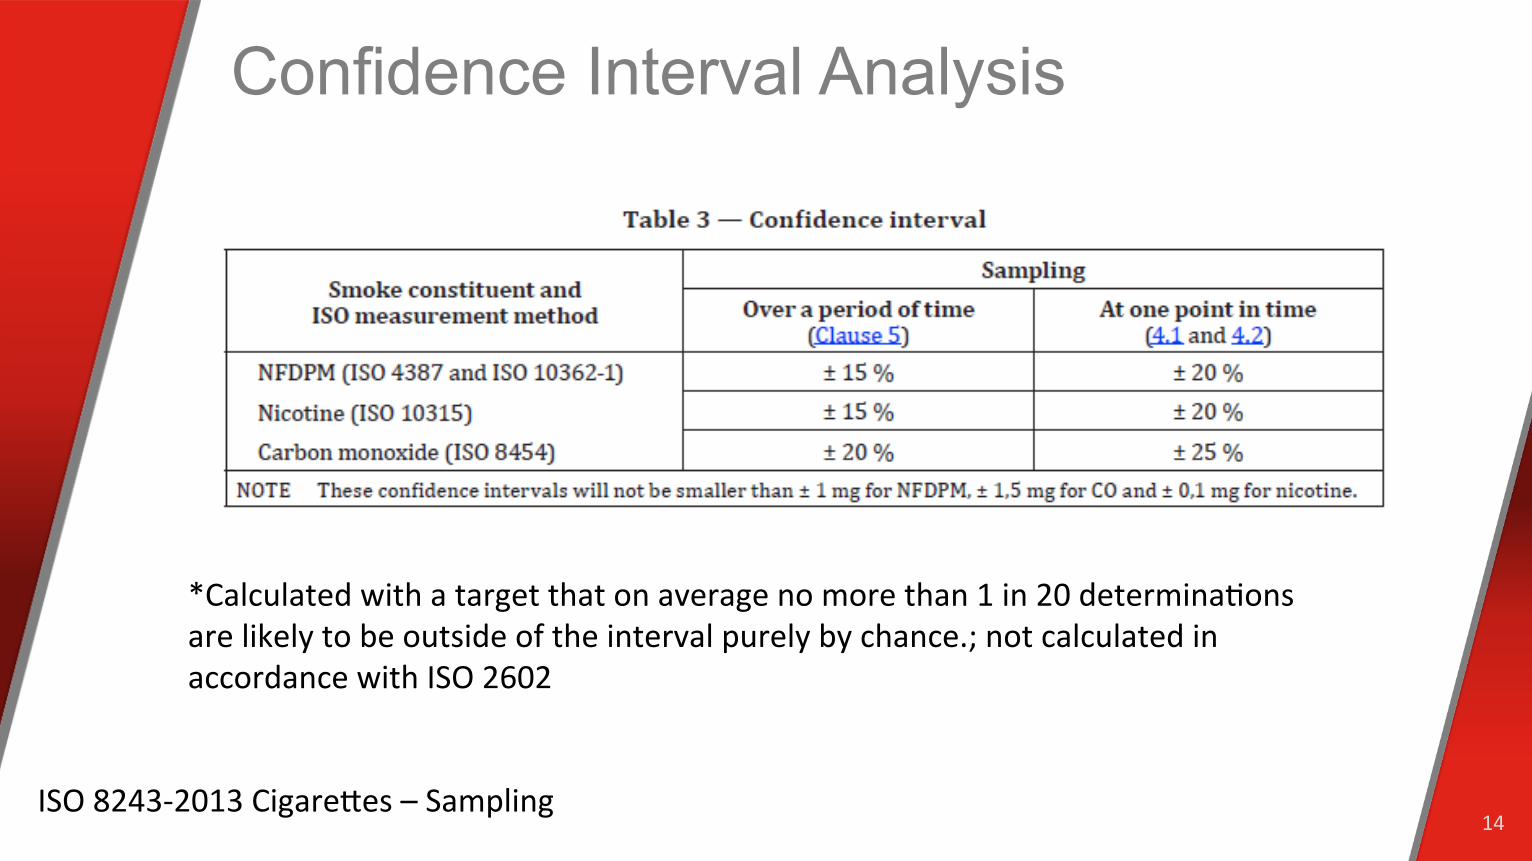
Confidence Interval Analysis
14
*Calculated with a target that on average no more than 1 in 20 determinaOons are likely to be outside of the interval purely by chance.; not calculated in accordance with ISO 2602
ISO 8243-‐2013 Cigareces – Sampling
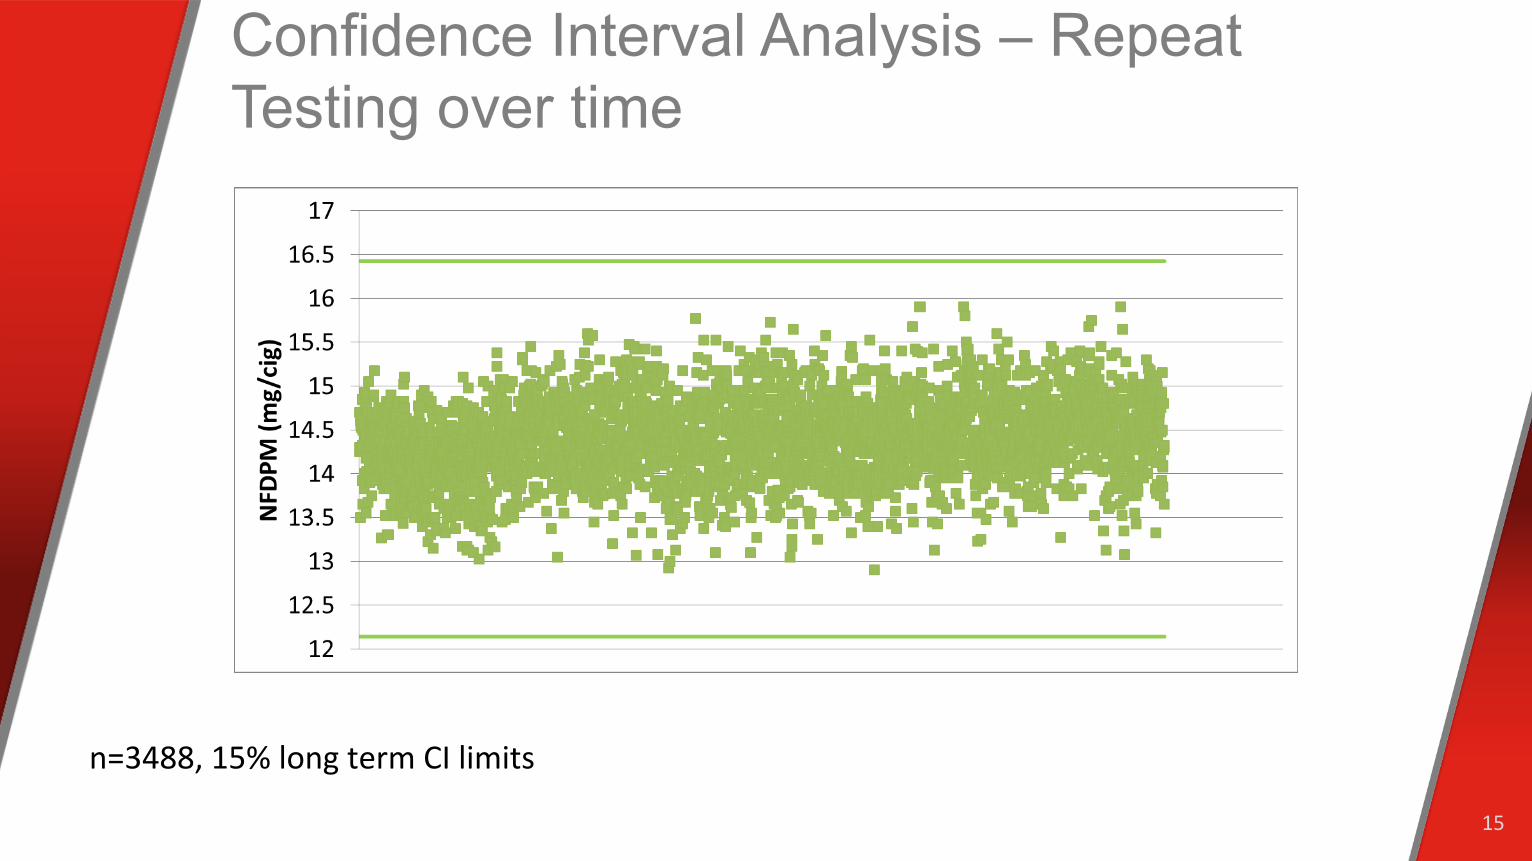
Confidence Interval Analysis – Repeat Testing over time
15
n=3488, 15% long term CI limits
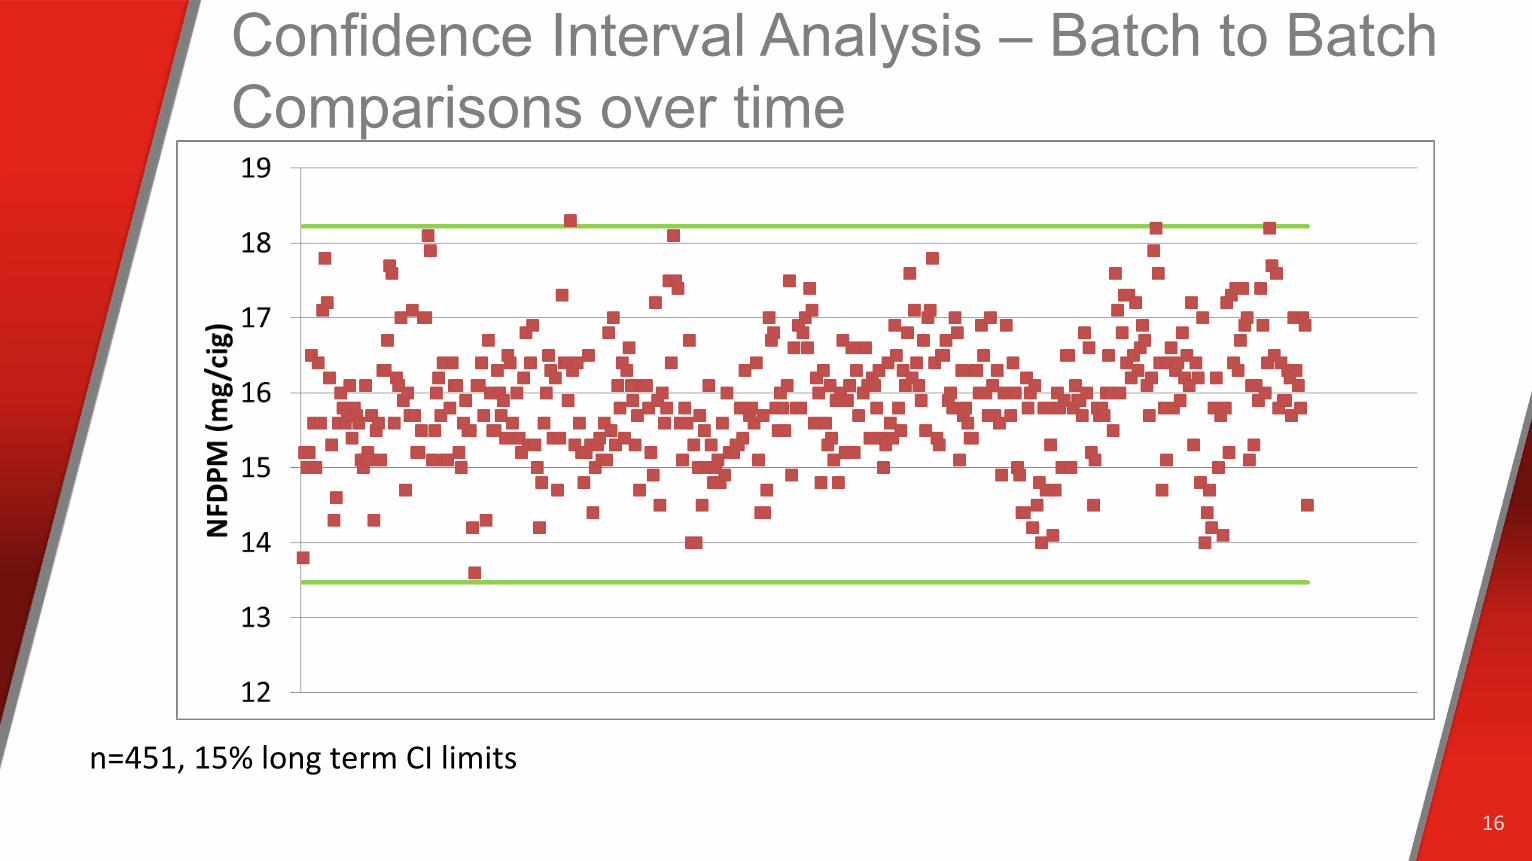
Confidence Interval Analysis – Batch to Batch Comparisons over time
16
n=451, 15% long term CI limits
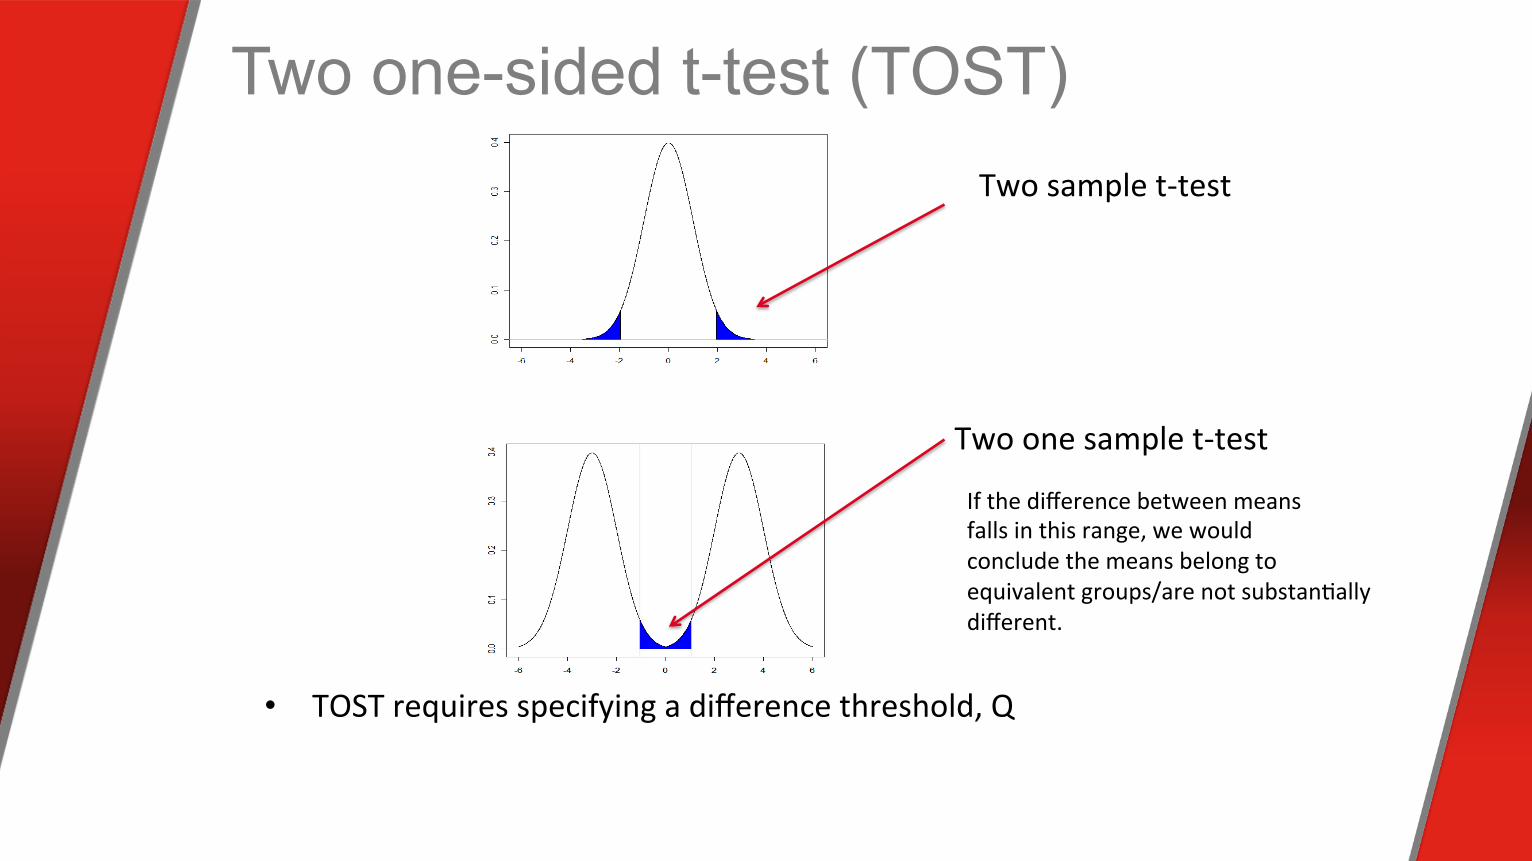
Two one-sided t-test (TOST) Two sample t-‐test
Two one sample t-‐test
If the difference between means falls in this range, we would conclude the means belong to equivalent groups/are not substanOally different.
• TOST requires specifying a difference threshold, Q
18
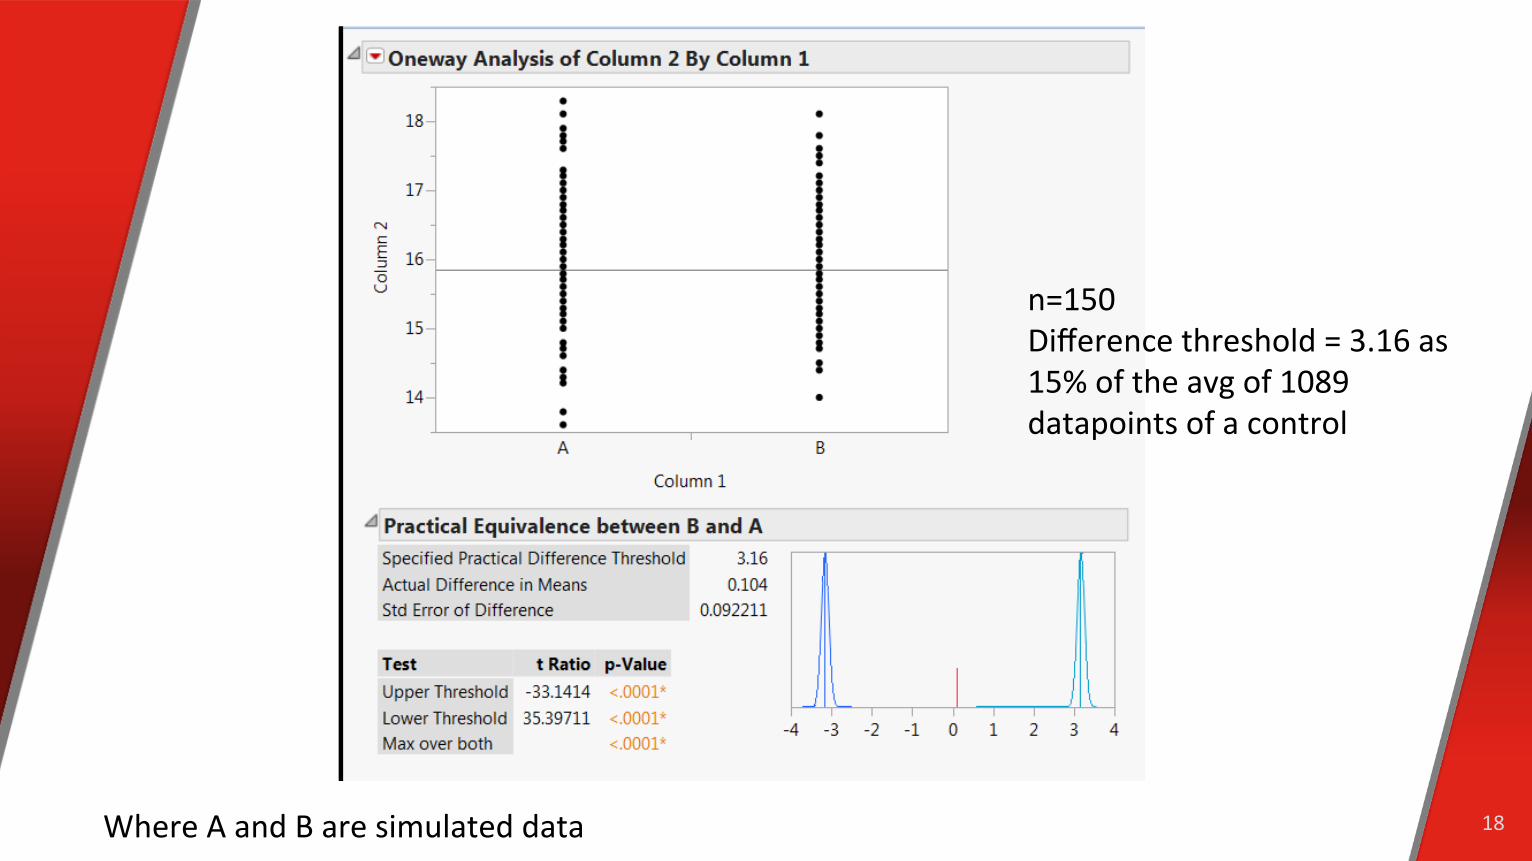
n=150 Difference threshold = 3.16 as 15% of the avg of 1089 datapoints of a control
Where A and B are simulated data
19
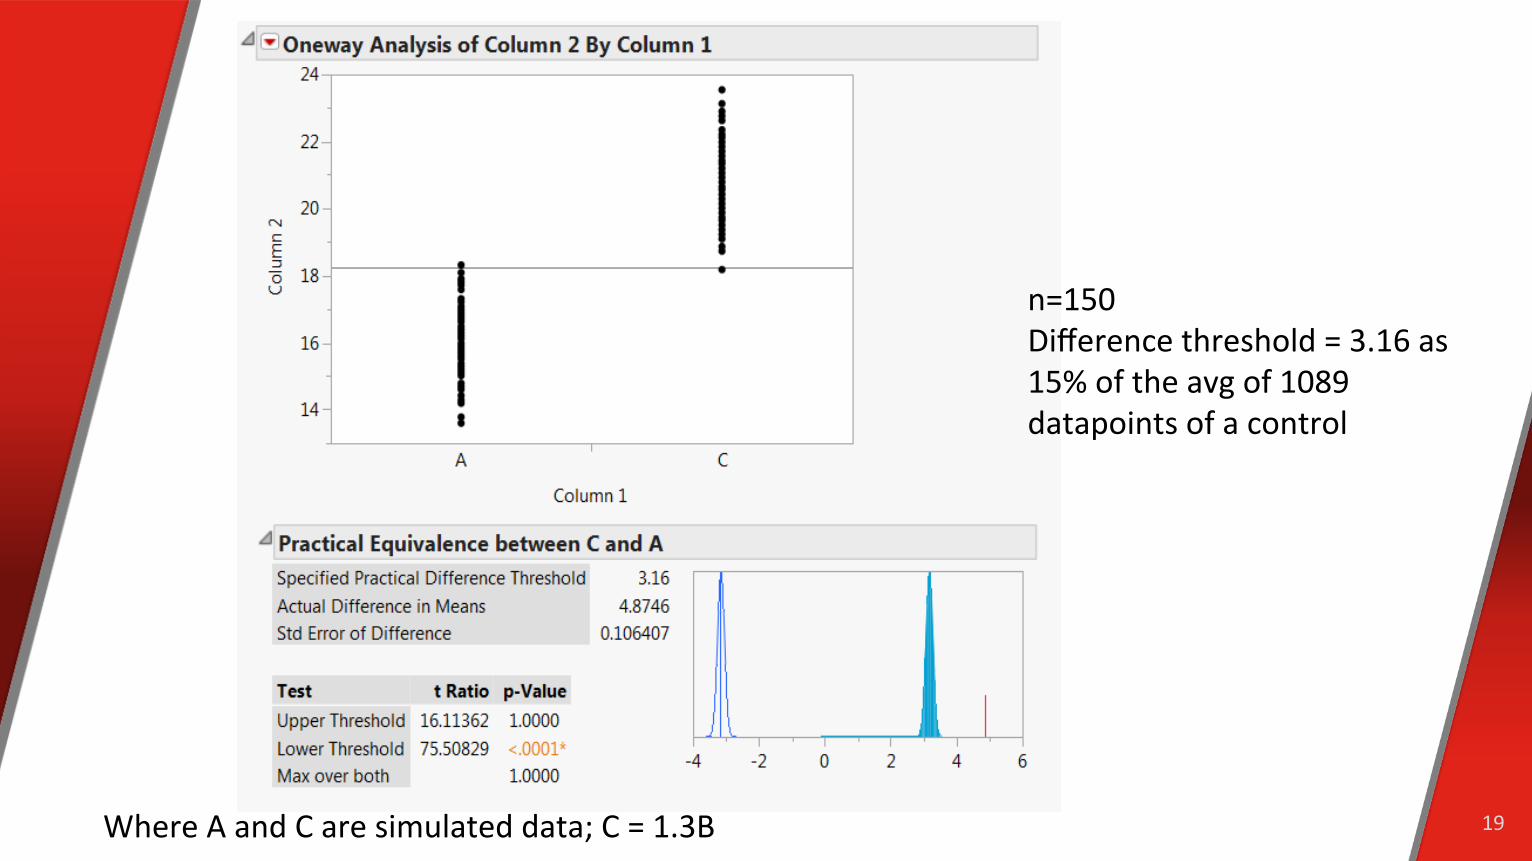
n=150 Difference threshold = 3.16 as 15% of the avg of 1089 datapoints of a control
Where A and C are simulated data; C = 1.3B
Conclusions • There are several options available for evaluating data
expected to be similar/equivalent • r&R, Critical Difference, Confidence Intervals
– Require in-common methods – Establishment through experimentation – Straightforward calculations against limits
• % Difference, TOST – Require experience – Require systemic knowledge
20
References • ISO_5725 Set • ISO_4387-2000 Cigarettes — Determination of total and nicotine-free dry particulate matter using a routine
analytical smoking machine • ISO 8243-2013 Cigarettes – Sampling • Eldridge A.; Betson T.; McAdam K. Variation in toxicant yields from selected products CORESTA Meeting
Smoke Sci.-Prod. Techno Groups, Seville, 2013, abstr. IG 02 • Tayyarah, R. Multiple point in time evaluation of commercial and reference cigarette products for abbreviated
HPHC yield for mainstream smoke and filler CORESTA Meeting Smoke Sci.-Prod. Techno Groups, Seville, 2013, abstr. ST 59
• Wagner K.A.; Desoi D.; Morton M.J.; Oldham M.J. Insights from initial analysis for harmful and potentially harmful constituents (HPHC) in cigarette and smokeless tobacco products CORESTA Meeting Smoke Sci.-Prod. Techno Groups, Seville, 2013, abstr. ST 23
• Harmful and Potentially Harmful Constituents Analysis and Considerations, Industry Presentation to the Center for Tobacco Products February 14, 2013
• Verron, T. et al. Product Comparison: The Risk Associated with Multiple Testing, CORESTA Quebec, 2014 abstr. ST 29
• B. Teillet, X. Cahours, T. Verron, S. Colard, S. Purkis. Comparison of Smoke Yield Data Collected from Different Laboratories. Beitr. Tabakforsch. Int. 25 (2013) 663-670.
• Limentani, G. et al., Beyond the t-Test: Statistical Equivalence Testing Anal. Chem., 2005, 77 (11), pp 221 A–226 A 2005, DOI: 10.1021/ac053390m
21

22