Embed Size (px)
Citation preview
Remote Sensing II (SSC-604)
Presented to: Mr. Shahid PervaizPresented by: Mr. Farhan Mustafa, Rahat Tufail, Fatima Tanveer, Fatima Mushtaq
Department of Space Science, University of the Punjab, Lahore
Contents: Introduction Atmospheric Window & Absorption Band Fundamental Radiation Laws Atmospheric Effects Thermal Data Acquisition Applications Advantages & Disadvantages
Thermal Remote Sensing: Thermal Infrared Radiation refers to electromagnetic waves
with a wavelength of between 3 to 20 micrometers.
Most remote sensing applications make use of 3-5 & 8-14 micrometer range. (Due to absorption bands)
The main difference between the thermal infrared and near infrared is that thermal infrared is emitted energy and near infrared is reflected energy similar to light.
Optical Remote Sensing: Examine abilities of objects to reflect the solar radiations.
(Visible & Near IR)
Emissive Remote Sensing: Examine abilities of objects to absorb shortwave visible & near-
IR radiations and then to emit this energy at longer wavelengths. (Mid-IR & Microwave)
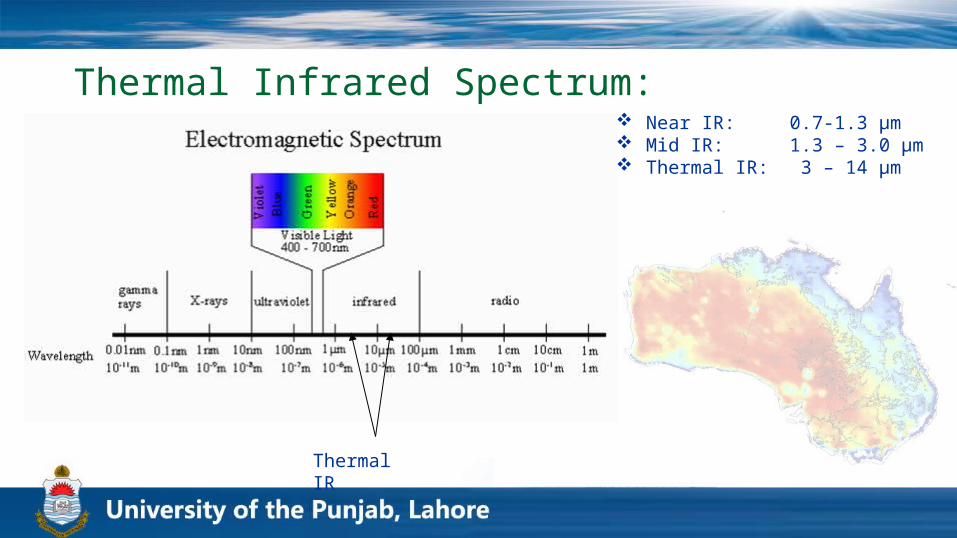
Thermal Infrared Spectrum:
Thermal IR
Near IR: 0.7-1.3 μm Mid IR: 1.3 – 3.0
μm Thermal IR: 3 – 14 μm
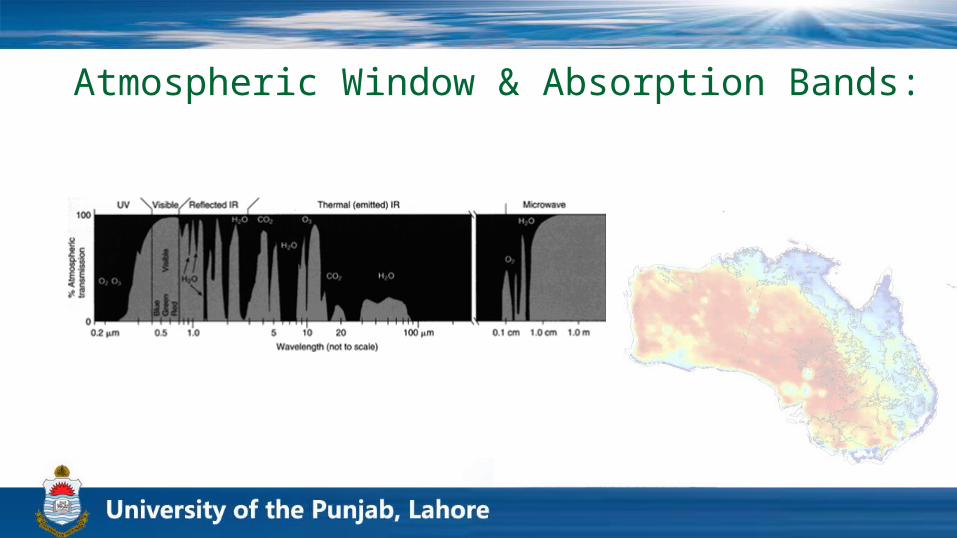
Atmospheric Window & Absorption Bands:
Atmospheric Effects: The atmospheric intervention between the thermal sensor and
the ground can modify the apparent level of radiations coming from ground depending on degree of atmospheric absorption, scattering and emission.
Atmospheric absorption & scattering make the signal appear colder and atmospheric emission make the object to be detected as warmer.
There are some factors on which both of these effects depend upon given by:
Continue
Atmospheric path length Meteorological conditions Site Altitude Local weather condition
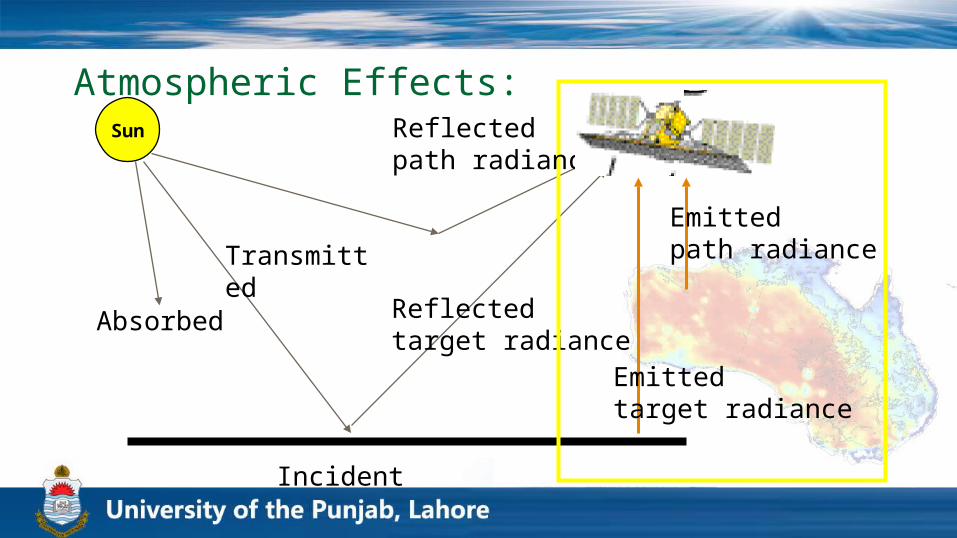
Atmospheric Effects:Sun
Incident
Absorbed
Transmitted
Reflectedtarget radiance
Emittedpath radiance
Emittedtarget radiance
Reflectedpath radiance
Fundamental Radiation Laws:The following laws are obeyed in this phenomenon:
Planck’ Radiation (Blackbody Law) Wein’s Displacement Law Stefan-Boltzman Law
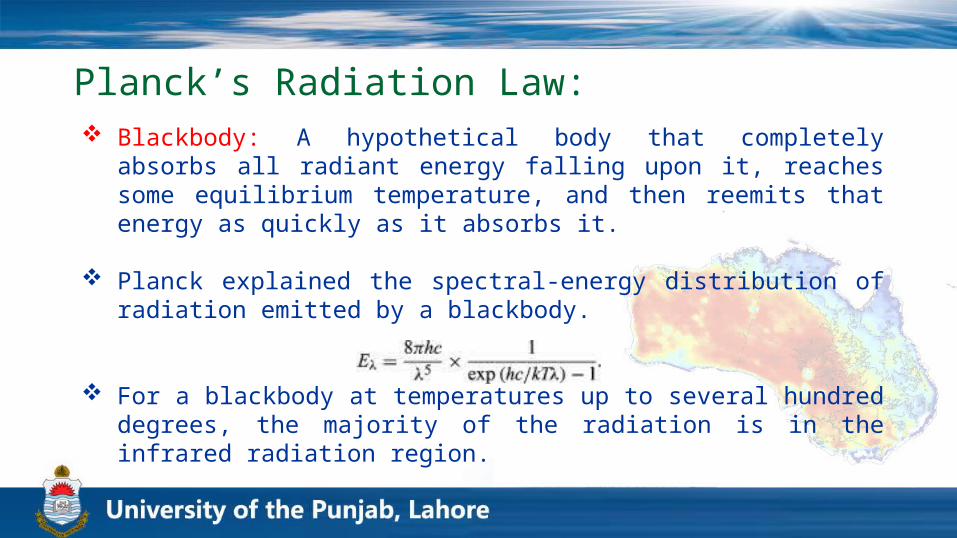
Planck’s Radiation Law: Blackbody: A hypothetical body that completely absorbs all
radiant energy falling upon it, reaches some equilibrium temperature, and then reemits that energy as quickly as it absorbs it.
Planck explained the spectral-energy distribution of radiation emitted by a blackbody.
For a blackbody at temperatures up to several hundred degrees, the majority of the radiation is in the infrared radiation region.
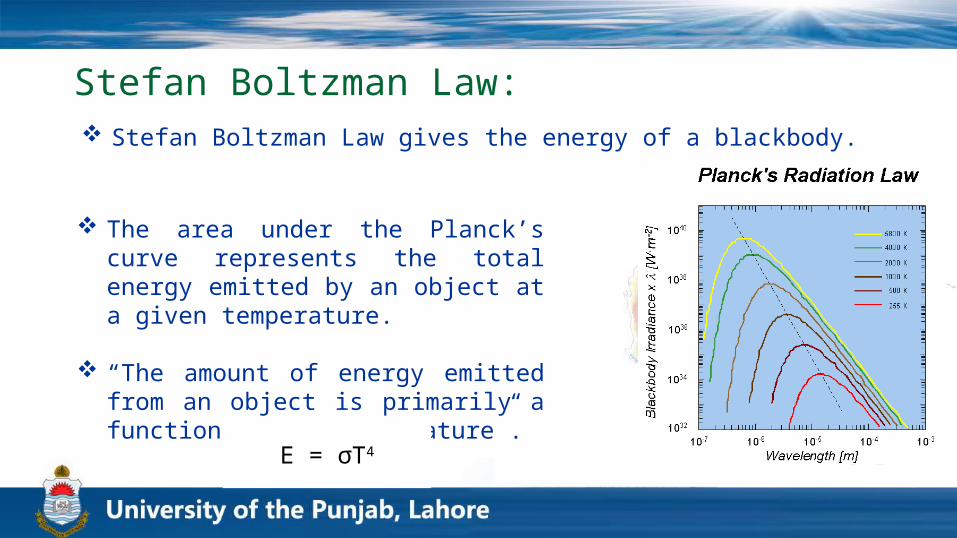
Stefan Boltzman Law: Stefan Boltzman Law gives the energy of a blackbody.
The area under the Planck’s curve represents the total energy emitted by an object at a given temperature.
“The amount of energy emitted from an object is primarily a function of its temperature”.
E = σT4
Wein’s Displacement Law: Wein calculated relationship b/w true temperature of blackcody
(T) in degree kelvins and its peak spectral extiance or dominant wavelength (λmax).
λmax = k/T and k=2898 μm k
How Wein’s Displacement Law is applicable in Thermal Remote Sensing ?
Emissivity: The is no blackbody in nature.
All natural objects are gray-bodies, they emit a fraction of their maximum possible blackbody radiation at given temperature.
Emissivity is the ratio b/w actual radiance emitted by a real world selected radiating body (Mr) and a blackbody at the same thermodynamic temperature (Mb)
ε = Mr/Mb
If the emissivity of an object varies with wavelength, the object is said to be a selective radiant. Continue
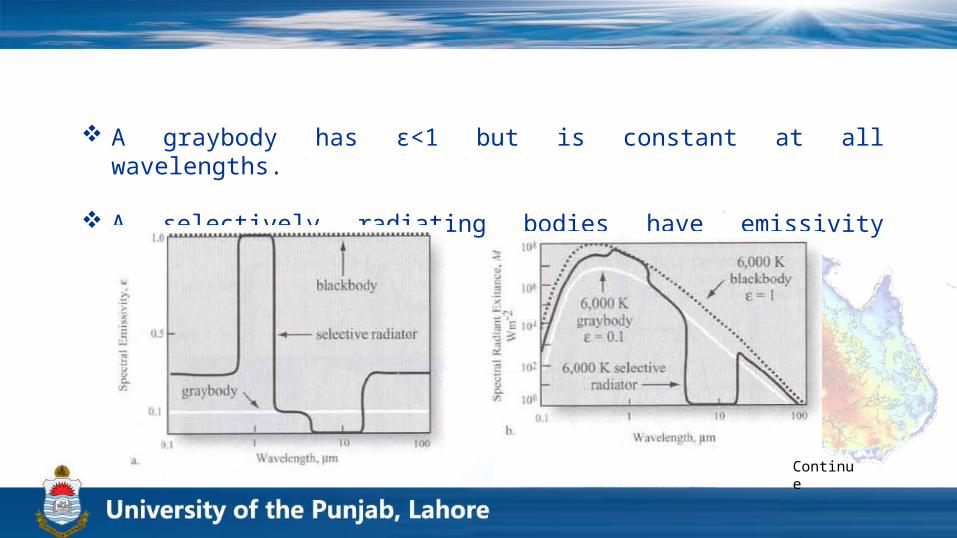
A graybody has ε<1 but is constant at all wavelengths.
A selectively radiating bodies have emissivity ranging 0 ≤ 1.
Continue
Emissivity depends upon the following factors:
• Color• Surface Roughness• Moisture Content• Compaction• Field of View• Viewing Angle
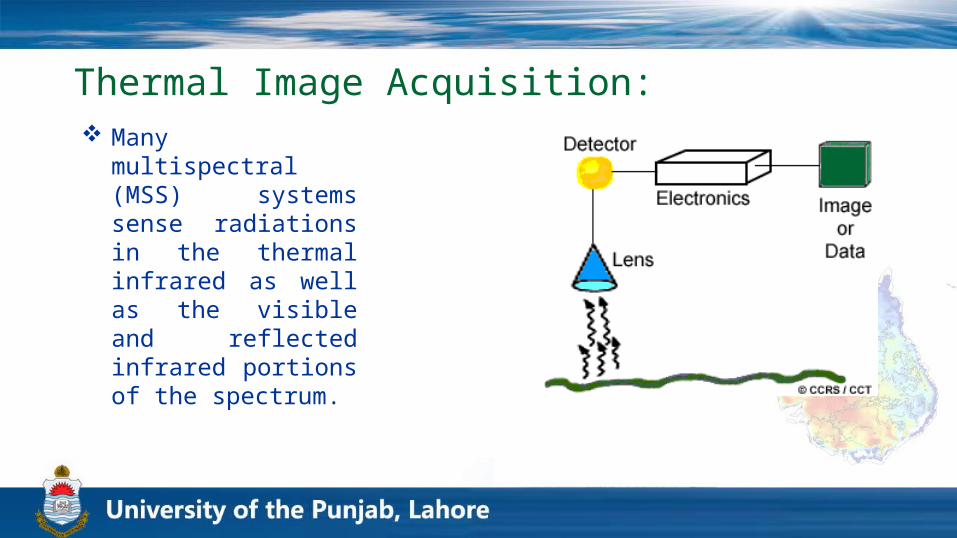
Thermal Image Acquisition: Many multispectral
(MSS) systems sense radiations in the thermal infrared as well as the visible and reflected infrared portions of the spectrum.
Thermal Sensors: Thermal sensors use photo detectors sensitive to the direct
contact of photons on their surface, to detect emitted thermal radiation.
The detectors are cooled to temperatures close to absolute zero in order to limit their own thermal emissions.
Thermal sensors essentially measure the surface temperature and thermal properties of targets.
Continue
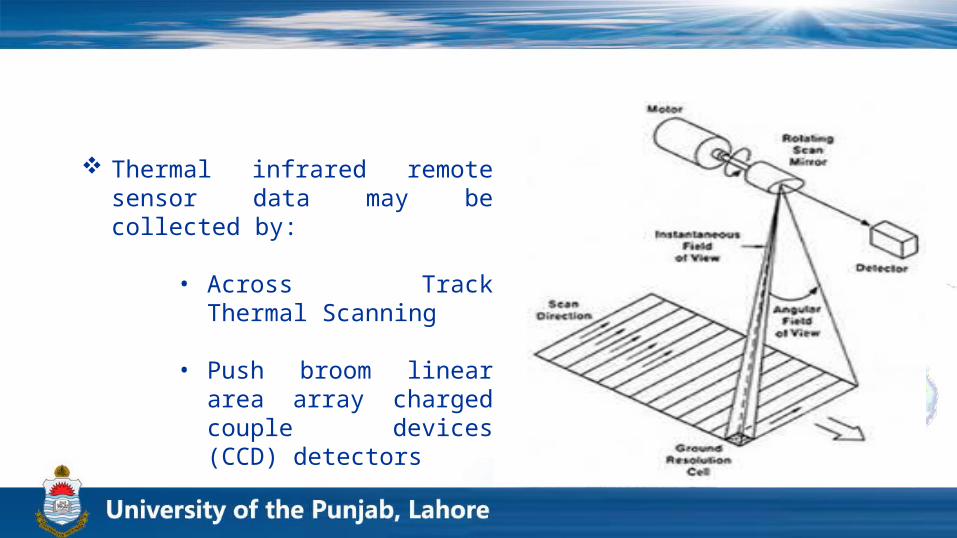
Thermal infrared remote sensor data may be collected by:
• Across Track Thermal Scanning
• Push broom linear area array charged couple devices (CCD) detectors
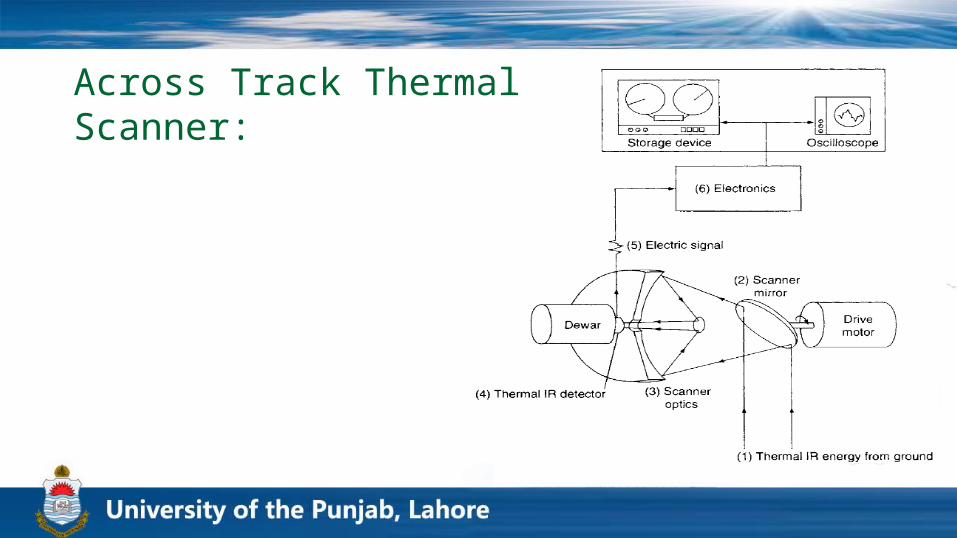
Across Track Thermal Scanner:
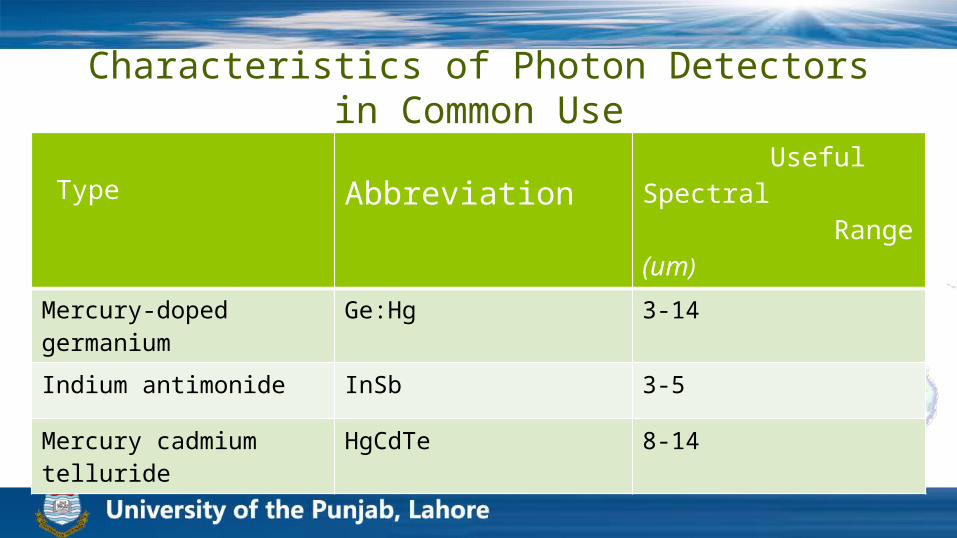
Characteristics of Photon Detectors in Common Use
Type Abbreviation Useful Spectral Range (um)
Mercury-doped germanium
Ge:Hg 3-14
Indium antimonide InSb 3-5
Mercury cadmium telluride
HgCdTe 8-14
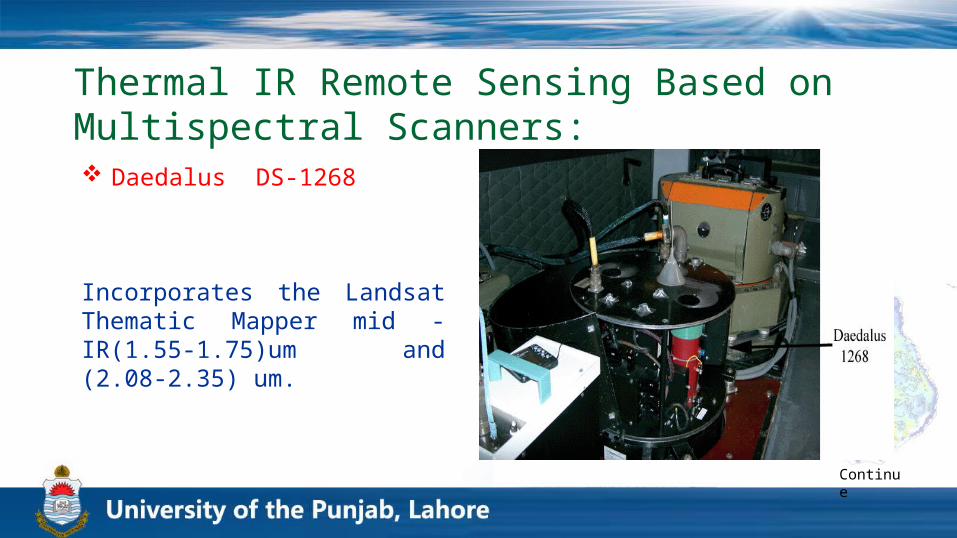
Thermal IR Remote Sensing Based on Multispectral Scanners: Daedalus DS-1268
Incorporates the Landsat Thematic Mapper mid -IR(1.55-1.75)um and (2.08-2.35) um.
Continue
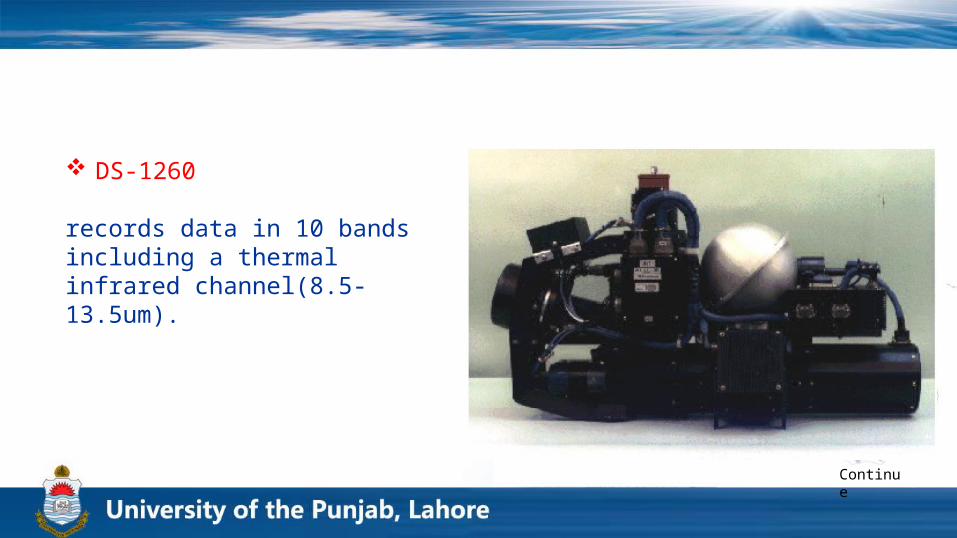
DS-1260
records data in 10 bands including a thermal infrared channel(8.5-13.5um).
Continue
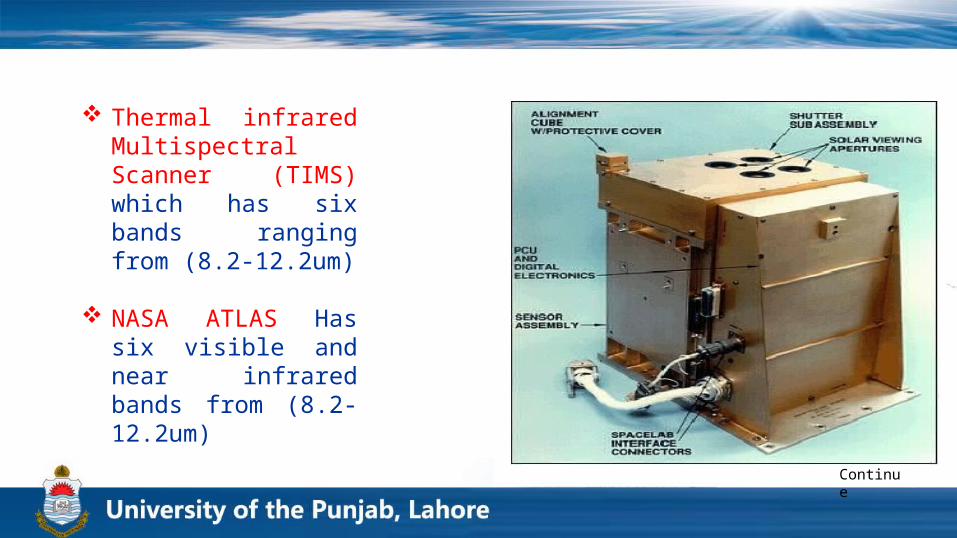
Thermal infrared Multispectral Scanner (TIMS) which has six bands ranging from (8.2-12.2um)
NASA ATLAS Has six visible and near infrared bands from (8.2-12.2um)
Continue
LANDSAT THERMAL INFRARED SENSOR(TIRS)
The Thermal Infrared Sensor (TIRS): The Thermal Infrared Sensor (TIRS) will measure land surface
temperature in two thermal bands with a new technology that applies quantum physics to detect heat.
TIRS was added to the satellite mission when it became clear that state water resource managers rely on the highly accurate measurements of Earth’s thermal energy.
TIRS uses Quantum Well Infrared Photo detectors (QWIPs) to detect long wavelengths of light emitted by the Earth whose intensity depends on surface temperature.
The QWIPs TIRS uses are sensitive to two thermal infrared wavelength bands, helping it separate the temperature of the Earth’s surface from that of the atmosphere. Their design operates on the complex principles of quantum mechanics.
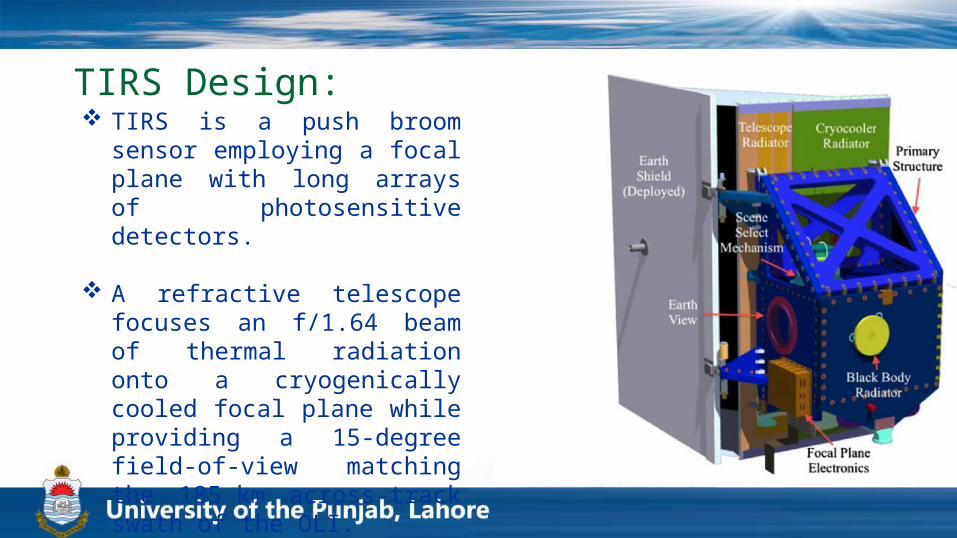
TIRS Design: TIRS is a push broom sensor
employing a focal plane with long arrays of photosensitive detectors.
A refractive telescope focuses an f/1.64 beam of thermal radiation onto a cryogenically cooled focal plane while providing a 15-degree field-of-view matching the 185 km across-track swath of the OLI.
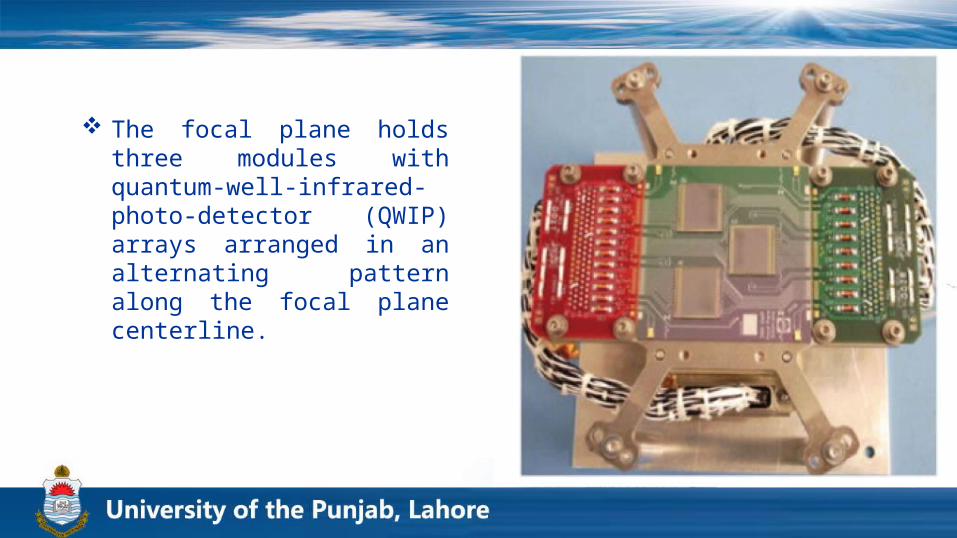
The focal plane holds three modules with quantum-well-infrared-photo-detector (QWIP) arrays arranged in an alternating pattern along the focal plane centerline.
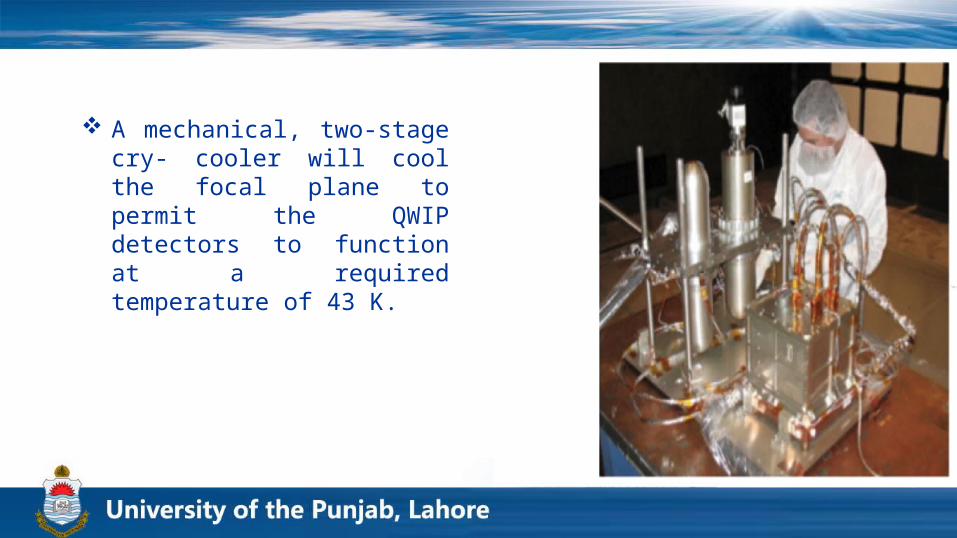
A mechanical, two-stage cry- cooler will cool the focal plane to permit the QWIP detectors to function at a required temperature of 43 K.
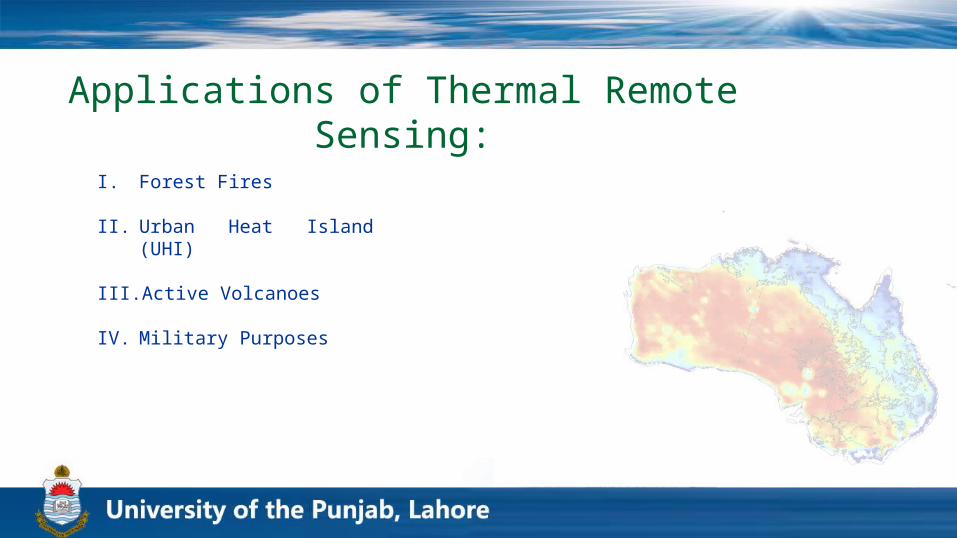
Applications of Thermal Remote Sensing:
I. Forest Fires
II. Urban Heat Island (UHI)
III. Active Volcanoes
IV. Military Purposes
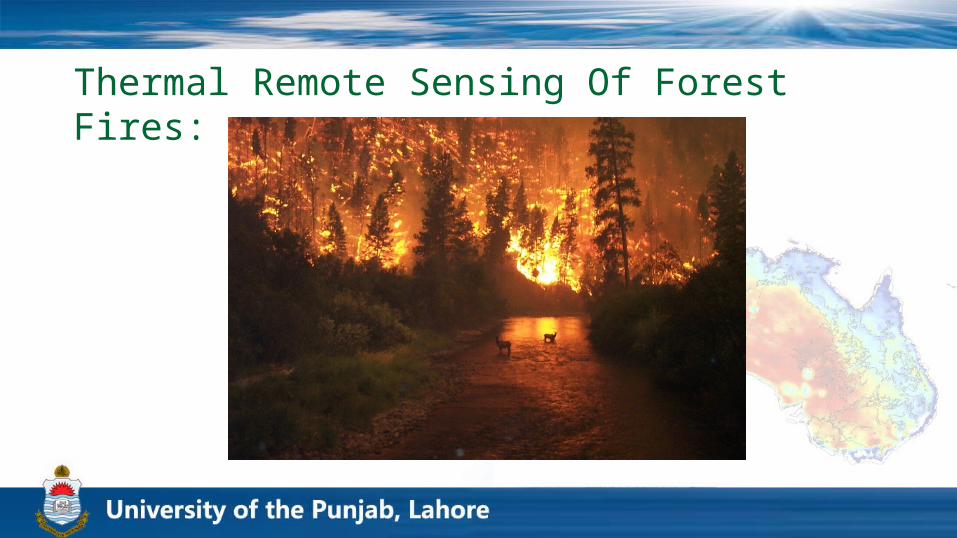
Thermal Remote Sensing Of Forest Fires:
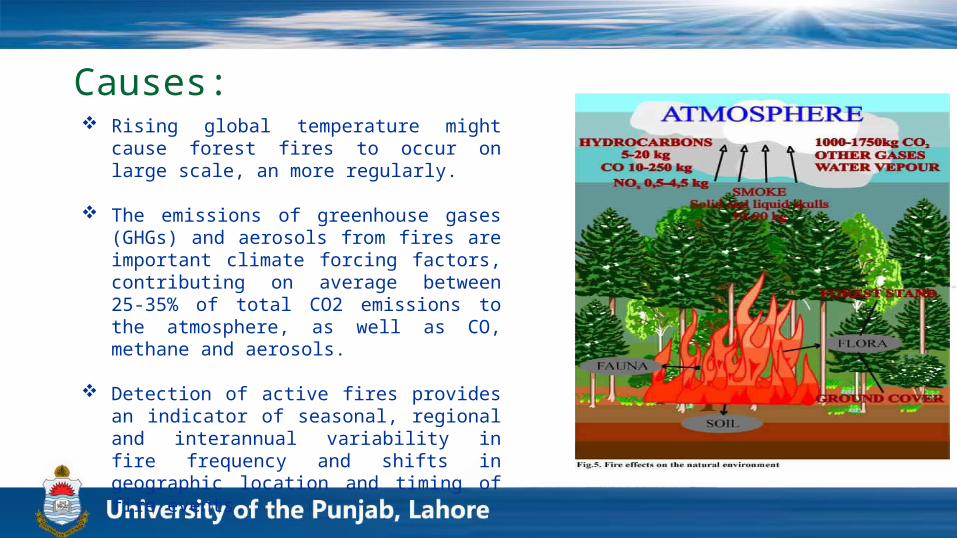
Causes: Rising global temperature might cause
forest fires to occur on large scale, an more regularly.
The emissions of greenhouse gases (GHGs) and aerosols from fires are important climate forcing factors, contributing on average between 25-35% of total CO2 emissions to the atmosphere, as well as CO, methane and aerosols.
Detection of active fires provides an indicator of seasonal, regional and interannual variability in fire frequency and shifts in geographic location and timing of fire events.
Why we use Thermal Remote Sensing in forest fires?
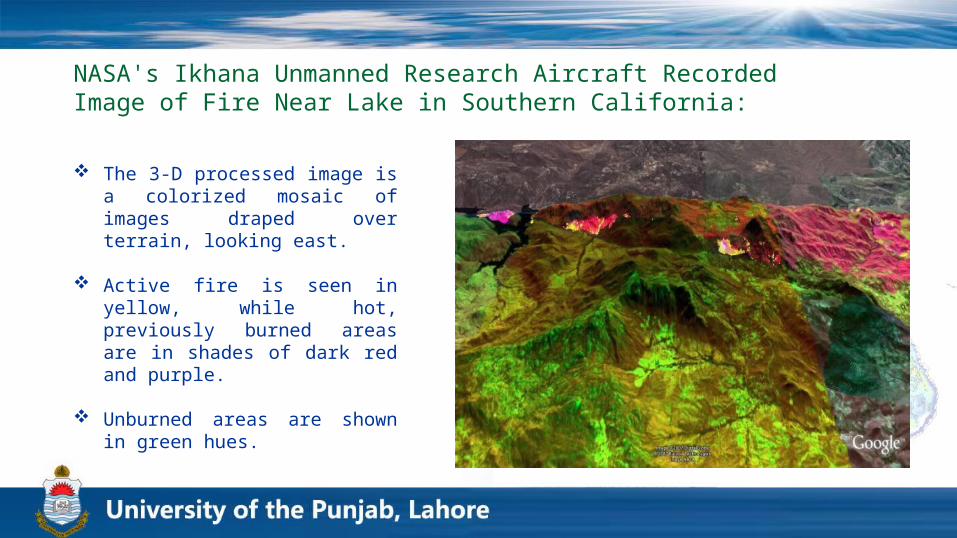
NASA's Ikhana Unmanned Research Aircraft Recorded Image of Fire Near Lake in Southern California:
The 3-D processed image is a colorized mosaic of images draped over terrain, looking east.
Active fire is seen in yellow, while hot, previously burned areas are in shades of dark red and purple.
Unburned areas are shown in green hues.
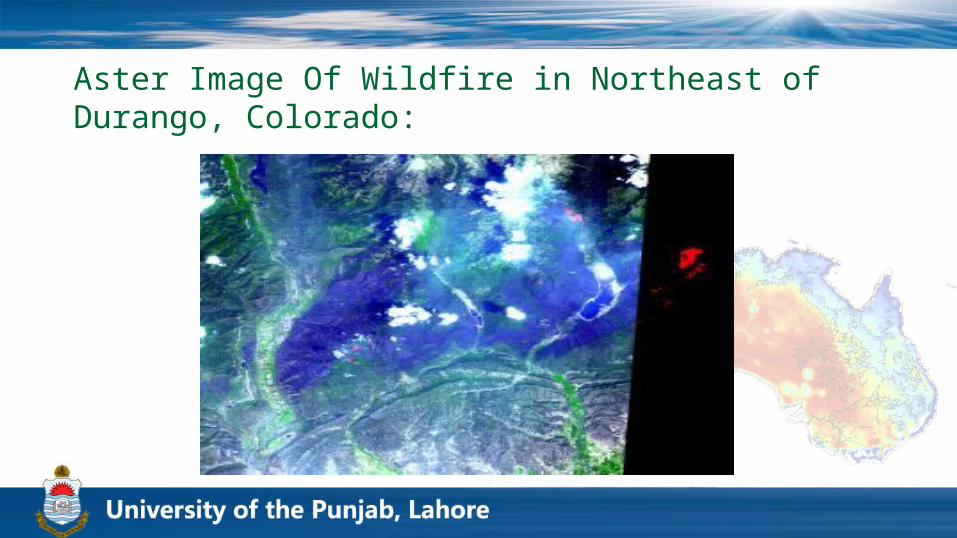
Aster Image Of Wildfire in Northeast of Durango, Colorado:
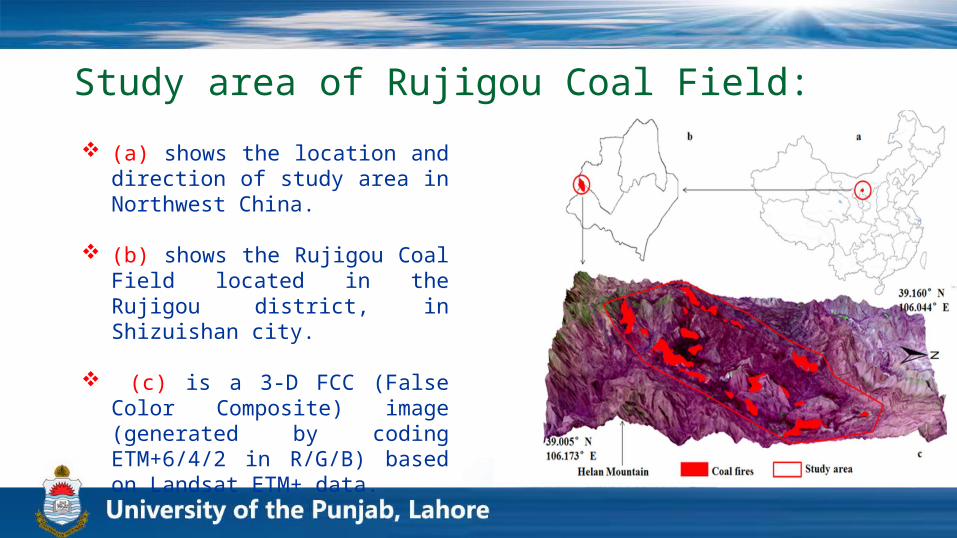
Study area of Rujigou Coal Field: (a) shows the location and
direction of study area in Northwest China.
(b) shows the Rujigou Coal Field located in the Rujigou district, in Shizuishan city.
(c) is a 3-D FCC (False Color Composite) image (generated by coding ETM+6/4/2 in R/G/B) based on Landsat ETM+ data.
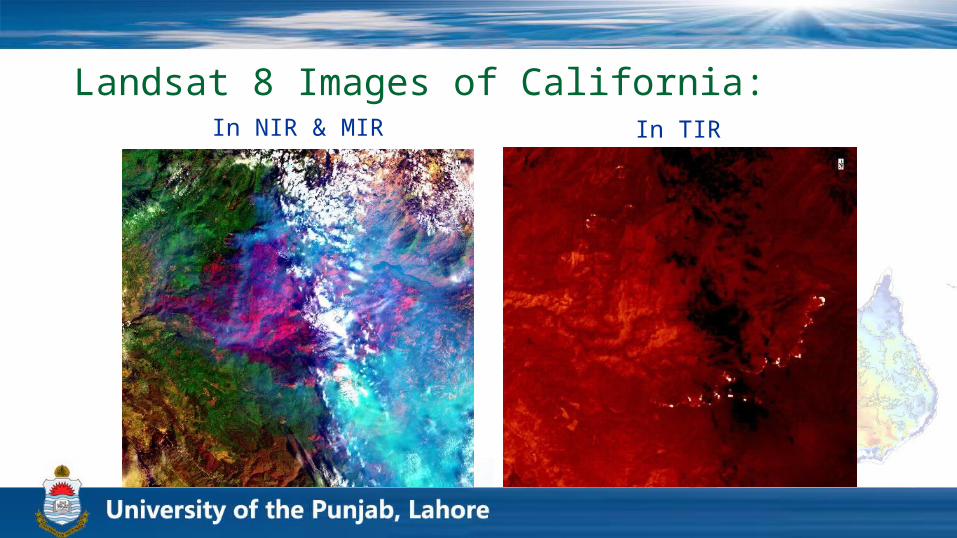
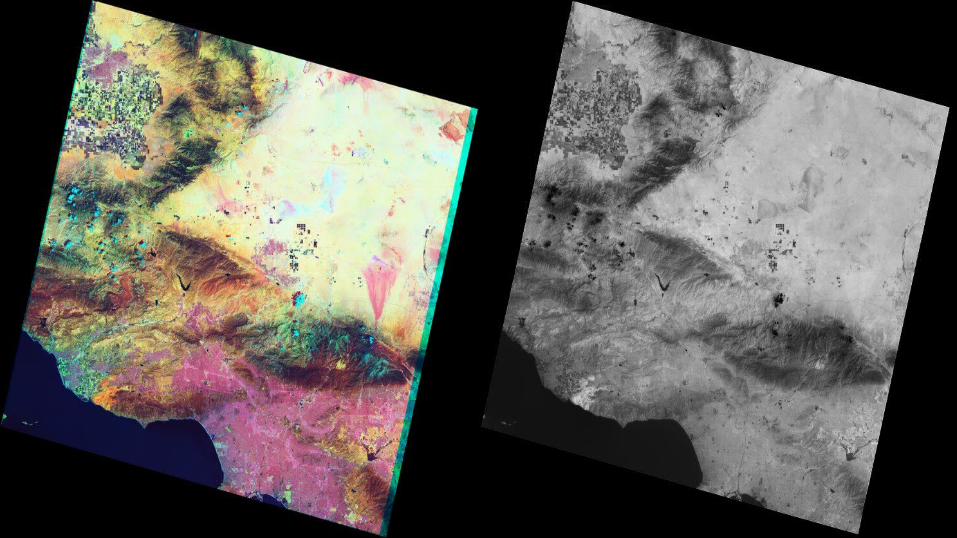
Landsat 8 Images of California:In NIR & MIR In TIR
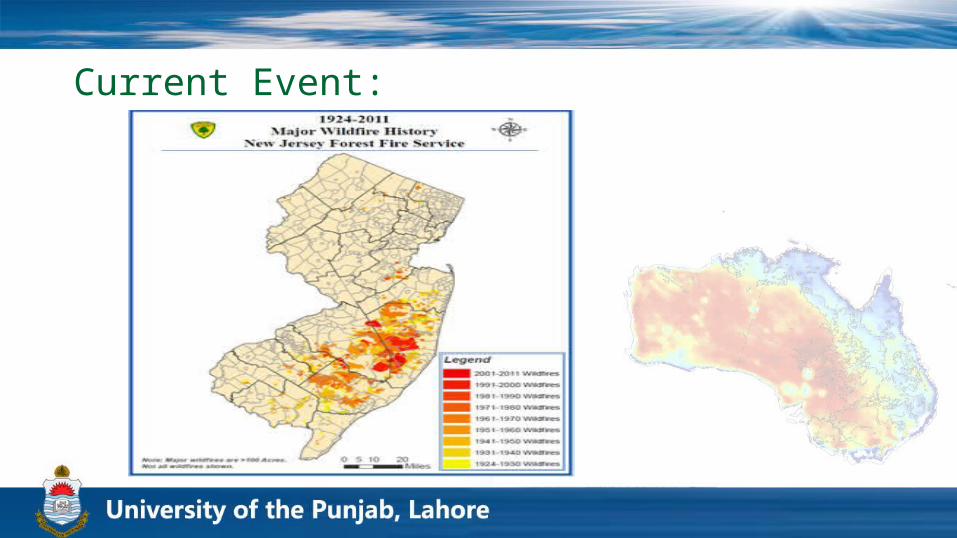
Current Event:
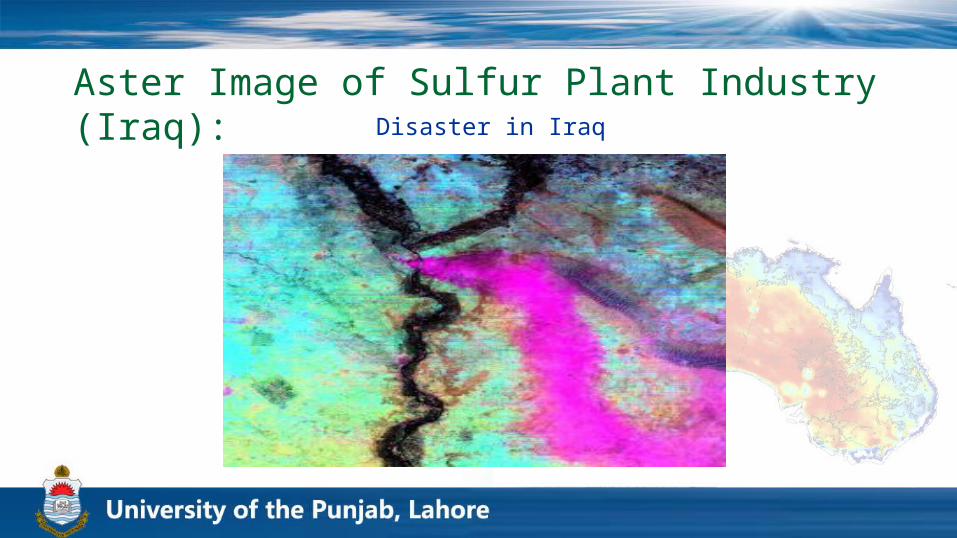
Aster Image of Sulfur Plant Industry (Iraq):Disaster in Iraq
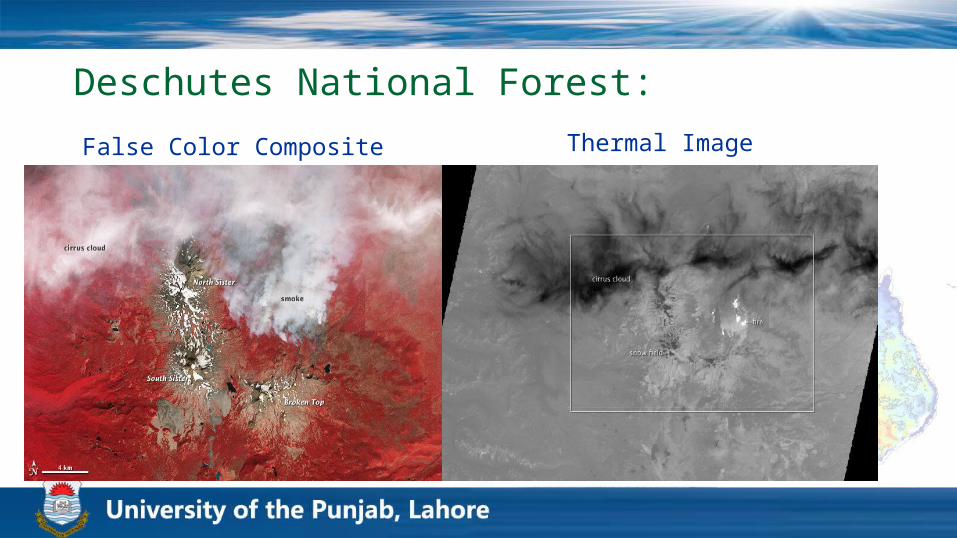
Deschutes National Forest:False Color Composite Thermal Image
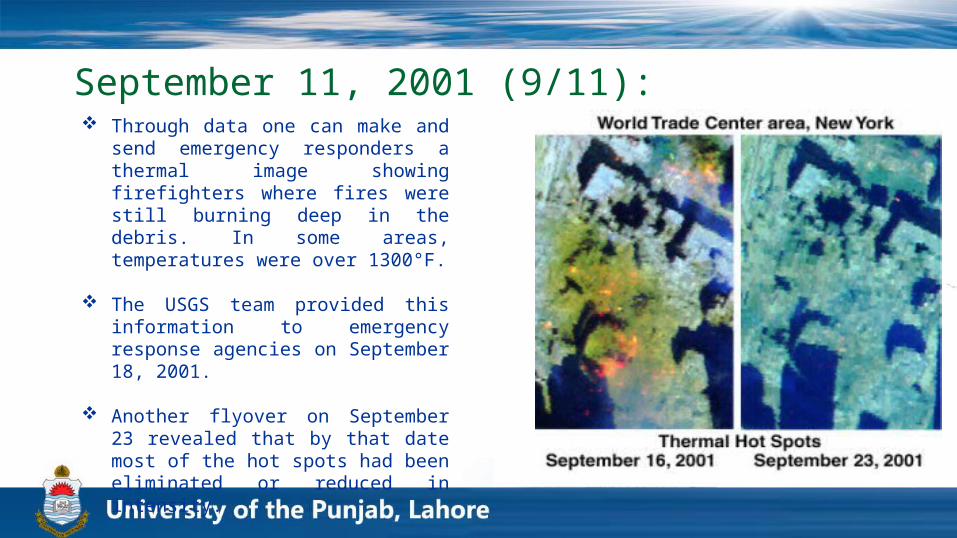
September 11, 2001 (9/11): Through data one can make and
send emergency responders a thermal image showing firefighters where fires were still burning deep in the debris. In some areas, temperatures were over 1300°F.
The USGS team provided this information to emergency response agencies on September 18, 2001.
Another flyover on September 23 revealed that by that date most of the hot spots had been eliminated or reduced in intensity.
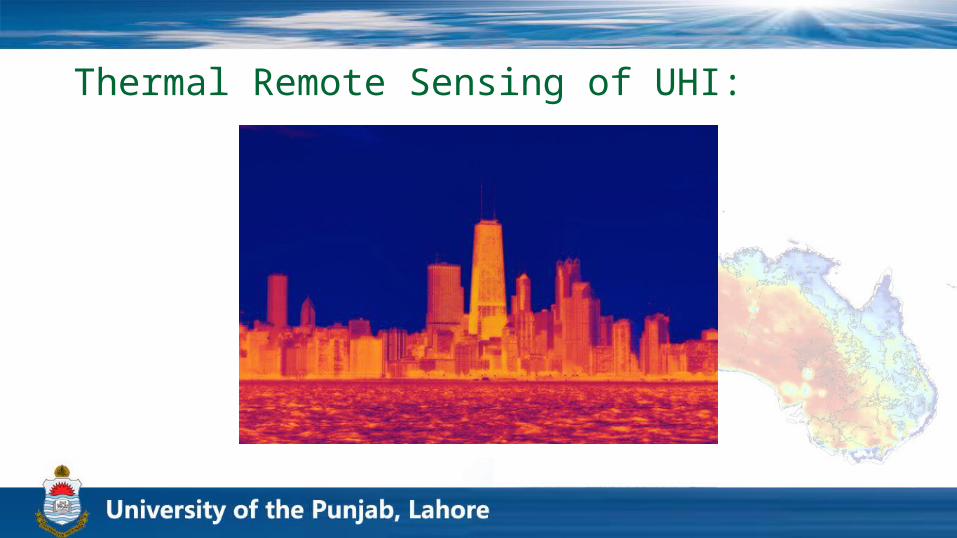
Thermal Remote Sensing of UHI:
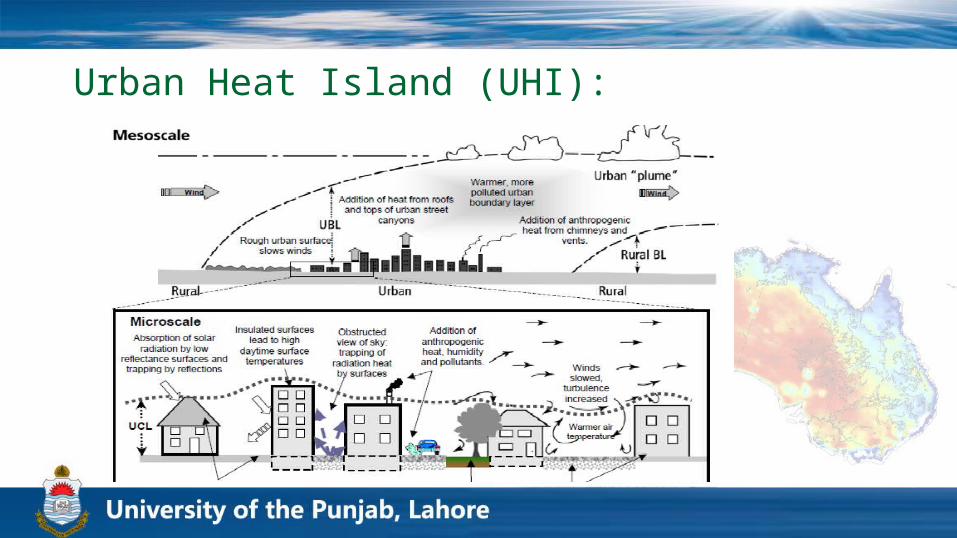
Urban Heat Island (UHI):
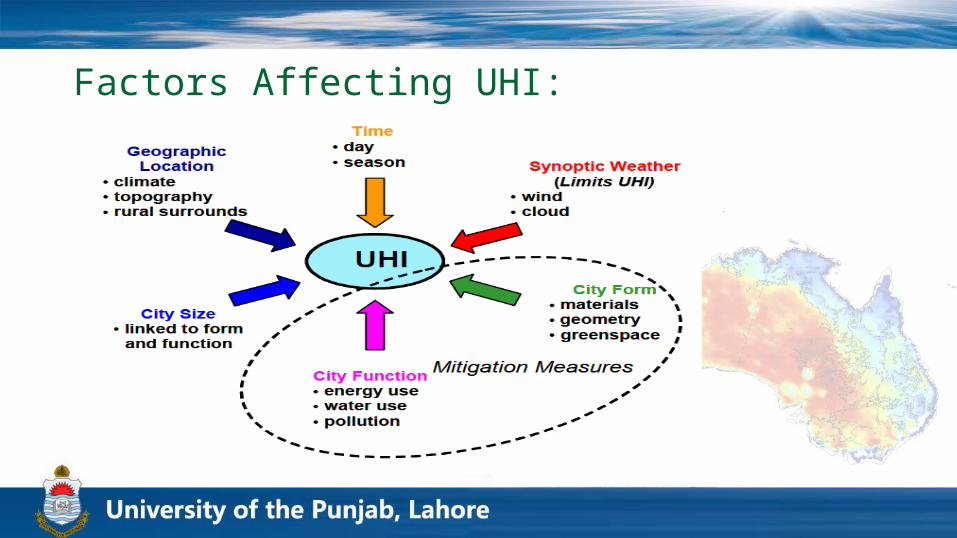
Factors Affecting UHI:
Why we Thermal Remote Sensing in urban Areas?
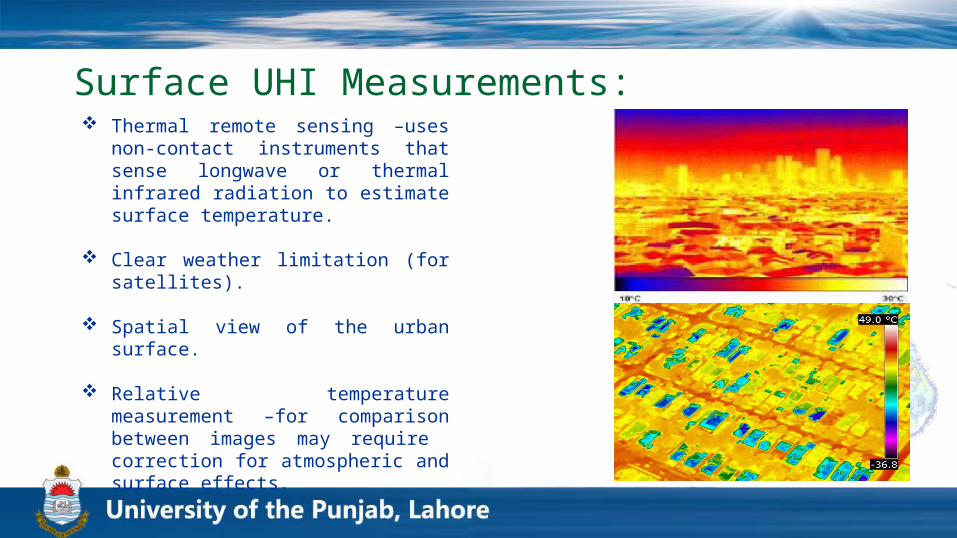
Surface UHI Measurements: Thermal remote sensing –uses non-
contact instruments that sense longwave or thermal infrared radiation to estimate surface temperature.
Clear weather limitation (for satellites).
Spatial view of the urban surface.
Relative temperature measurement –for comparison between images may require correction for atmospheric and surface effects.
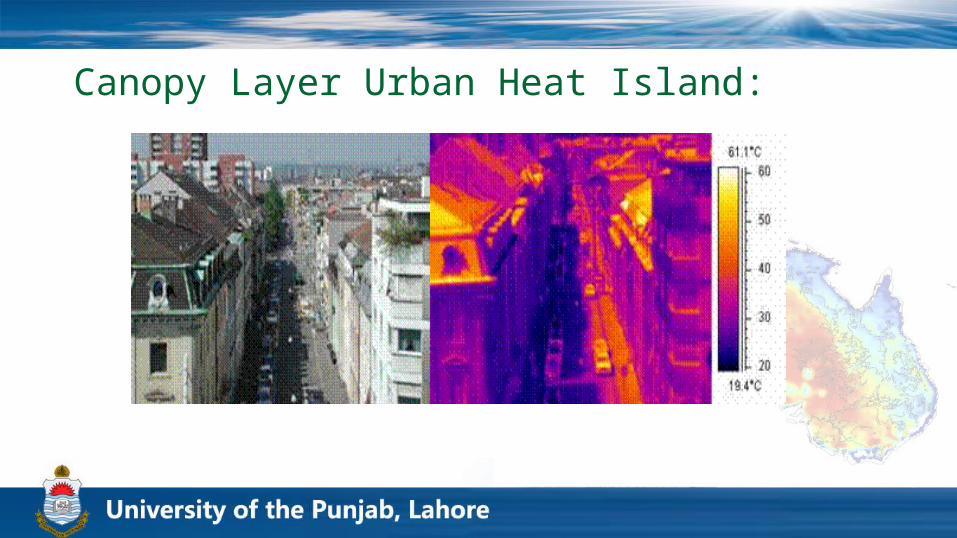
Canopy Layer Urban Heat Island:
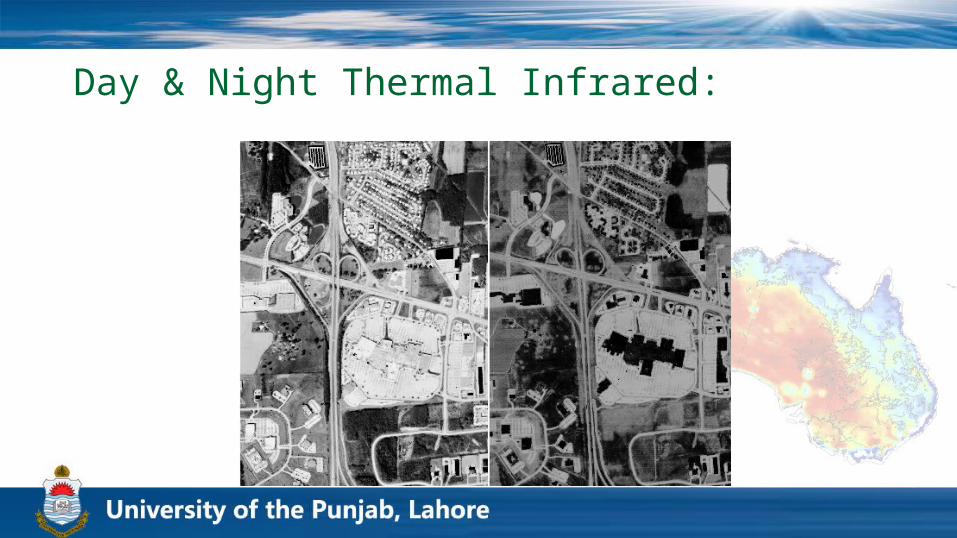
Day & Night Thermal Infrared:
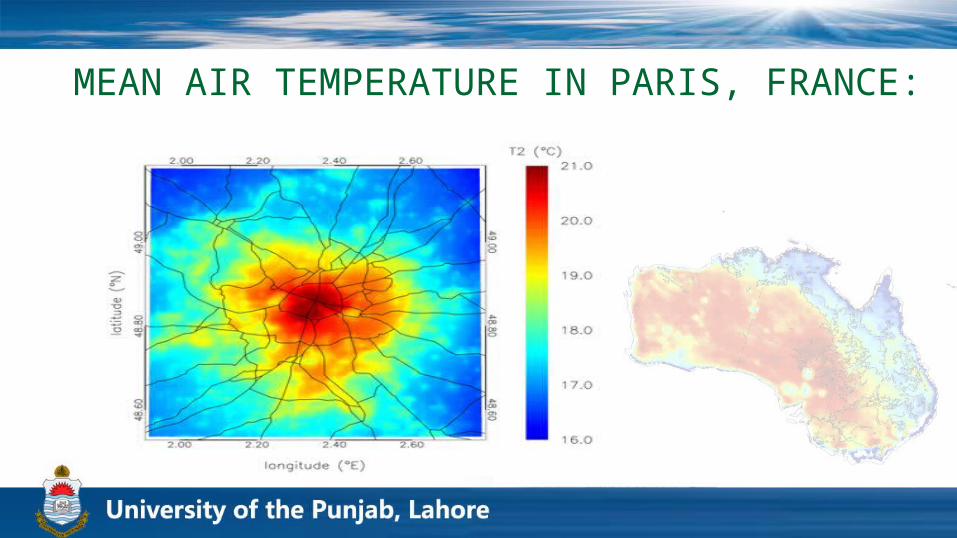
MEAN AIR TEMPERATURE IN PARIS, FRANCE:
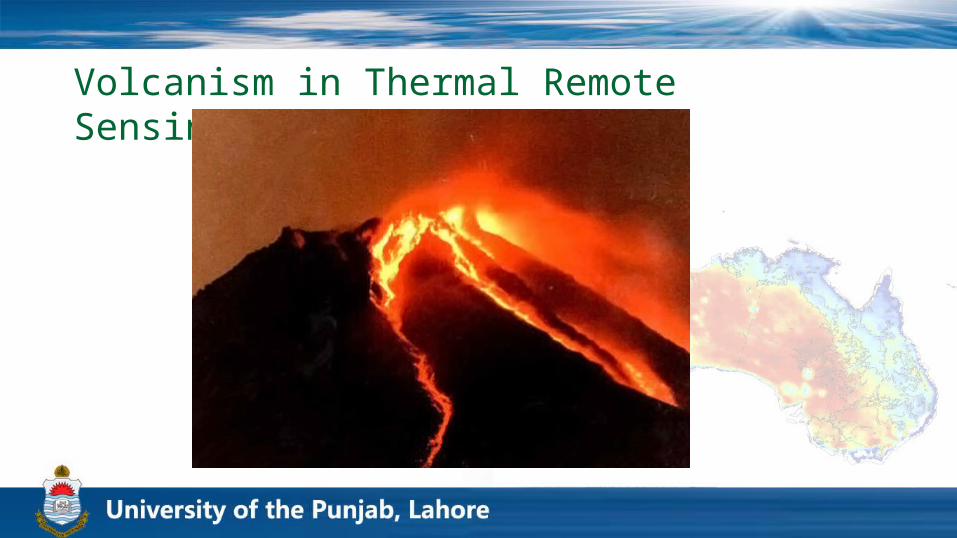
Volcanism in Thermal Remote Sensing:
Why we need Thermal remote sensing in active volcanoes ??? Active volcanoes exhibit many difficulties in being studied by in
situ techniques.
For example, during eruptions, high altitude areas are very hard to be accessed because of volcanic hazards.
We use thermal remote sensing techniques in mapping and monitoring the evolution of volcanic activity.
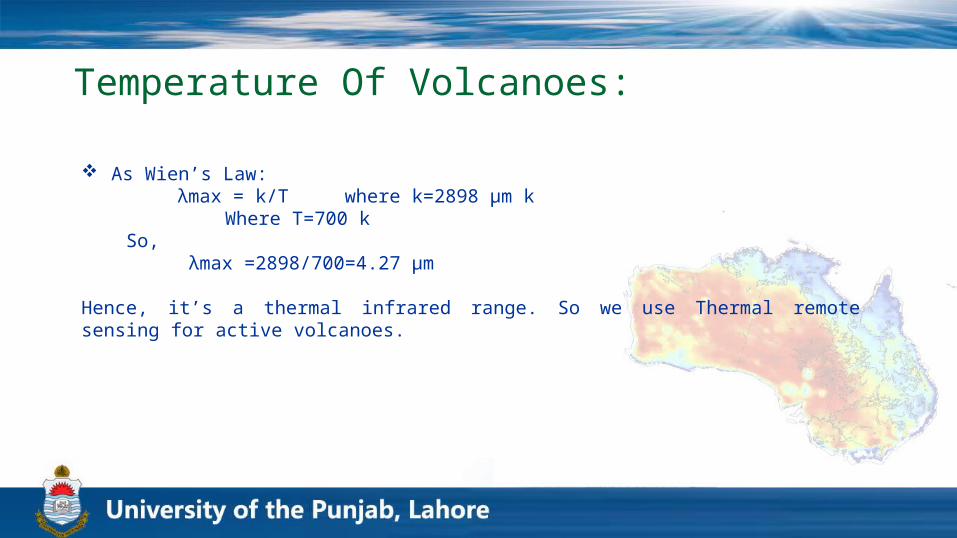
Temperature Of Volcanoes:
As Wien’s Law:λmax = k/T where k=2898 μm k
Where T=700 k So,
λmax =2898/700=4.27 μm
Hence, it’s a thermal infrared range. So we use Thermal remote sensing for active volcanoes.
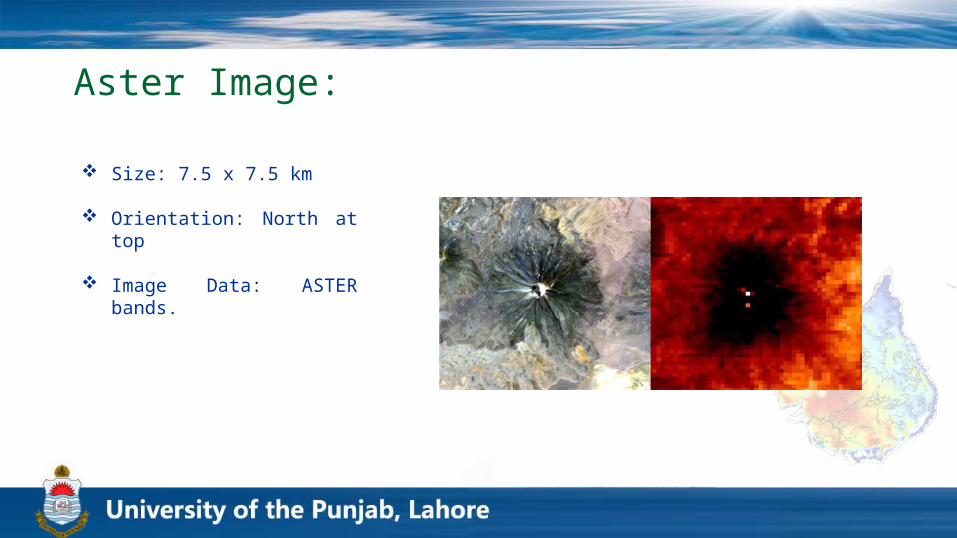
Aster Image:
Size: 7.5 x 7.5 km
Orientation: North at top
Image Data: ASTER bands.
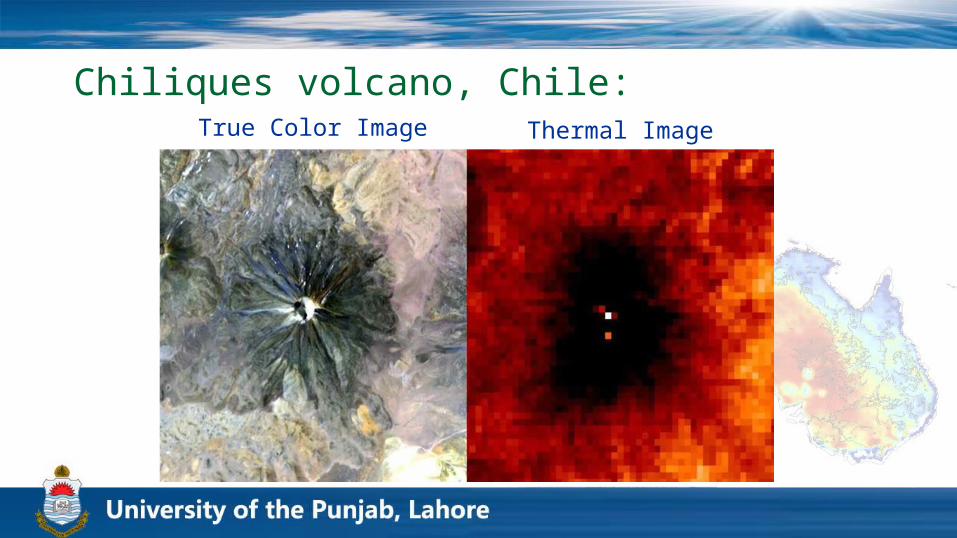
Chiliques volcano, Chile:True Color Image Thermal Image
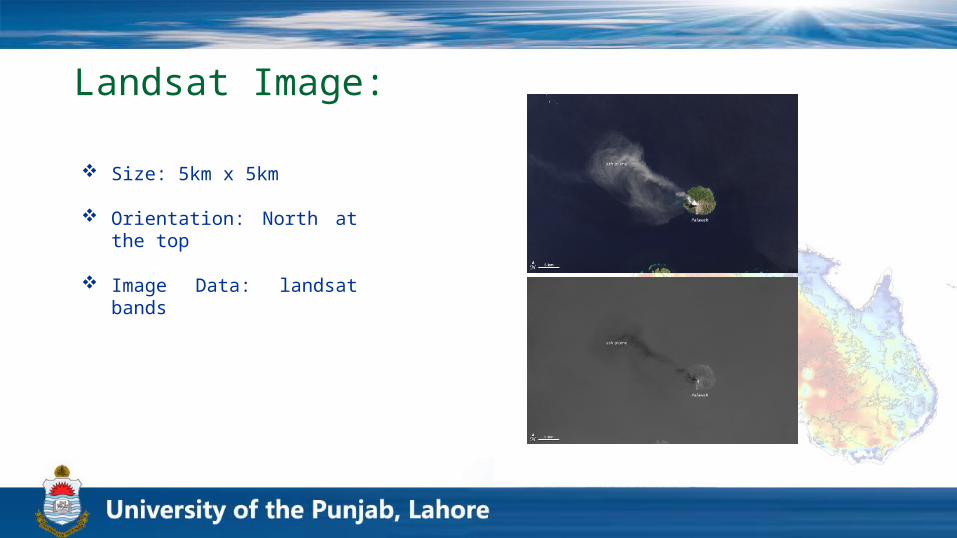
Landsat Image:
Size: 5km x 5km
Orientation: North at the top
Image Data: landsat bands
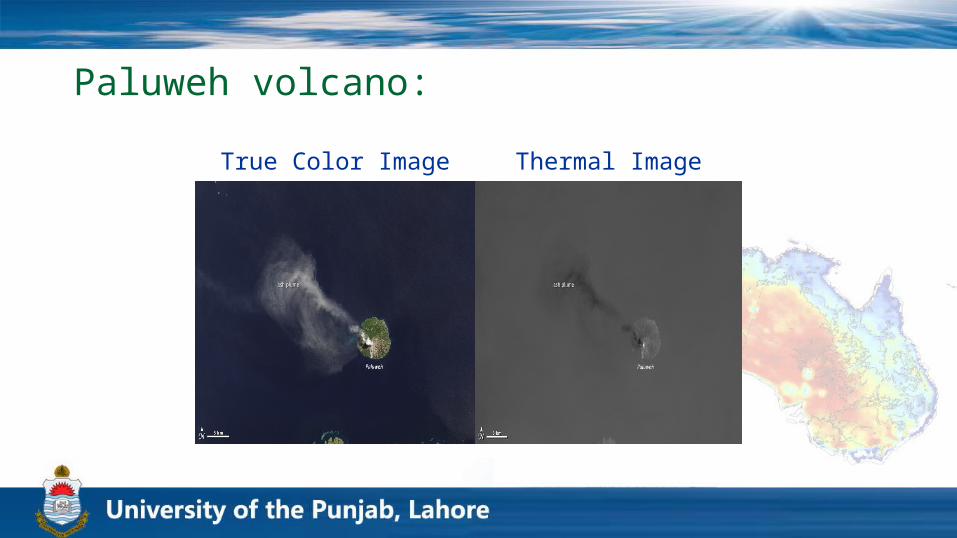
Paluweh volcano:True Color Image Thermal Image

Most Active Volcanoes:
True Color Image Thermal Image
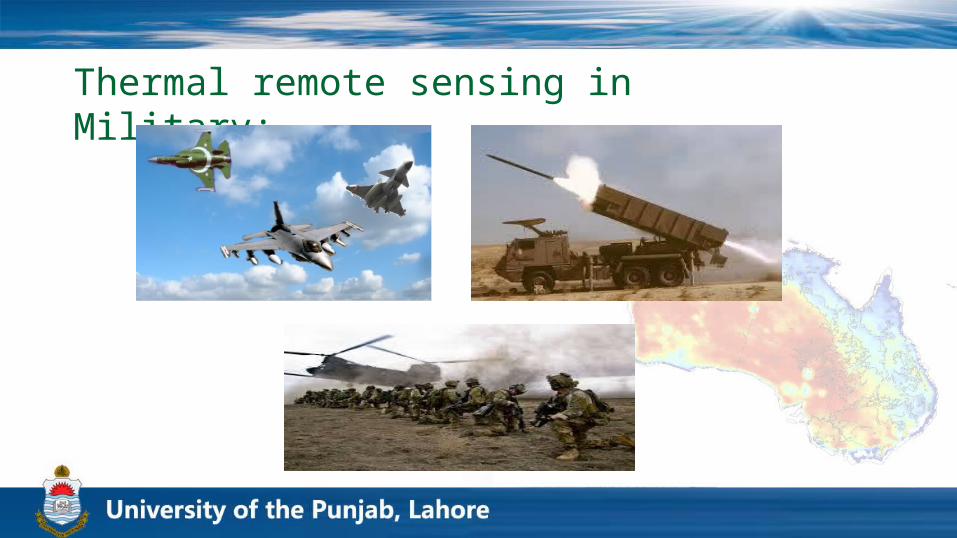
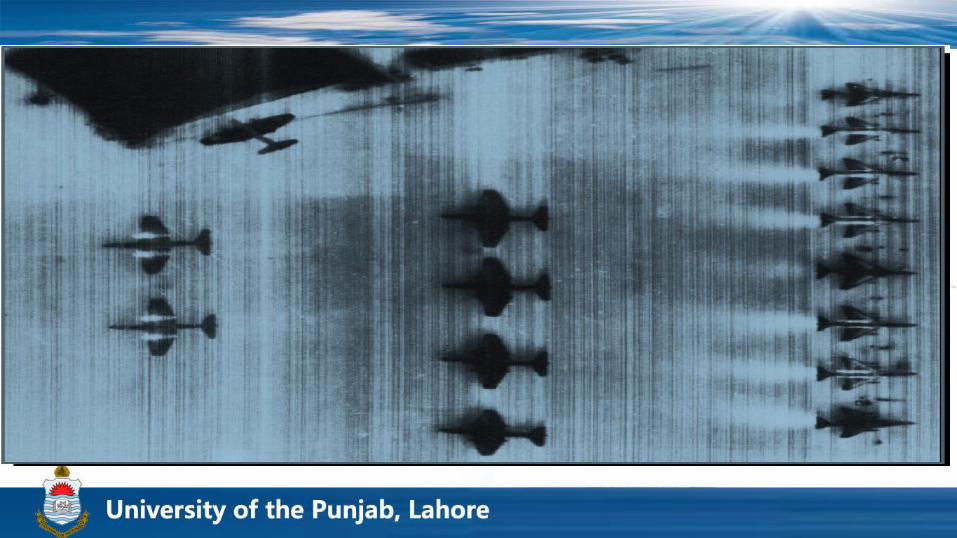
Thermal remote sensing in Military:
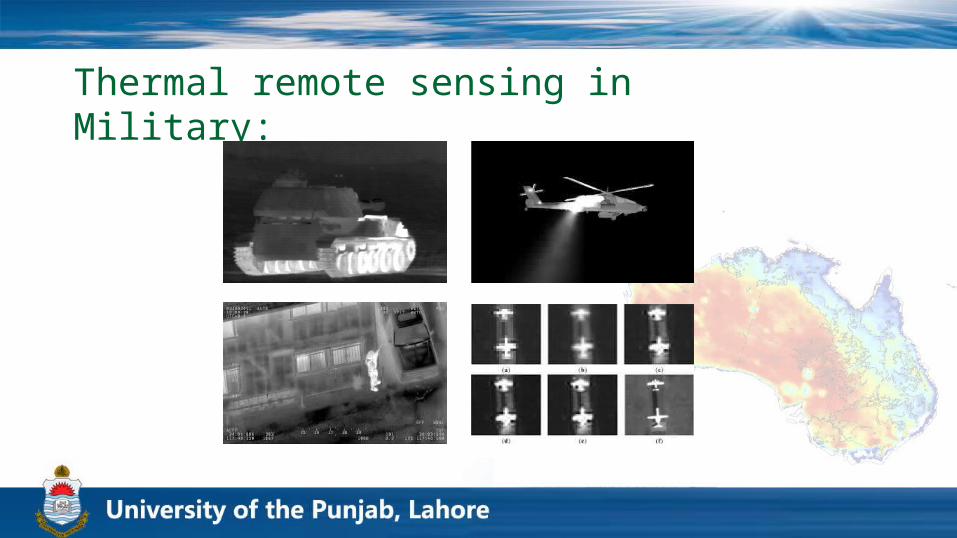
Thermal remote sensing in Military:
Advantages & Disadvantages:
Advantages
We can detect true temperature of objects.
Feature cannot be detected by optical RS may be detected with Thermal IR.
Disadvantages
It is pretty difficult to maintain the sensors at required temperatures.
Image interpretation of thermal image is difficult.
References: “Remote Sensing of the Environment ” , John. R Jensen, Edition 6th.
“Remote Sensing and Image Interpretation ” , Thomas M. Lillisand, Ralph W. Kiefer, Jonathan W. Chipman, Edition 6th.
www.geog.ucsb.edu/~jeff/.../remote_sensing/thermal/thermalirinfo.html
www.crisp.nus.edu.sg/~research/tutorial/infrared.htm
earth.esa.int/landtraining09/D1Lb3_Su_SEBBasics.pdf
en.wikipedia.org/wiki/Remote_sensing
en.wikipedia.org/wiki/Thermal_infrared_spectroscopy
Thanks