Embed Size (px)
Citation preview
The Global Organization of Protein Complexome and Its Application to Cancers in Human Tissues
Sang Hoon Lee School of Physics, Korea Institute for Advanced Study
http://newton.kias.re.kr/~lshlj82
in collaboration with Pan-Jun Kim (APCTP, Pohang), Hawoong Jeong (KAIST, Daejeon), Jing Zhao (Logistical Engineering University, Chongqing), Mikael Huss (Science for Life Laboratory, Stockholm), and Petter Holme (SKKU, Suwon)
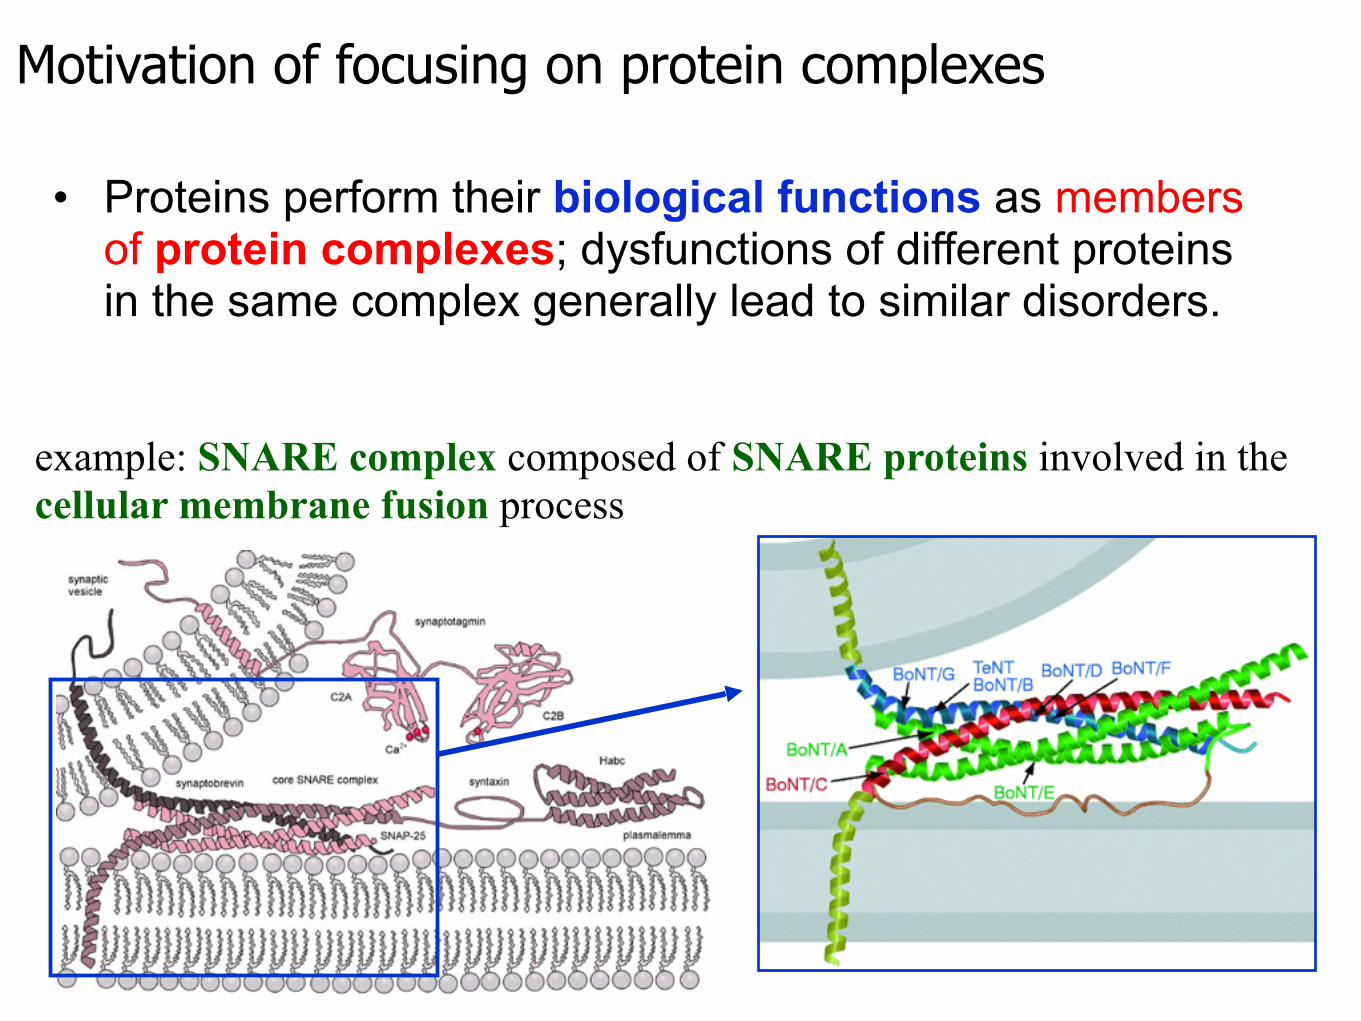
Motivation of focusing on protein complexes
• Proteins perform their biological functions as members of protein complexes; dysfunctions of different proteins in the same complex generally lead to similar disorders.
example: SNARE complex composed of SNARE proteins involved in the cellular membrane fusion process
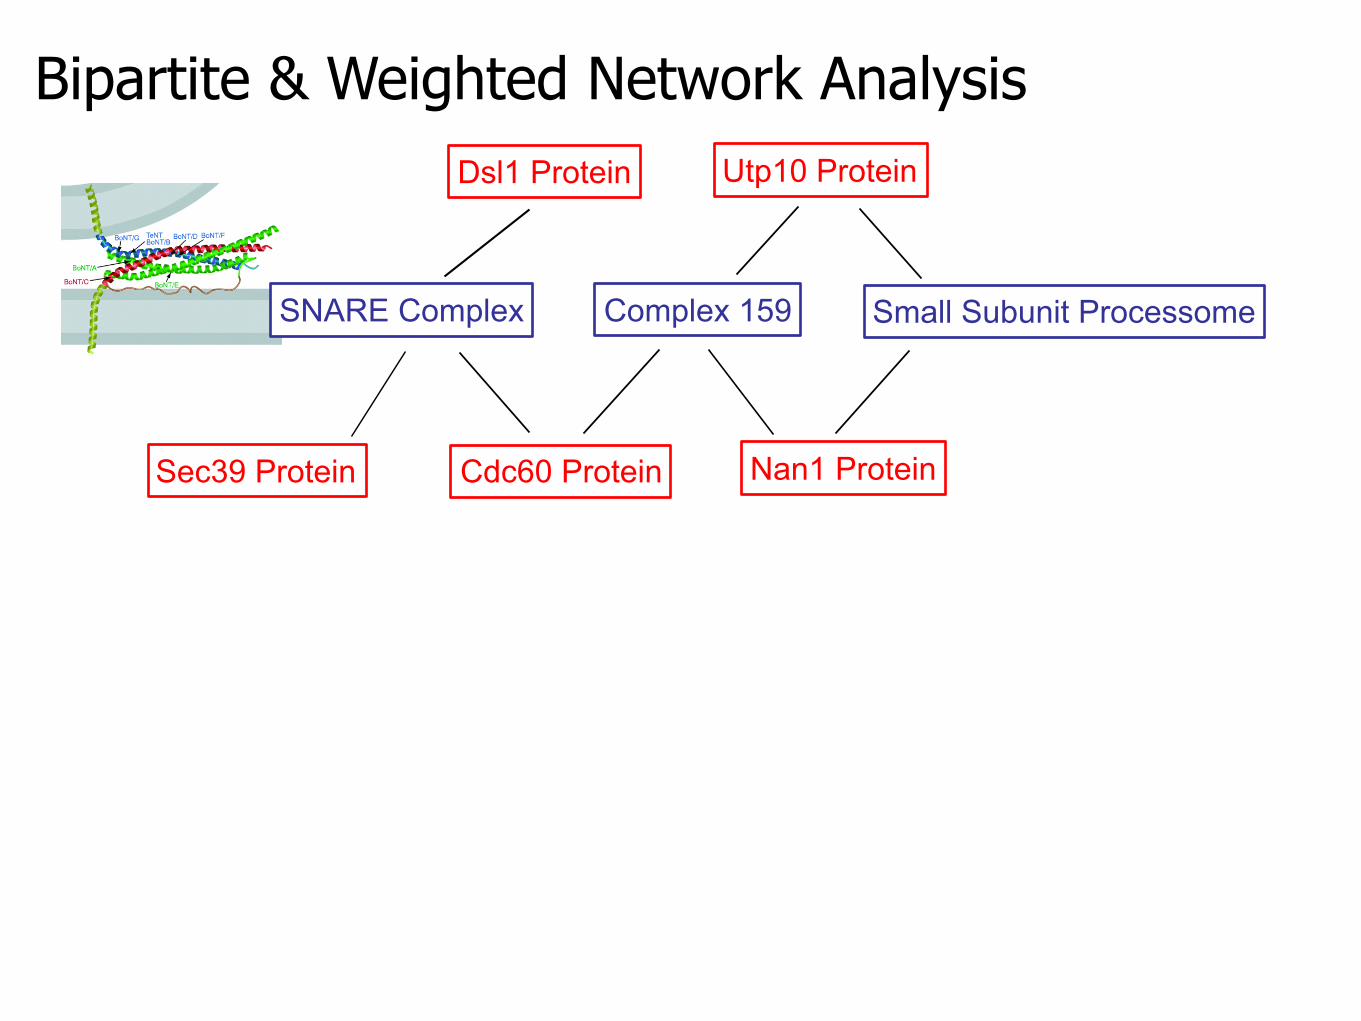
Bipartite & Weighted Network Analysis
SNARE Complex Complex 159
Sec39 Protein Cdc60 Protein Nan1 Protein
Utp10 Protein
Small Subunit Processome
Dsl1 Protein
Bipartite & Weighted Network Analysis
SNARE Complex Complex 159
Sec39 Protein Cdc60 Protein Nan1 Protein
Utp10 Protein
Small Subunit Processome
Dsl1 Protein
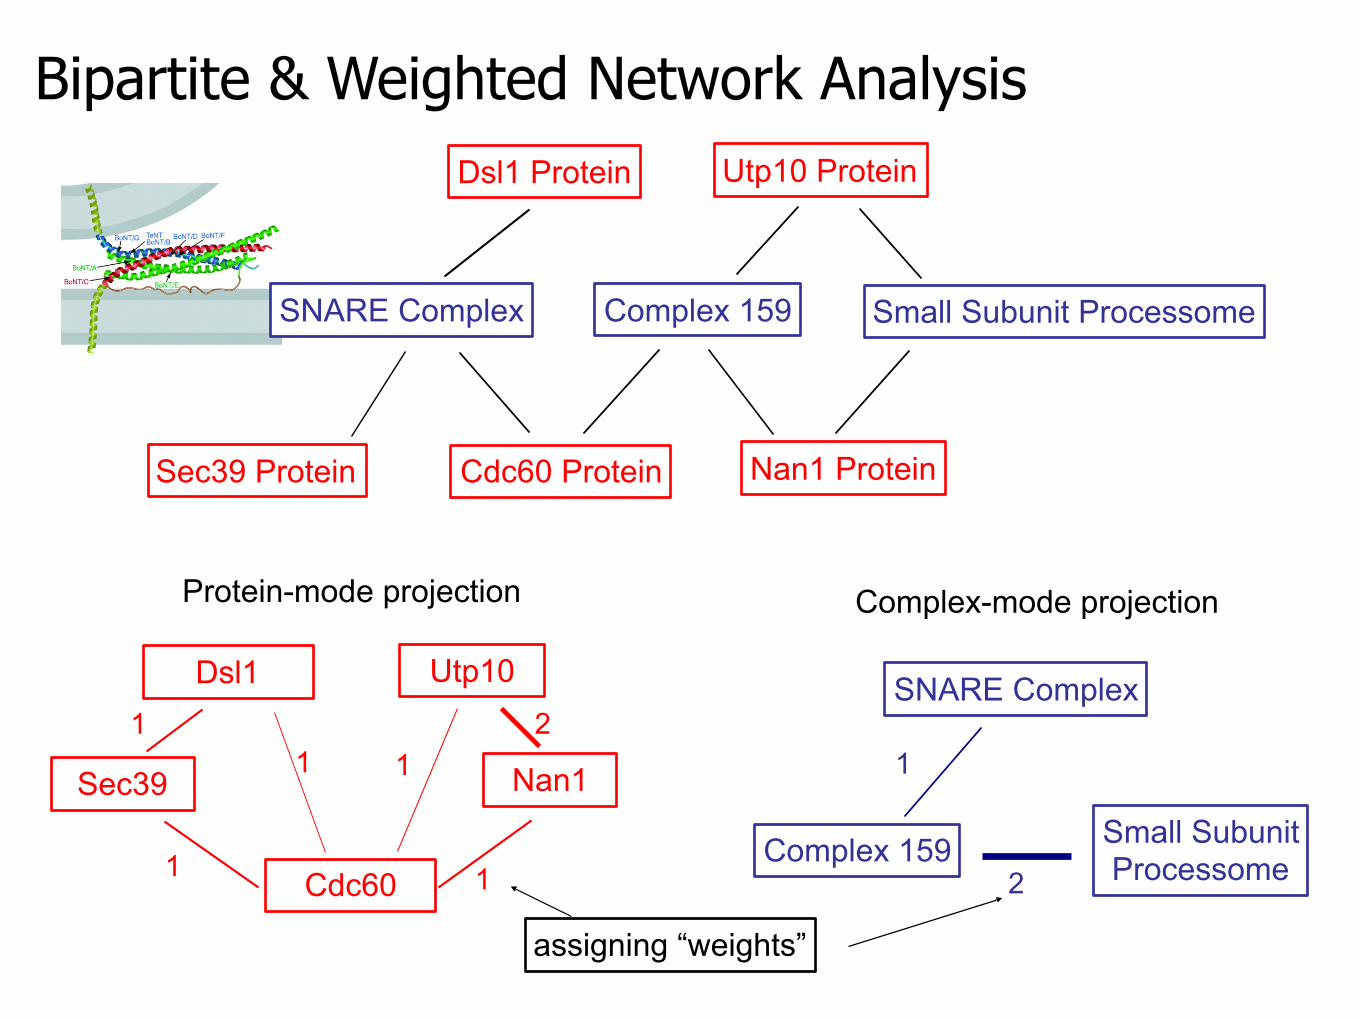
Dsl1
Sec39
Cdc60
Nan1
Utp10
Protein-mode projection
SNARE Complex
Complex 159 Small SubunitProcessome
Complex-mode projection
11
1
1
1
21
2
assigning “weights”
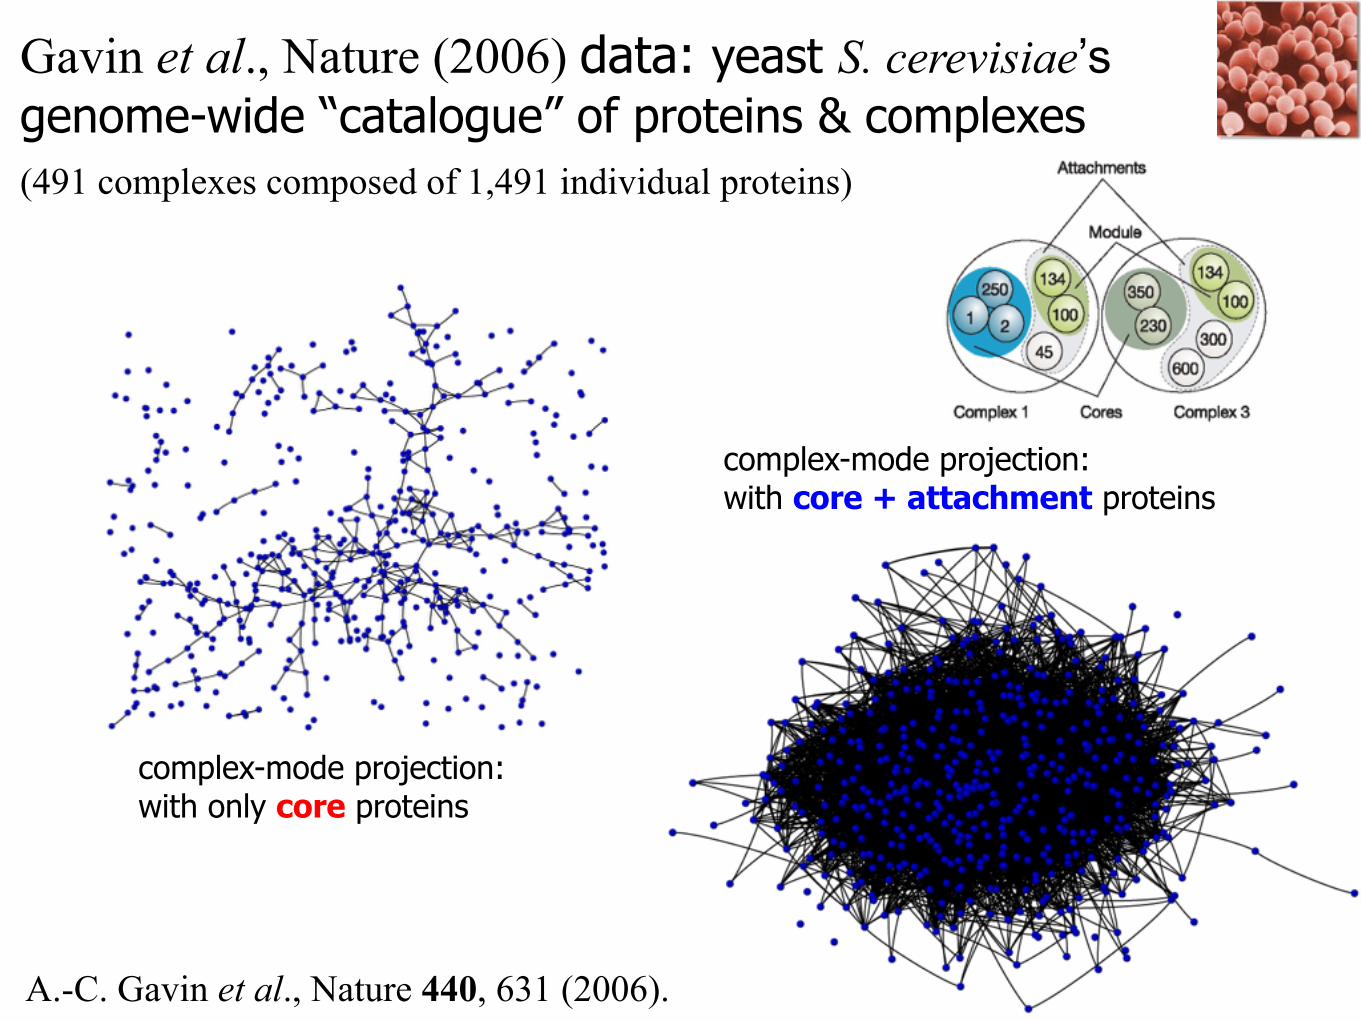
Gavin et al., Nature (2006) data: yeast S. cerevisiae’s genome-wide “catalogue” of proteins & complexes (491 complexes composed of 1,491 individual proteins)
complex-mode projection:with only core proteins
complex-mode projection:with core + attachment proteins
A.-C. Gavin et al., Nature 440, 631 (2006).
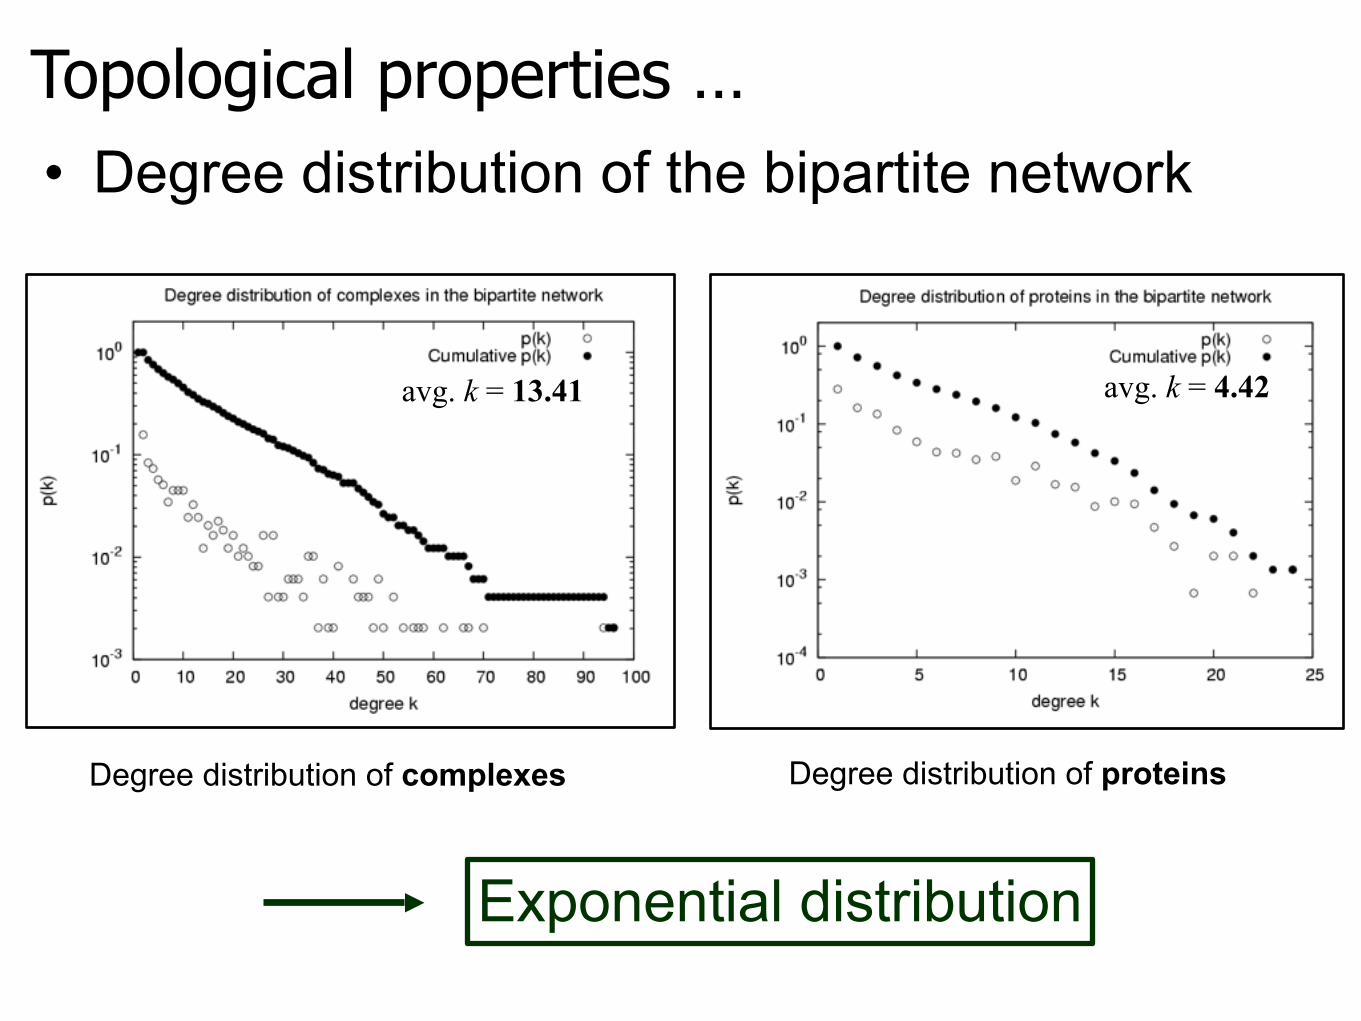
Topological properties …
Exponential distribution
• Degree distribution of the bipartite network
Degree distribution of complexes Degree distribution of proteins
avg. k = 13.41 avg. k = 4.42
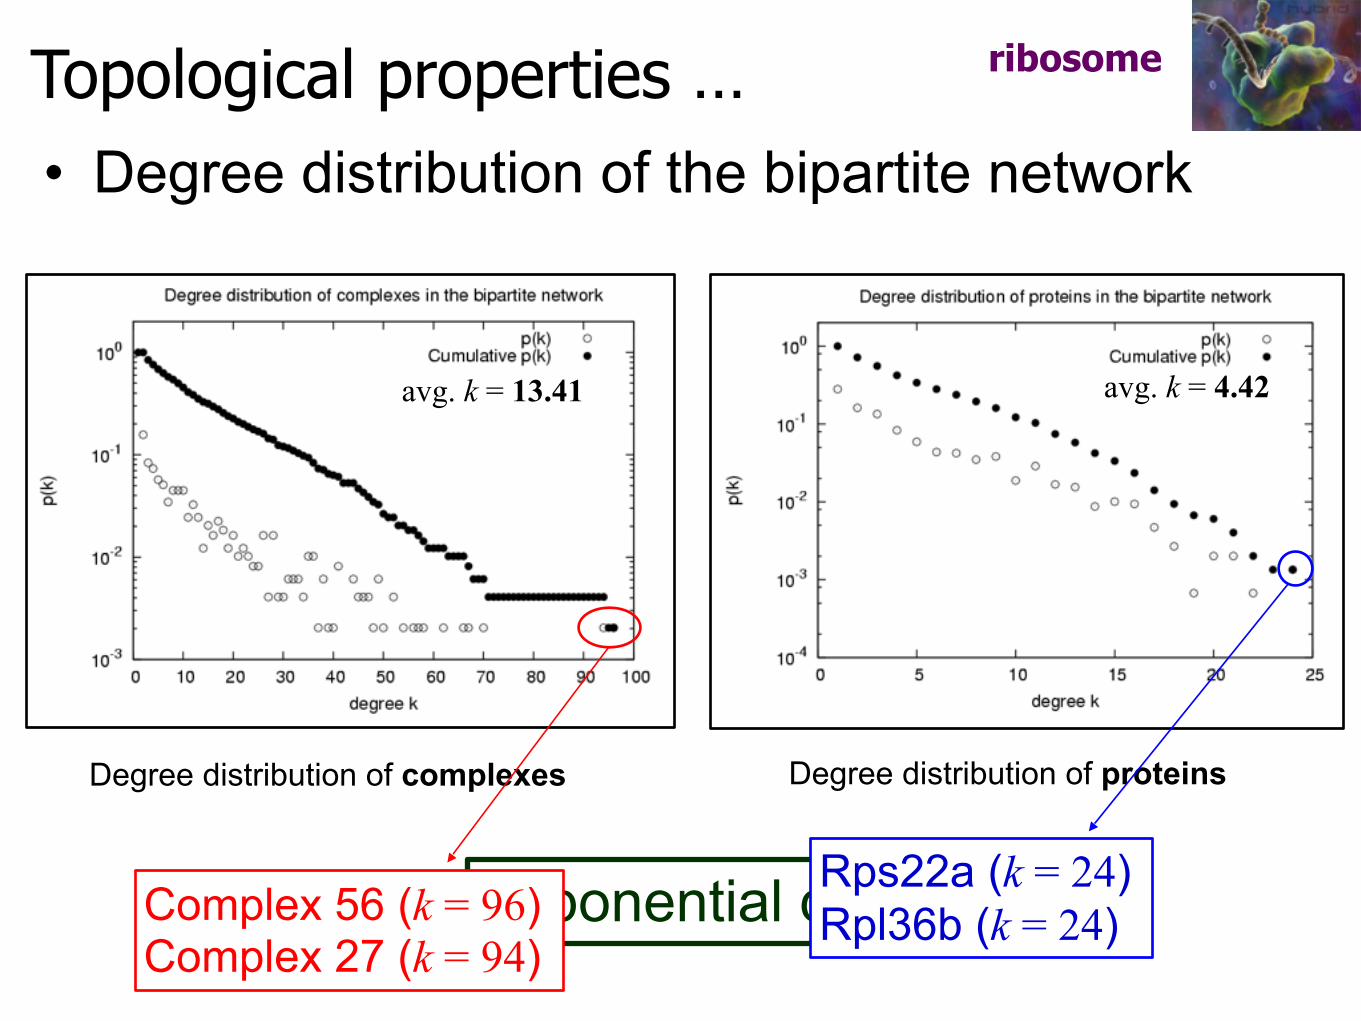
Topological properties …
Exponential distribution
• Degree distribution of the bipartite network
Degree distribution of complexes Degree distribution of proteins
Complex 56 (k = 96) Complex 27 (k = 94)
Rps22a (k = 24) Rpl36b (k = 24)
avg. k = 13.41 avg. k = 4.42
ribosome
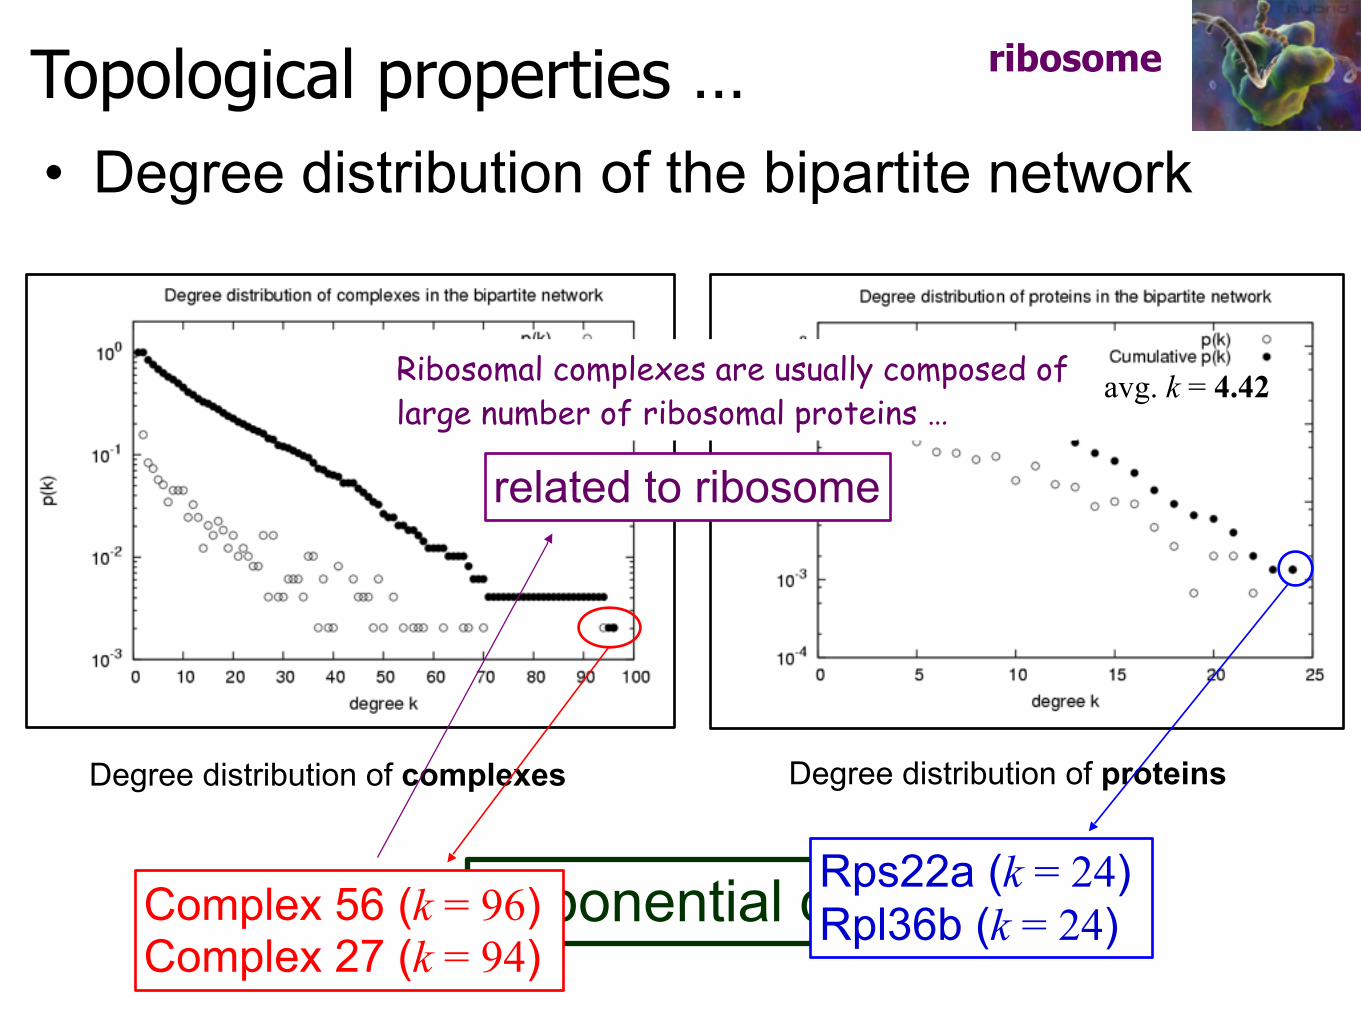
Topological properties …
Exponential distribution
• Degree distribution of the bipartite network
Degree distribution of complexes Degree distribution of proteins
Complex 56 (k = 96) Complex 27 (k = 94)
Rps22a (k = 24) Rpl36b (k = 24)
avg. k = 13.41 avg. k = 4.42
ribosome
related to ribosome
Ribosomal complexes are usually composed of large number of ribosomal proteins …
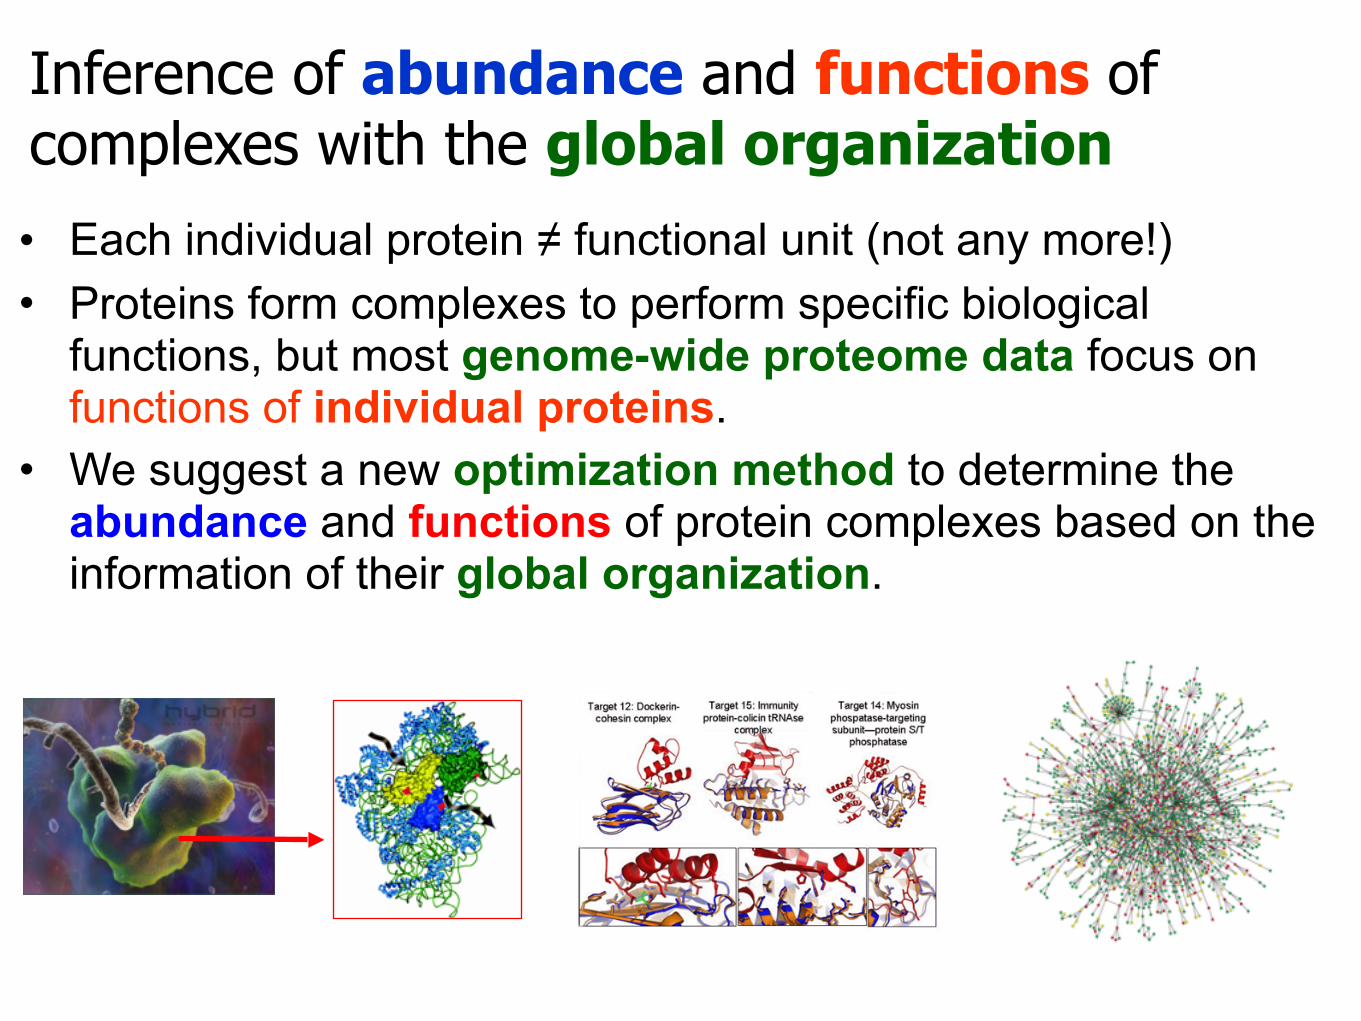
Inference of abundance and functions of complexes with the global organization• Each individual protein ≠ functional unit (not any more!) • Proteins form complexes to perform specific biological
functions, but most genome-wide proteome data focus on functions of individual proteins.
• We suggest a new optimization method to determine the abundance and functions of protein complexes based on the information of their global organization.

Inference of abundance of complexes
jiS
Mjjc
Niip
ij
j
i
complex in the protein ofnumber the:
), ... ,1( complex ofnumber copy the:
), ... ,1( protein ofnumber copy the:
=
=
∑=
=
M
j
jiji cSp1
In an ideal situation,
known constants unknown variables
However, N > M (the set of equations is “overdetermined”)→ The situation is not ideal!
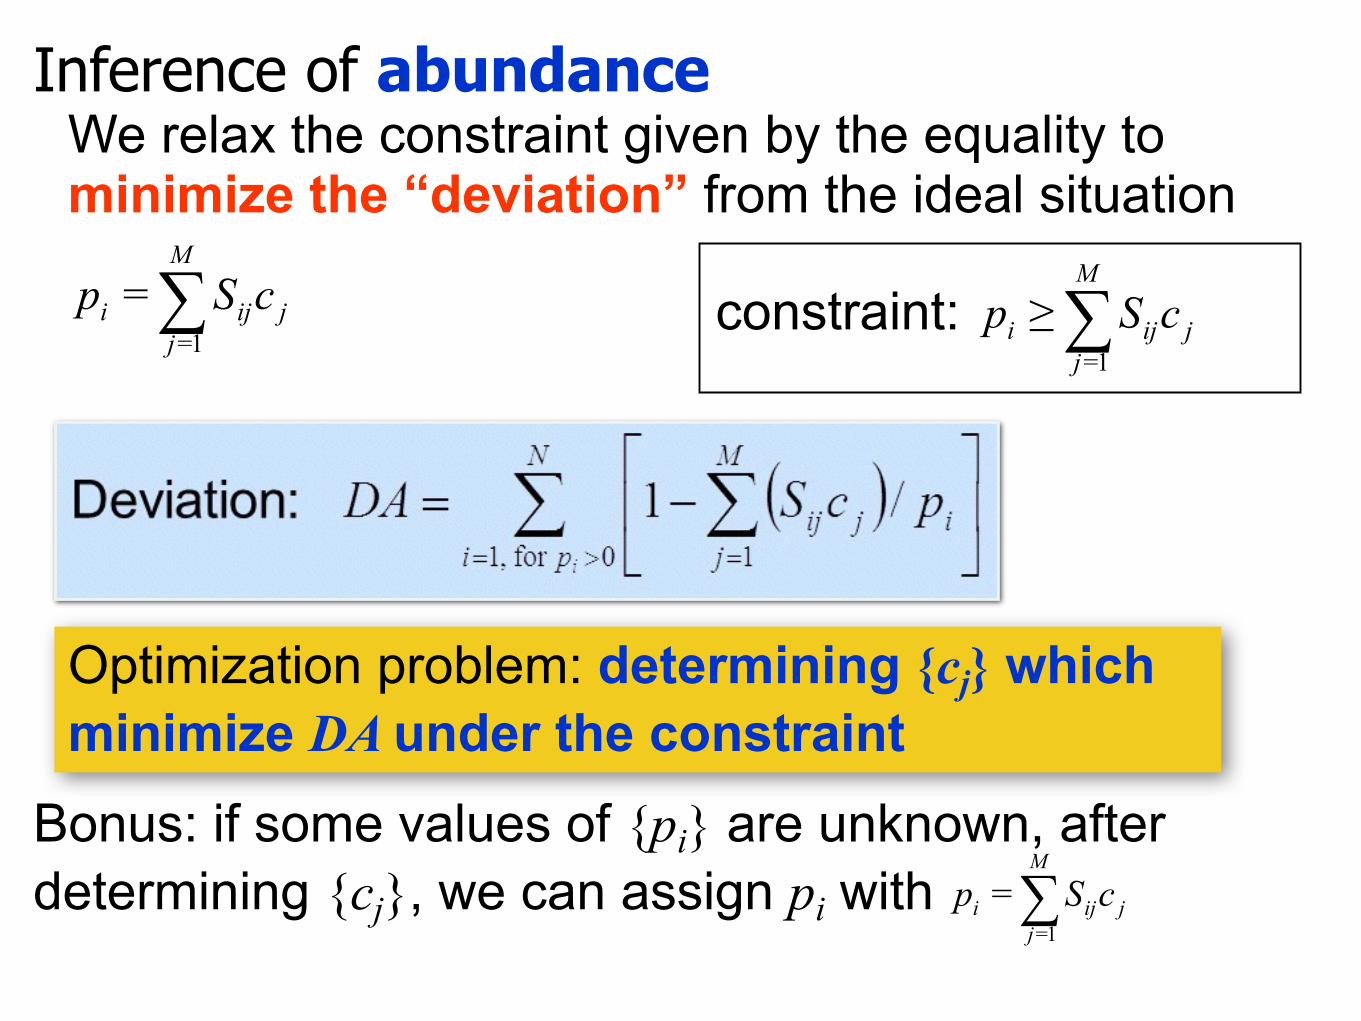
Inference of abundanceWe relax the constraint given by the equality to minimize the “deviation” from the ideal situation
∑=
=
M
j
jiji cSp1
Optimization problem: determining {cj} which minimize DA under the constraint
Bonus: if some values of {pi} are unknown, after determining {cj}, we can assign pi with ∑
=
=
M
j
jiji cSp1
(1) 1
∑=
≥M
j
jiji cSpconstraint:
Inference of functions
)0 if 0 ,0 if 1 :(cf
)(otherwise 0 ),complex ofcomponent a is protein (if 1
)(otherwise 0 ,)function has complex (if 1)(otherwise 0 ,)function has protein (if 1
==>=
=
=
=
ijijijij
ij
jk
ik
SUSUjiU
kjFckiFp
(2) 1∑=
≤M
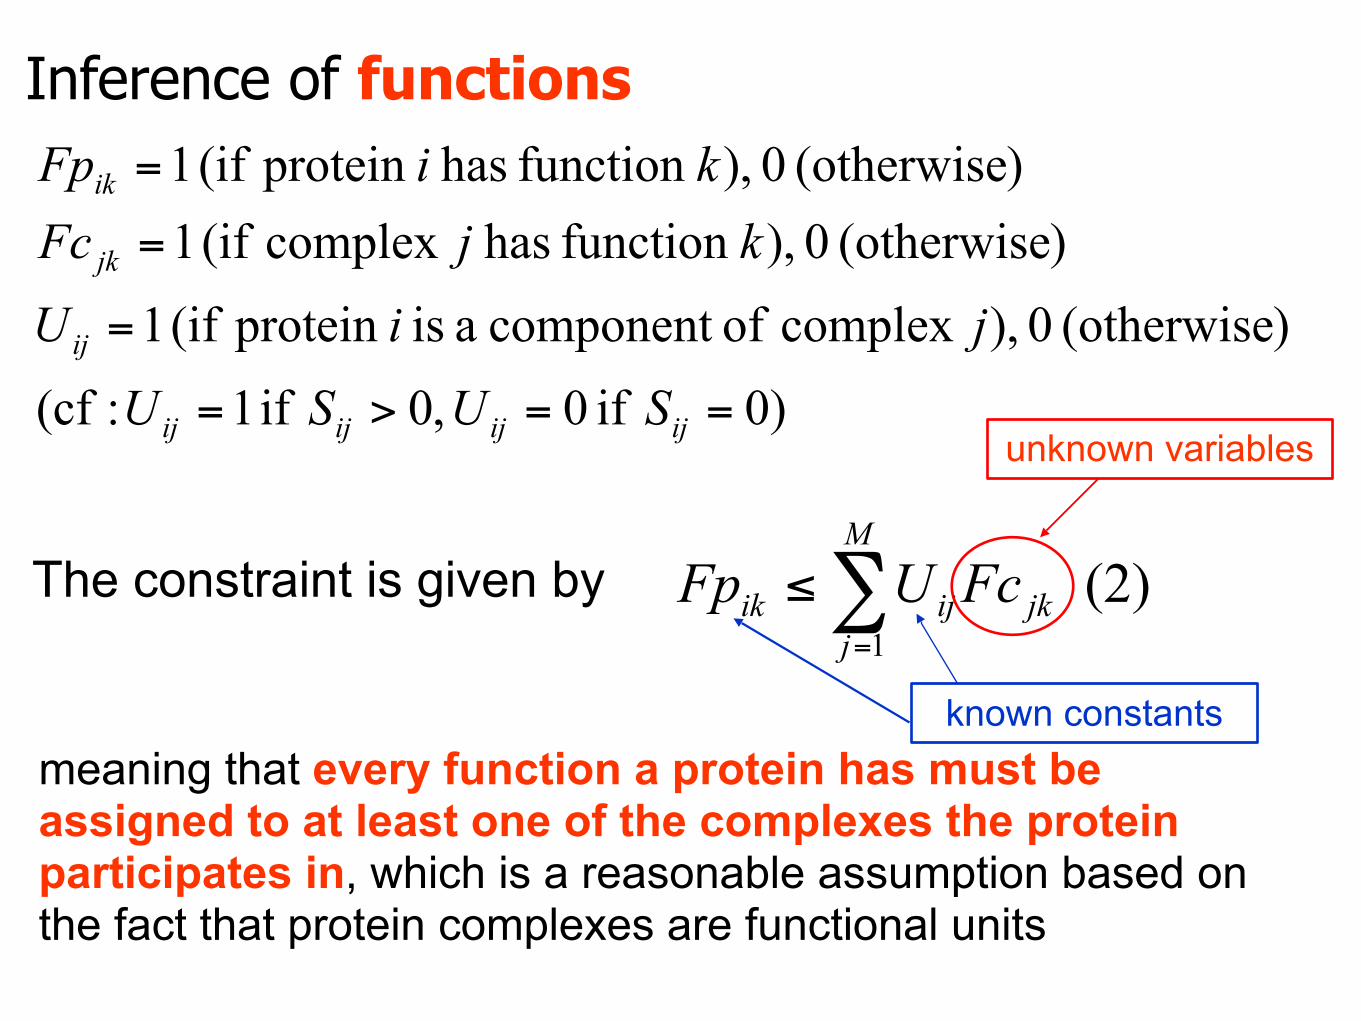
jjkijik FcUFpThe constraint is given by
meaning that every function a protein has must be assigned to at least one of the complexes the protein participates in, which is a reasonable assumption based on the fact that protein complexes are functional units
known constants
unknown variables
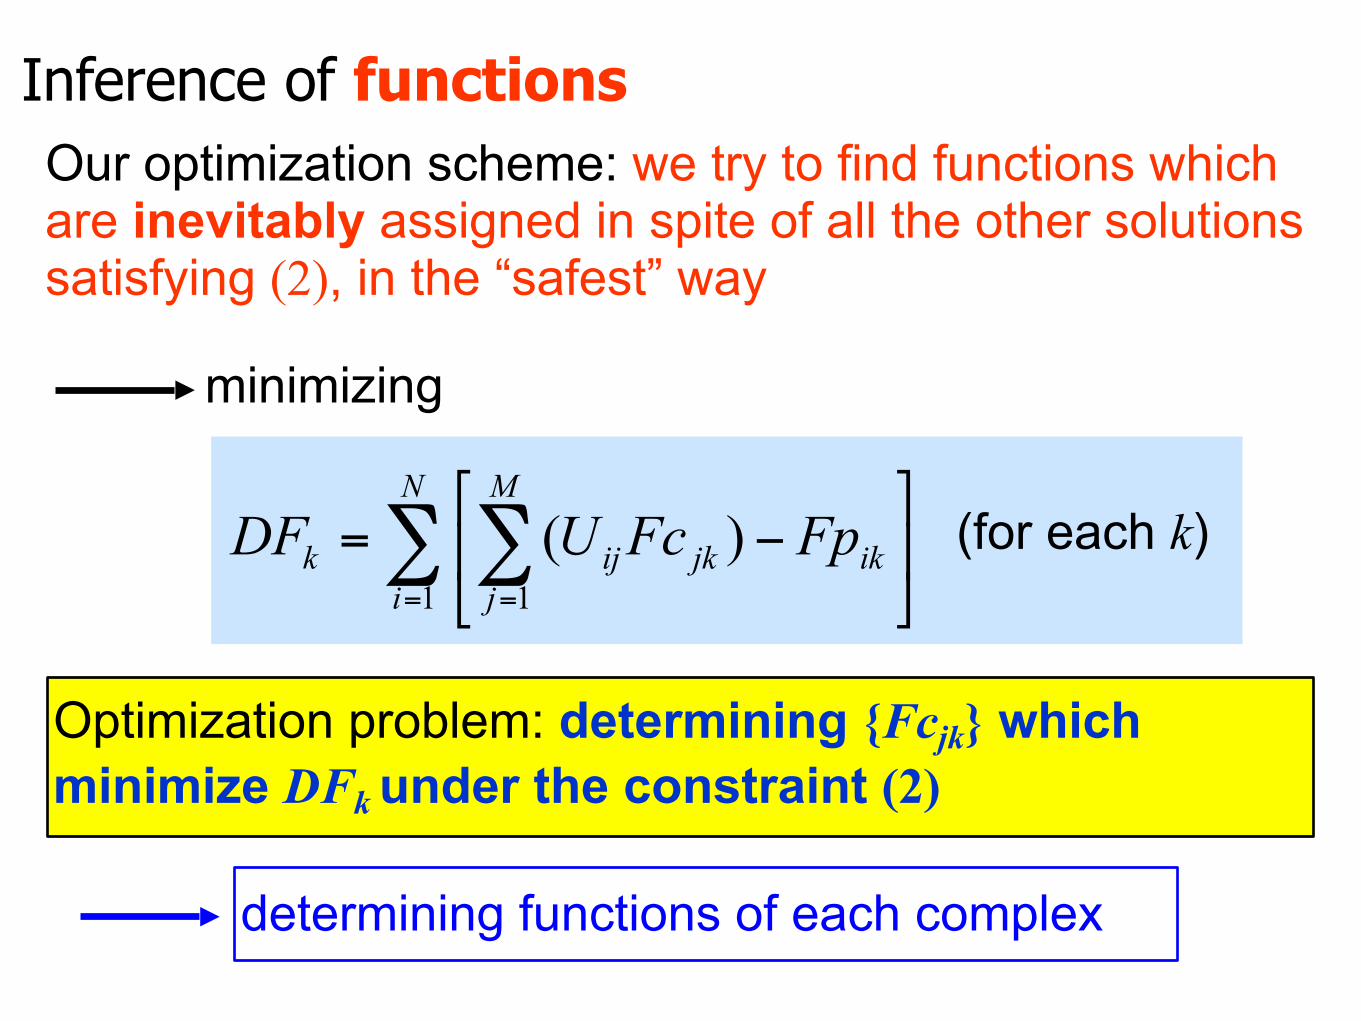
Inference of functionsOur optimization scheme: we try to find functions which are inevitably assigned in spite of all the other solutions satisfying (2), in the “safest” way
minimizing
Optimization problem: determining {Fcjk} which minimize DFk under the constraint (2)
determining functions of each complex
(for each k)∑ ∑= =
⎥⎦
⎤⎢⎣
⎡−=
N
i
M
jikjkijk FpFcUDF
1 1)(
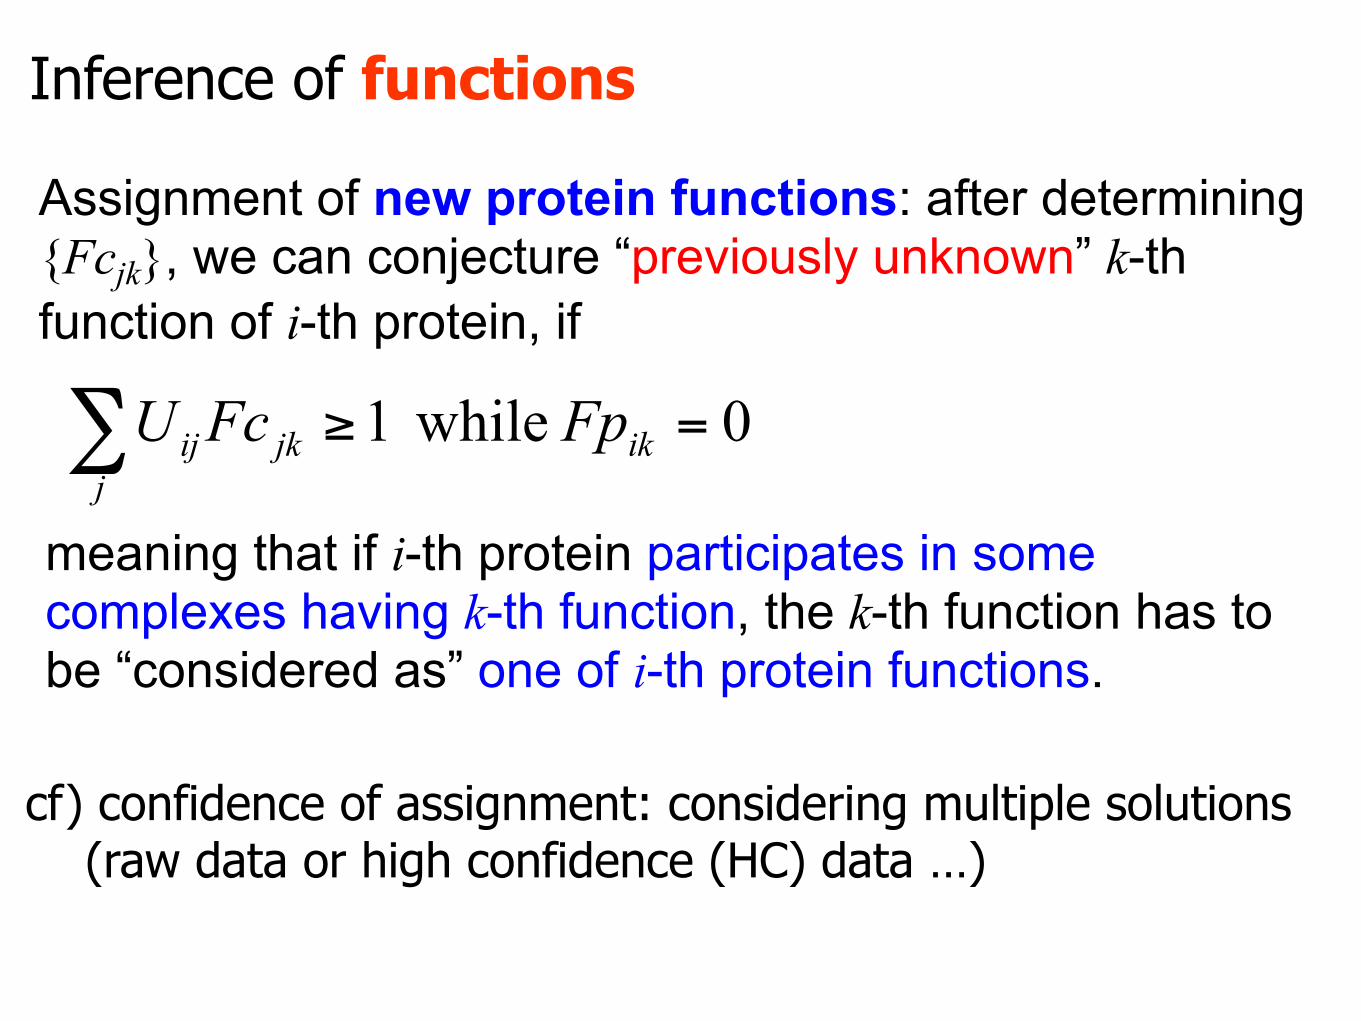
Assignment of new protein functions: after determining {Fcjk}, we can conjecture “previously unknown” k-th function of i-th protein, if
0 while1 =≥∑ ikj
jkij FpFcU
meaning that if i-th protein participates in some complexes having k-th function, the k-th function has to be “considered as” one of i-th protein functions.
cf) confidence of assignment: considering multiple solutions (raw data or high confidence (HC) data …)
Inference of functions
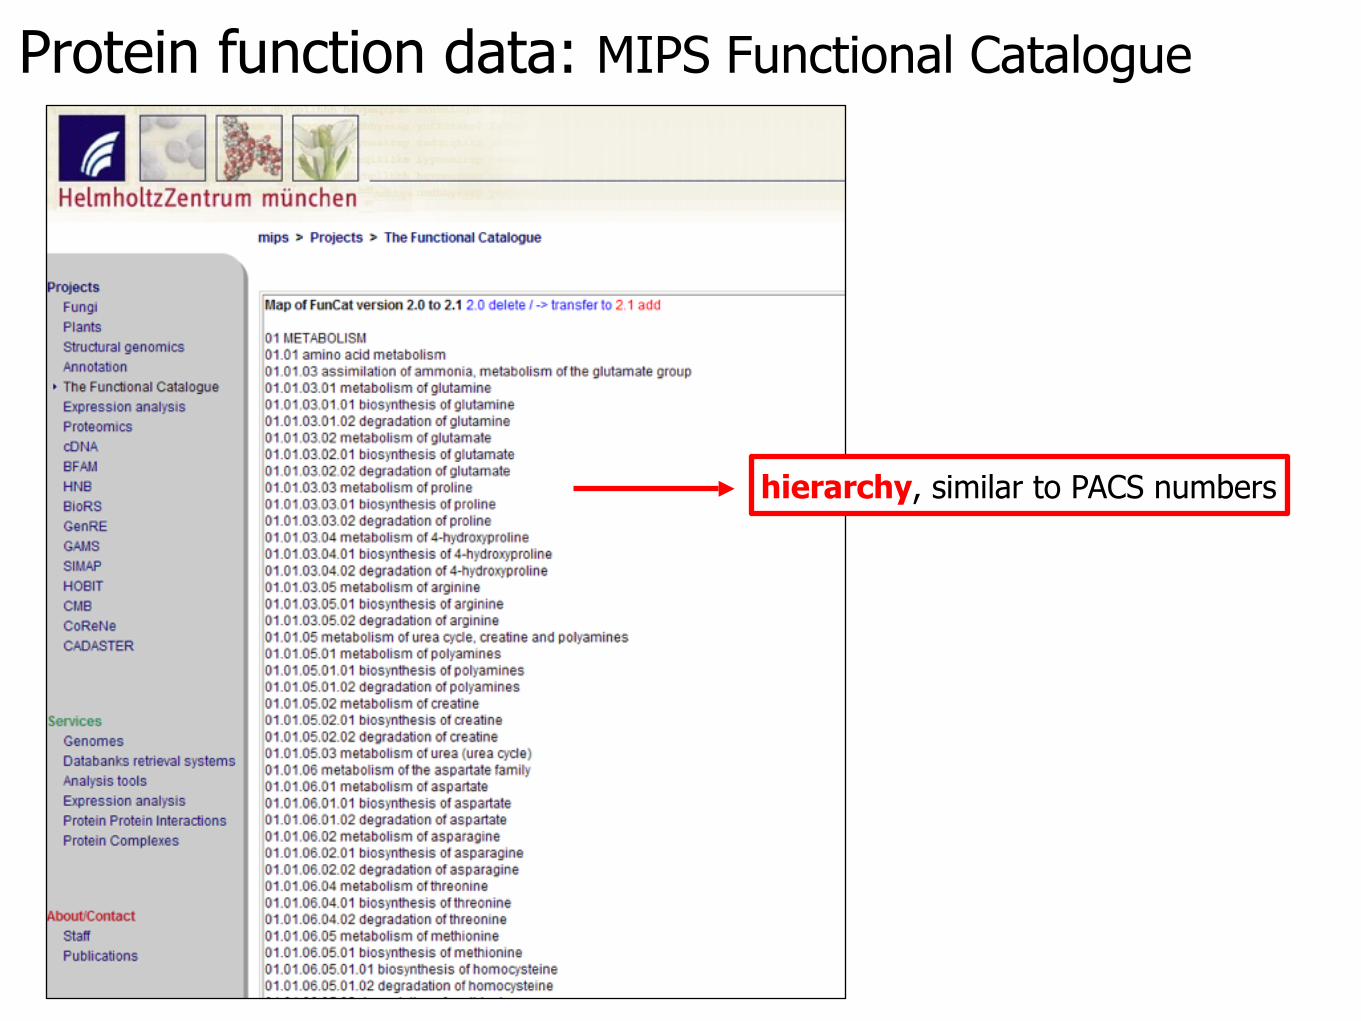
Protein function data: MIPS Functional Catalogue
hierarchy, similar to PACS numbers
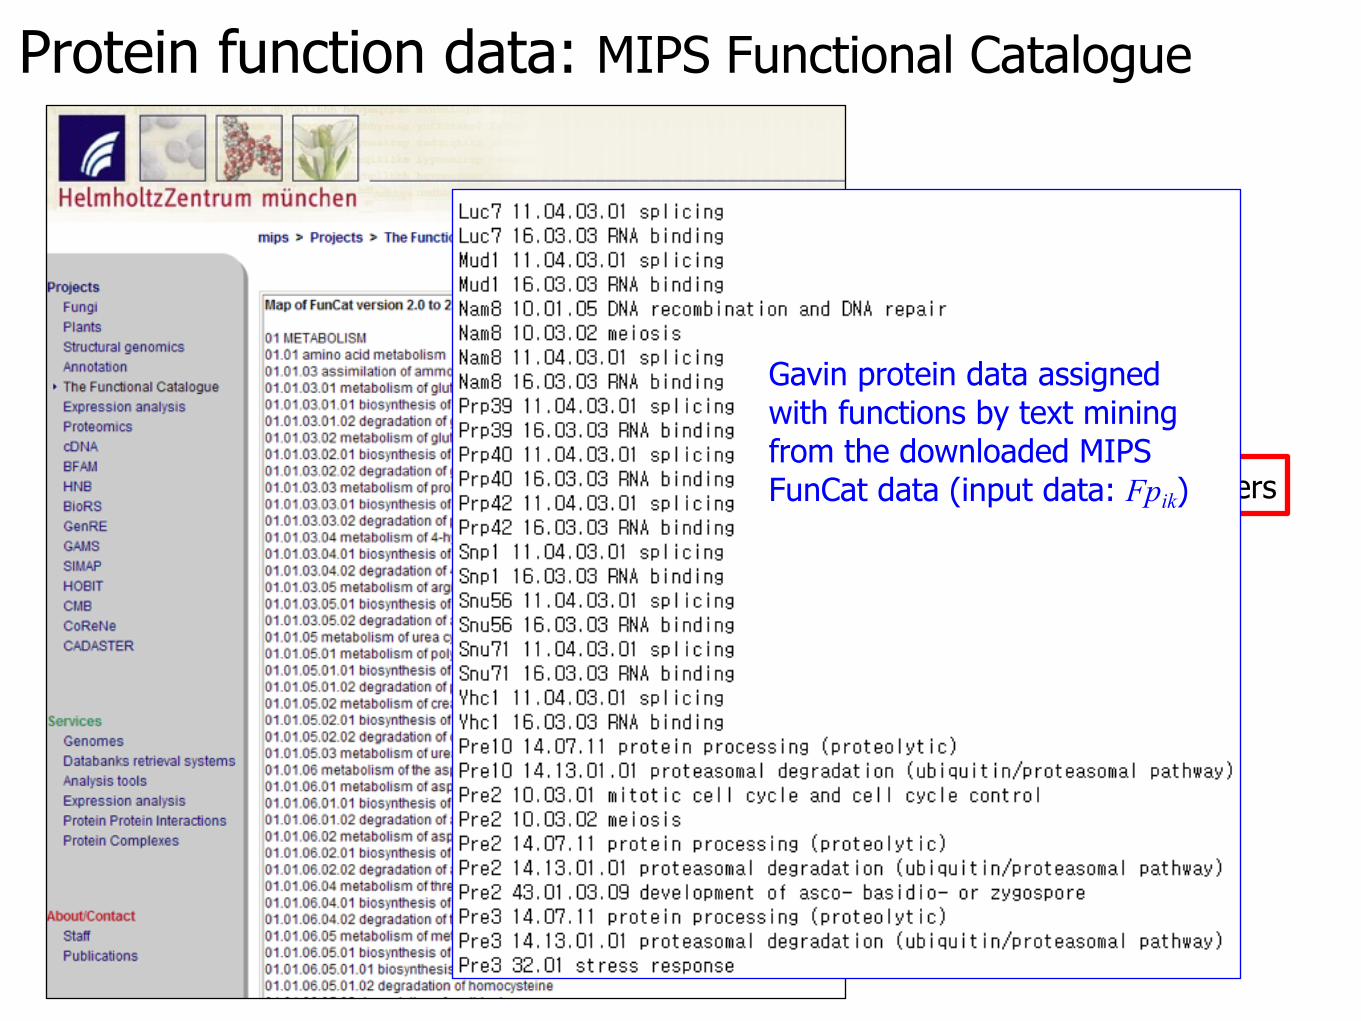
Protein function data: MIPS Functional Catalogue
hierarchy, similar to PACS numbers
Gavin protein data assigned with functions by text mining from the downloaded MIPS FunCat data (input data: Fpik)
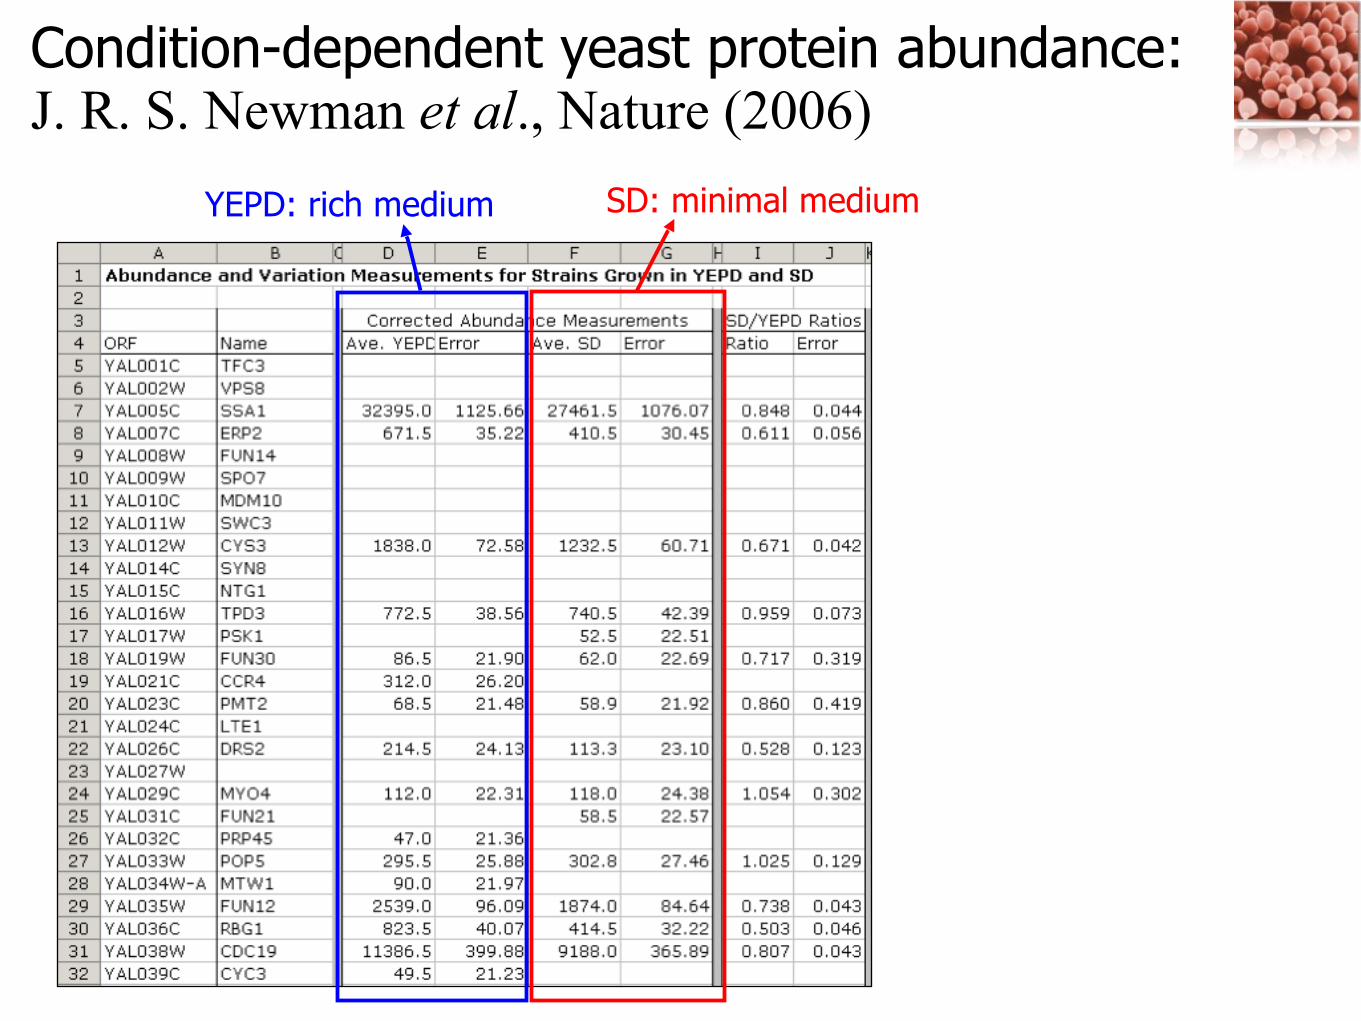
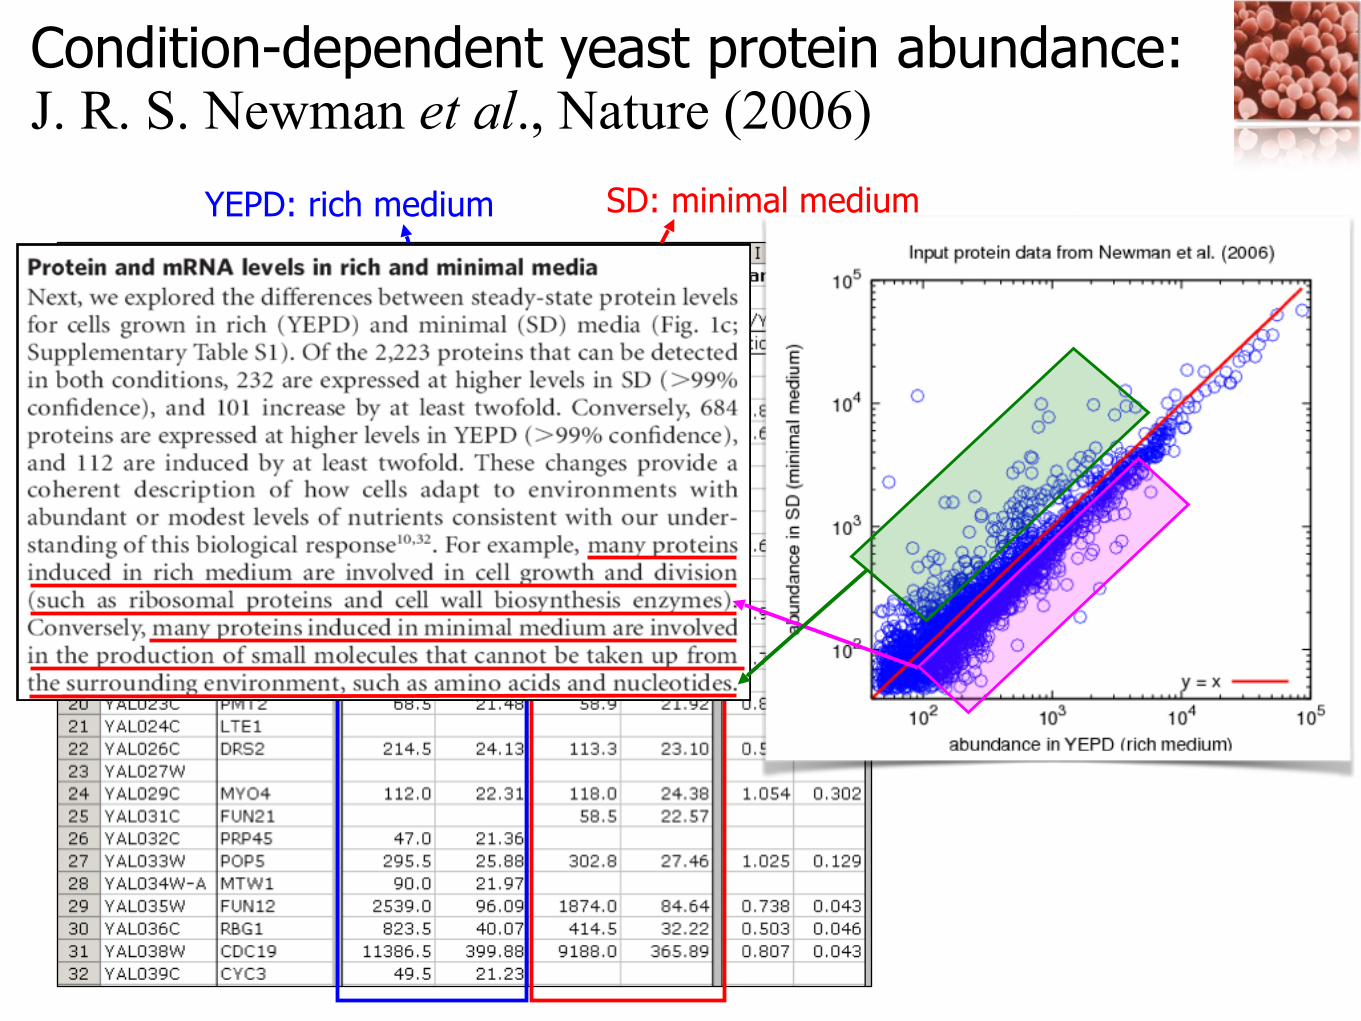
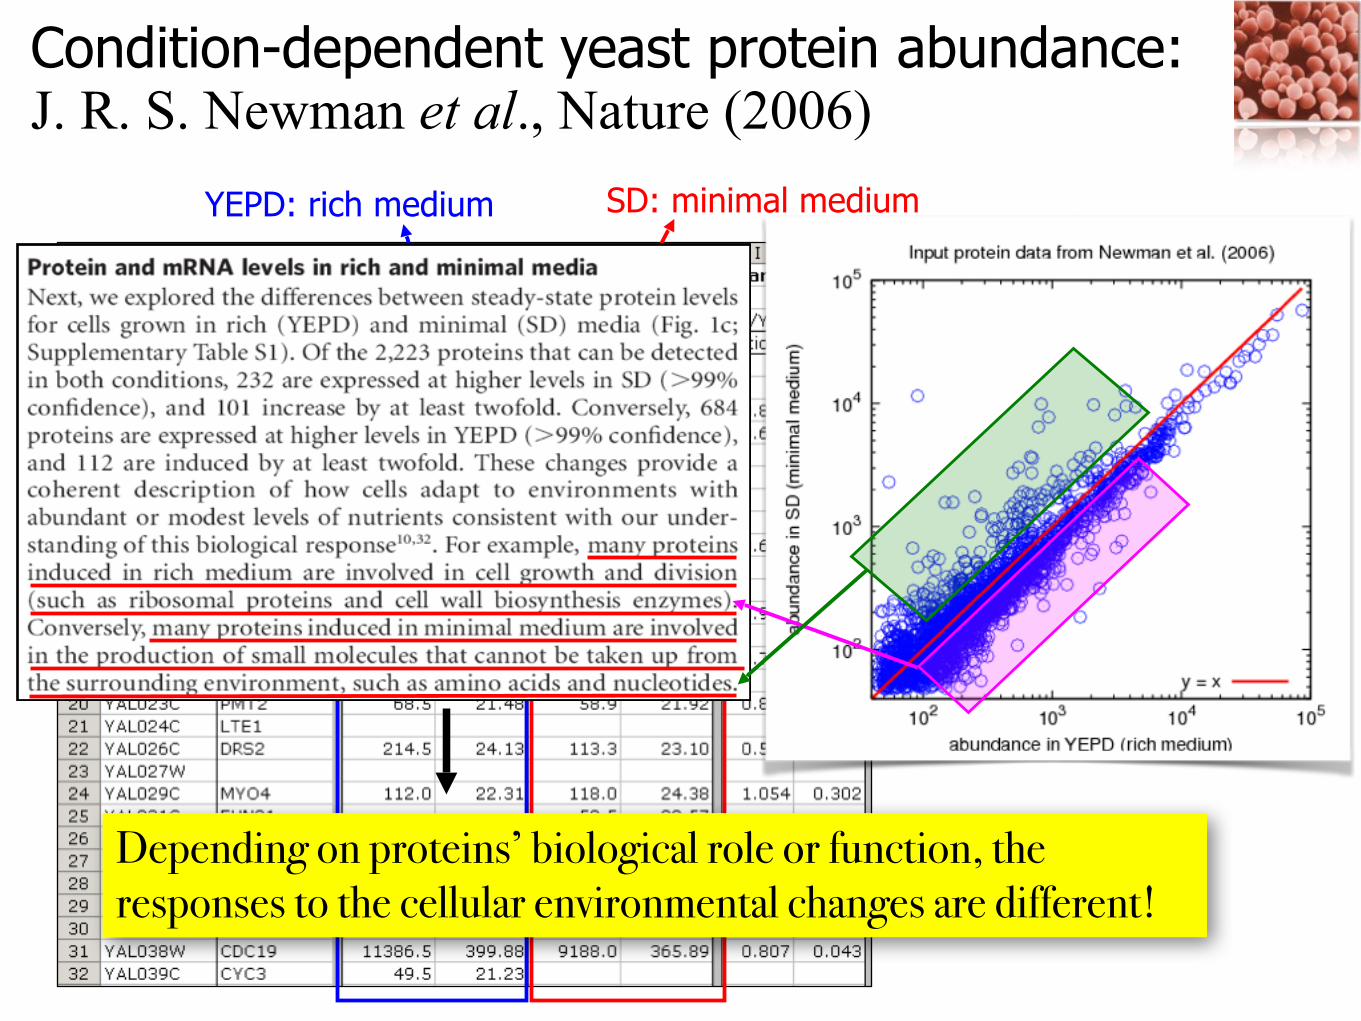
Condition-dependent yeast protein abundance: J. R. S. Newman et al., Nature (2006)
YEPD: rich medium SD: minimal medium
Condition-dependent yeast protein abundance: J. R. S. Newman et al., Nature (2006)
YEPD: rich medium SD: minimal medium
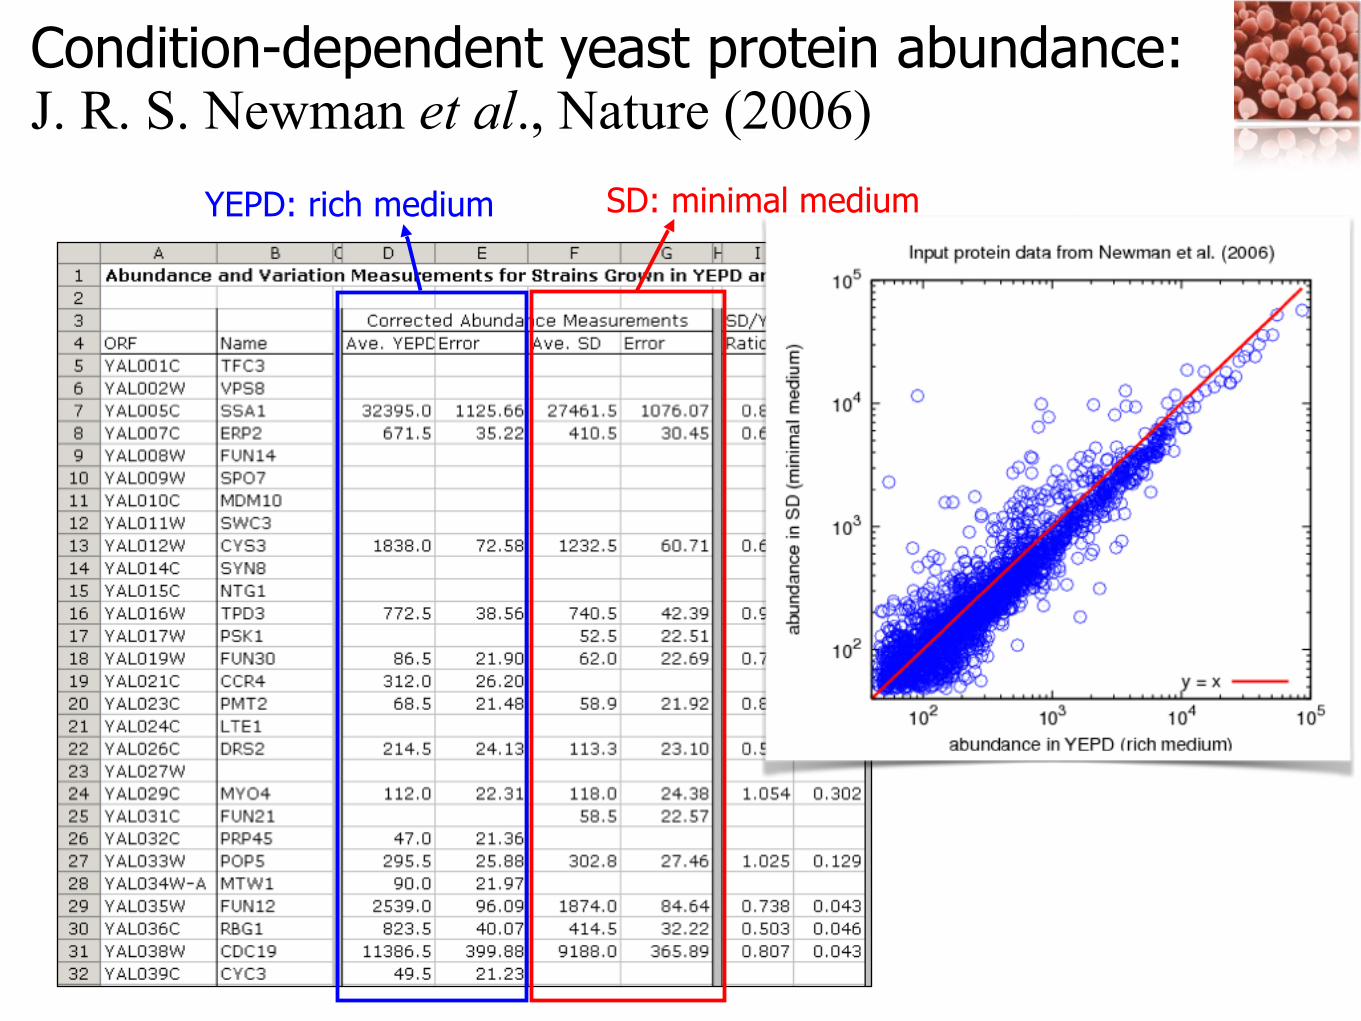
Condition-dependent yeast protein abundance: J. R. S. Newman et al., Nature (2006)
YEPD: rich medium SD: minimal medium
Condition-dependent yeast protein abundance: J. R. S. Newman et al., Nature (2006)
YEPD: rich medium SD: minimal medium
Depending on proteins’ biological role or function, the responses to the cellular environmental changes are different!
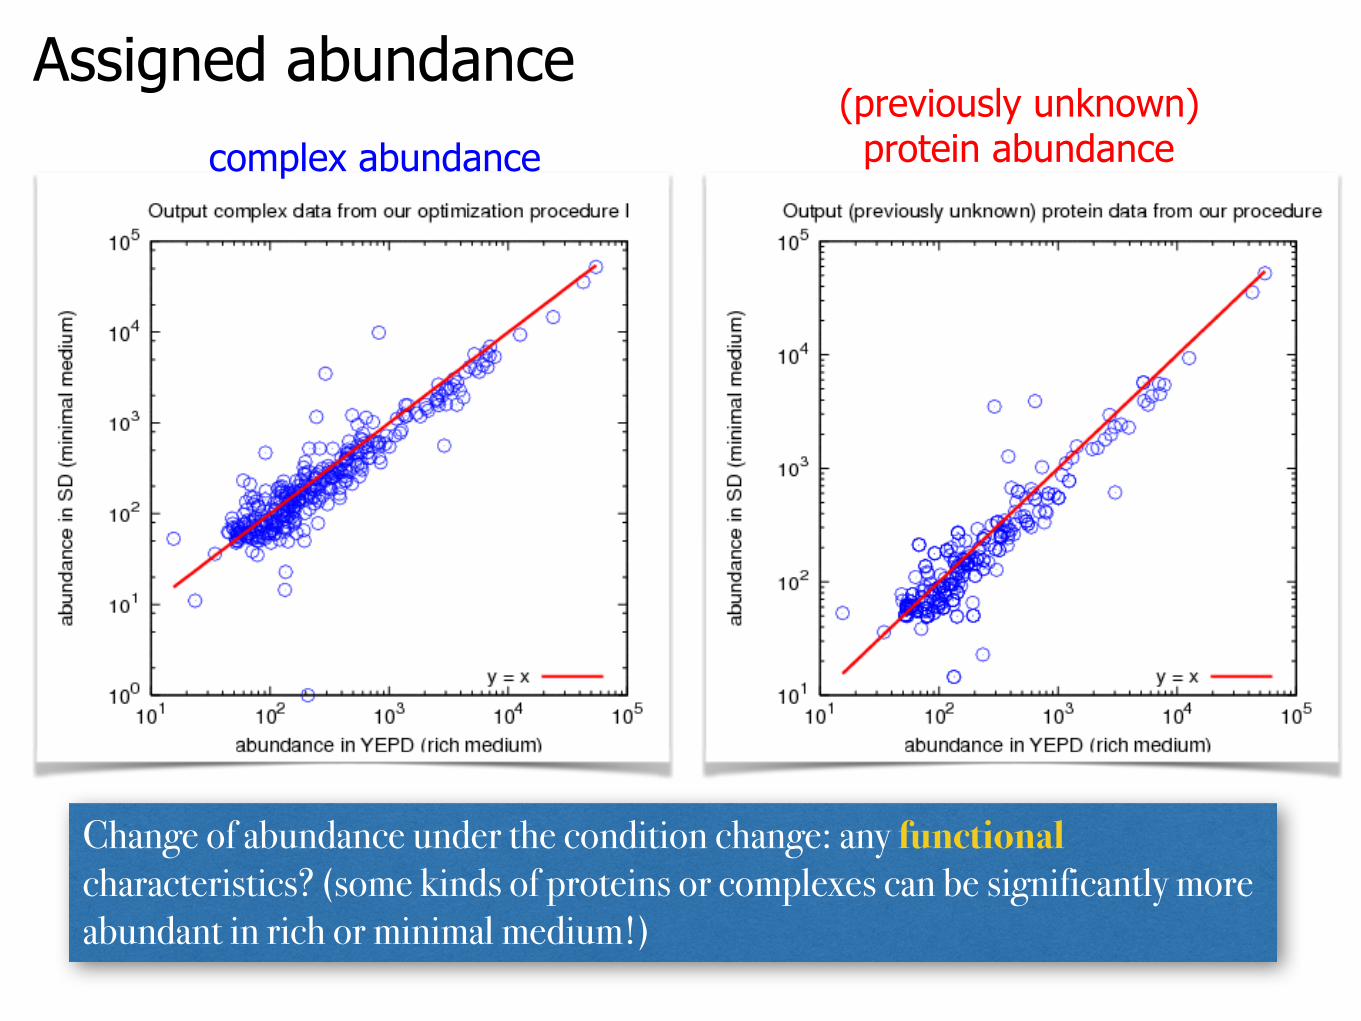
Assigned abundancecomplex abundance
(previously unknown) protein abundance
Change of abundance under the condition change: any functional characteristics? (some kinds of proteins or complexes can be significantly more abundant in rich or minimal medium!)
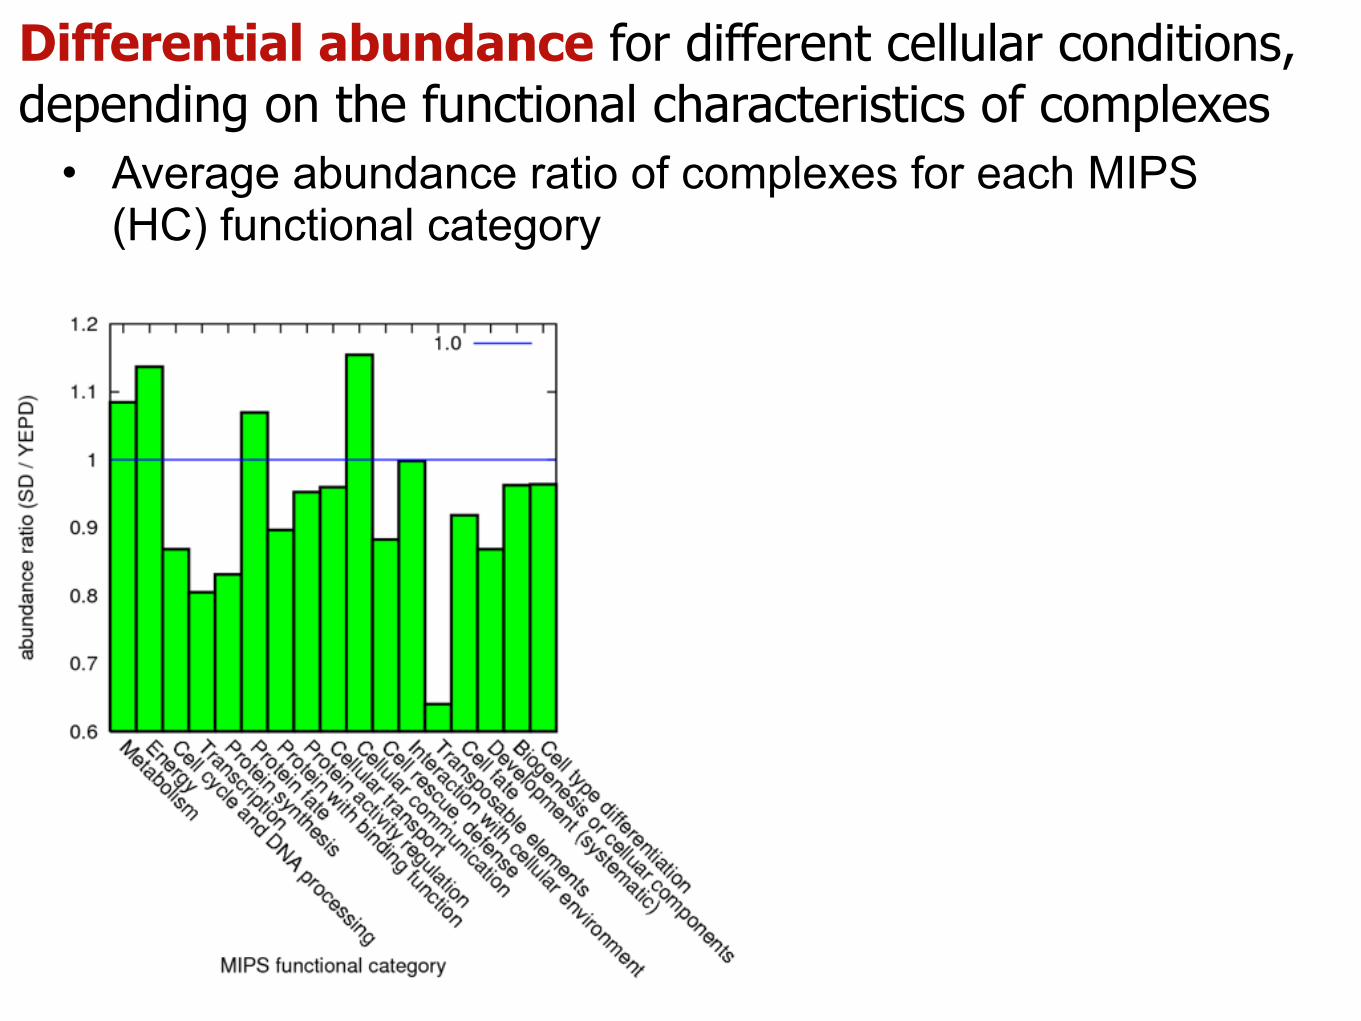
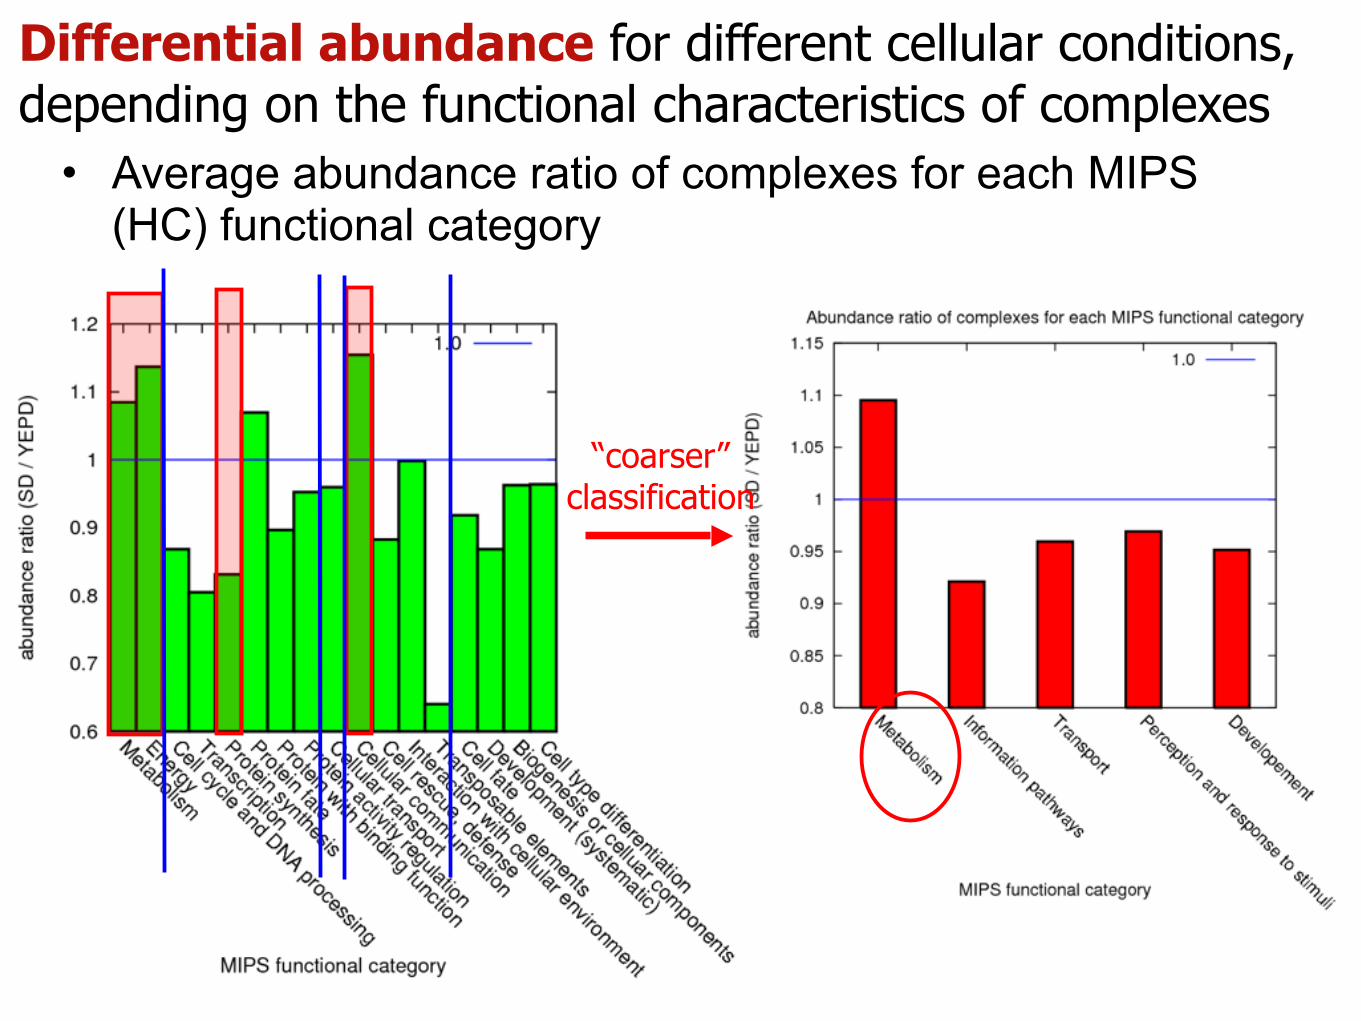
Differential abundance for different cellular conditions, depending on the functional characteristics of complexes
• Average abundance ratio of complexes for each MIPS (HC) functional category

Differential abundance for different cellular conditions, depending on the functional characteristics of complexes
• Average abundance ratio of complexes for each MIPS (HC) functional category
Differential abundance for different cellular conditions, depending on the functional characteristics of complexes
• Average abundance ratio of complexes for each MIPS (HC) functional category
“coarser” classification
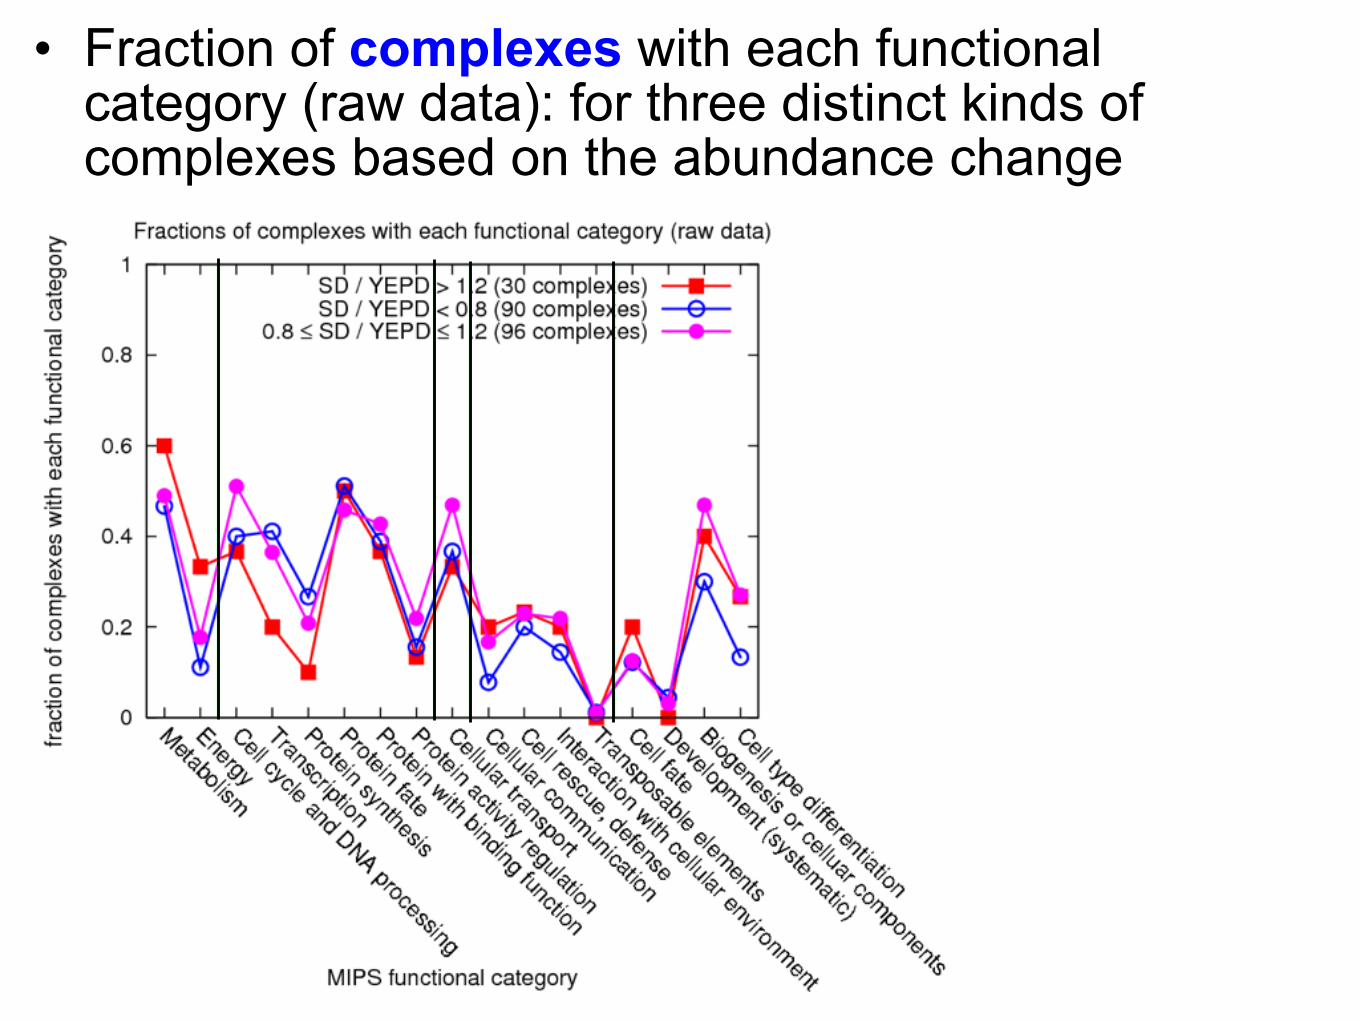
• Fraction of complexes with each functional category (raw data): for three distinct kinds of complexes based on the abundance change
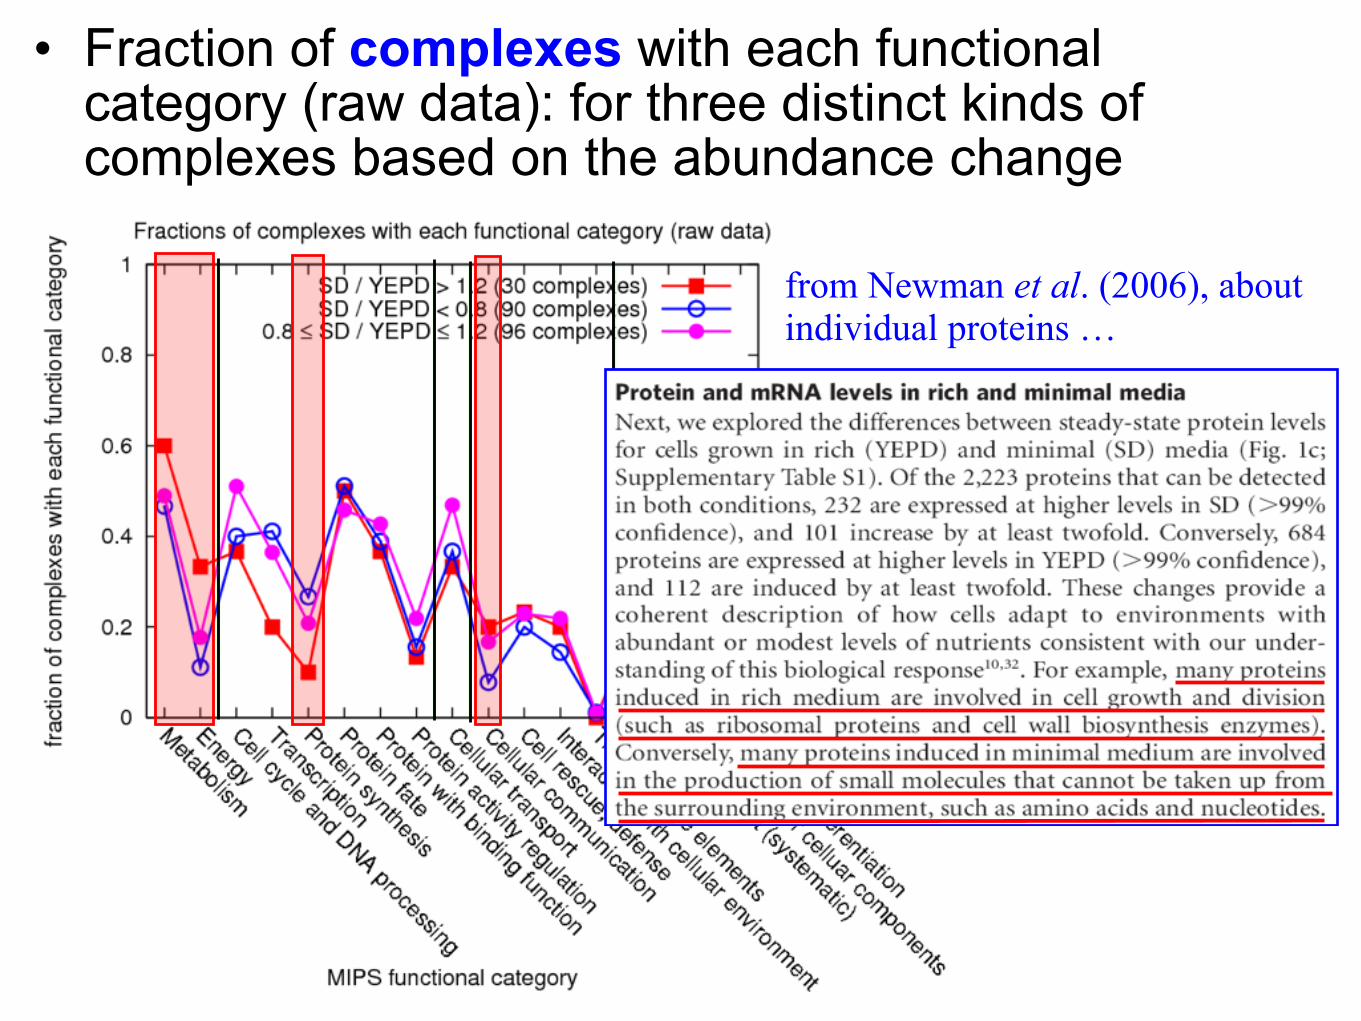
• Fraction of complexes with each functional category (raw data): for three distinct kinds of complexes based on the abundance change
from Newman et al. (2006), aboutindividual proteins …
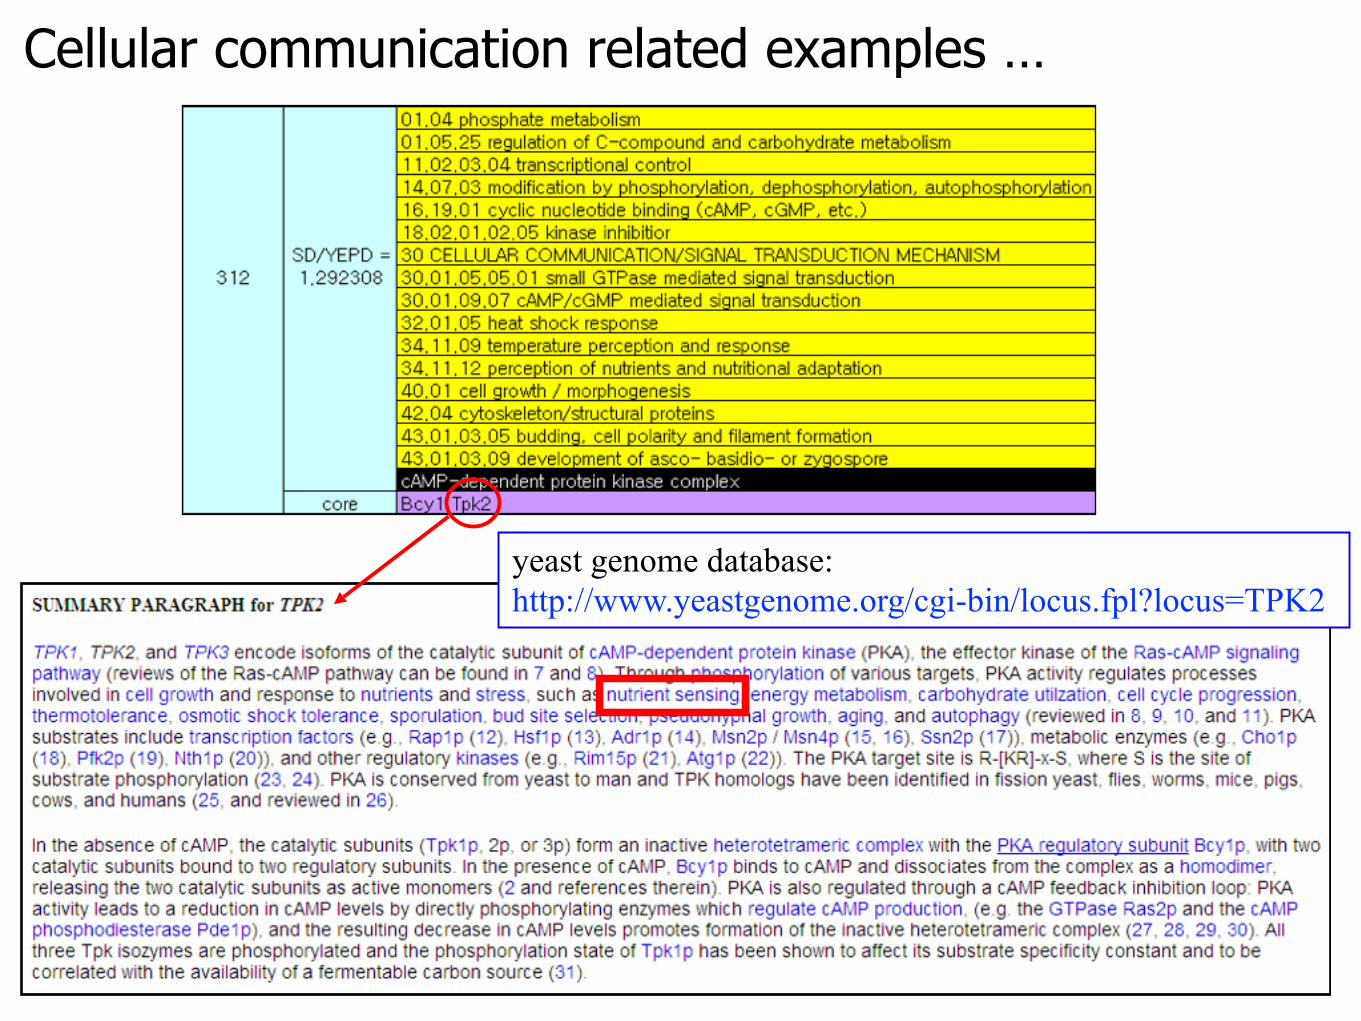
yeast genome database: http://www.yeastgenome.org/cgi-bin/locus.fpl?locus=TPK2
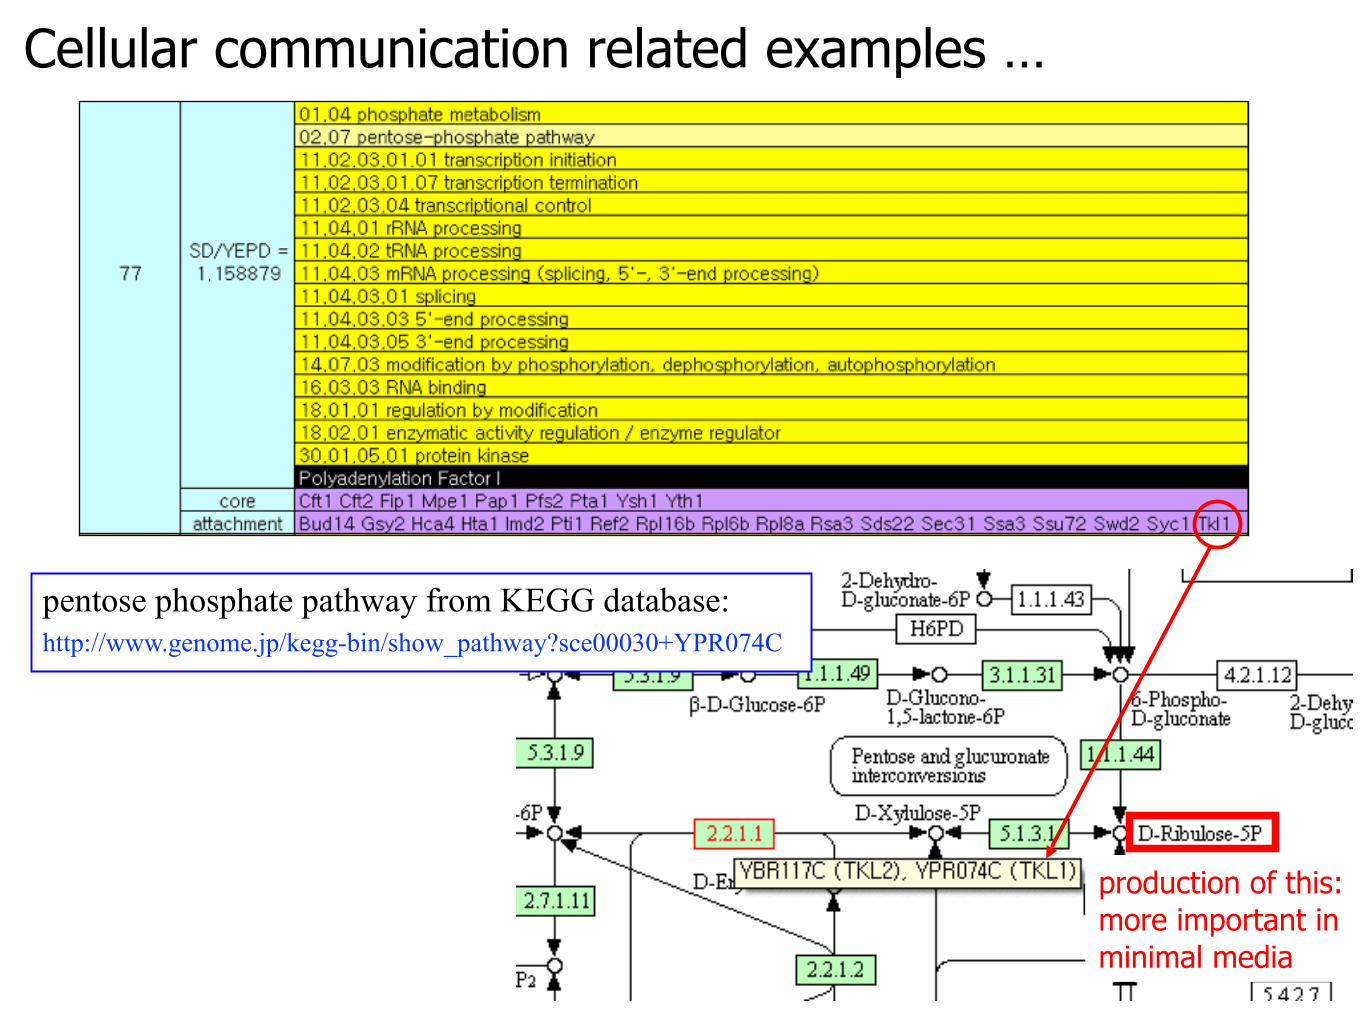
Cellular communication related examples …
Cellular communication related examples …
pentose phosphate pathway from KEGG database: http://www.genome.jp/kegg-bin/show_pathway?sce00030+YPR074C
production of this:more important in minimal media
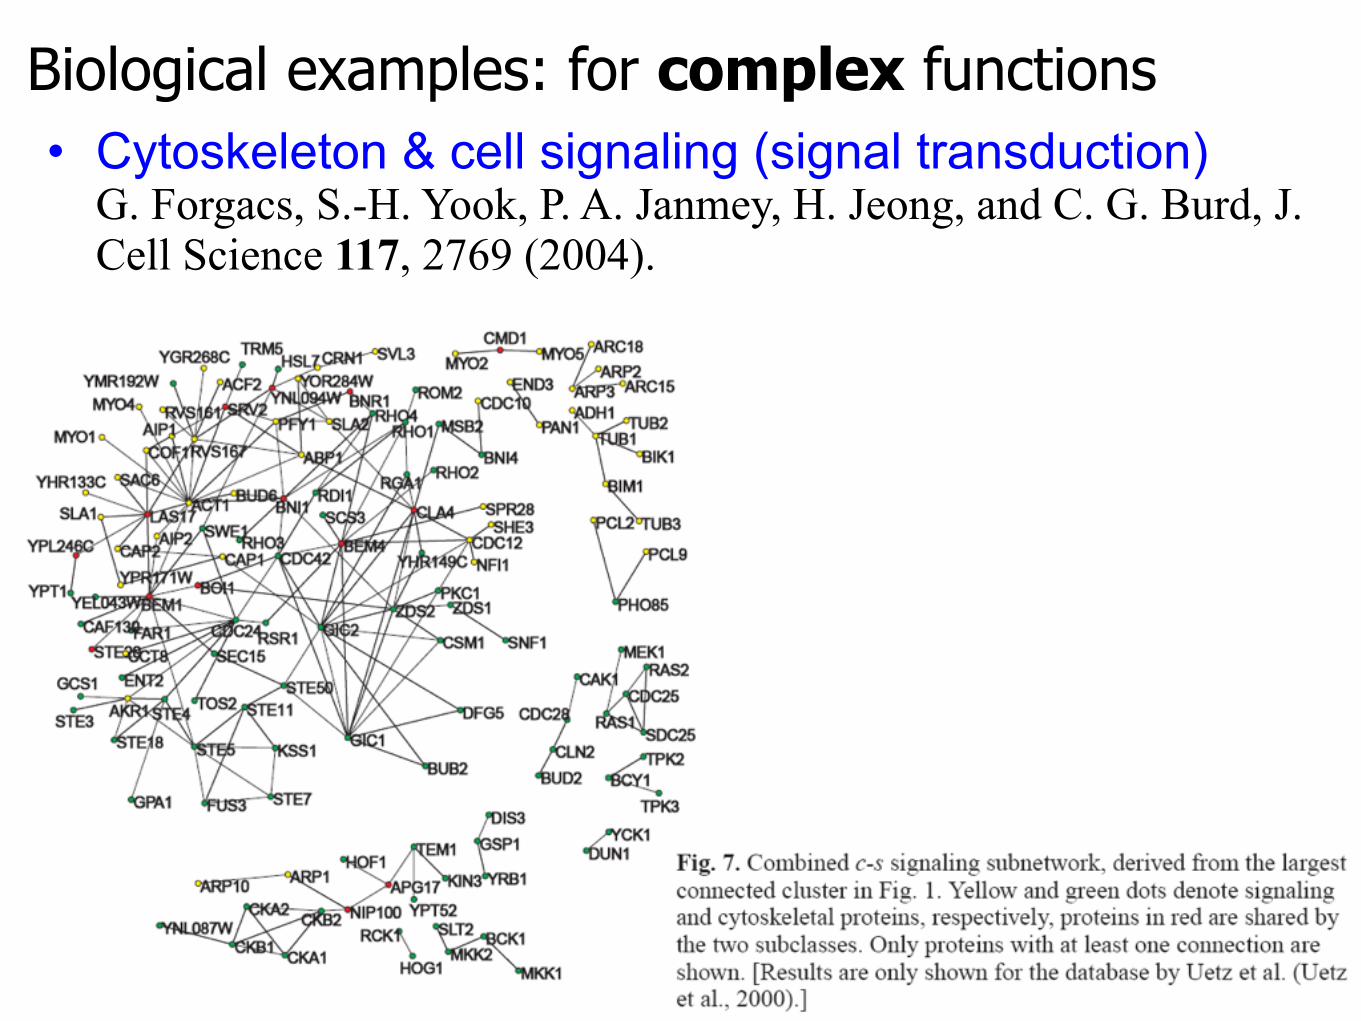
Biological examples: for complex functions• Cytoskeleton & cell signaling (signal transduction)
G. Forgacs, S.-H. Yook, P. A. Janmey, H. Jeong, and C. G. Burd, J. Cell Science 117, 2769 (2004).
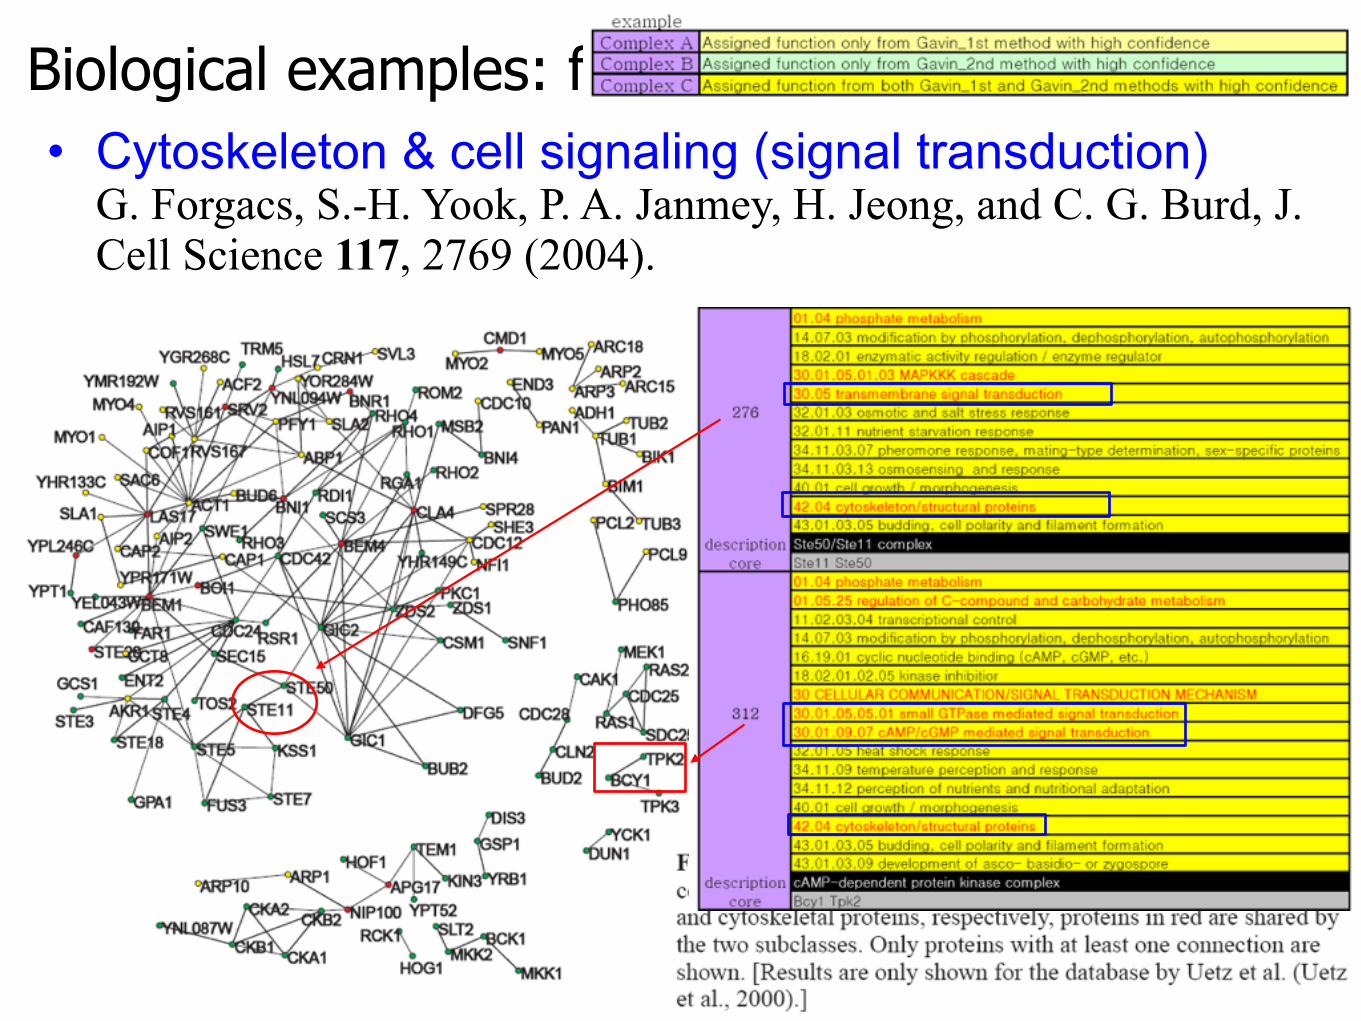
Biological examples: for complex functions• Cytoskeleton & cell signaling (signal transduction)
G. Forgacs, S.-H. Yook, P. A. Janmey, H. Jeong, and C. G. Burd, J. Cell Science 117, 2769 (2004).
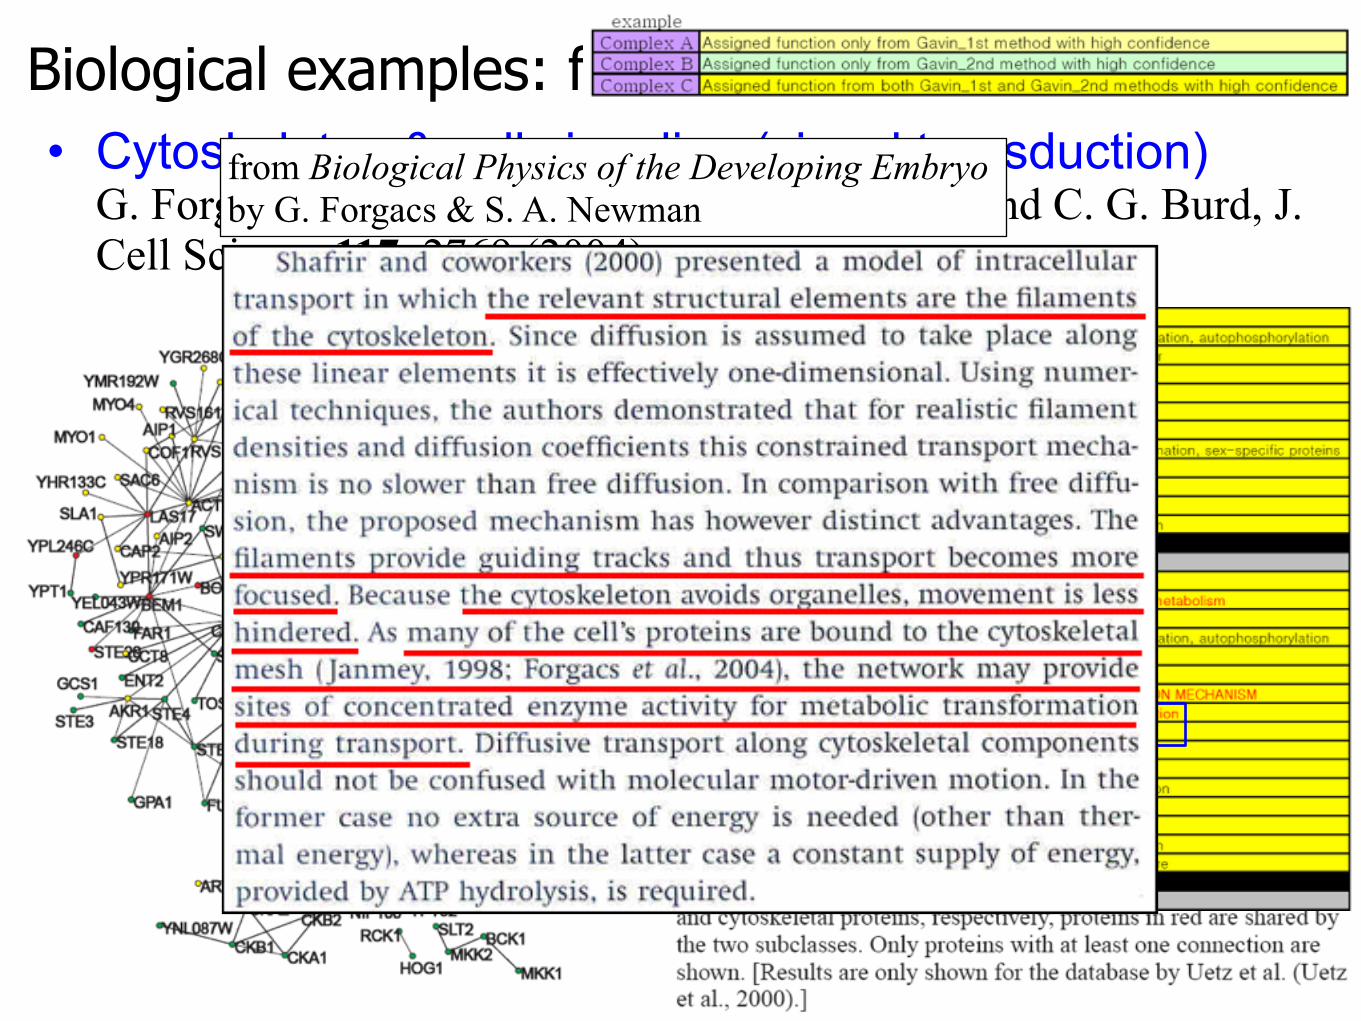
Biological examples: for complex functions• Cytoskeleton & cell signaling (signal transduction)
G. Forgacs, S.-H. Yook, P. A. Janmey, H. Jeong, and C. G. Burd, J. Cell Science 117, 2769 (2004).
from Biological Physics of the Developing Embryo by G. Forgacs & S. A. Newman
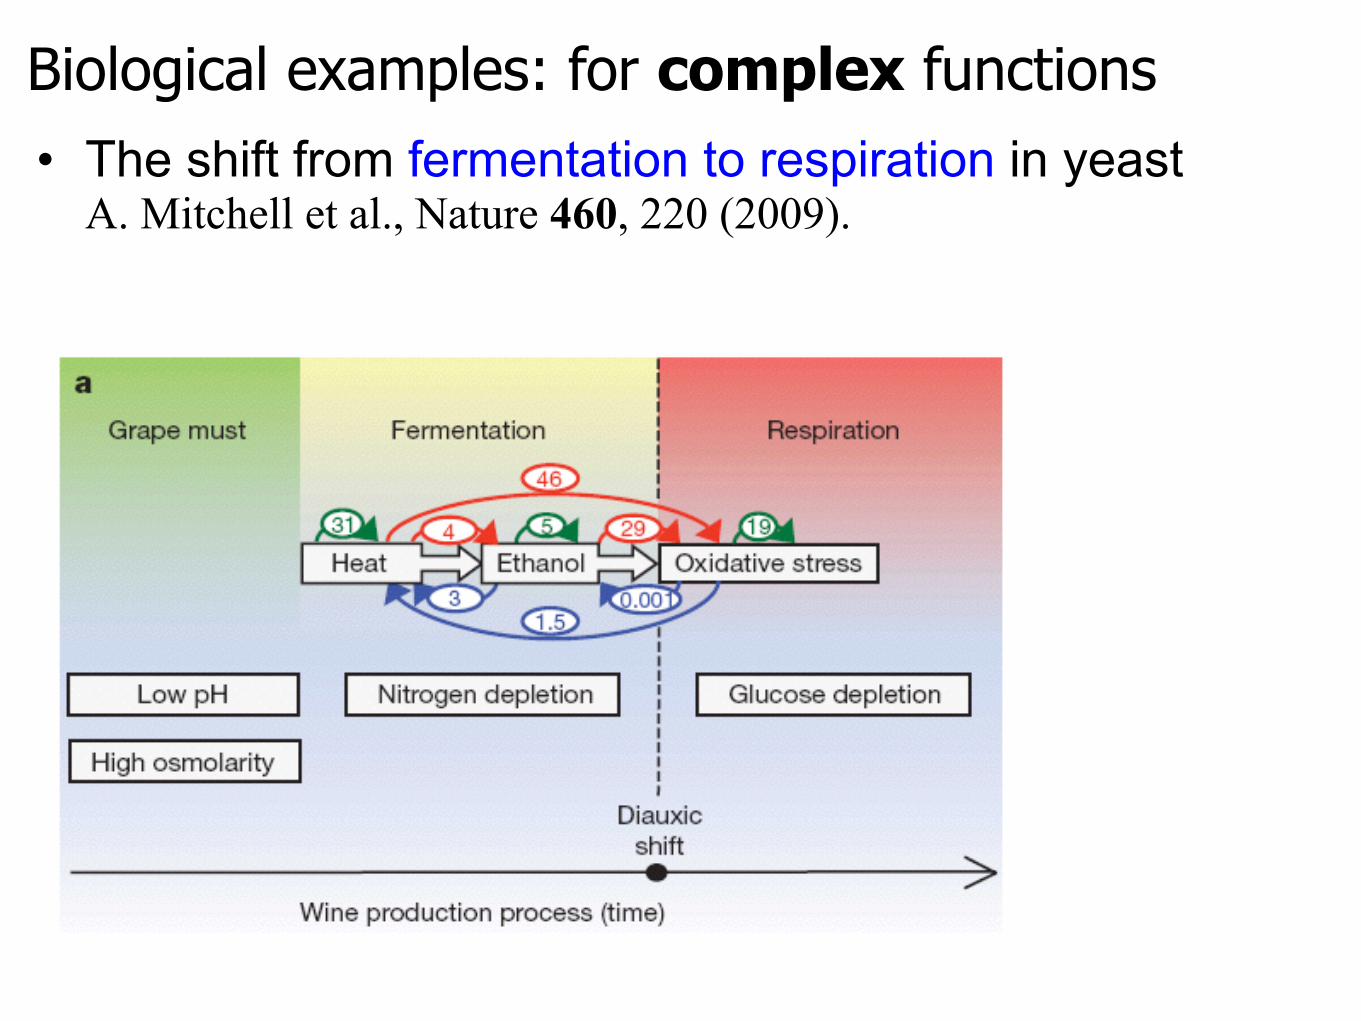
• The shift from fermentation to respiration in yeastA. Mitchell et al., Nature 460, 220 (2009).
Biological examples: for complex functions
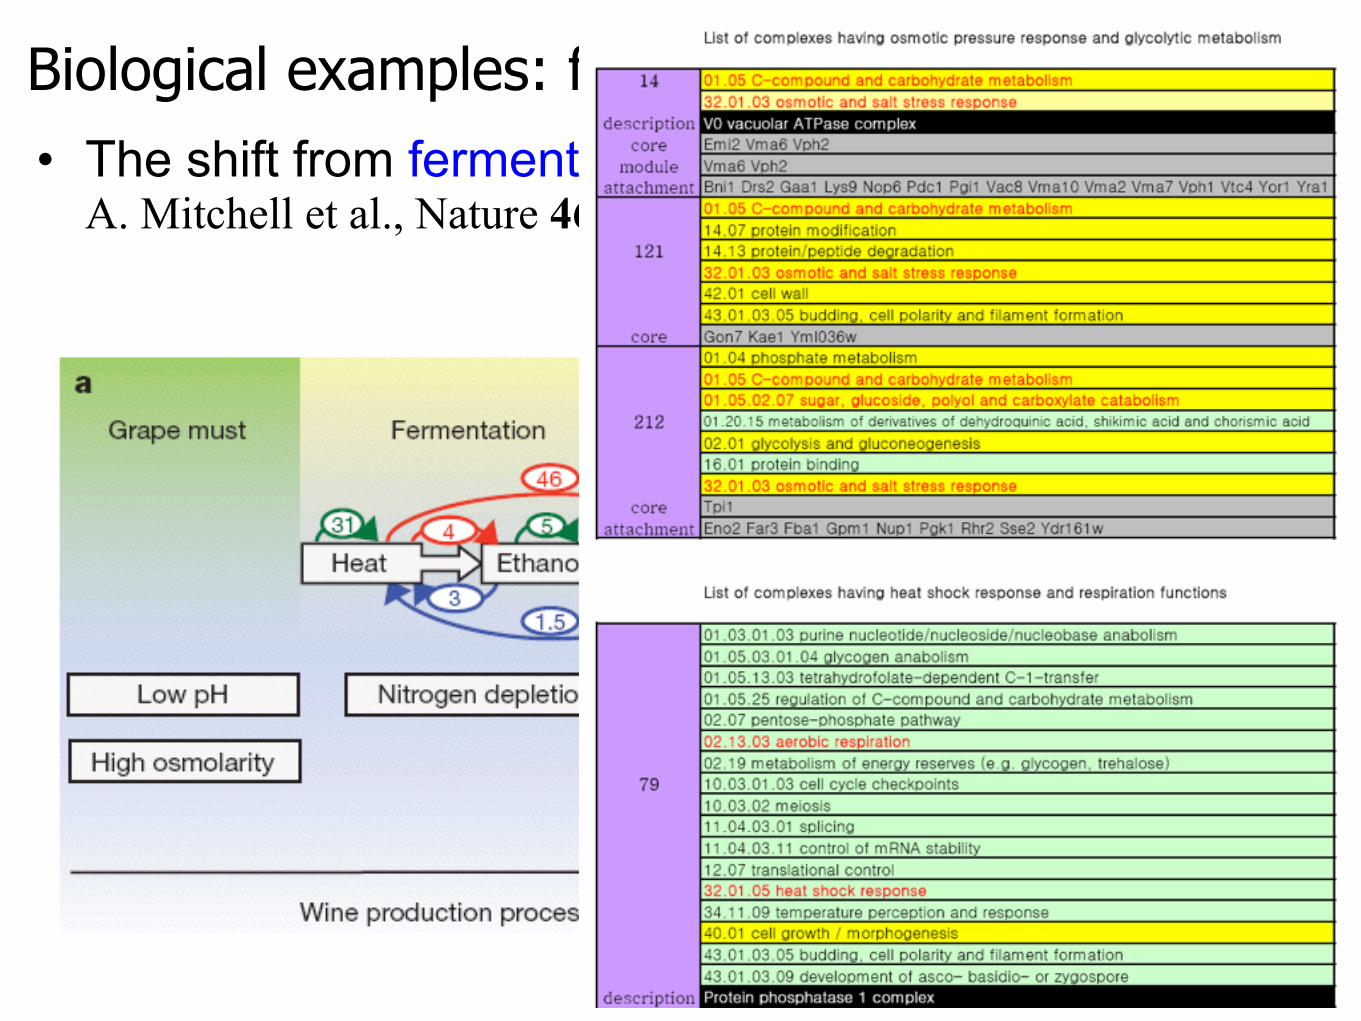
• The shift from fermentation to respiration in yeastA. Mitchell et al., Nature 460, 220 (2009).
Biological examples: for complex functions
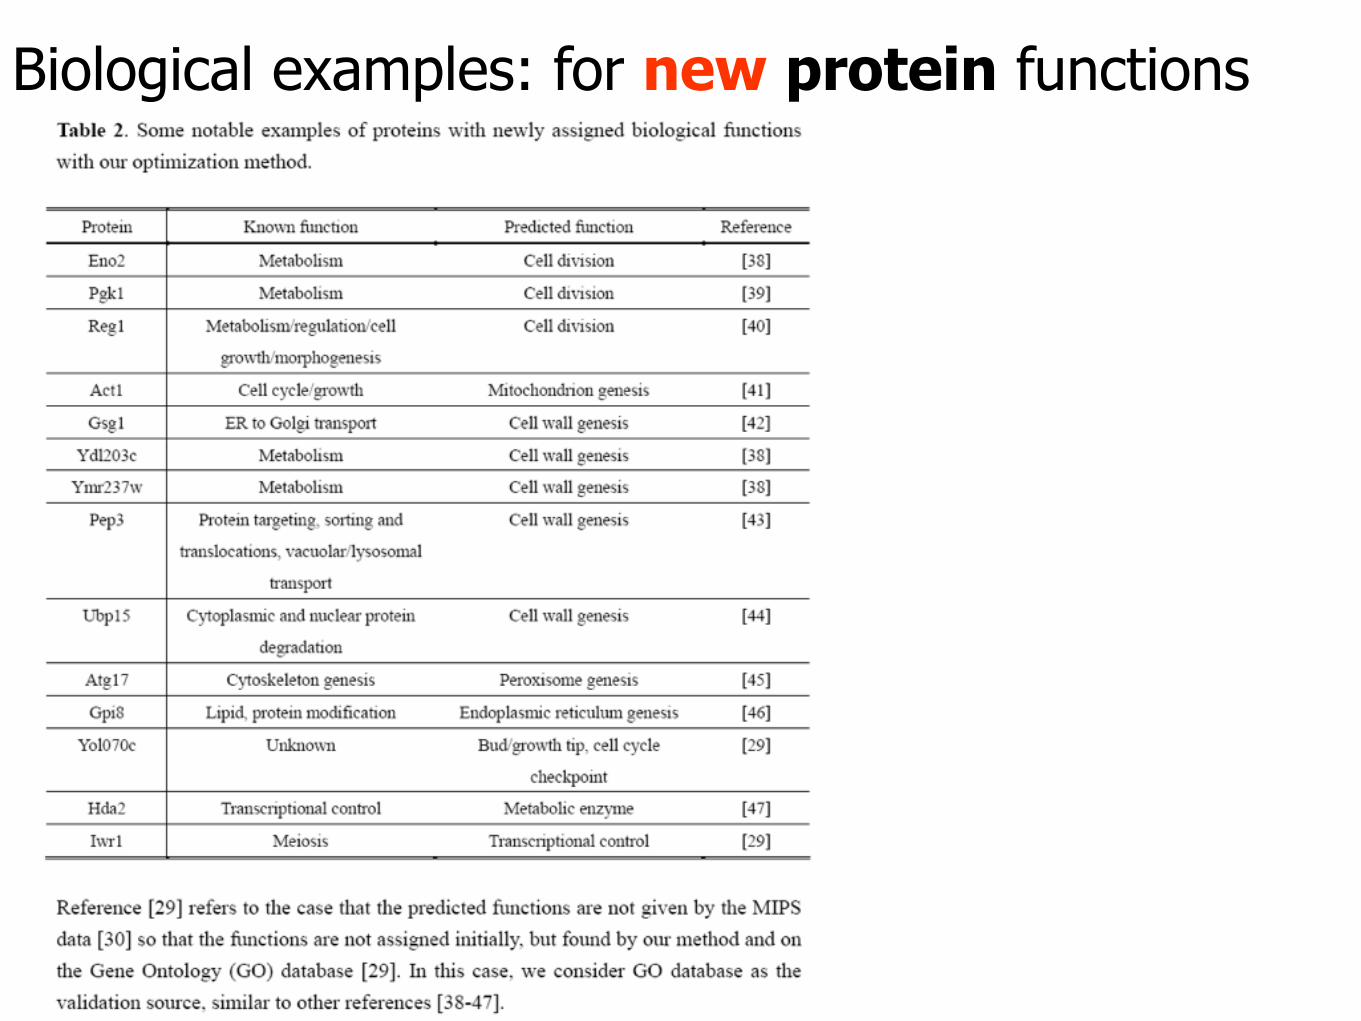
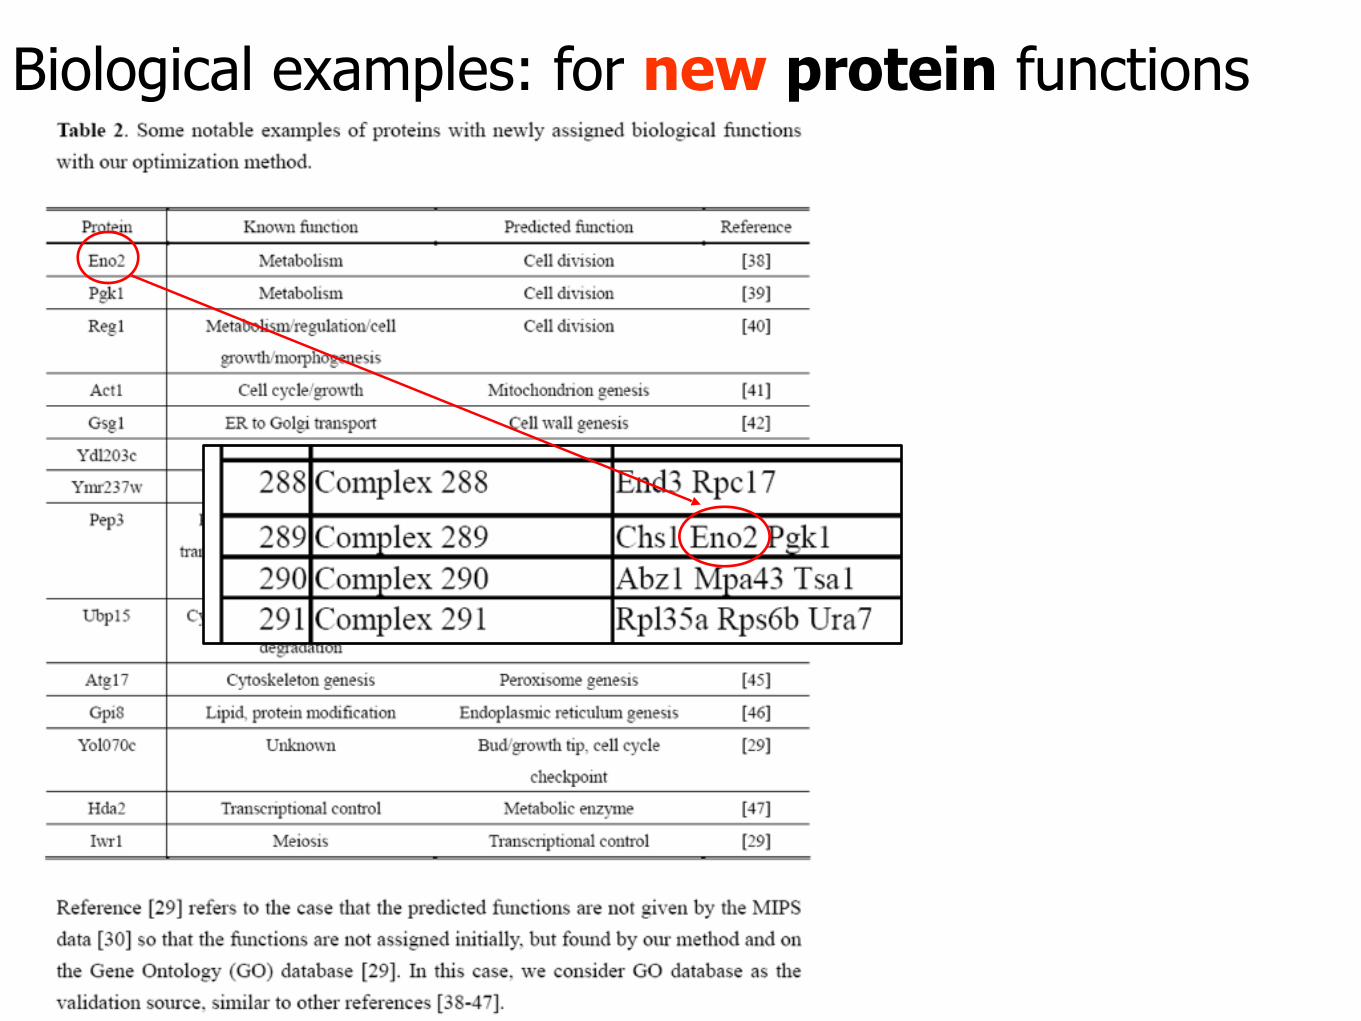
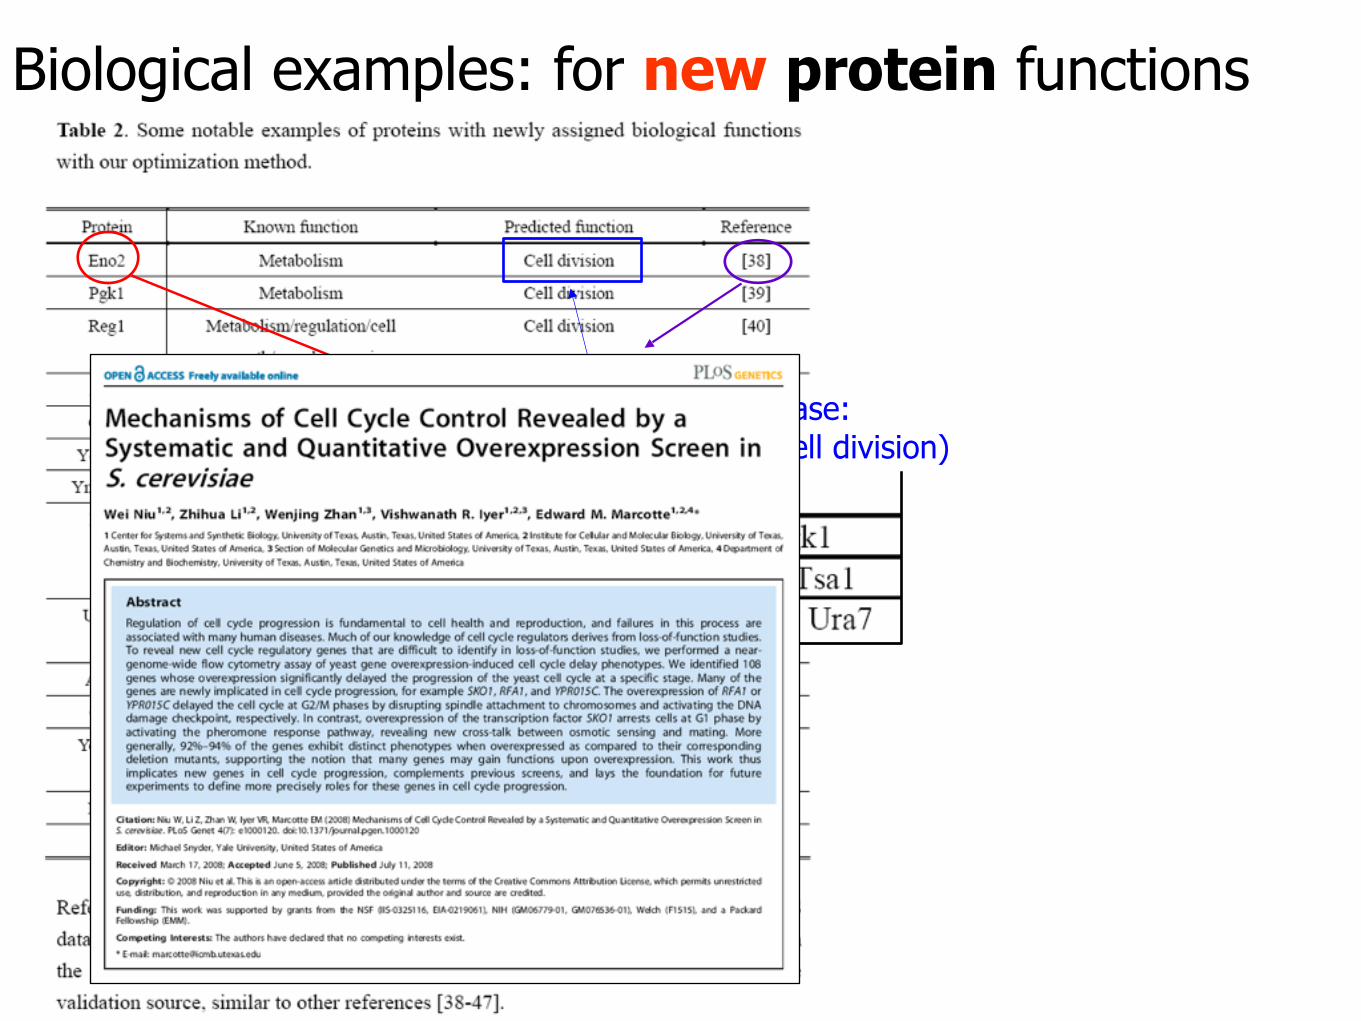
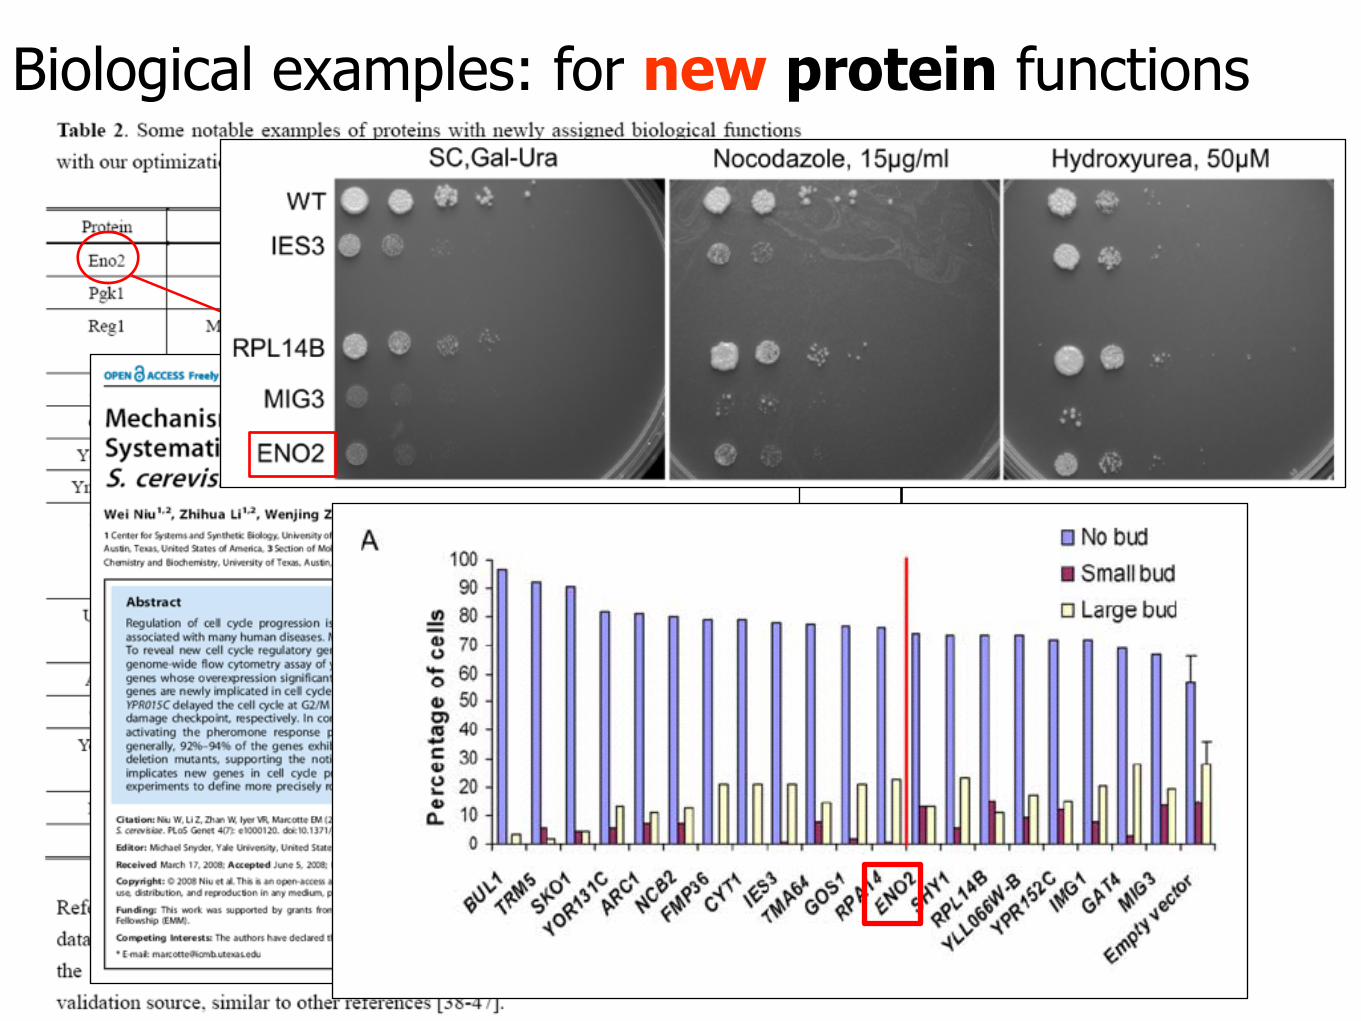
Biological examples: for new protein functions
Biological examples: for new protein functions
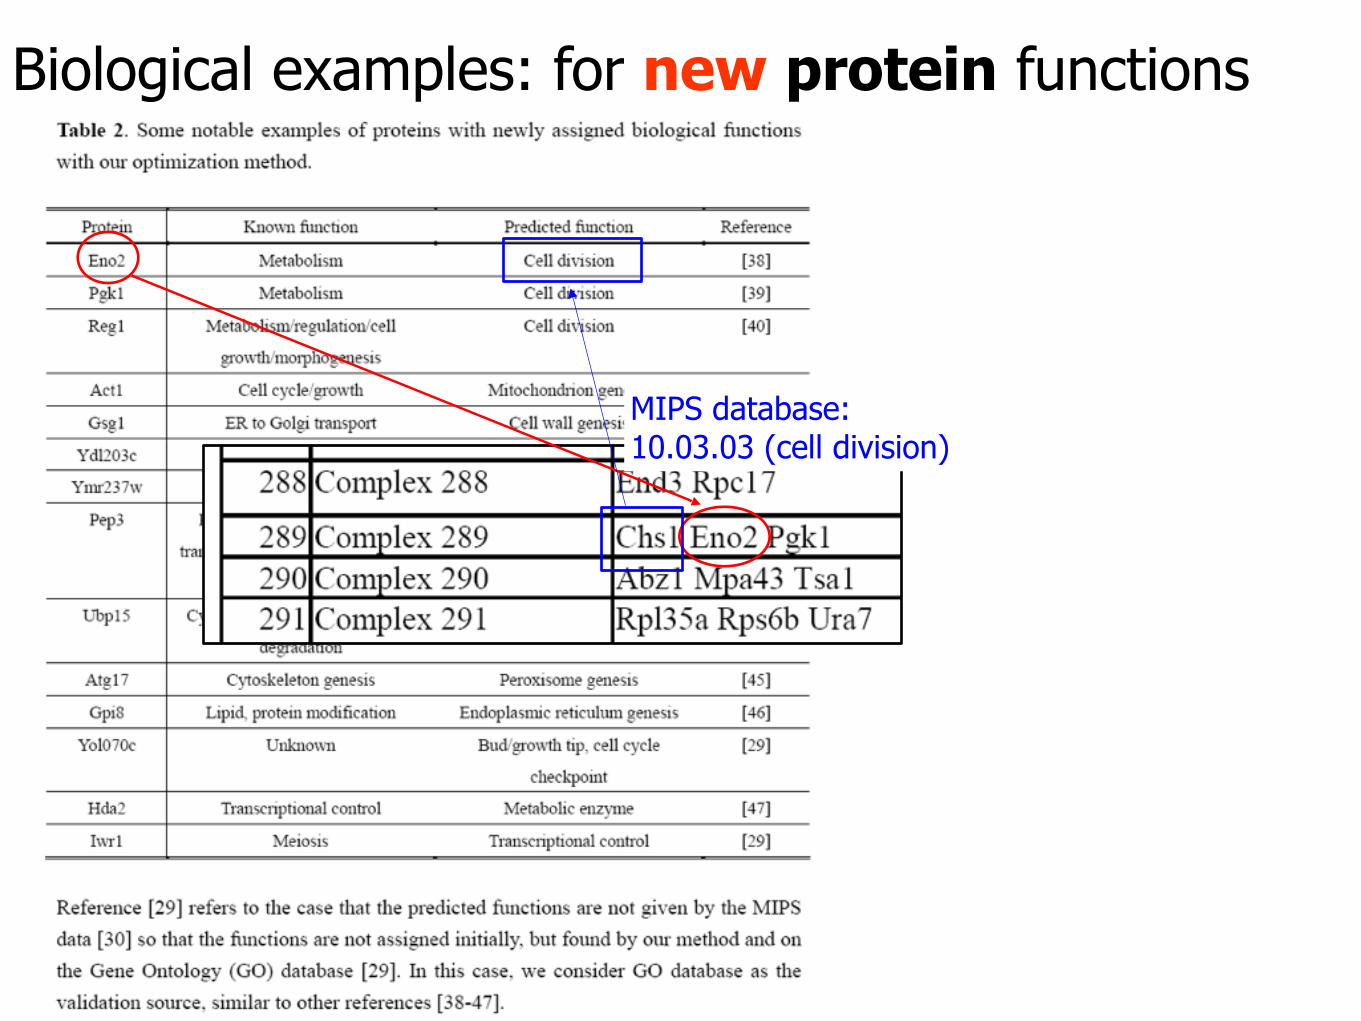
Biological examples: for new protein functions
MIPS database: 10.03.03 (cell division)
Biological examples: for new protein functions
MIPS database: 10.03.03 (cell division)
Biological examples: for new protein functions
MIPS database: 10.03.03 (cell division)
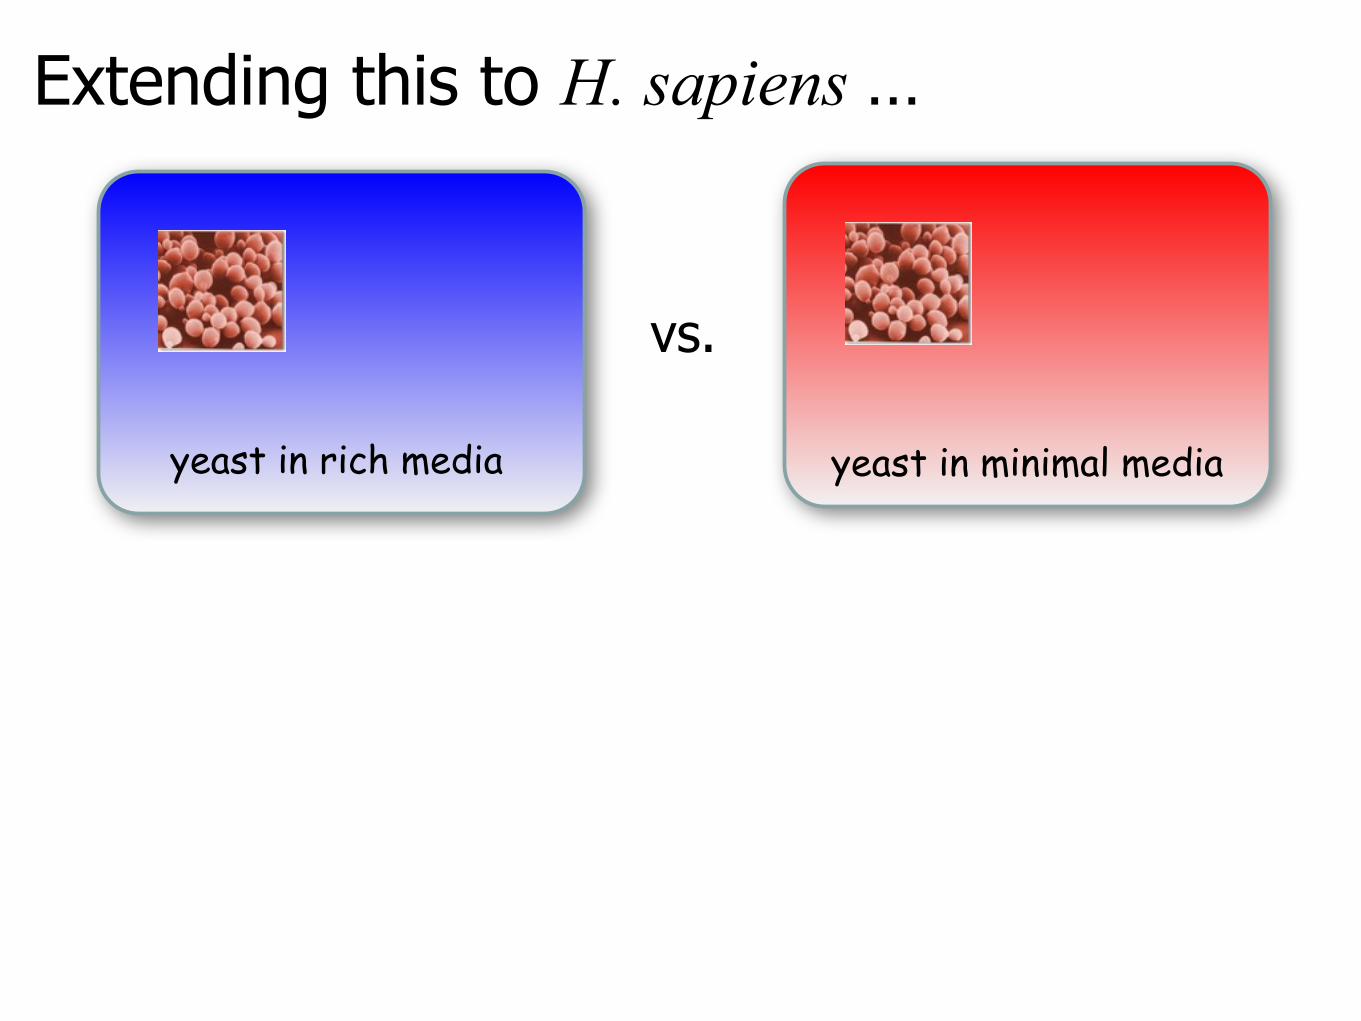
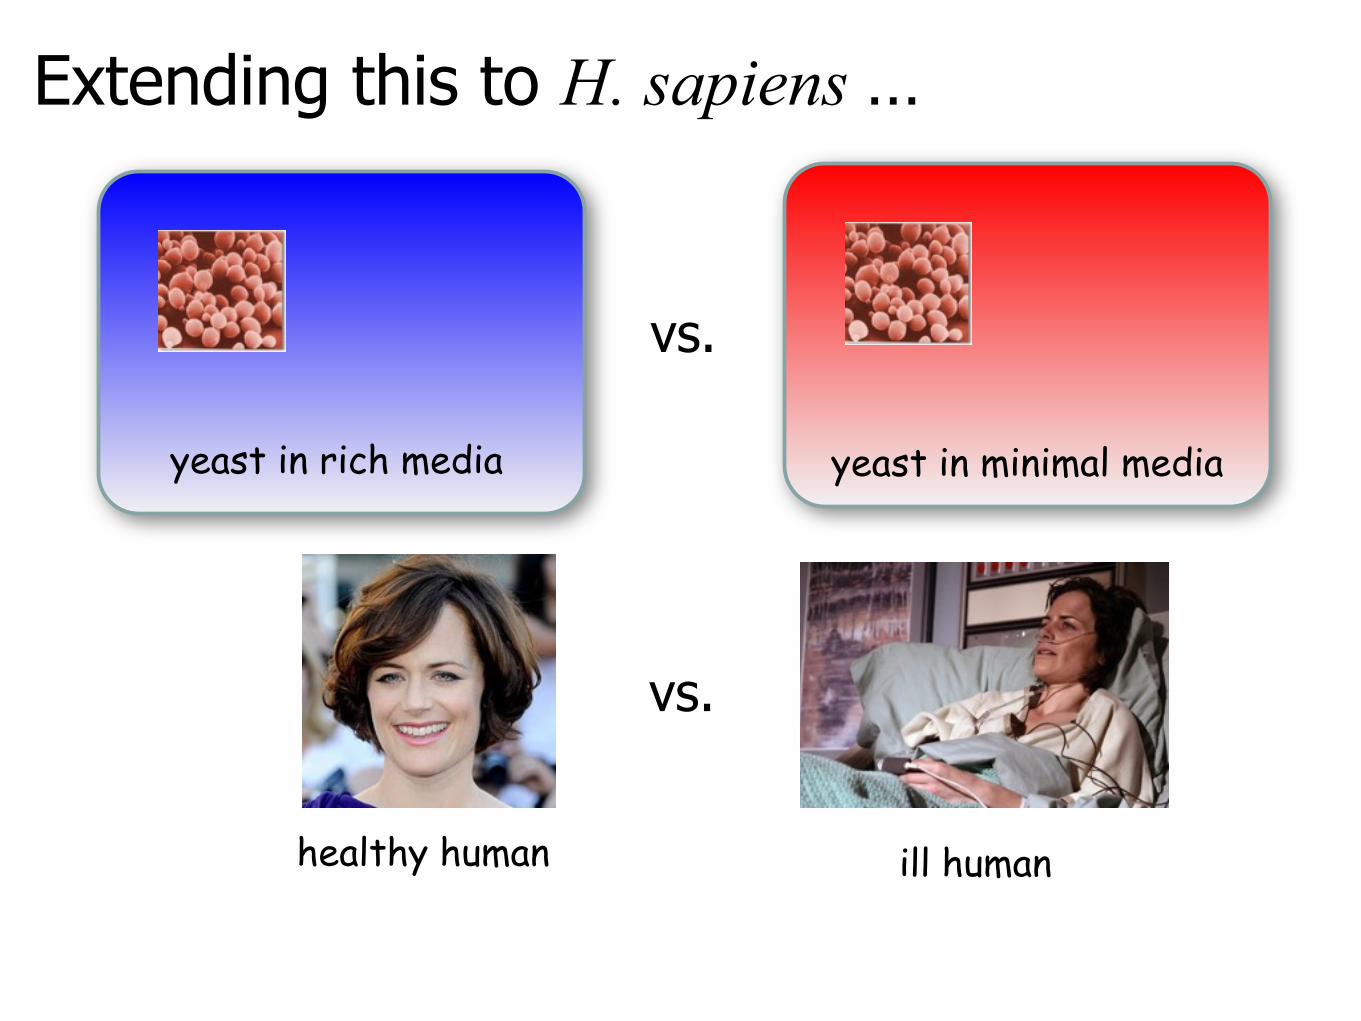
Extending this to H. sapiens …
yeast in rich media yeast in minimal media
vs.
Extending this to H. sapiens …
yeast in rich media yeast in minimal media
vs.
vs.
healthy human ill human
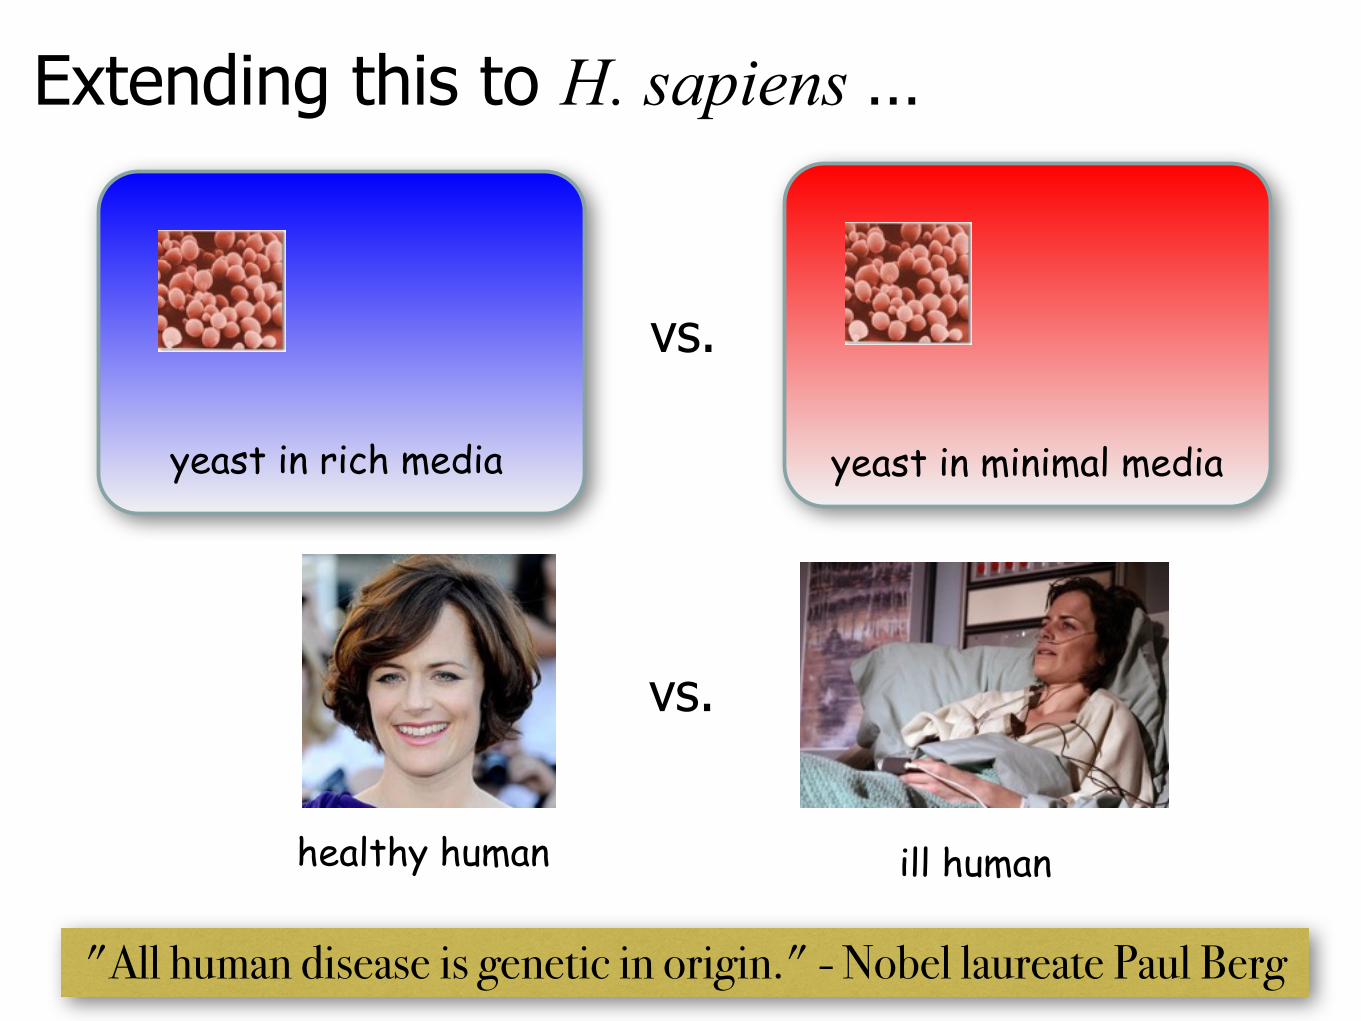
Extending this to H. sapiens …
yeast in rich media yeast in minimal media
vs.
vs.
healthy human ill human
"All human disease is genetic in origin." - Nobel laureate Paul Berg
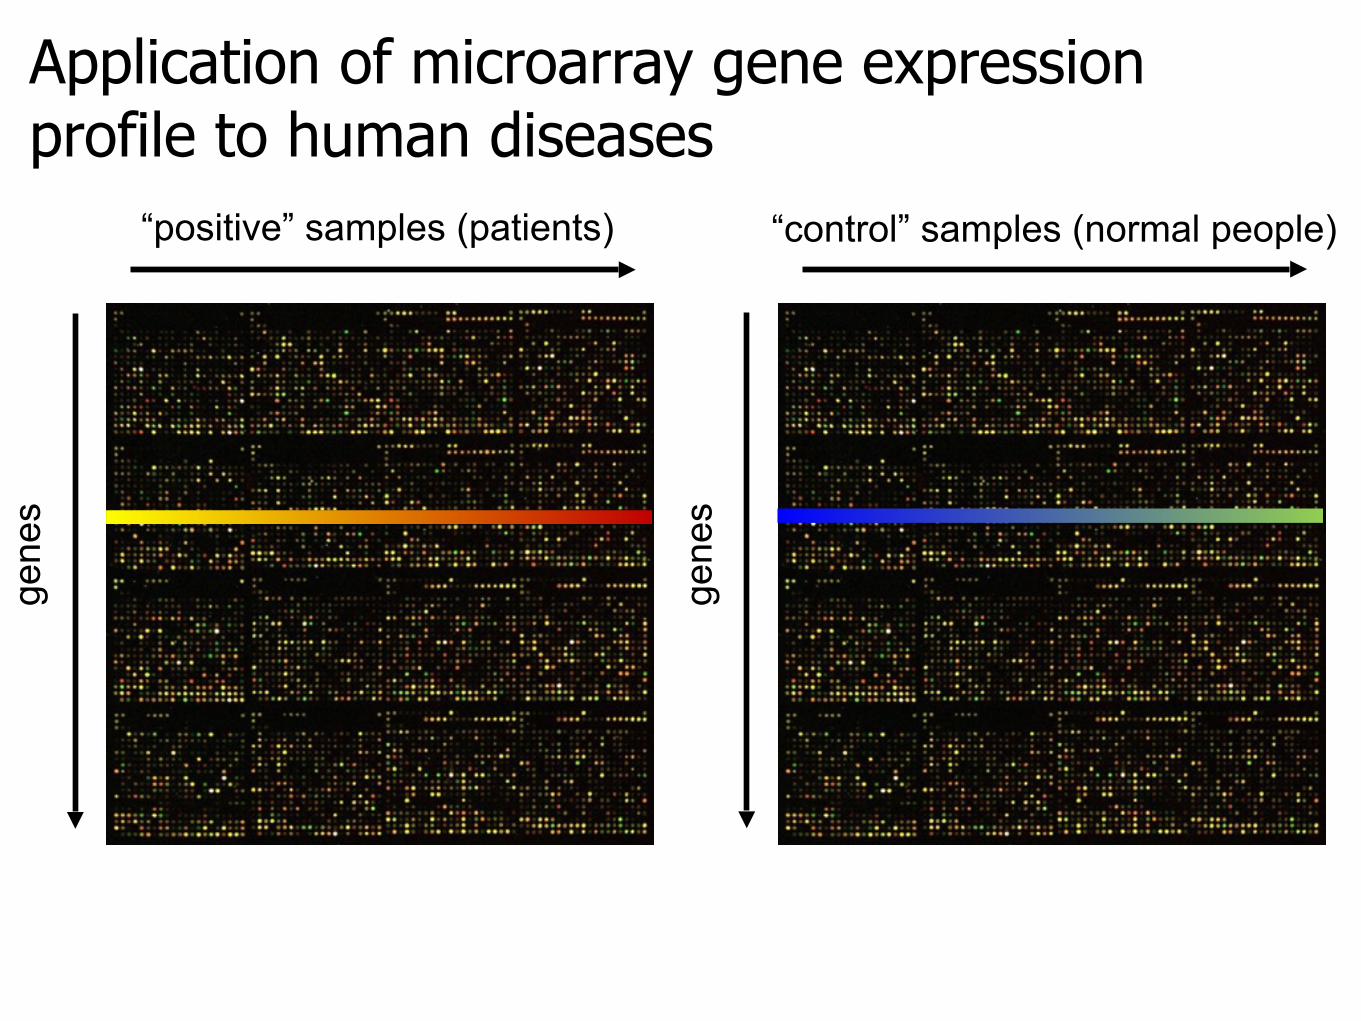
Application of microarray gene expression profile to human diseases
“positive” samples (patients)
gene
s
“control” samples (normal people)
gene
s
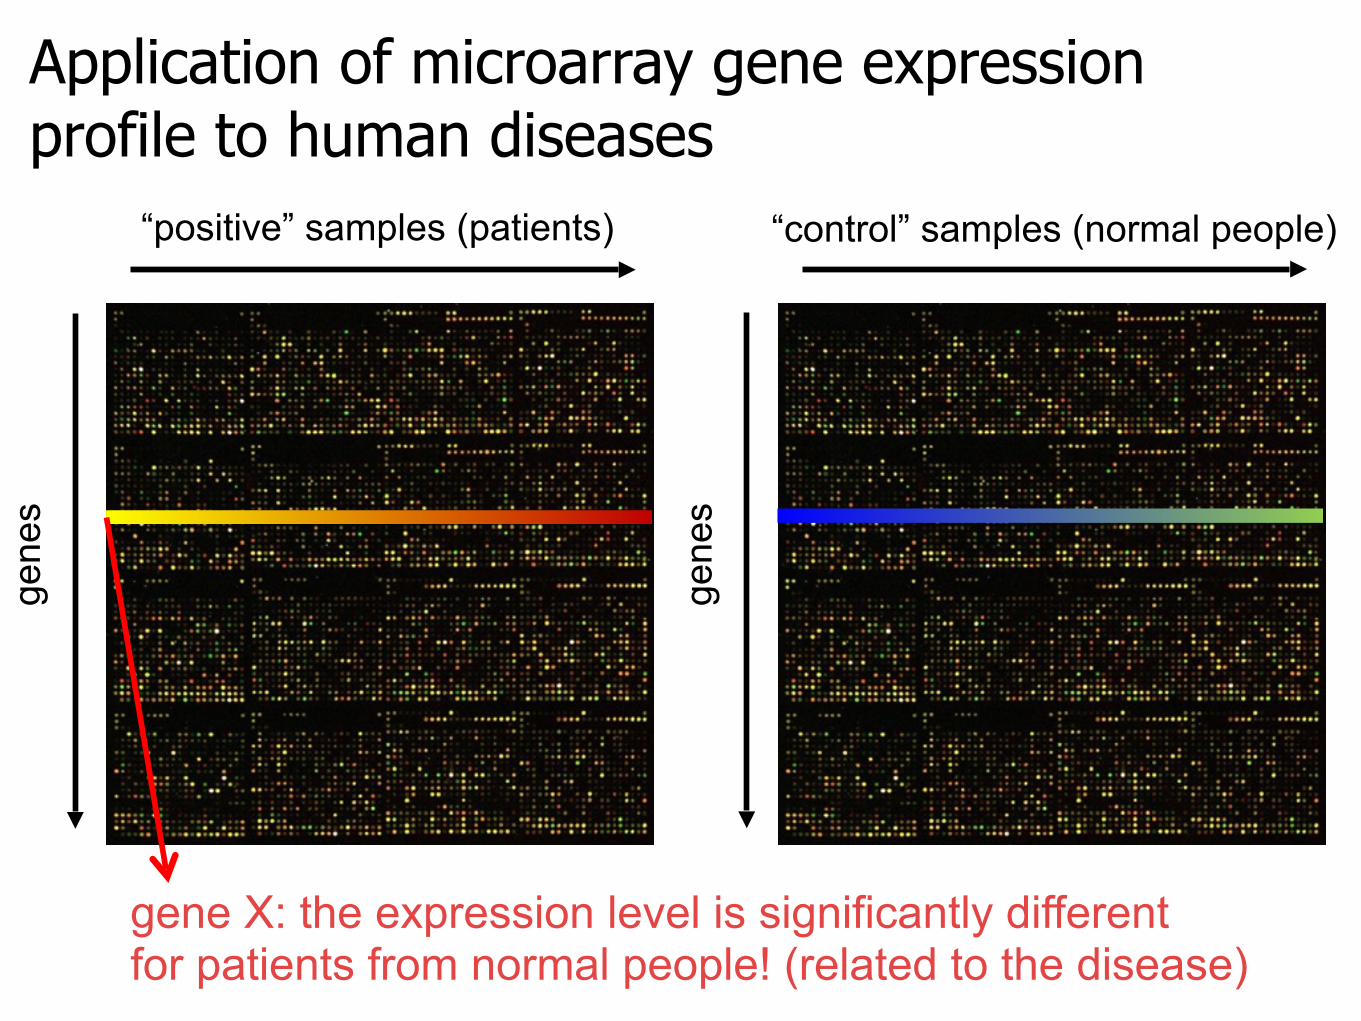
Application of microarray gene expression profile to human diseases
“positive” samples (patients)
gene
s
“control” samples (normal people)
gene
s
gene X: the expression level is significantly differentfor patients from normal people! (related to the disease)
Disease-gene relation• How to identify the relations?
– identifying disease-related genes based on the difference in the microarray expression profile for a single disease/control set
– elucidating disease-disease relationships based on the similarity in the microarray expression profile across many disease/control sets
J. Zhao, T.-H. Yang, Y. Huang, and P. Holme, PLOS ONE 6(9), e24306 (2011).
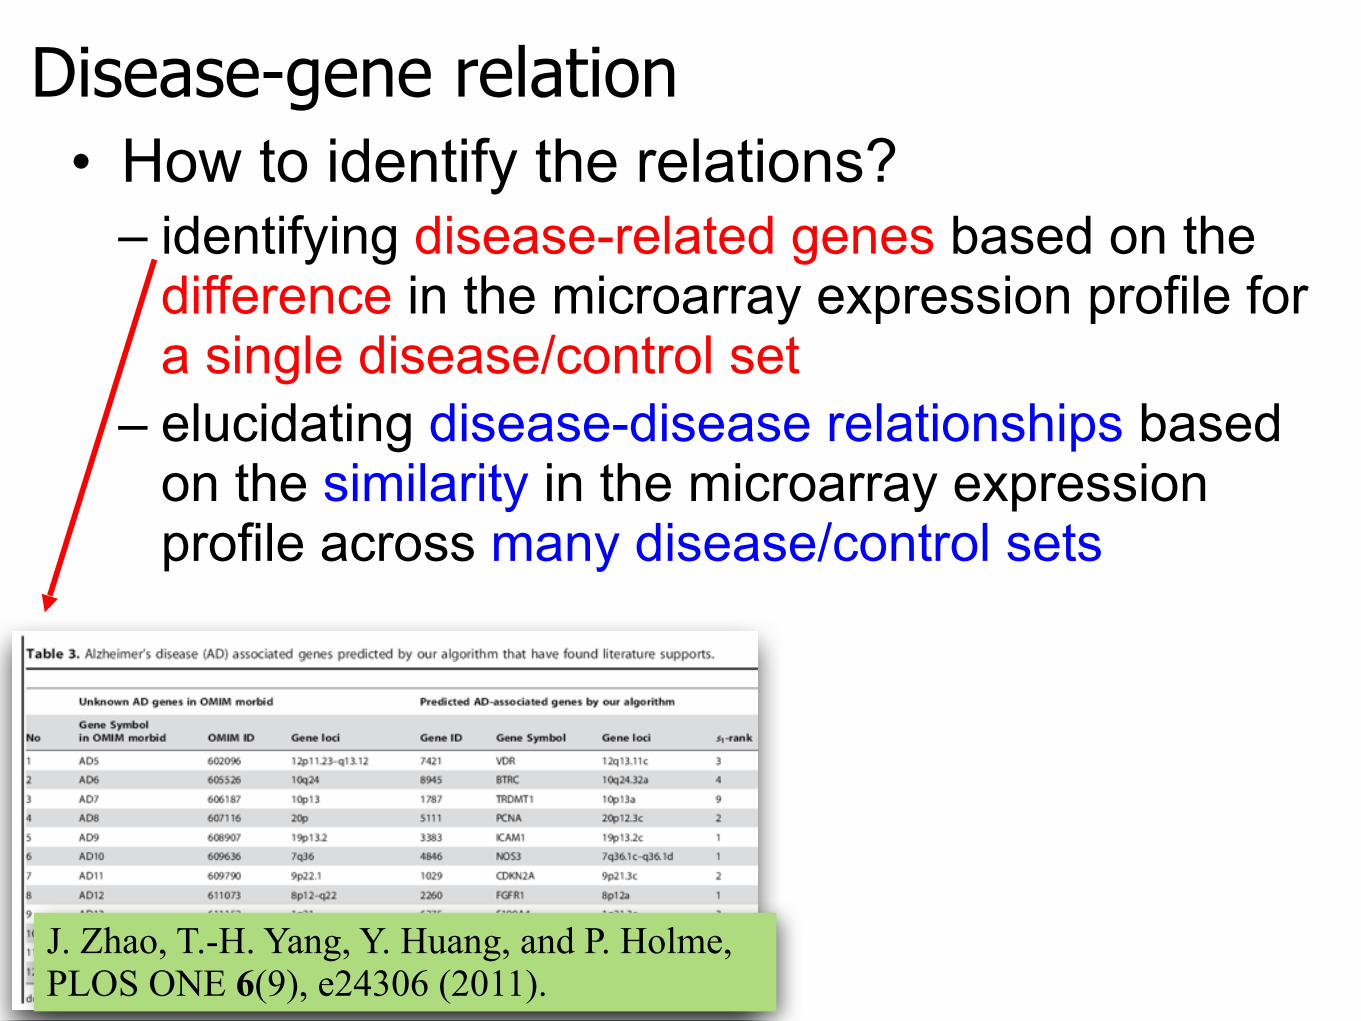
S. Suthram et al., PLoS Comput. Biol. 6(2), e1000662 (2010).
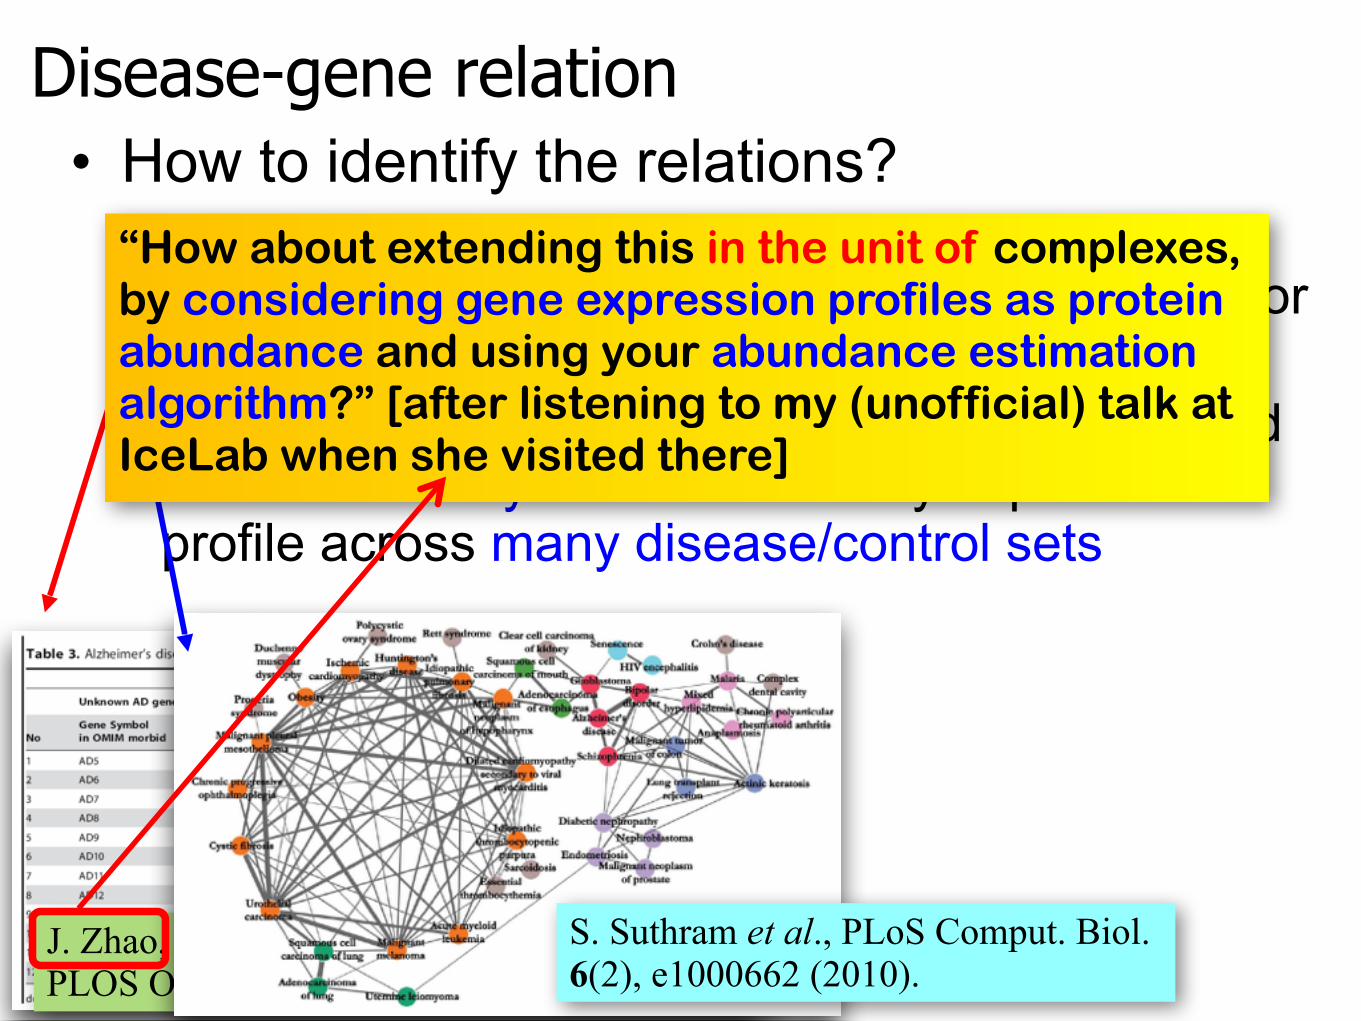
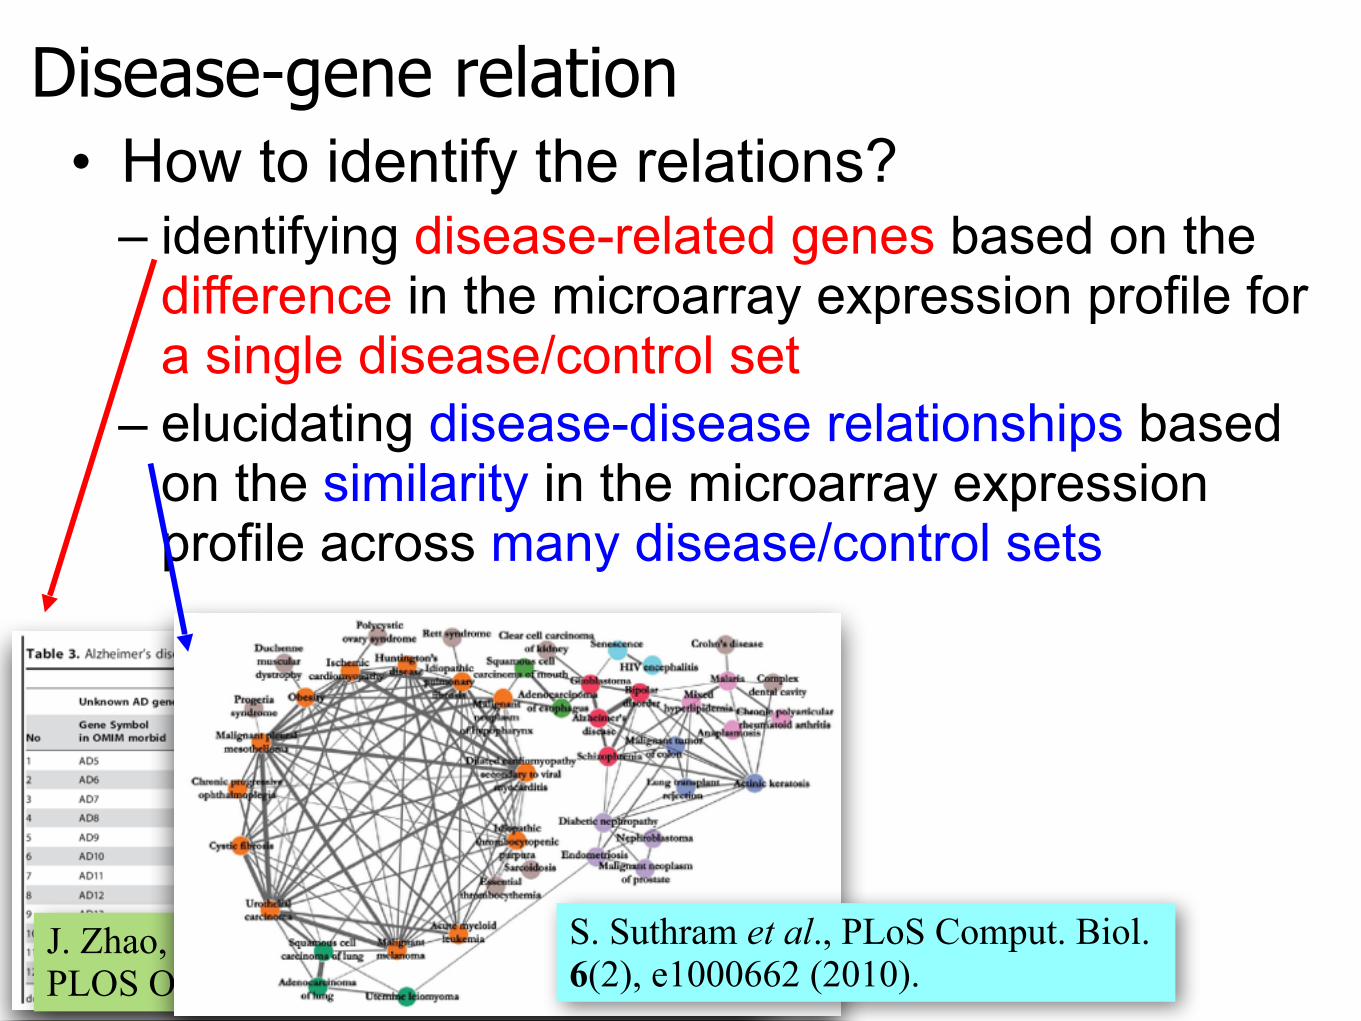
“How about extending this in the unit of complexes, by considering gene expression profiles as protein abundance and using your abundance estimation algorithm?” [after listening to my (unofficial) talk at IceLab when she visited there]
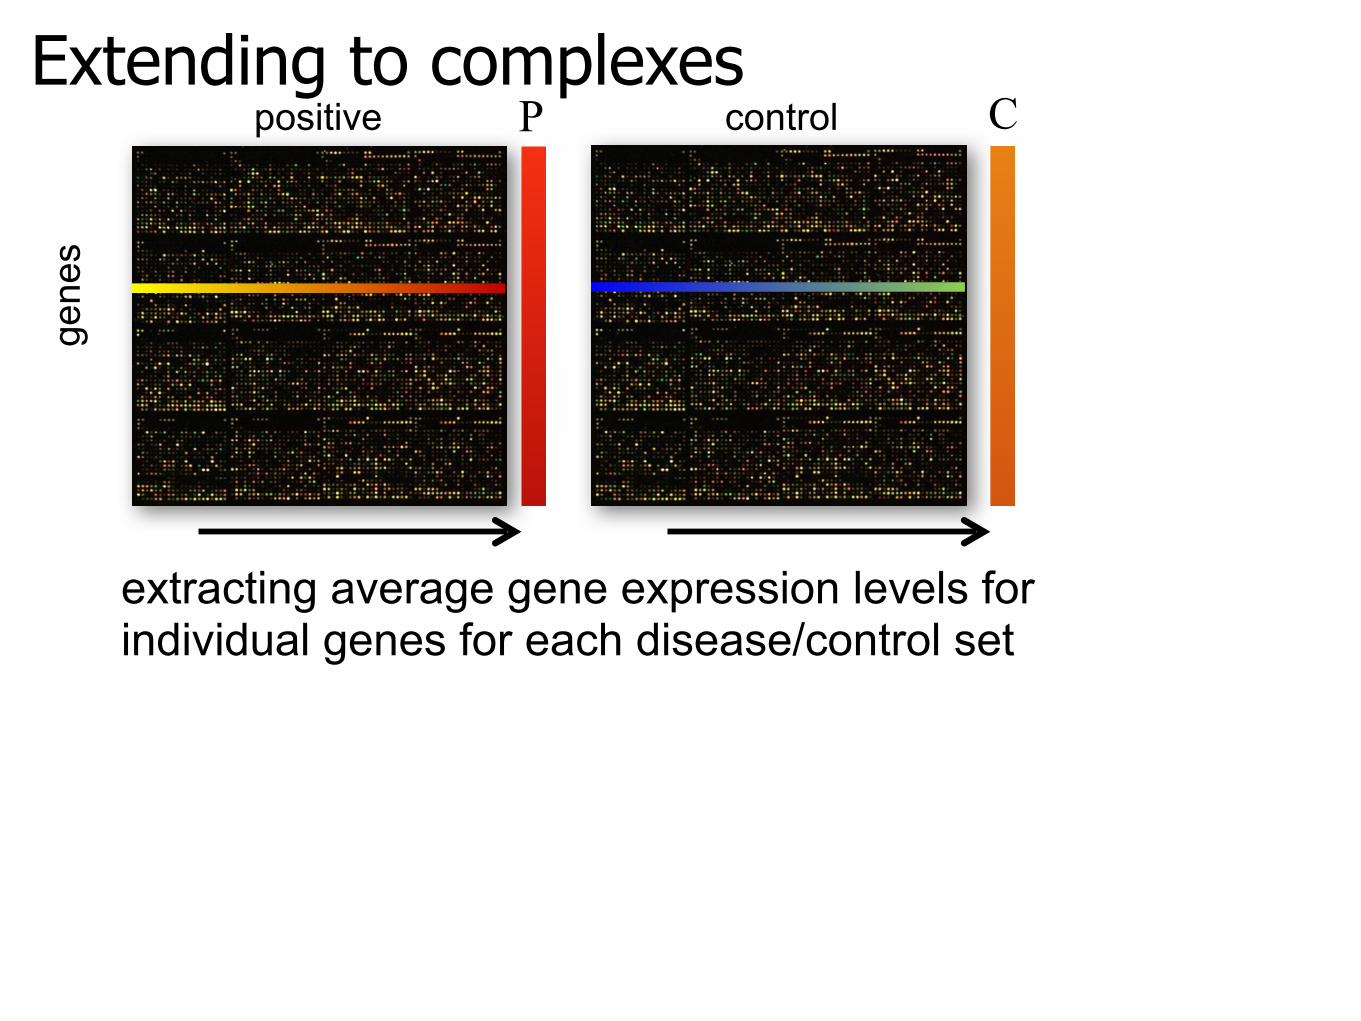
Extending to complexesge
nes
extracting average gene expression levels forindividual genes for each disease/control set
P Cpositive control
Extending to complexesge
nes
extracting average gene expression levels forindividual genes for each disease/control set
P Cpositive control
the list of protein abundance in our complex abundance estimation algorithm (the input dataset)!
minimizing
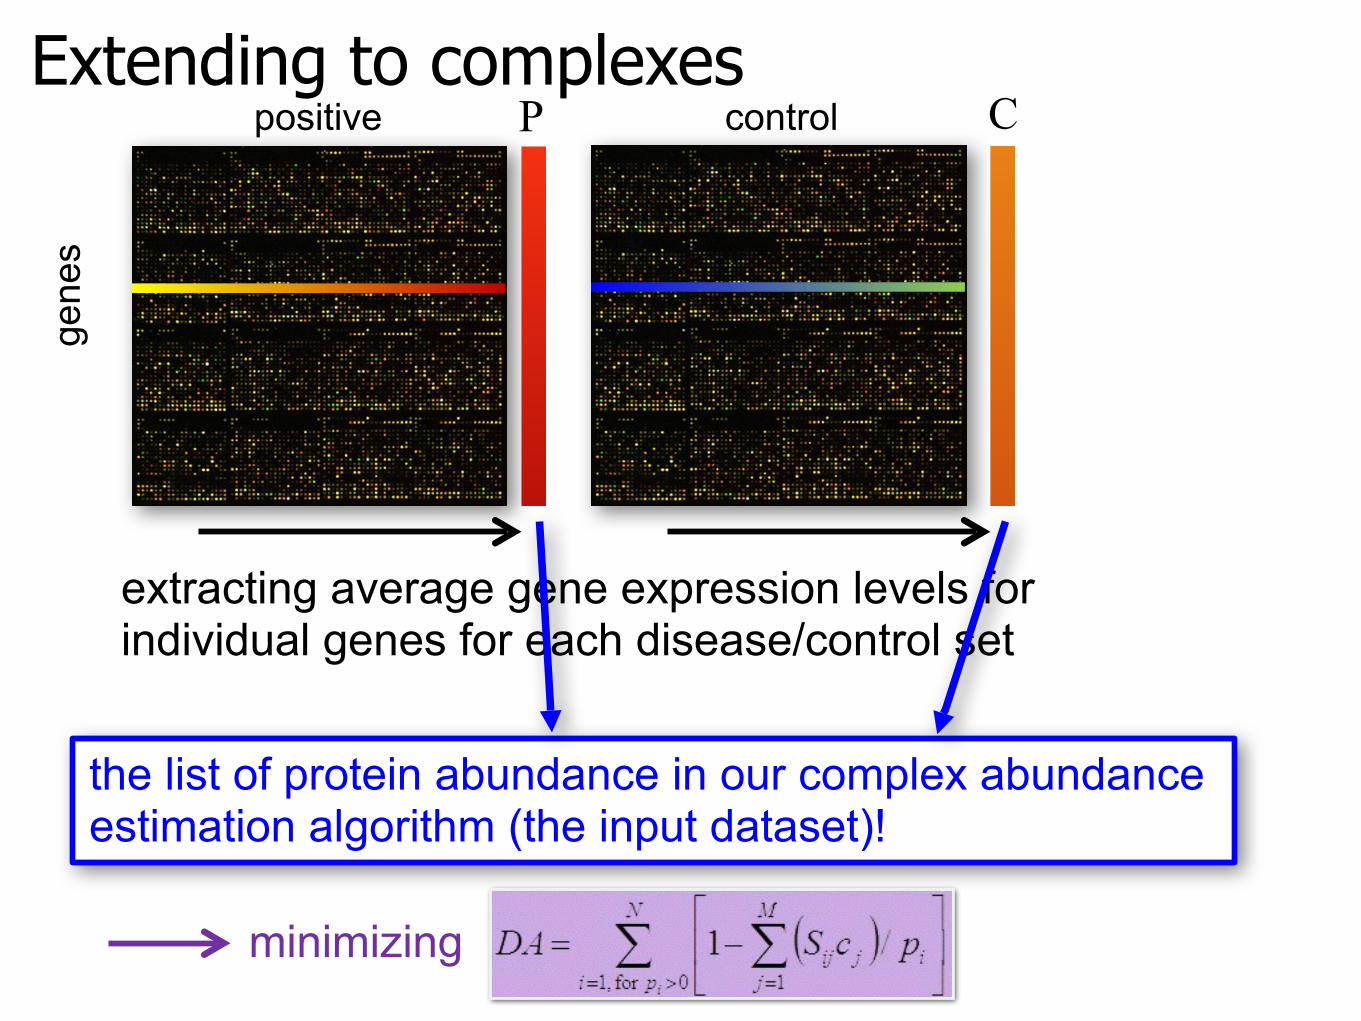
Extending to complexesge
nes
extracting average gene expression levels forindividual genes for each disease/control set
P Cpositive control
the list of protein abundance in our complex abundance estimation algorithm (the input dataset)!
minimizing
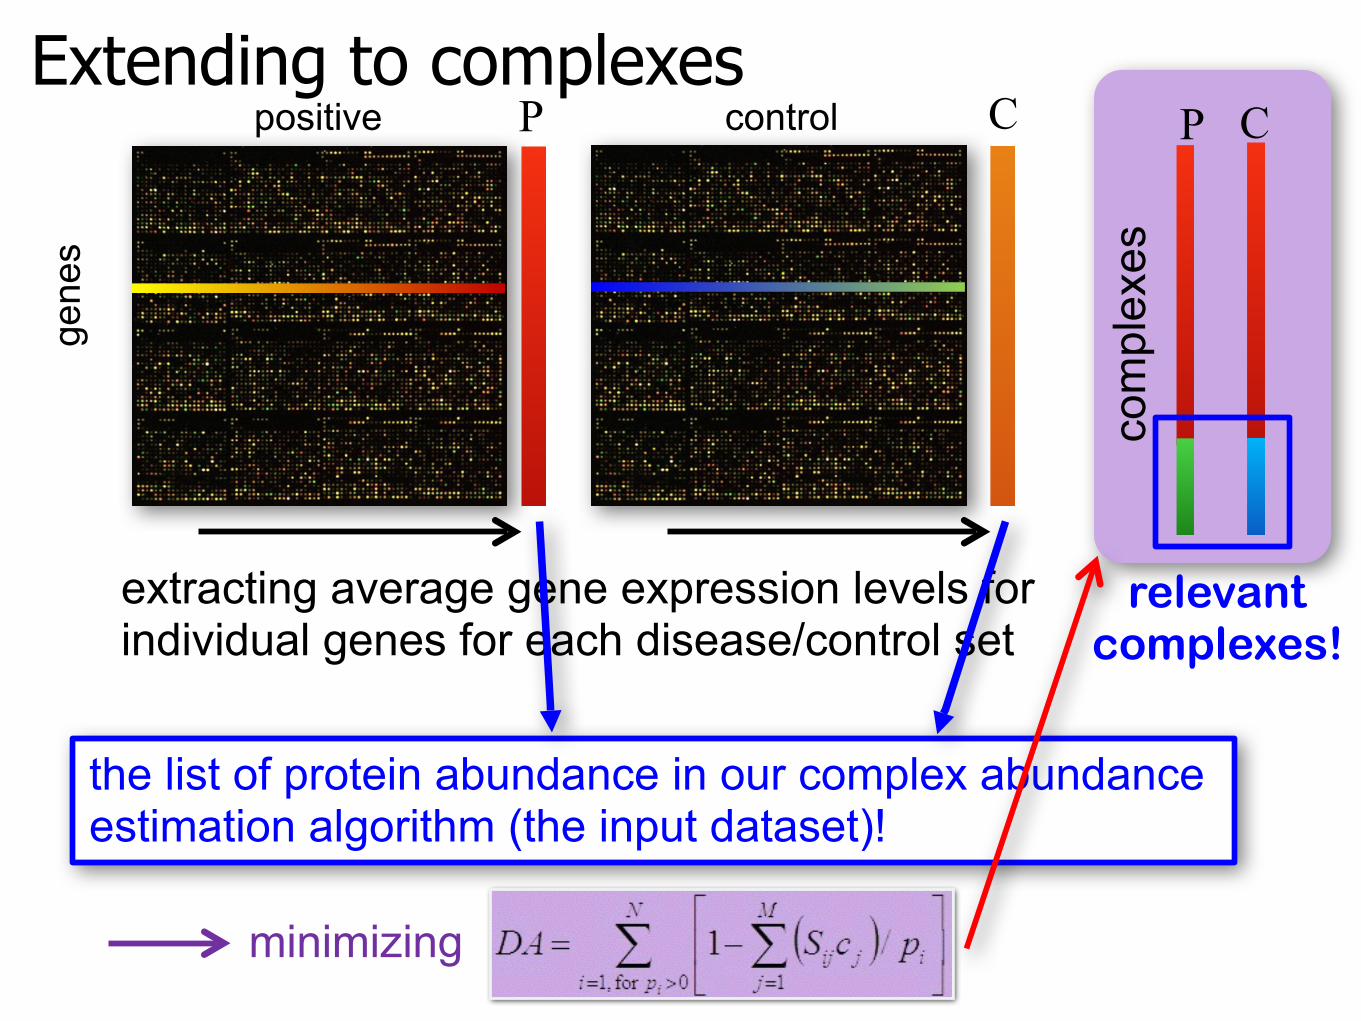
P C
com
plex
es
relevant complexes!
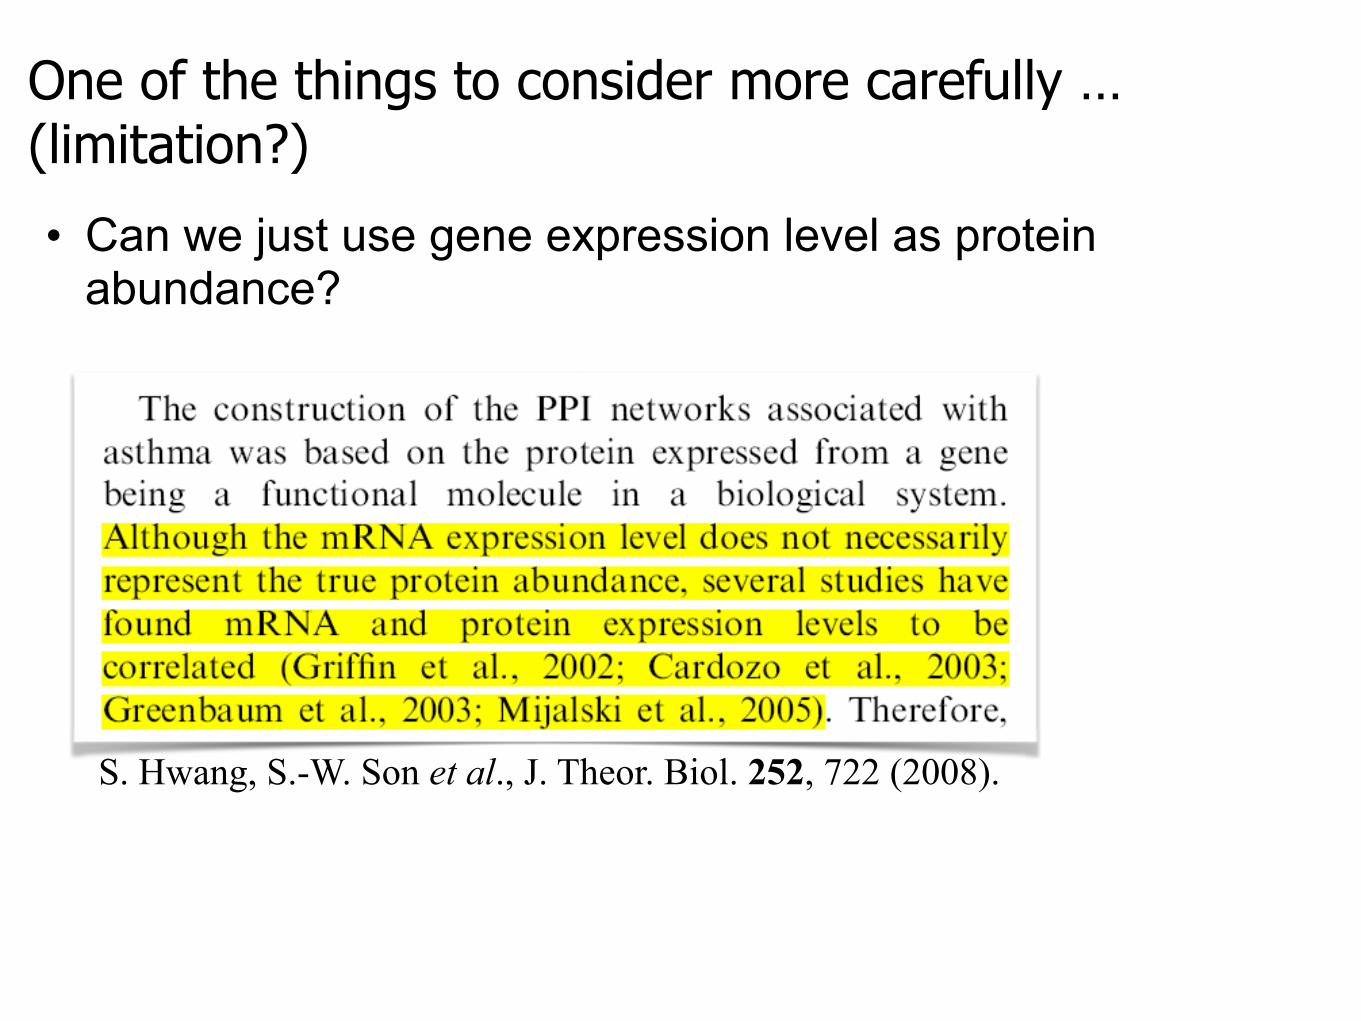
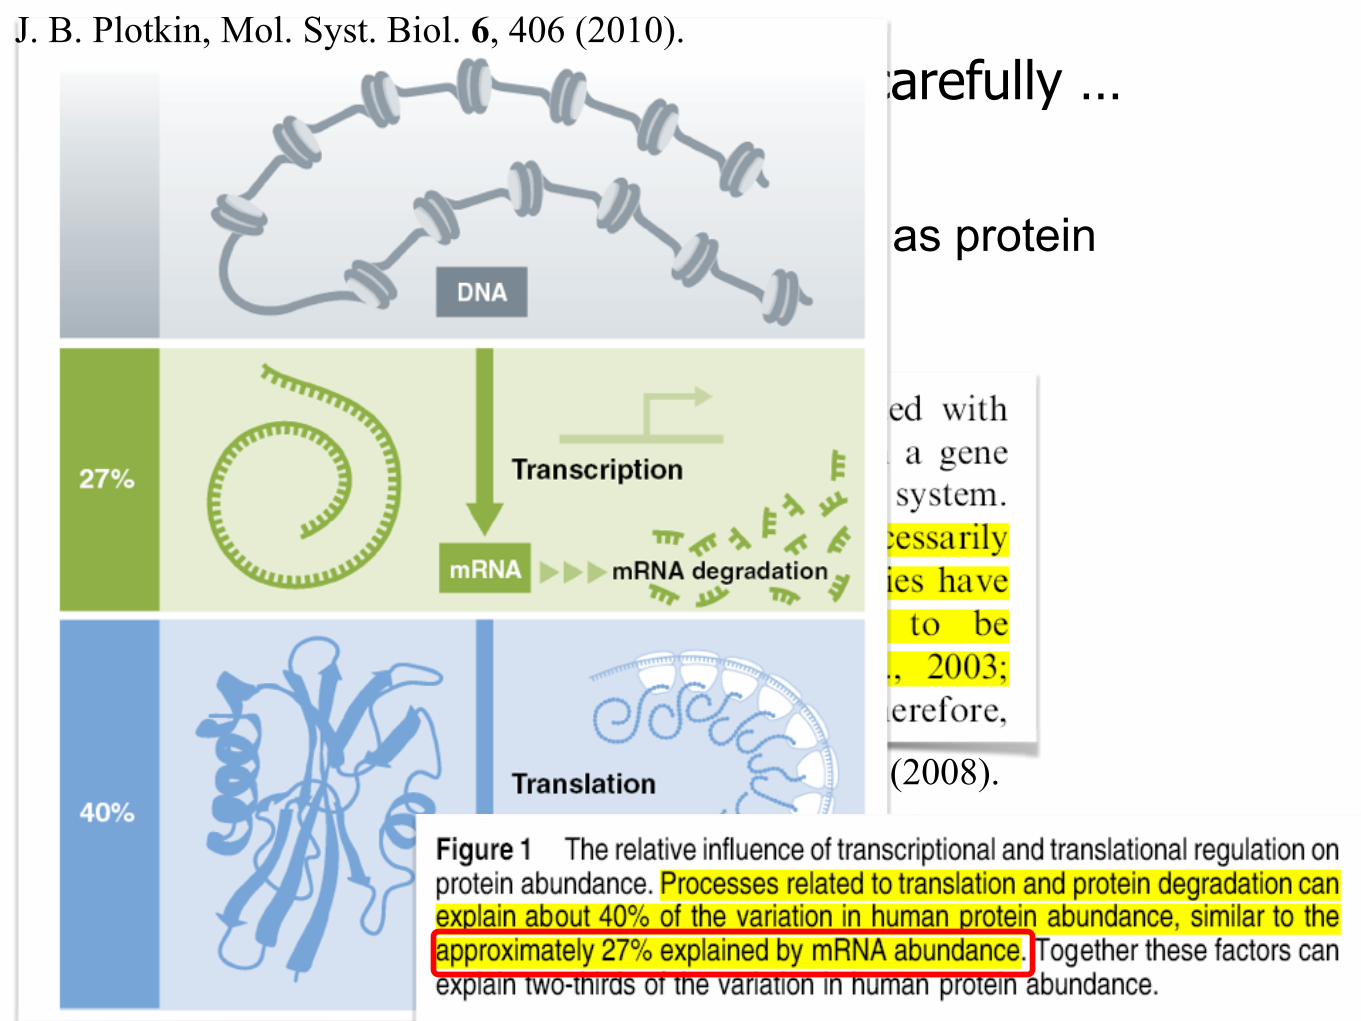
One of the things to consider more carefully … (limitation?)
• Can we just use gene expression level as protein abundance?
S. Hwang, S.-W. Son et al., J. Theor. Biol. 252, 722 (2008).
One of the things to consider more carefully … (limitation?)
• Can we just use gene expression level as protein abundance?
S. Hwang, S.-W. Son et al., J. Theor. Biol. 252, 722 (2008).
J. B. Plotkin, Mol. Syst. Biol. 6, 406 (2010).
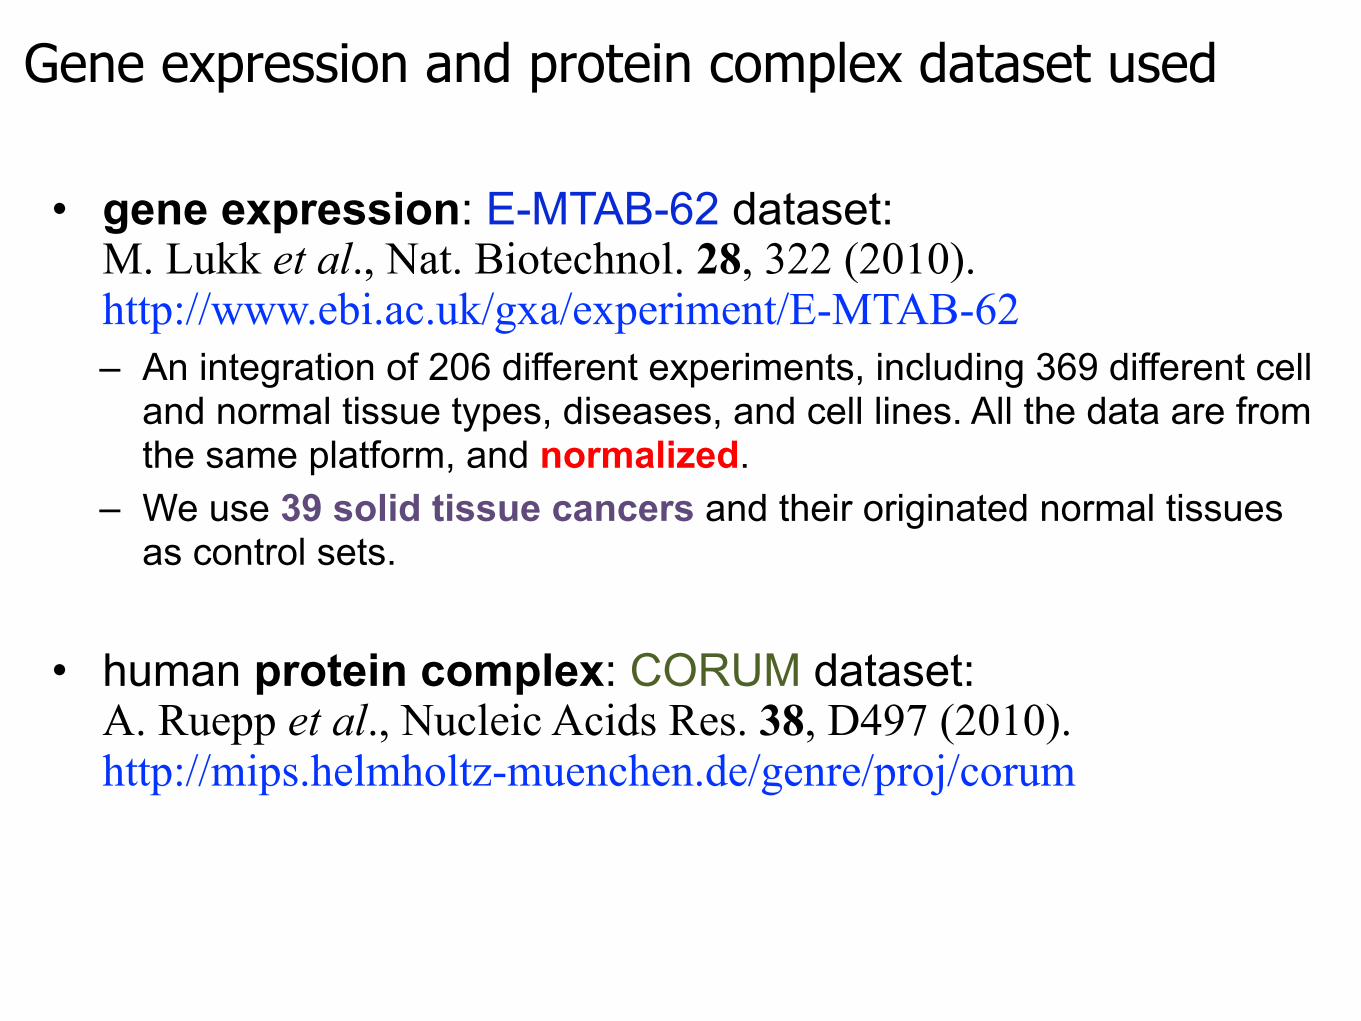
Gene expression and protein complex dataset used
• gene expression: E-MTAB-62 dataset:M. Lukk et al., Nat. Biotechnol. 28, 322 (2010). http://www.ebi.ac.uk/gxa/experiment/E-MTAB-62 – An integration of 206 different experiments, including 369 different cell
and normal tissue types, diseases, and cell lines. All the data are from the same platform, and normalized.
– We use 39 solid tissue cancers and their originated normal tissues as control sets.
• human protein complex: CORUM dataset:A. Ruepp et al., Nucleic Acids Res. 38, D497 (2010).http://mips.helmholtz-muenchen.de/genre/proj/corum
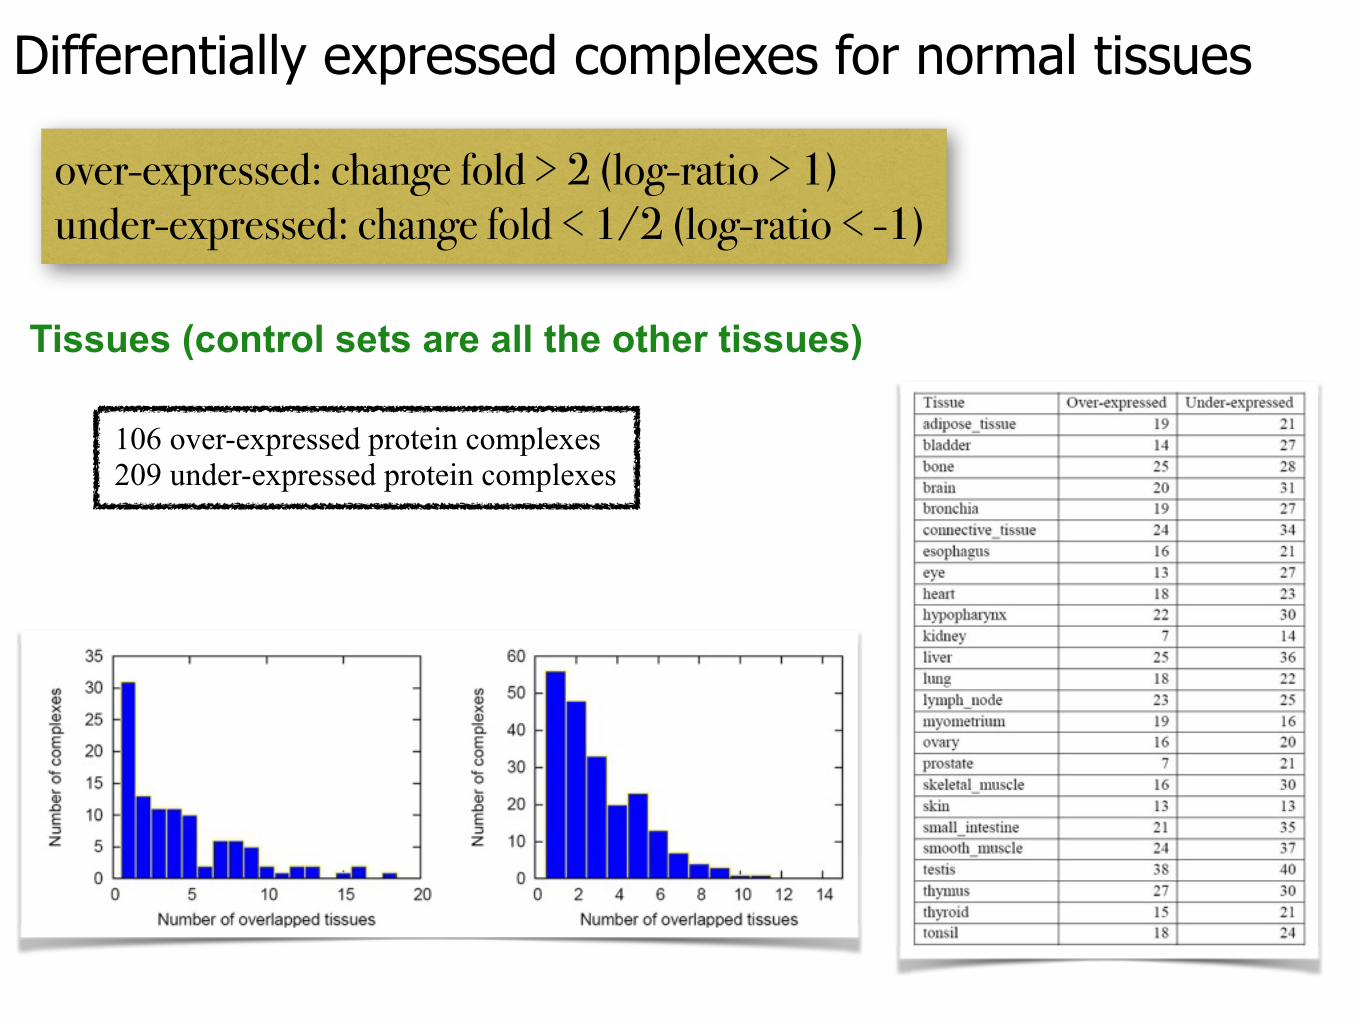
Differentially expressed complexes for normal tissues
over-expressed: change fold > 2 (log-ratio > 1) under-expressed: change fold < 1/2 (log-ratio < -1)
Tissues (control sets are all the other tissues)
106 over-expressed protein complexes 209 under-expressed protein complexes
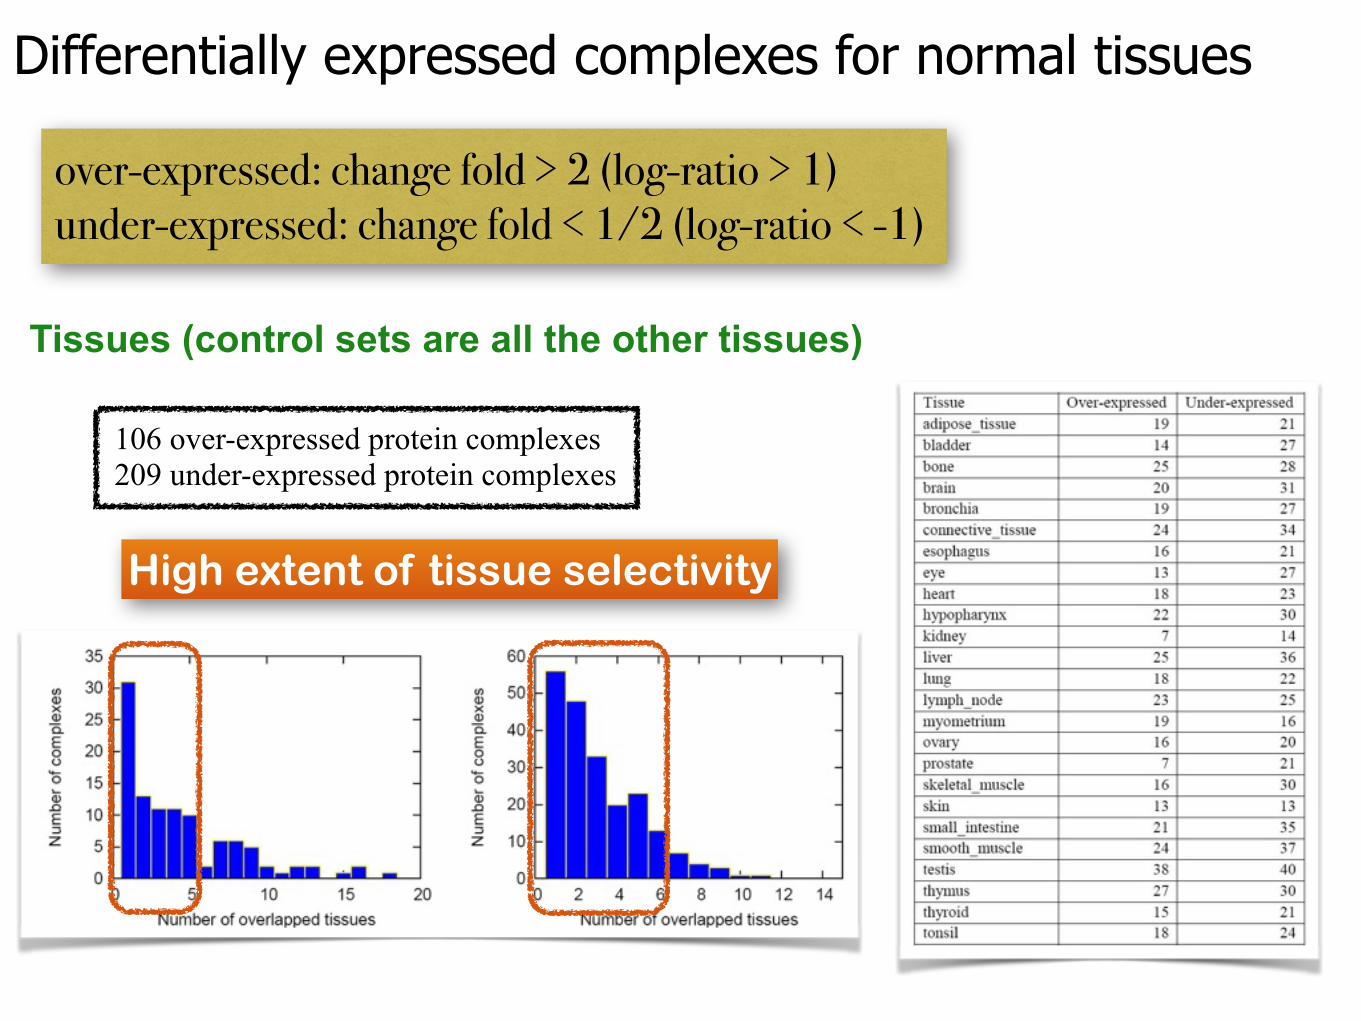
Differentially expressed complexes for normal tissues
over-expressed: change fold > 2 (log-ratio > 1) under-expressed: change fold < 1/2 (log-ratio < -1)
Tissues (control sets are all the other tissues)
106 over-expressed protein complexes 209 under-expressed protein complexes
High extent of tissue selectivity
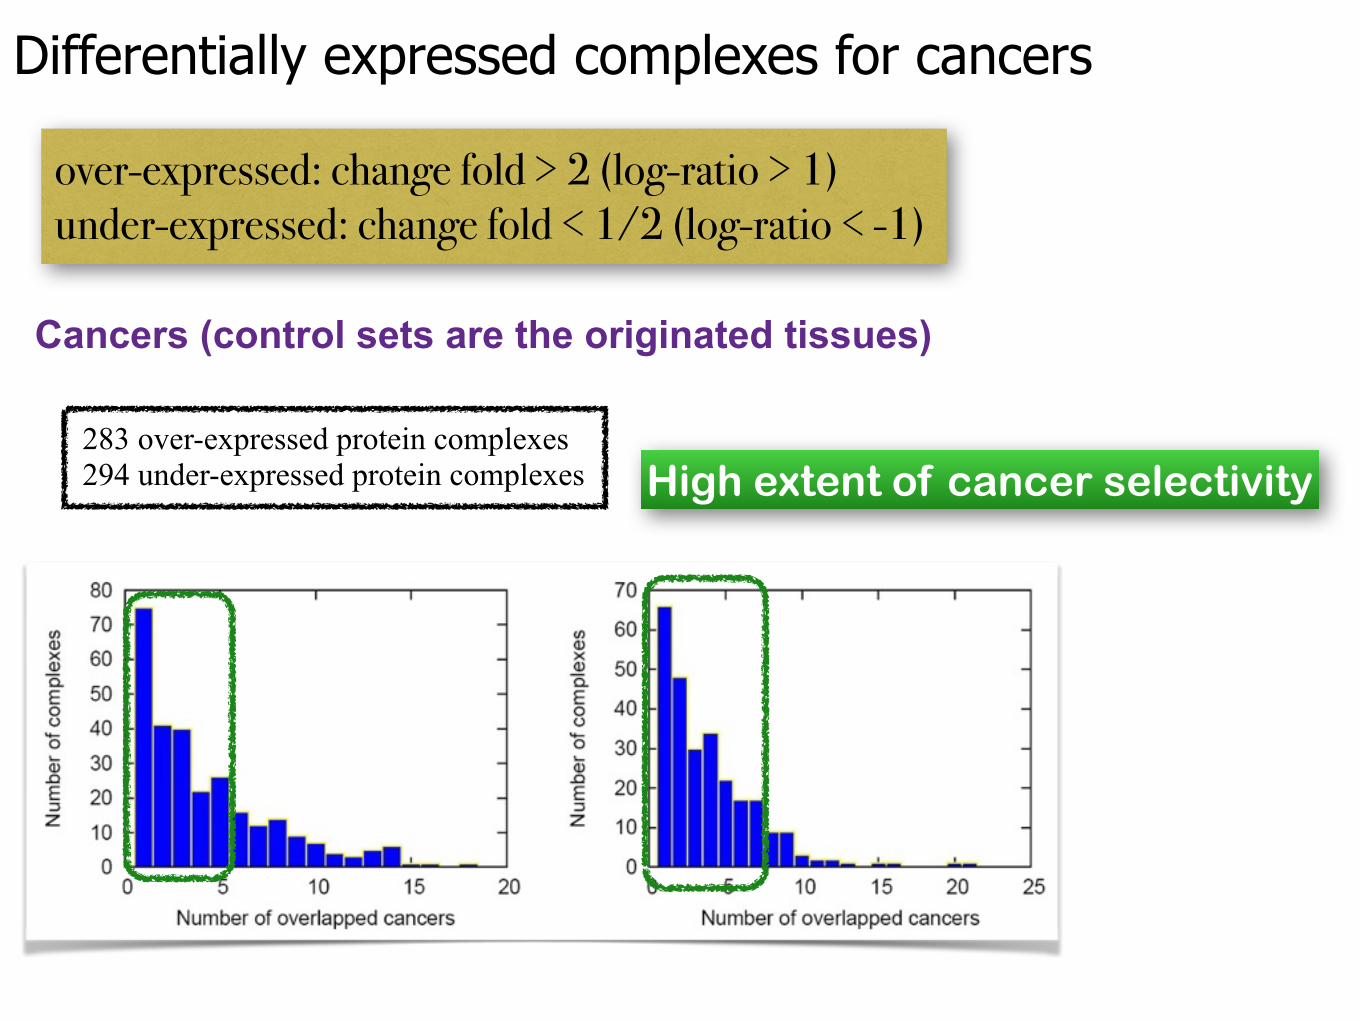
Cancers (control sets are the originated tissues)
High extent of cancer selectivity
Differentially expressed complexes for cancers
over-expressed: change fold > 2 (log-ratio > 1) under-expressed: change fold < 1/2 (log-ratio < -1)
283 over-expressed protein complexes 294 under-expressed protein complexes
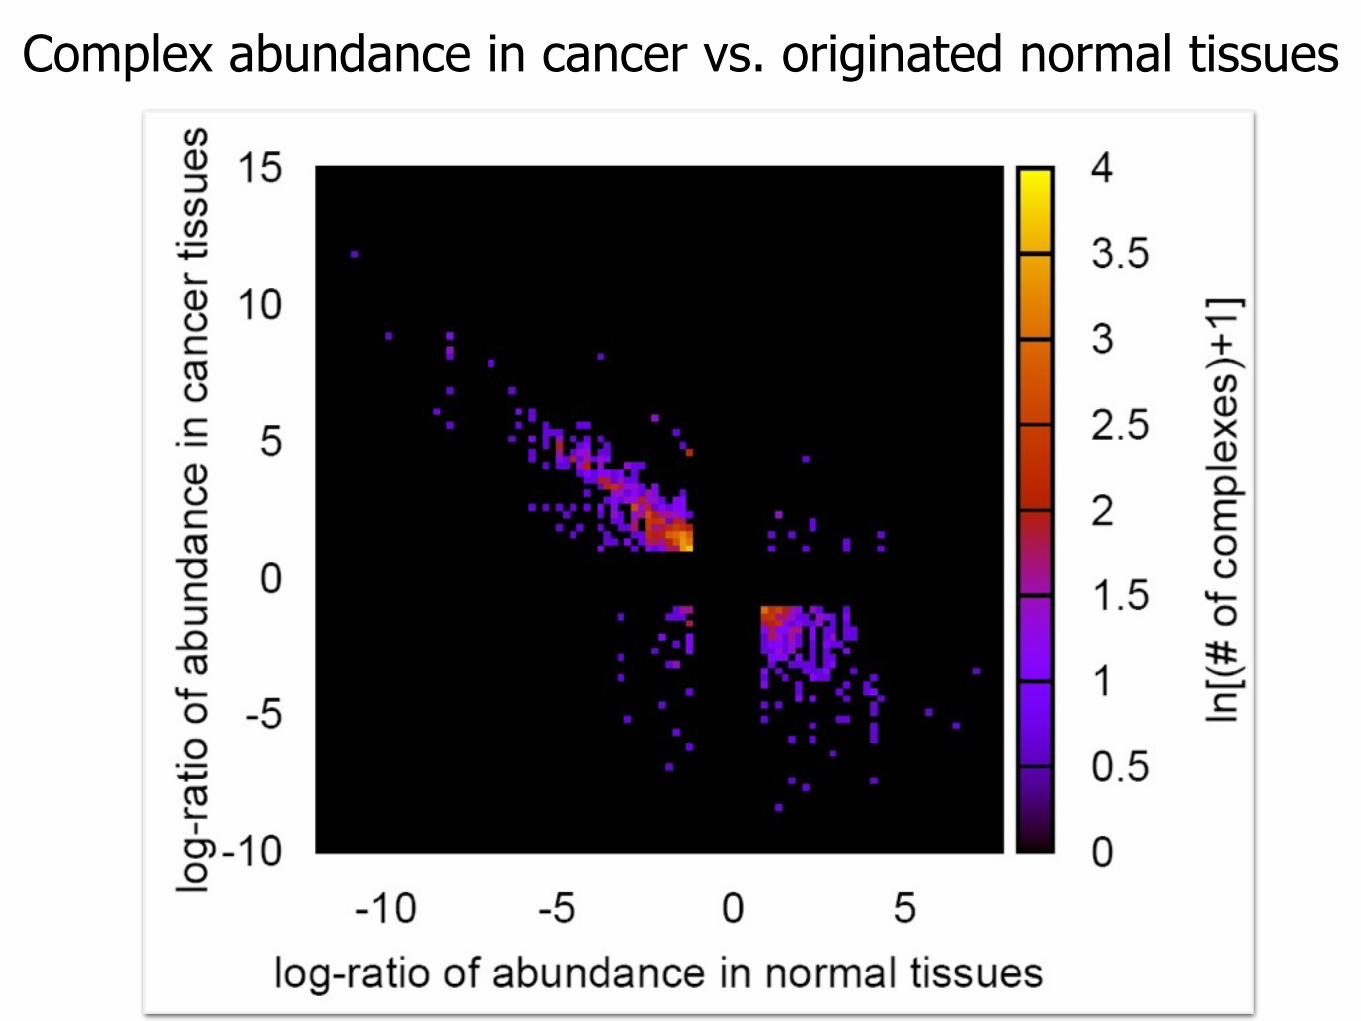
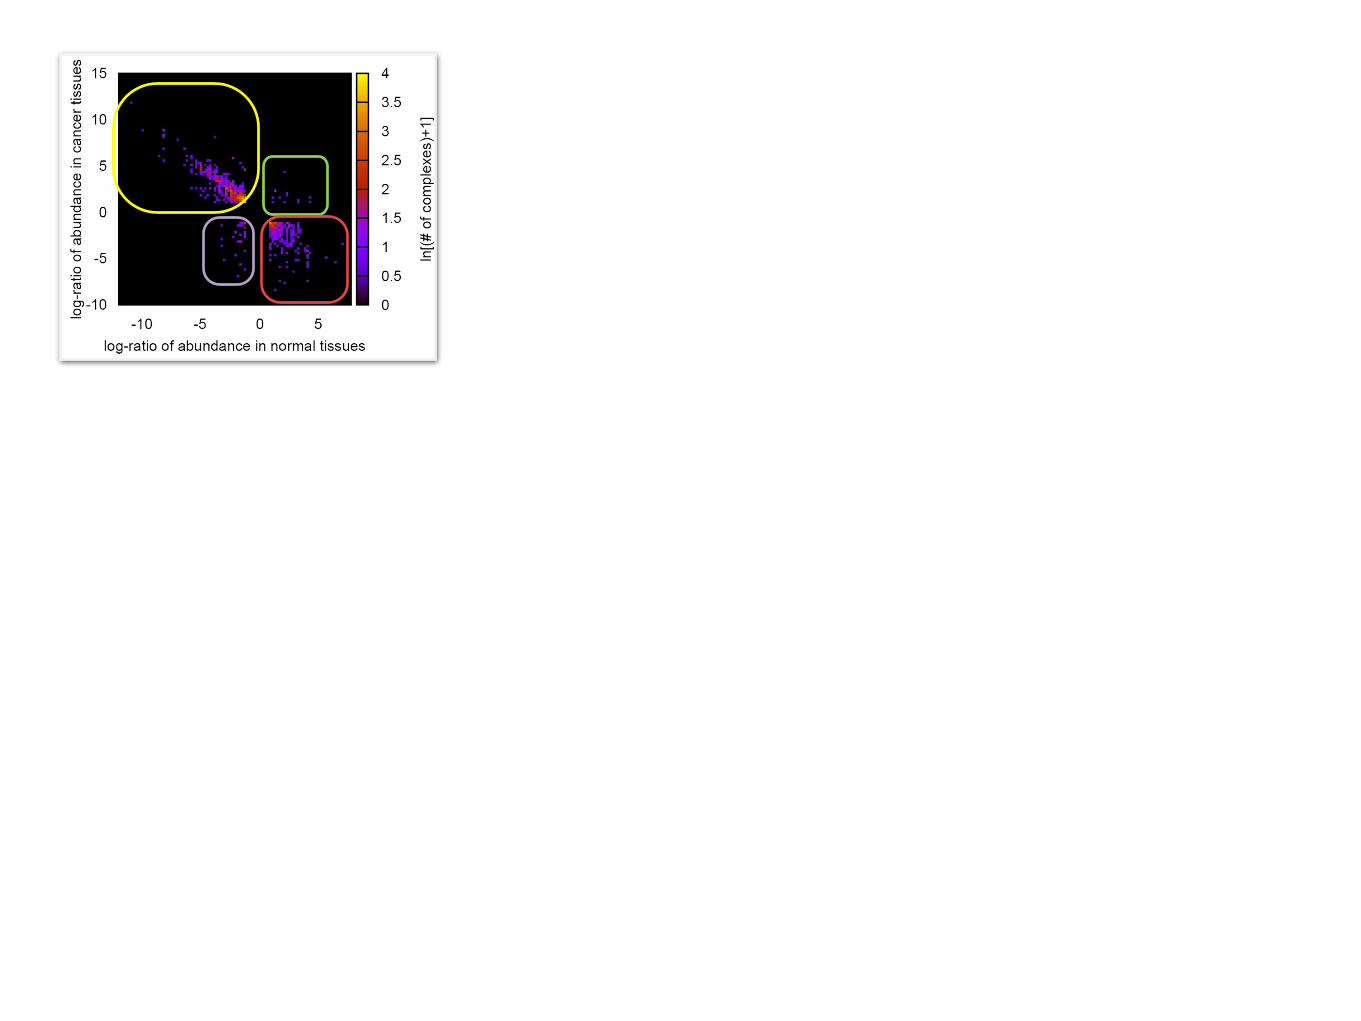
Complex abundance in cancer vs. originated normal tissues
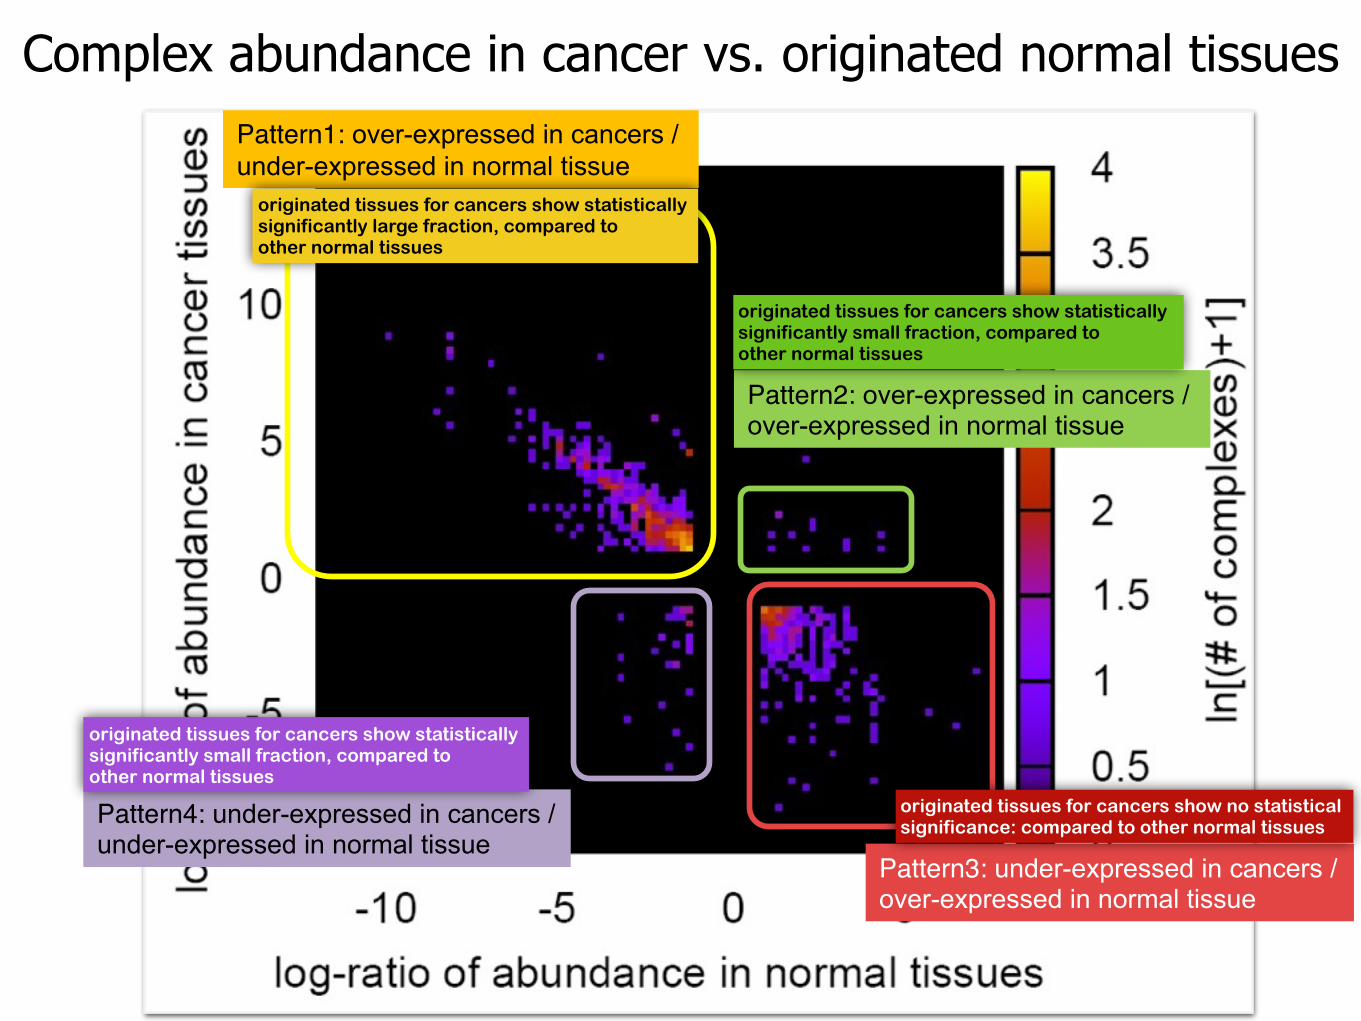
Complex abundance in cancer vs. originated normal tissuesPattern1: over-expressed in cancers /under-expressed in normal tissue
Pattern2: over-expressed in cancers /over-expressed in normal tissue
Pattern4: under-expressed in cancers /under-expressed in normal tissue
Pattern3: under-expressed in cancers /over-expressed in normal tissue
originated tissues for cancers show no statistical significance: compared to other normal tissues
originated tissues for cancers show statistically significantly large fraction, compared to other normal tissues
originated tissues for cancers show statistically significantly small fraction, compared to other normal tissues
originated tissues for cancers show statistically significantly small fraction, compared to other normal tissues
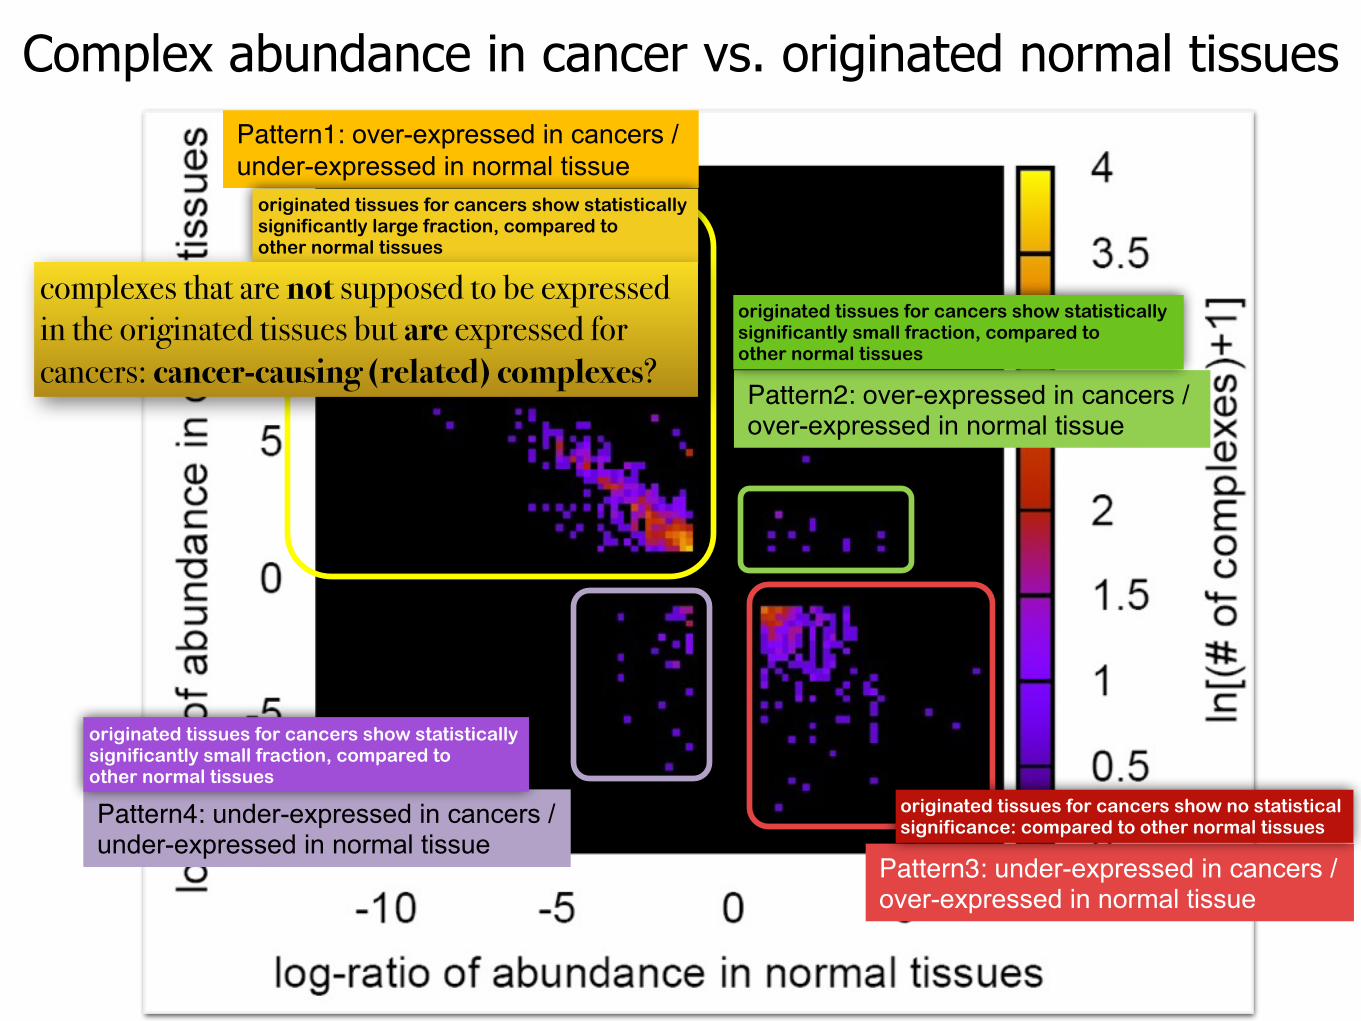
complexes that are not supposed to be expressed in the originated tissues but are expressed for cancers: cancer-causing (related) complexes?
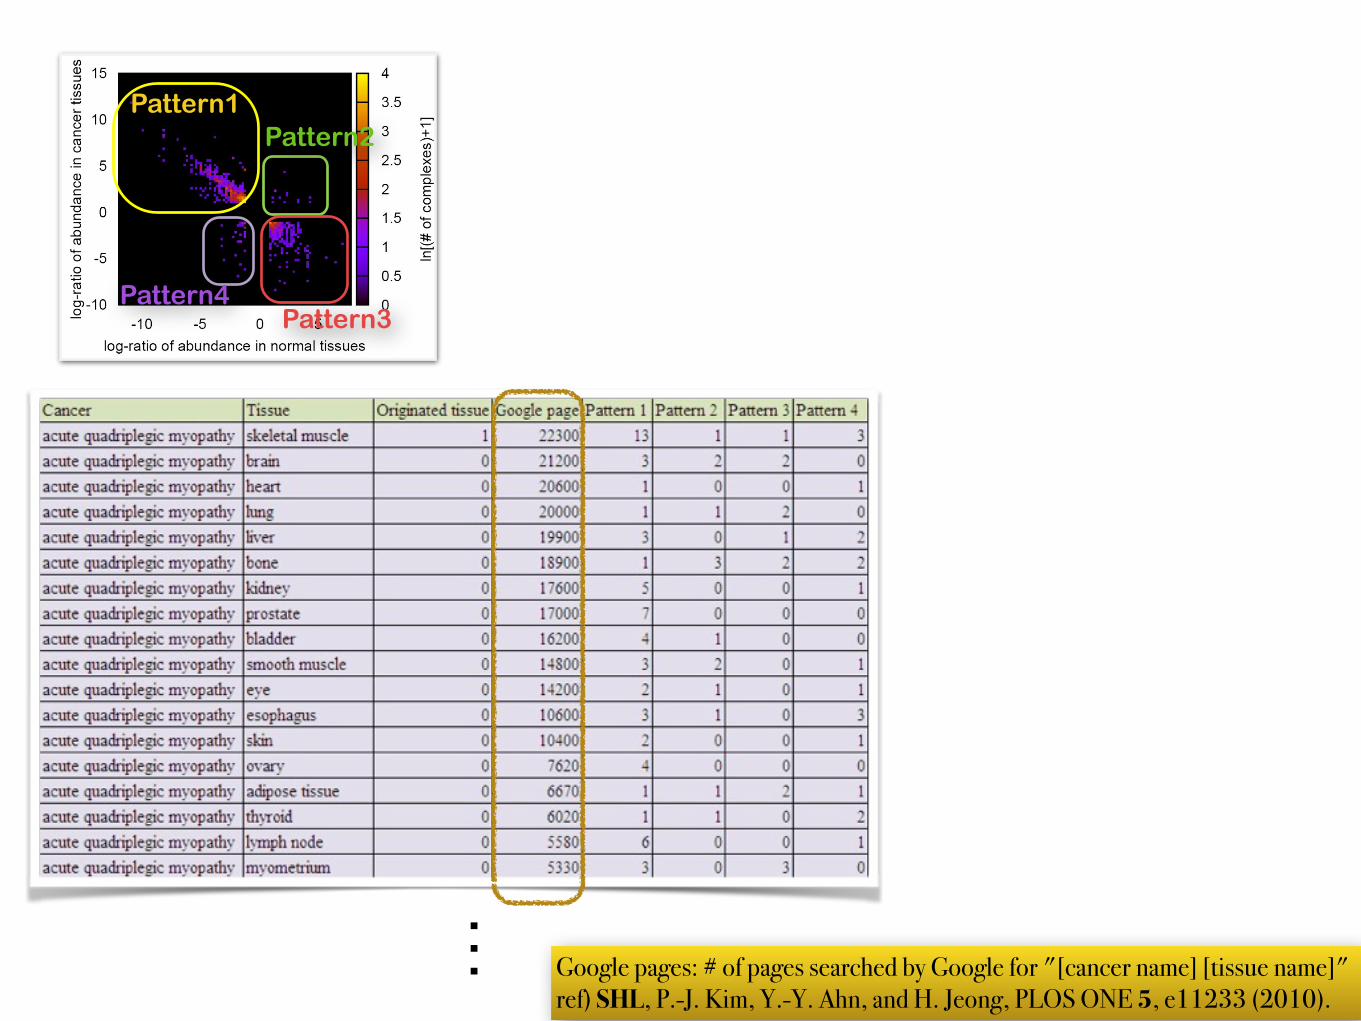
… Google pages: # of pages searched by Google for "[cancer name] [tissue name]" ref) SHL, P.-J. Kim, Y.-Y. Ahn, and H. Jeong, PLOS ONE 5, e11233 (2010).
Pattern1Pattern2
Pattern4Pattern3
… Google pages: # of pages searched by Google for "[cancer name] [tissue name]" ref) SHL, P.-J. Kim, Y.-Y. Ahn, and H. Jeong, PLOS ONE 5, e11233 (2010).
Pattern1Pattern2
Pattern4Pattern3
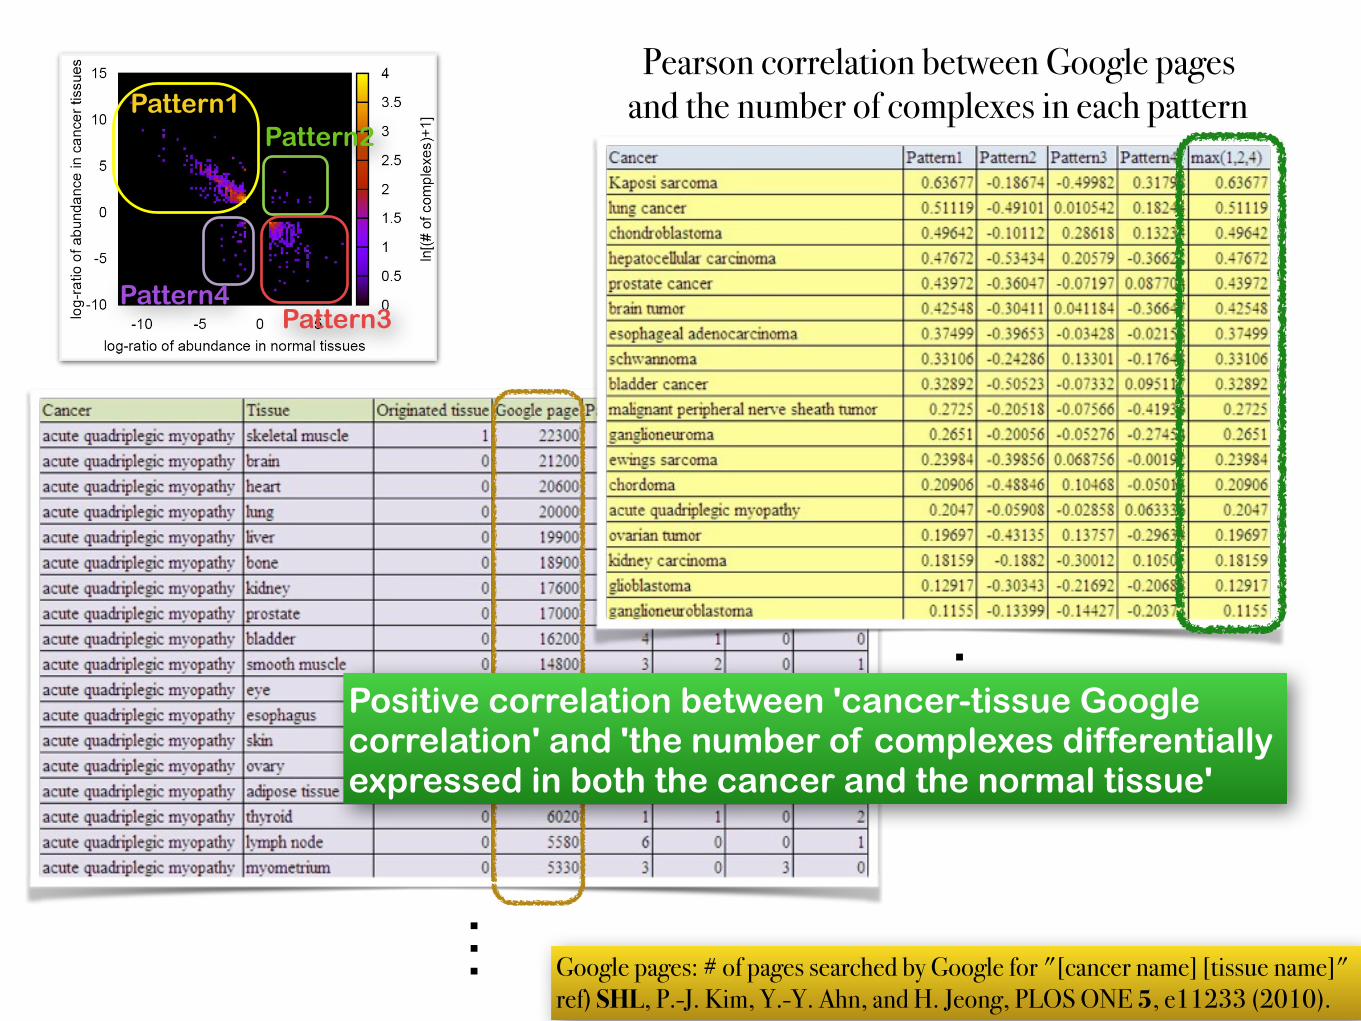
Pearson correlation between Google pages and the number of complexes in each pattern
…Positive correlation between 'cancer-tissue Google correlation' and 'the number of complexes differentially expressed in both the cancer and the normal tissue'

… Google pages: # of pages searched by Google for "[cancer name] [tissue name]" ref) SHL, P.-J. Kim, Y.-Y. Ahn, and H. Jeong, PLOS ONE 5, e11233 (2010).
Pattern1Pattern2
Pattern4Pattern3
Pearson correlation between Google pages and the number of complexes in each pattern
…Positive correlation between 'cancer-tissue Google correlation' and 'the number of complexes differentially expressed in both the cancer and the normal tissue'
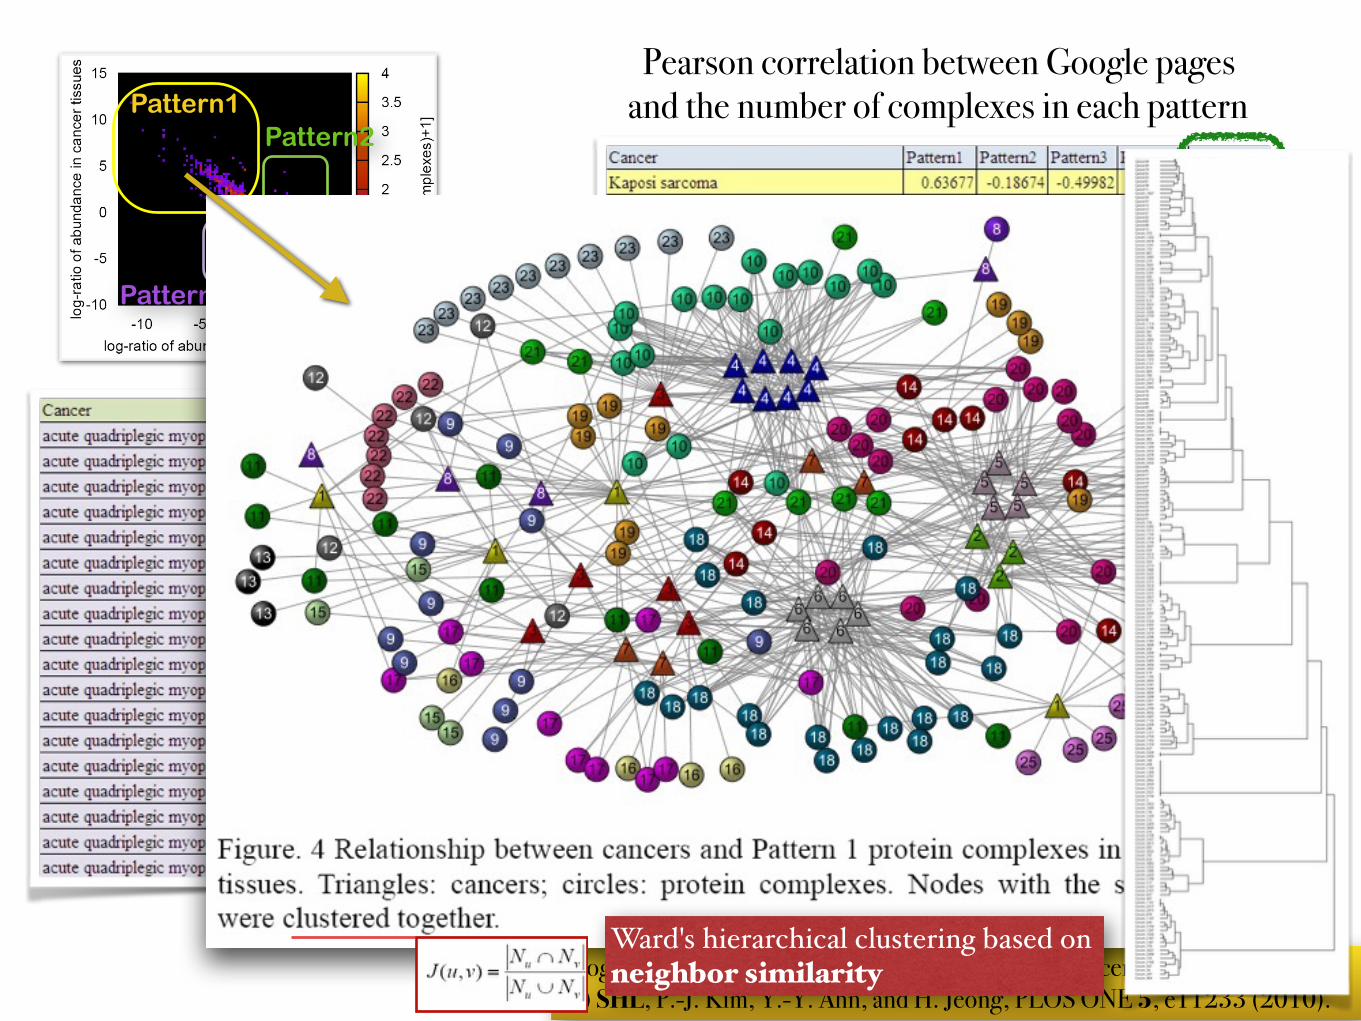
Ward's hierarchical clustering based onneighbor similarity
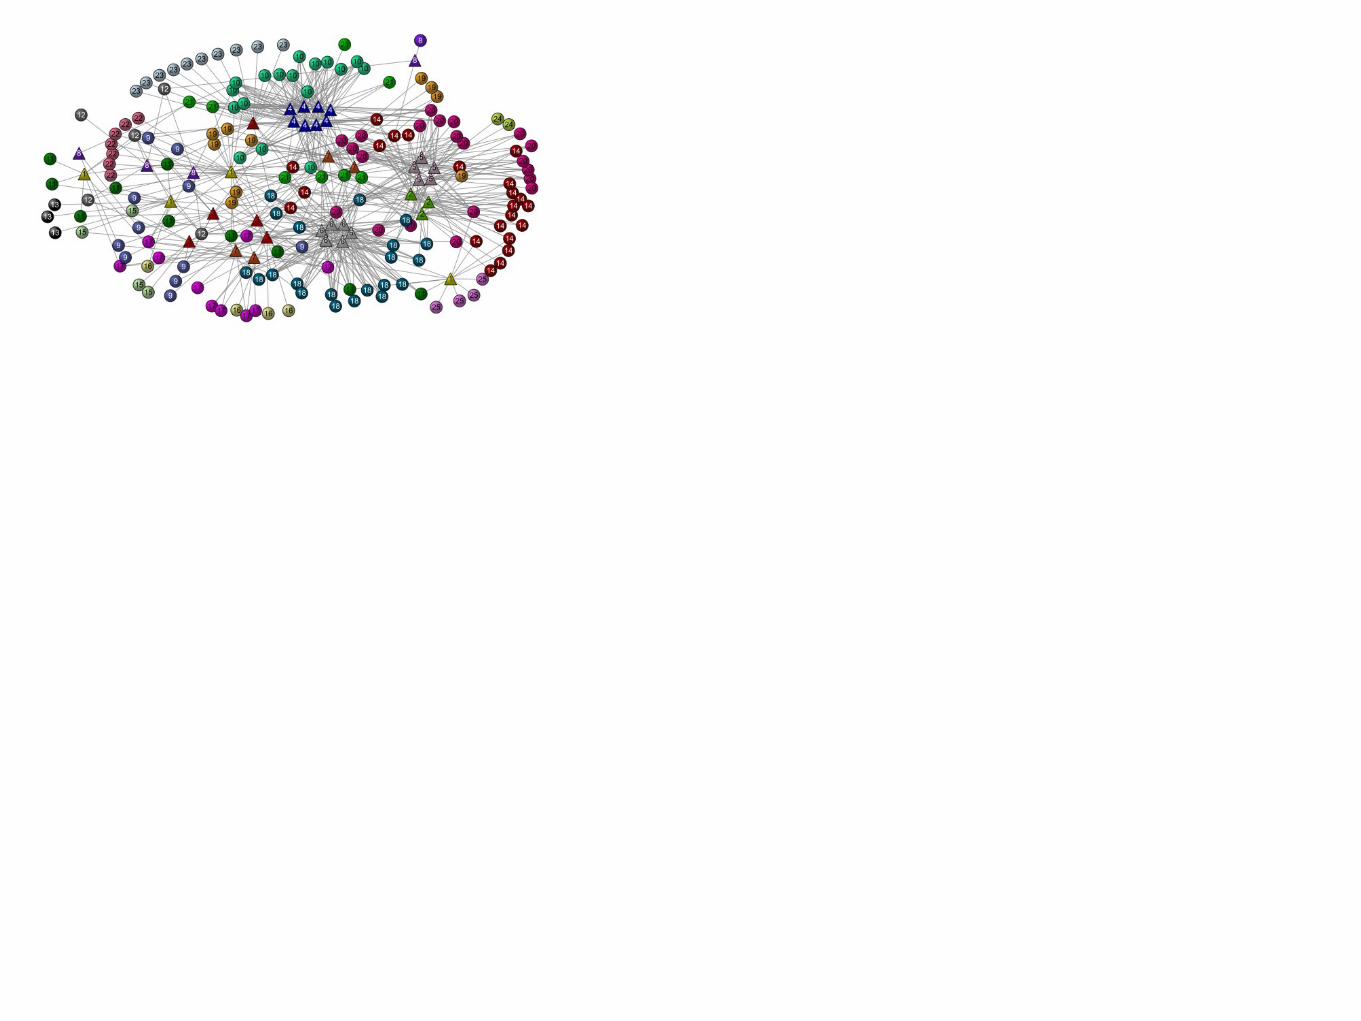
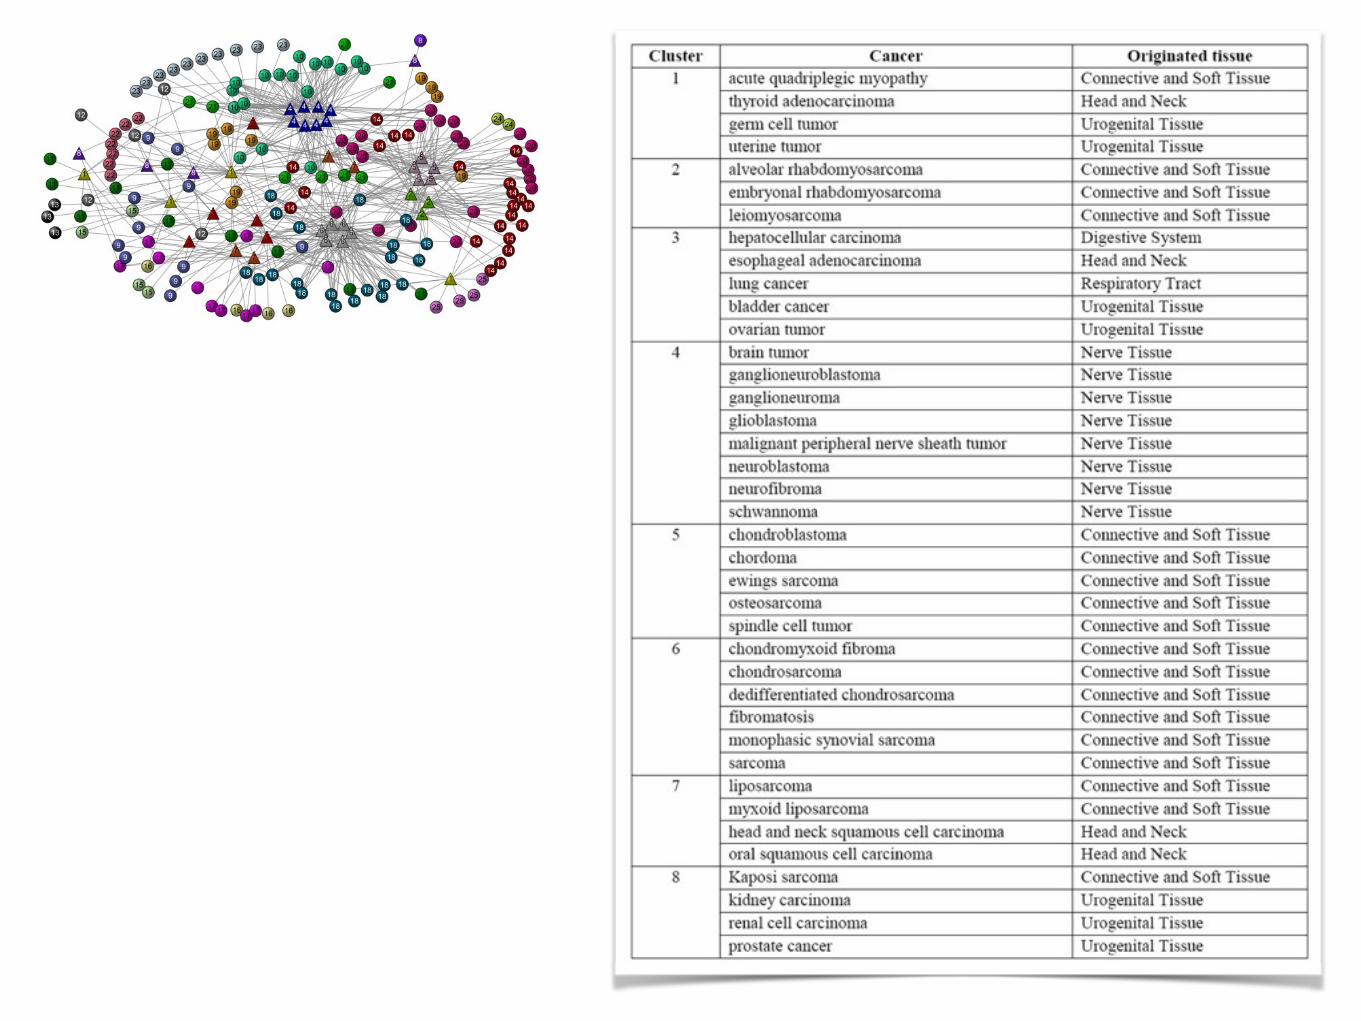
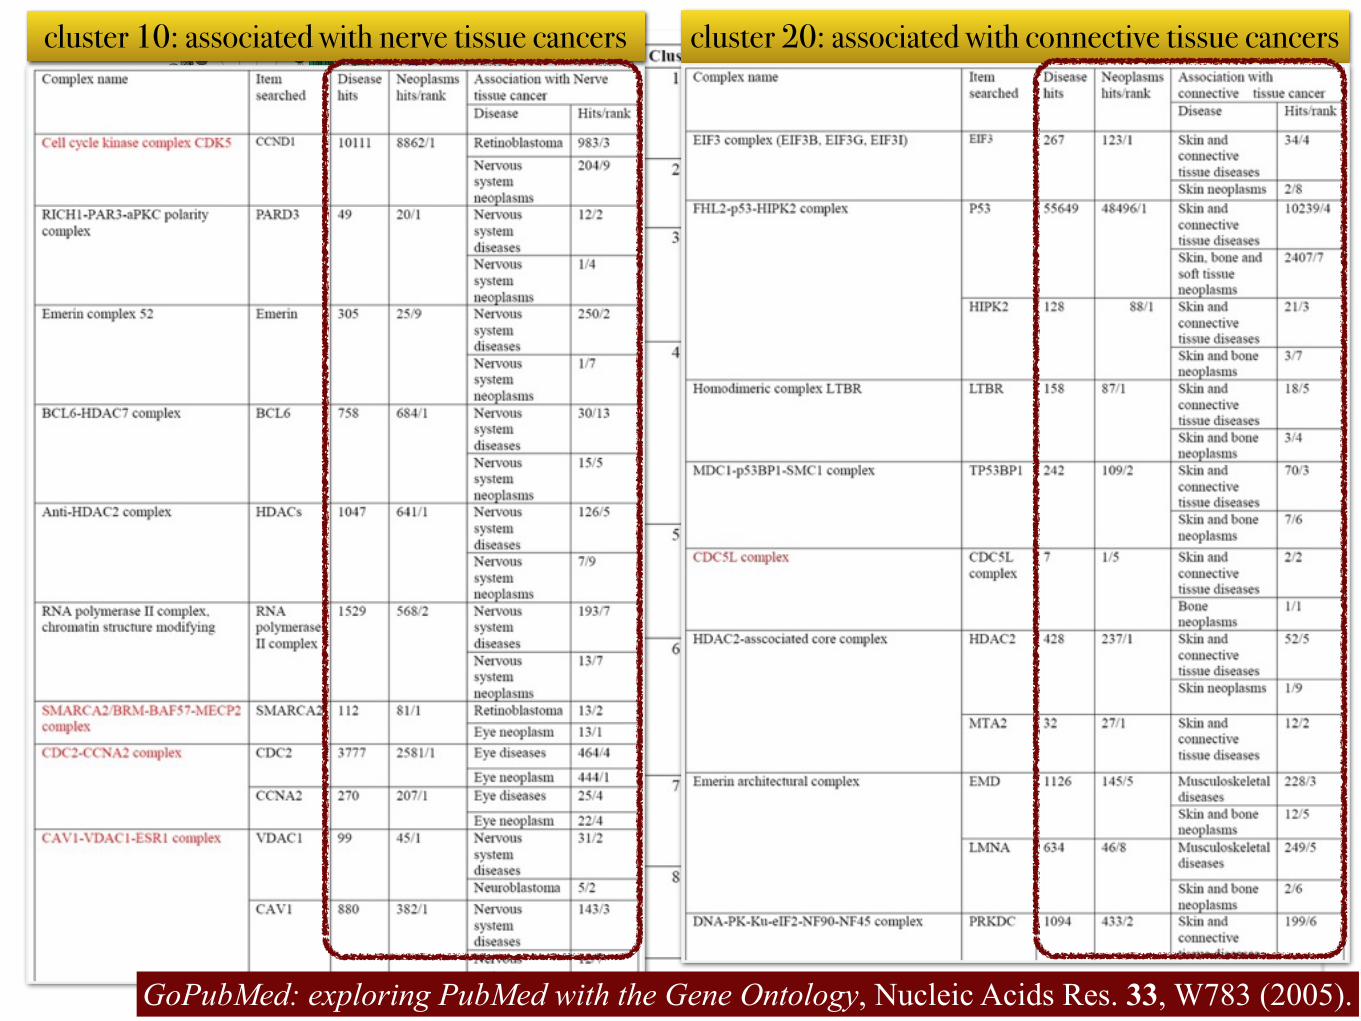
cluster 20: associated with connective tissue cancerscluster 10: associated with nerve tissue cancers
GoPubMed: exploring PubMed with the Gene Ontology, Nucleic Acids Res. 33, W783 (2005).
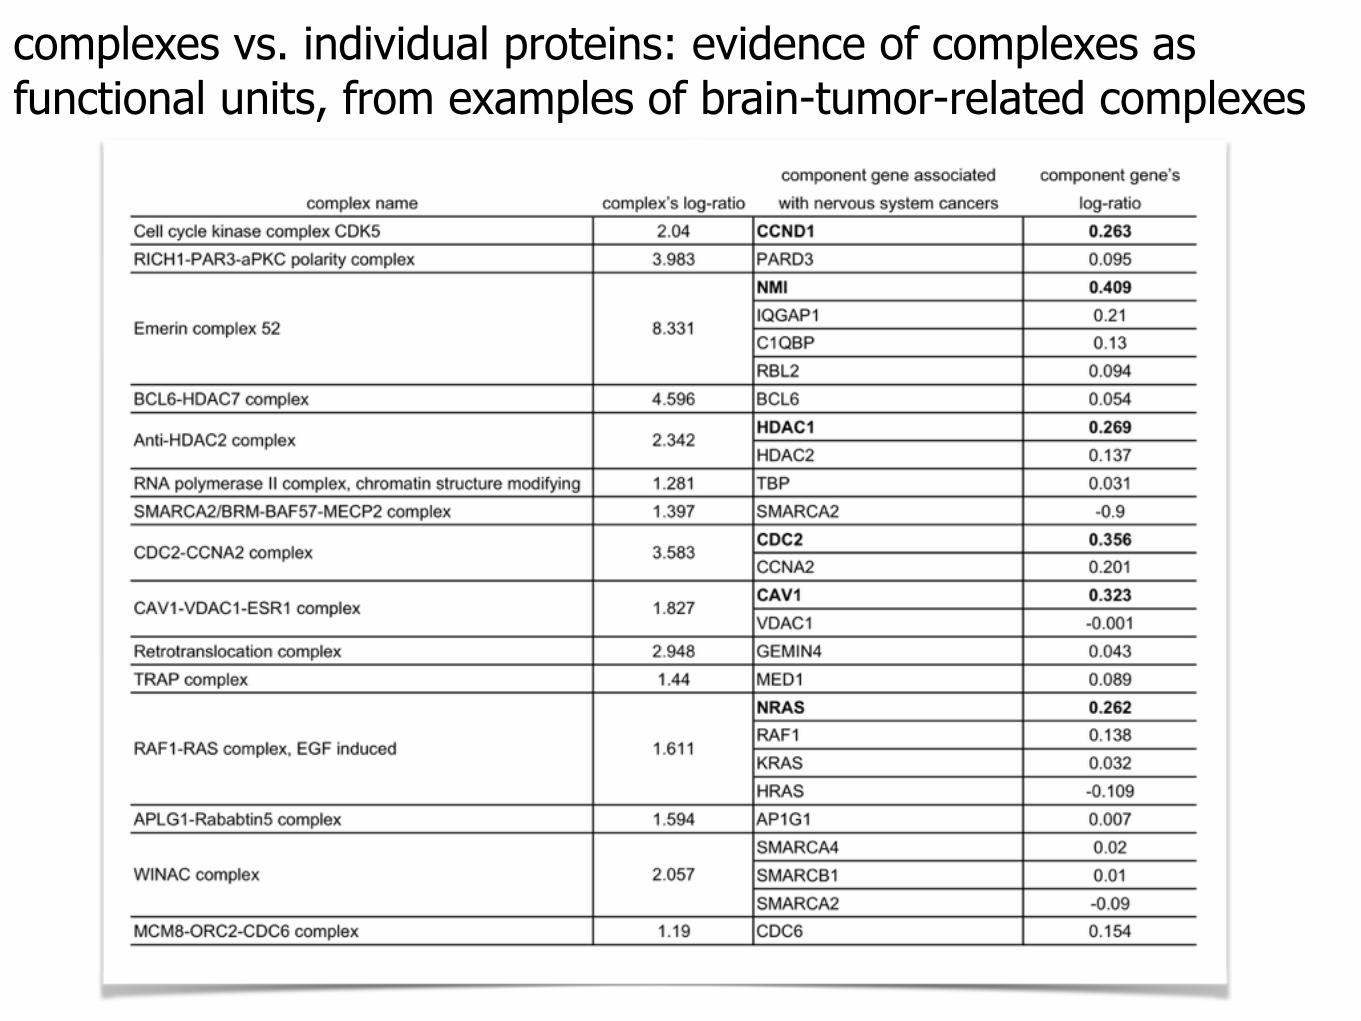
complexes vs. individual proteins: evidence of complexes as functional units, from examples of brain-tumor-related complexes
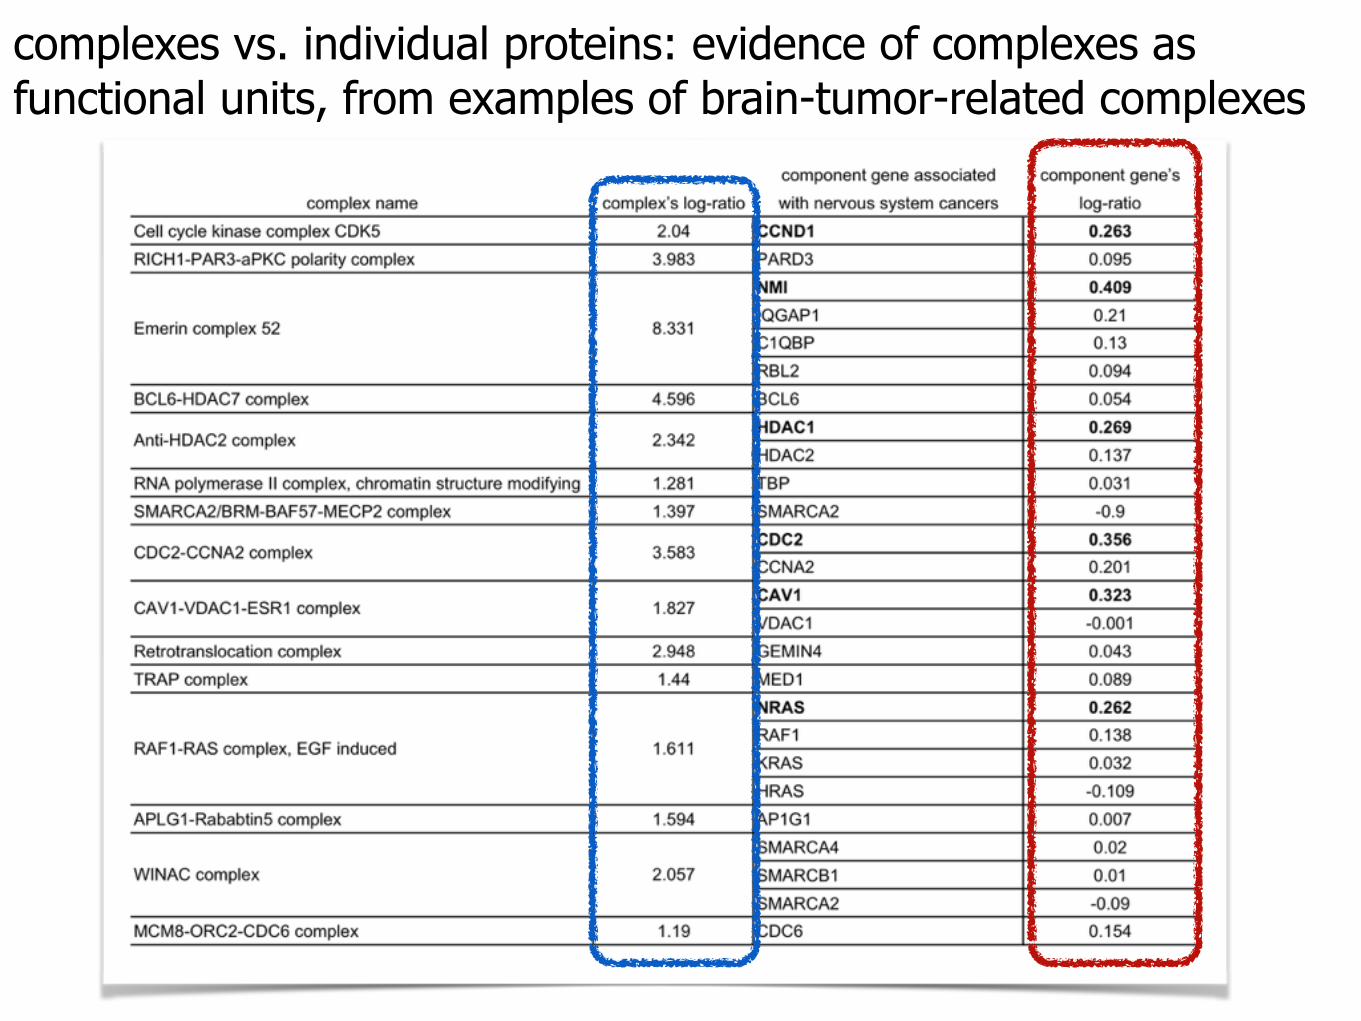
complexes vs. individual proteins: evidence of complexes as functional units, from examples of brain-tumor-related complexes
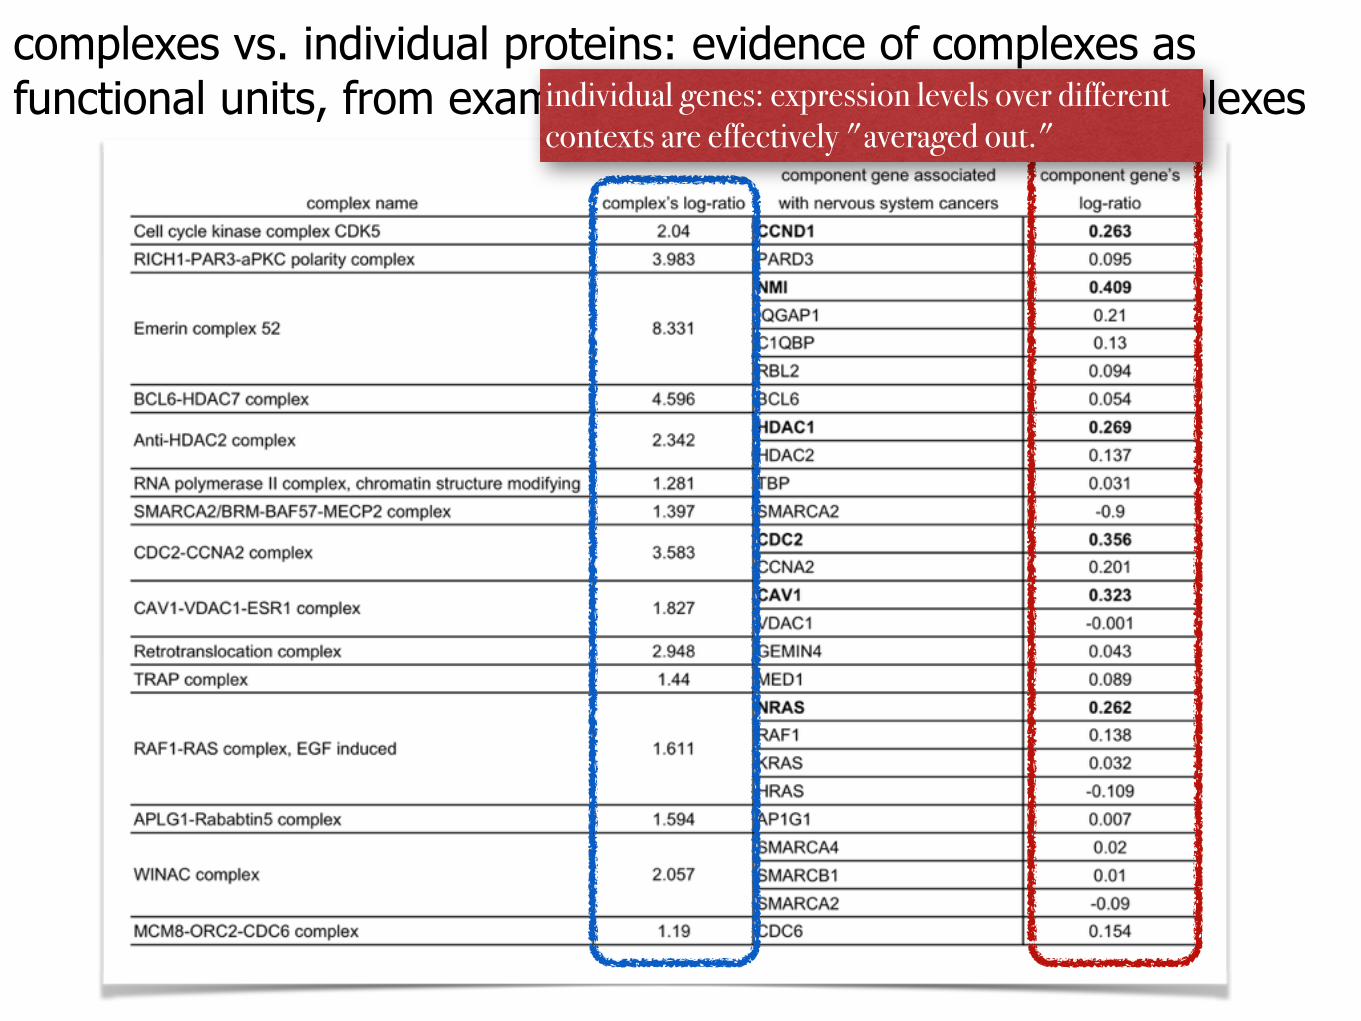
complexes vs. individual proteins: evidence of complexes as functional units, from examples of brain-tumor-related complexesindividual genes: expression levels over different
contexts are effectively "averaged out."
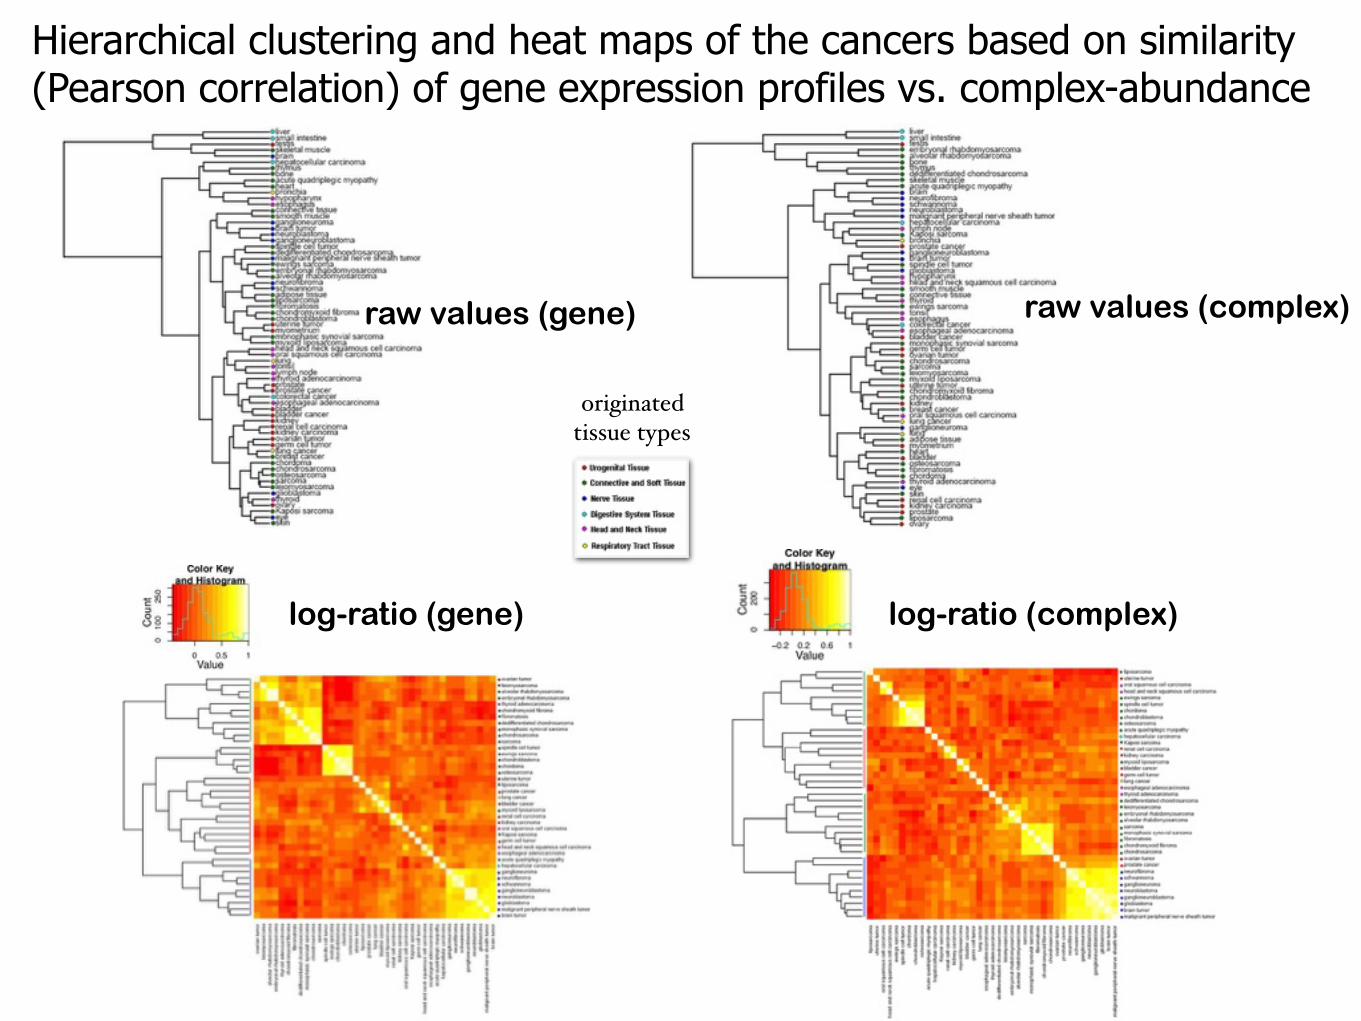
Hierarchical clustering and heat maps of the cancers based on similarity (Pearson correlation) of gene expression profiles vs. complex-abundance
raw values (gene) raw values (complex)
log-ratio (gene) log-ratio (complex)
originated tissue types
Hierarchical clustering and heat maps of the cancers based on similarity (Pearson correlation) of gene expression profiles vs. complex-abundance
raw values (gene) raw values (complex)
log-ratio (gene) log-ratio (complex)
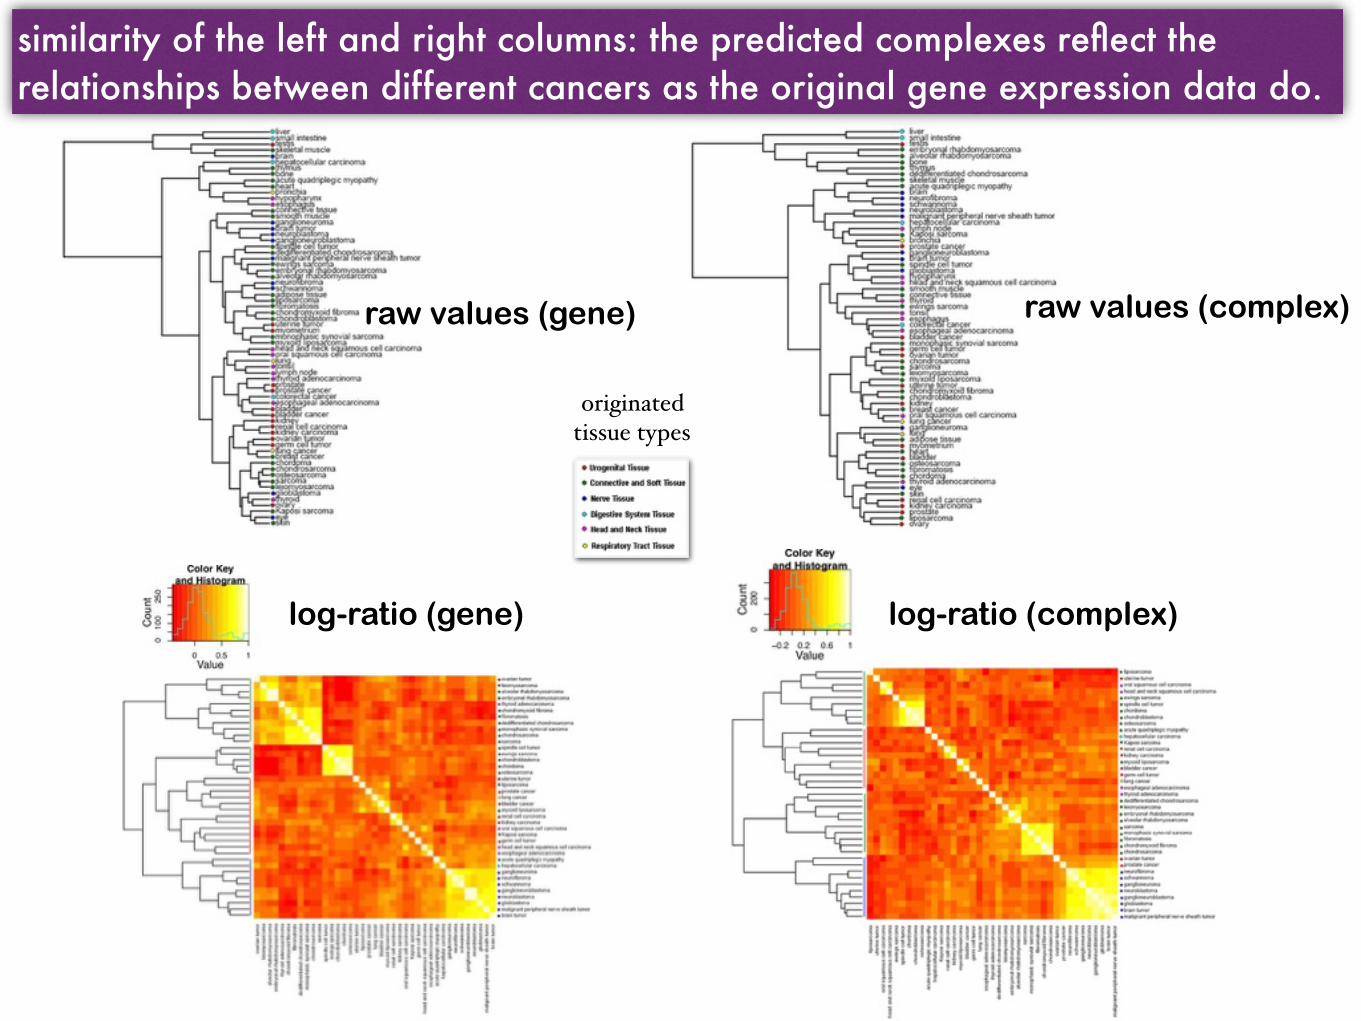
similarity of the left and right columns: the predicted complexes reflect the relationships between different cancers as the original gene expression data do.
originated tissue types
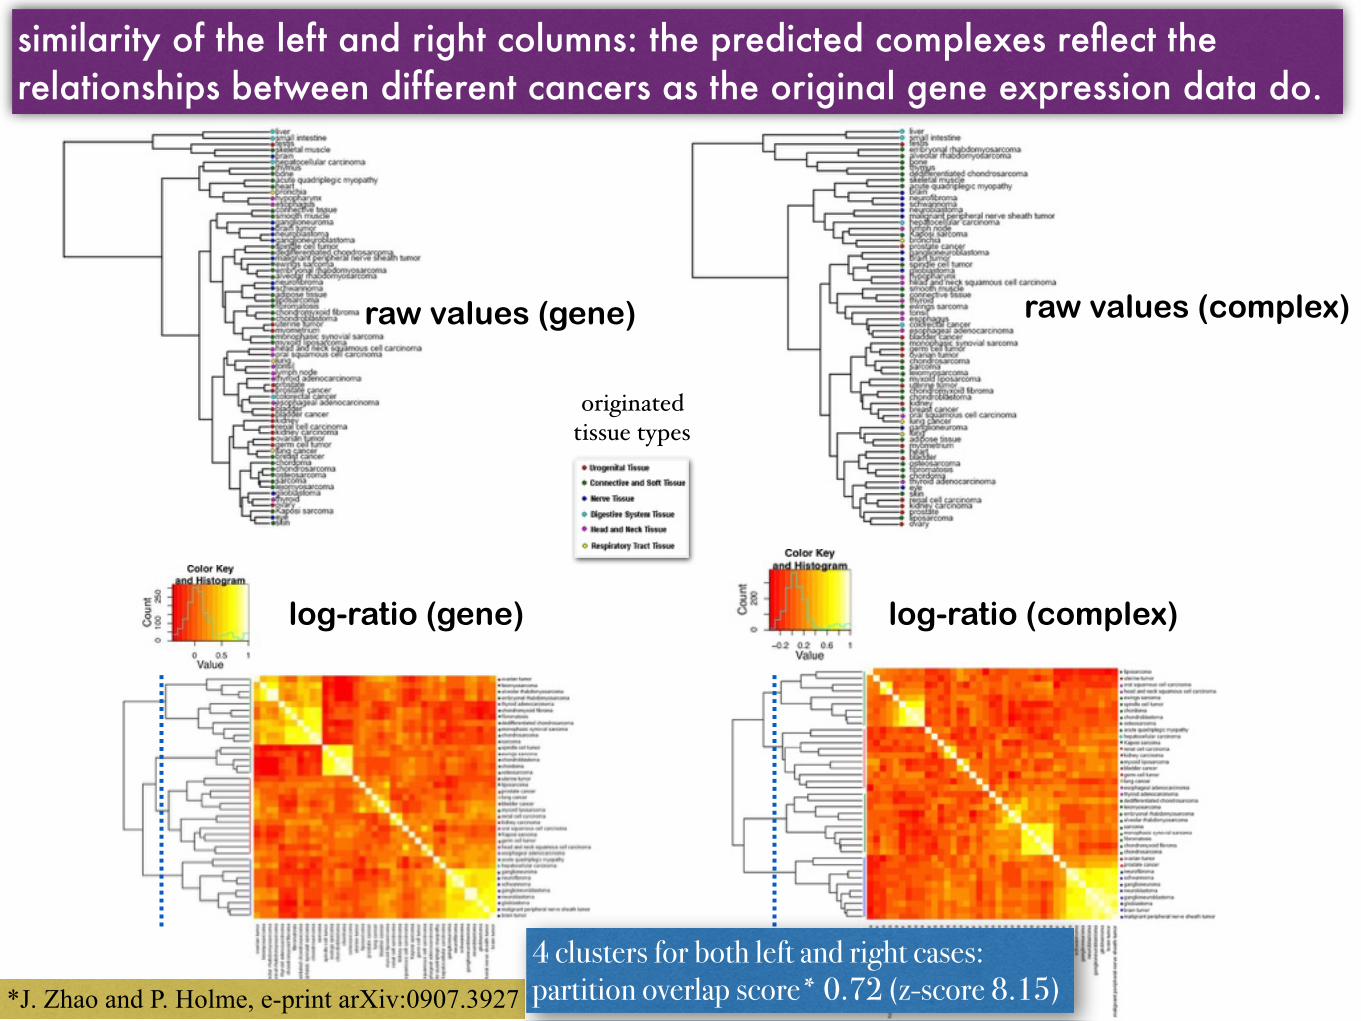
Hierarchical clustering and heat maps of the cancers based on similarity (Pearson correlation) of gene expression profiles vs. complex-abundance
raw values (gene) raw values (complex)
log-ratio (gene) log-ratio (complex)
similarity of the left and right columns: the predicted complexes reflect the relationships between different cancers as the original gene expression data do.
originated tissue types
*J. Zhao and P. Holme, e-print arXiv:0907.3927
4 clusters for both left and right cases: partition overlap score* 0.72 (z-score 8.15)
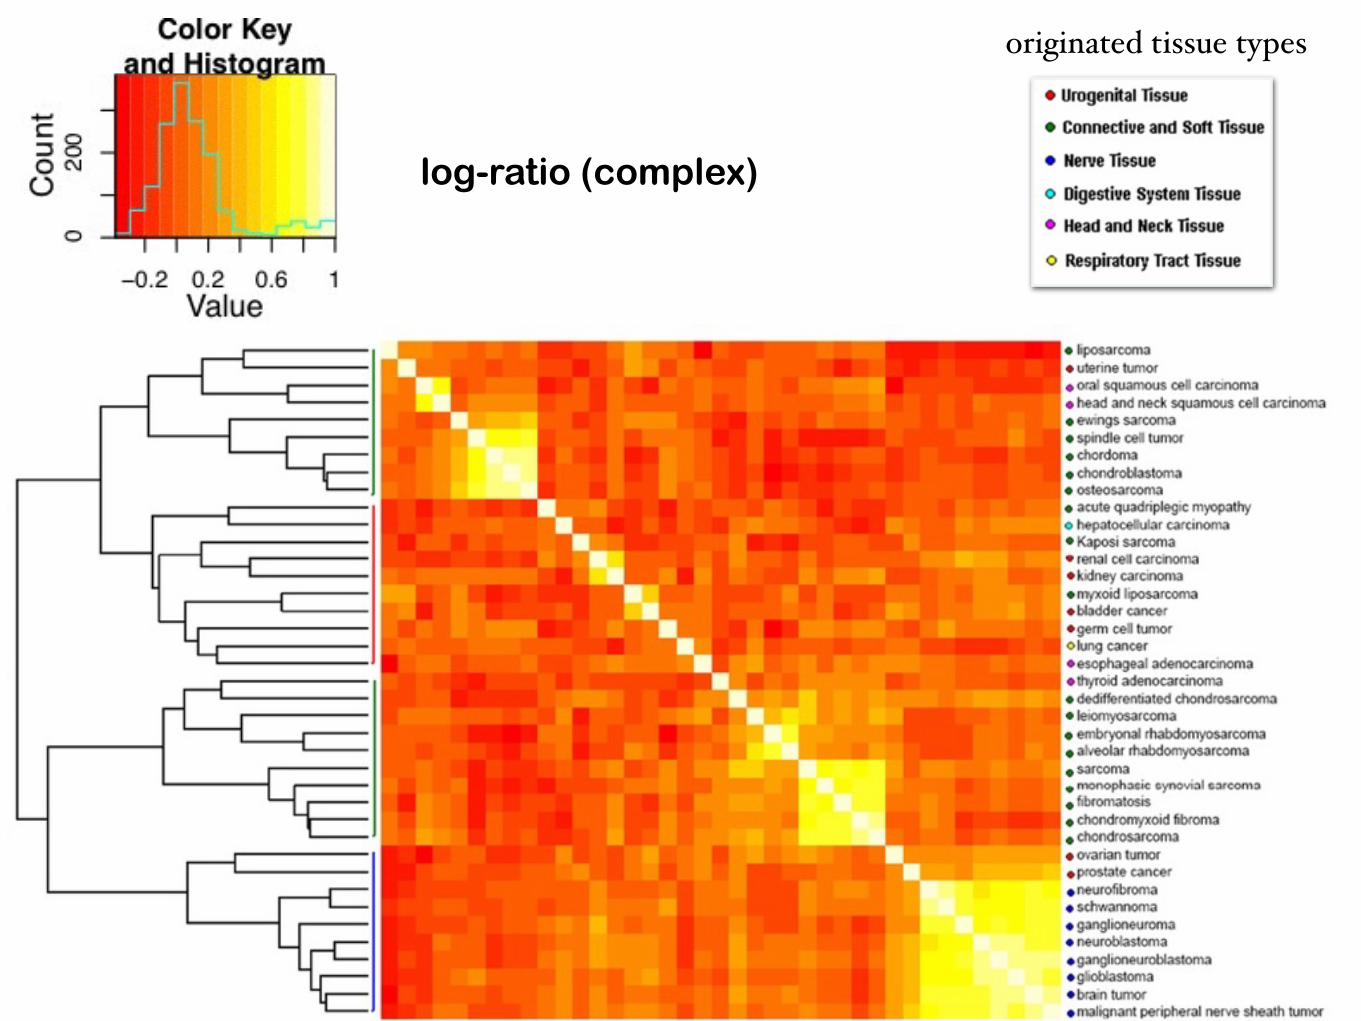
originated tissue types
log-ratio (complex)
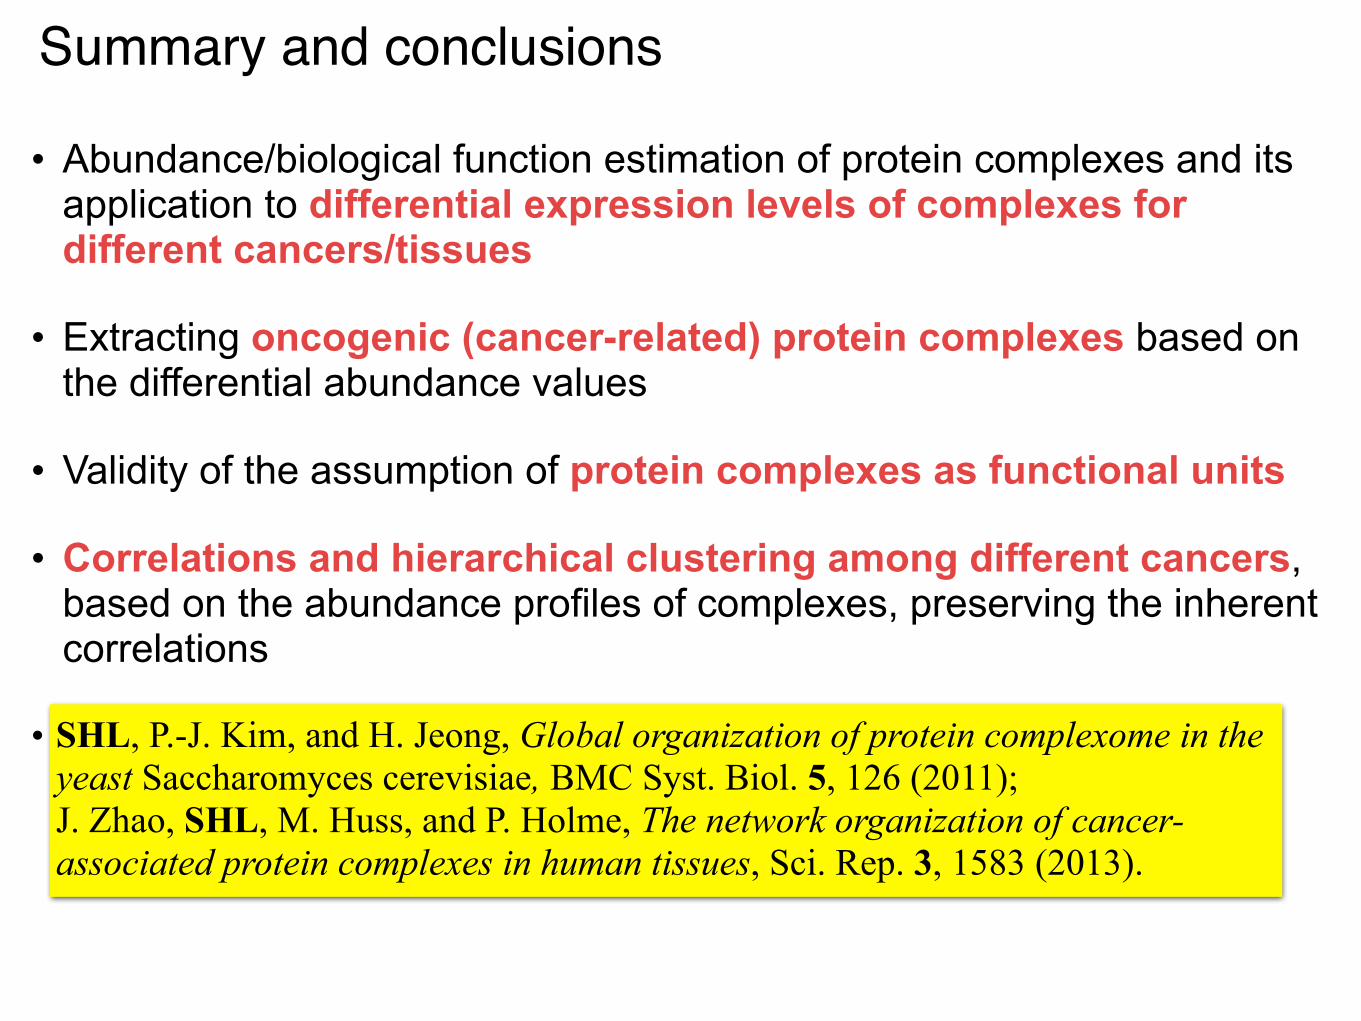
Summary and conclusions
• Abundance/biological function estimation of protein complexes and its application to differential expression levels of complexes for different cancers/tissues
• Extracting oncogenic (cancer-related) protein complexes based on the differential abundance values
• Validity of the assumption of protein complexes as functional units
• Correlations and hierarchical clustering among different cancers, based on the abundance profiles of complexes, preserving the inherent correlations
• SHL, P.-J. Kim, and H. Jeong, Global organization of protein complexome in the yeast Saccharomyces cerevisiae, BMC Syst. Biol. 5, 126 (2011);J. Zhao, SHL, M. Huss, and P. Holme, The network organization of cancer-associated protein complexes in human tissues, Sci. Rep. 3, 1583 (2013).