Embed Size (px)
Citation preview

Research to Inform Design of a 3E
National REDD+ Architecture

Information: - Carbon - Non-carbon
benefits - Costs - Equity
perceptions
Analyses: - Policy Networks - MRV - Costs of policy
and measures - Operationalizing
Safeguards - Multi-level
Governance - Assessing sub-
national initiatives
- Role of rights and tenure
- Options for design of equitable benefit sharing mechanisms
REDD+ architecture
Effectiveness, efficiency and welfare of policies and measures in Brazil Amazon
• Implementation costs vary across space
• C&C policy can achieve high conservation gains at low costs to government but at high costs to land users
• PES incentives can improve equity outcomes of C&C
• Policy mix of ‘carrots’ (PES/ REDD+) with ‘sticks’ (C&C) can be fairer than when either instrument is applied in isolation
Borner, J., Wunder, S. and Marinho, E. (2015)

Deriving experiences from other sectors for negotiating benefit sharing options
• Cash may be more a more efficient and effective incentive than in-kind transfers, and better supports local wellbeing (CCT)
• Intermediaries play an important in managing cross-scale transactions (PES)
• Slow policy development at local levels has led to ad hoc arrangements where non-monetary benefits are predominant (MLG)
Efficiency
• There are risks of elite capture in local distribution of benefits (Vietnam)
• Legitimacy of BS arrangements vary – without which, potential benefits may manifest as burdens (MLG)
• Significant time, planning and compromises are involved in inclusive multi-stakeholder process (FLEGT)
• Dispute resolution mechanisms & transparency are key (FLEGT, Standards)
Equity
• Performance-based payments may not be able to compete with the opportunity costs in areas of high deforestation rates (PES)
• Conditionalities and stringent criteria for identifying target groups increase effectiveness but are costly (CCT)
• Allocation of rights may be more effective than performance or input based incentives in situations where incentives do not reflect true transaction and opportunity costs (CF)
Effectiveness
Loft et al. 2014; Wong 2014; Gebara et al. 2014; Kowler et al. 2014; Nawir et al. 2015.
Forthcoming: Arwida et al.; Tjajadi et al.; Yang et al.
THINKING beyond the canopy
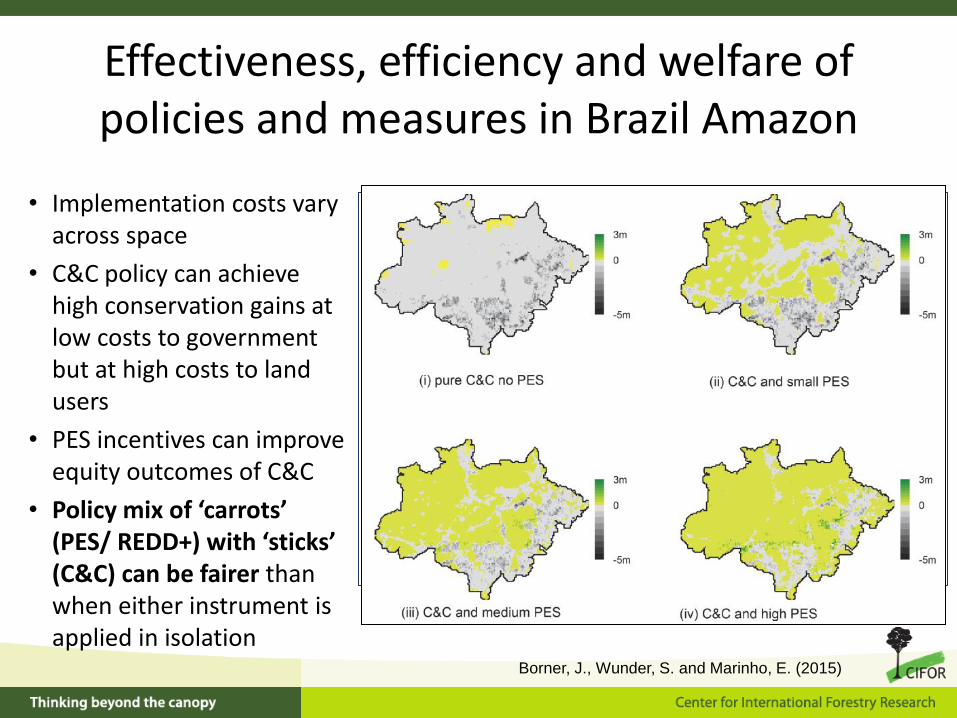
IPCC emission factors for greenhouse gas
inventories in tropical peatlands Louis Verchot and Kristell Hergoualc’h
RIHN Visit 3 March 2016

THINKING beyond the canopy
GHG emissions in peatlands
Kristell
Hergoualc’h
Sebastian Persch

C-CO2 Emission Factors for Tropical Peatlands
Land use Category EF (tC ha-1 y-1)
Forest Land and cleared Forest Land (shrublands), drained
5.3
Plantation (long rotation) 15
Plantation - short rotation (Acacia) 20
Plantation - shallow drained (Sago) 1.5
Plantation – oil palm 11
Cropland 14
Cropland - rice 6.1
Grassland 9.6
Peat extraction 2.0
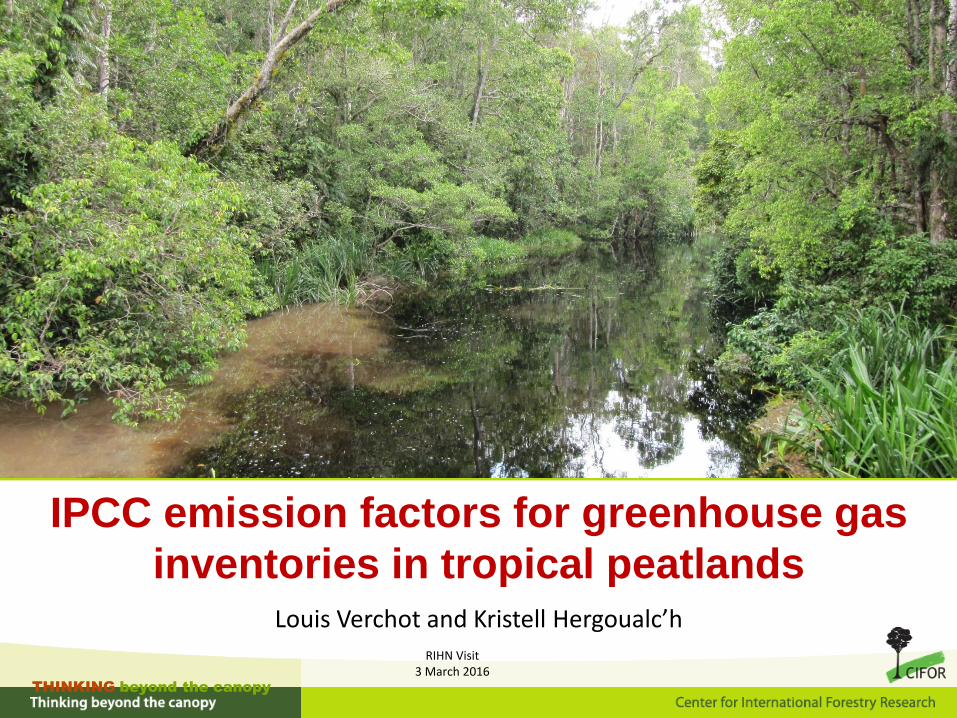
Why are the new EFs important to Indonesia?
Indonesian peatlands
50% of tropical peatlands (Page et al., 2011)
Among the largest C pools on earth
90% C stored in the peat (Murdiyarso et al., 2009)
GHG emissions from LUC & fires
Large amounts of CO2 lost from the soil
Peat C loss contribute more than 63% to
total C loss (Hergoualc’h & Verchot, 2011)
Lack of guidance for GHG accounting
especially for the soil e.g. IPCC guidelines (2006)


![#FDL 3E 4PVUIàFME 3E /PWJ .* 4PVUIàFME · 27/8/2019 · Seafood (**'+/%#]+9'9+#@+;](https://img.pdfslide.us/doc/110x75/5f54ac5e2affe13365122fd0/fdl-3e-4pvuifme-3e-pwj-4pvui-2782019-seafood-99.jpg)