Embed Size (px)
Citation preview
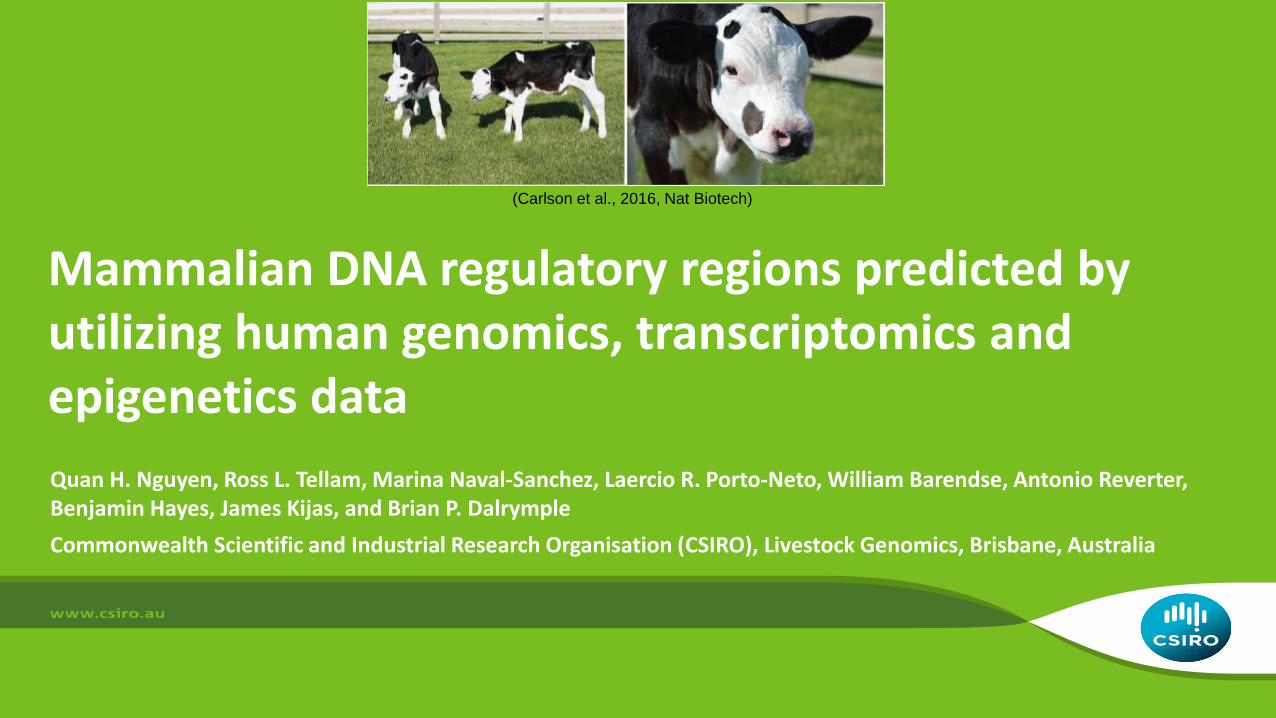
Mammalian DNA regulatory regions predicted by utilizing human genomics, transcriptomics and epigenetics data
Quan H. Nguyen, Ross L. Tellam, Marina Naval-Sanchez, Laercio R. Porto-Neto, William Barendse, Antonio Reverter, Benjamin Hayes, James Kijas, and Brian P. Dalrymple
Commonwealth Scientific and Industrial Research Organisation (CSIRO), Livestock Genomics, Brisbane, Australia
(Carlson et al., 2016, Nat Biotech)
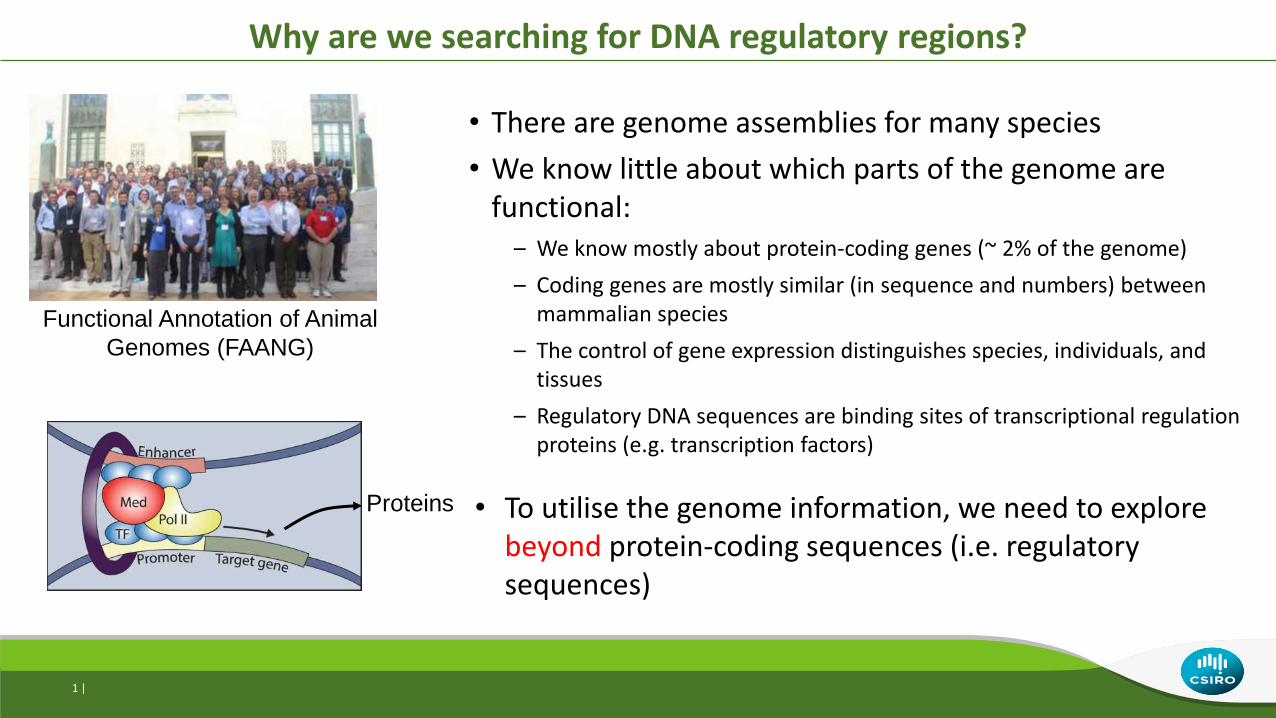
Why are we searching for DNA regulatory regions?
• There are genome assemblies for many species
• We know little about which parts of the genome are functional:– We know mostly about protein-coding genes (~ 2% of the genome)
– Coding genes are mostly similar (in sequence and numbers) between mammalian species
– The control of gene expression distinguishes species, individuals, and tissues
– Regulatory DNA sequences are binding sites of transcriptional regulation proteins (e.g. transcription factors)
1 |
• To utilise the genome information, we need to explore beyond protein-coding sequences (i.e. regulatory sequences)
Functional Annotation of Animal
Genomes (FAANG)
Proteins
2 |
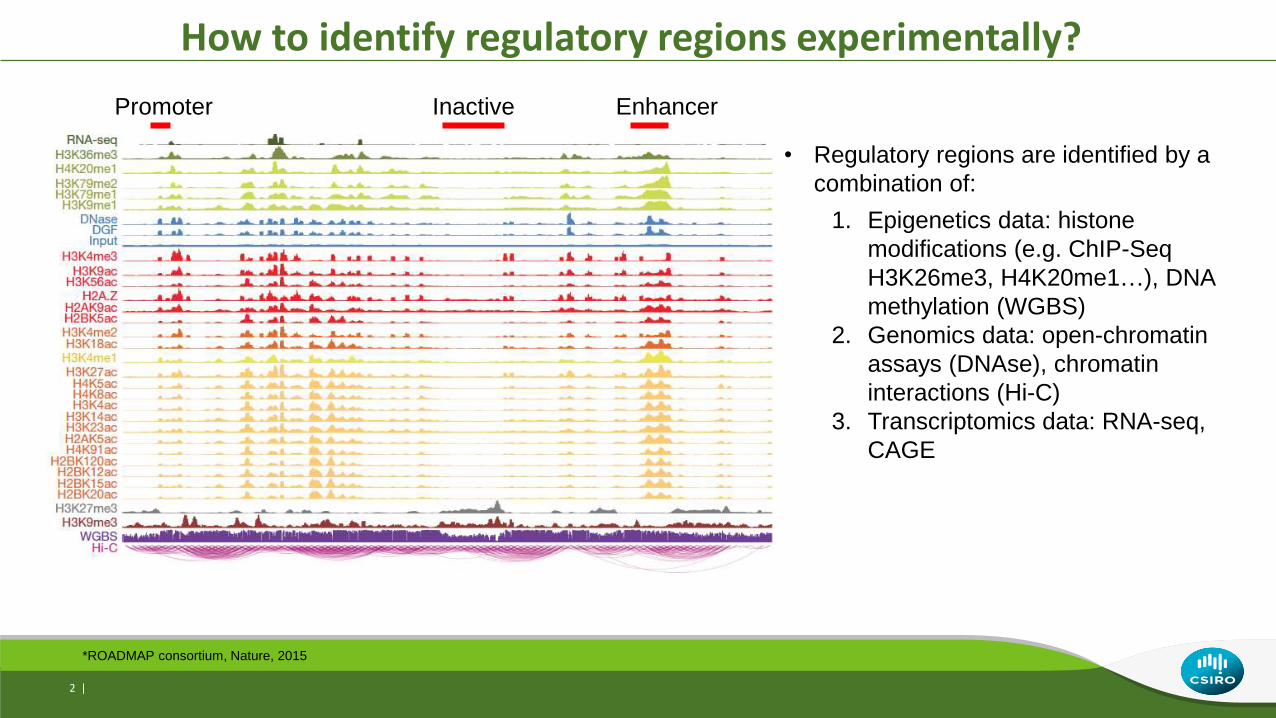
How to identify regulatory regions experimentally?
• Regulatory regions are identified by a
combination of:
1. Epigenetics data: histone
modifications (e.g. ChIP-Seq
H3K26me3, H4K20me1…), DNA
methylation (WGBS)
2. Genomics data: open-chromatin
assays (DNAse), chromatin
interactions (Hi-C)
3. Transcriptomics data: RNA-seq,
CAGE
*ROADMAP consortium, Nature, 2015
Promoter Inactive Enhancer
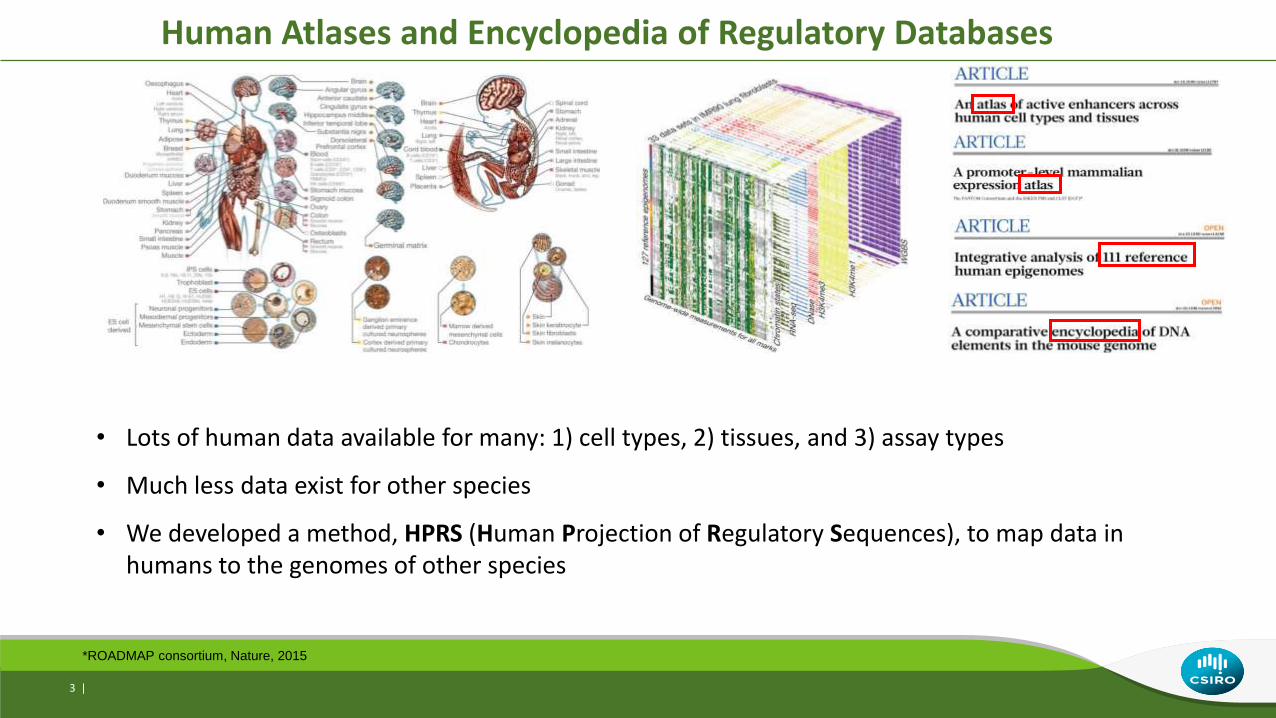
Human Atlases and Encyclopedia of Regulatory Databases
• Lots of human data available for many: 1) cell types, 2) tissues, and 3) assay types
• Much less data exist for other species
• We developed a method, HPRS (Human Projection of Regulatory Sequences), to map data in humans to the genomes of other species
3 |
*ROADMAP consortium, Nature, 2015
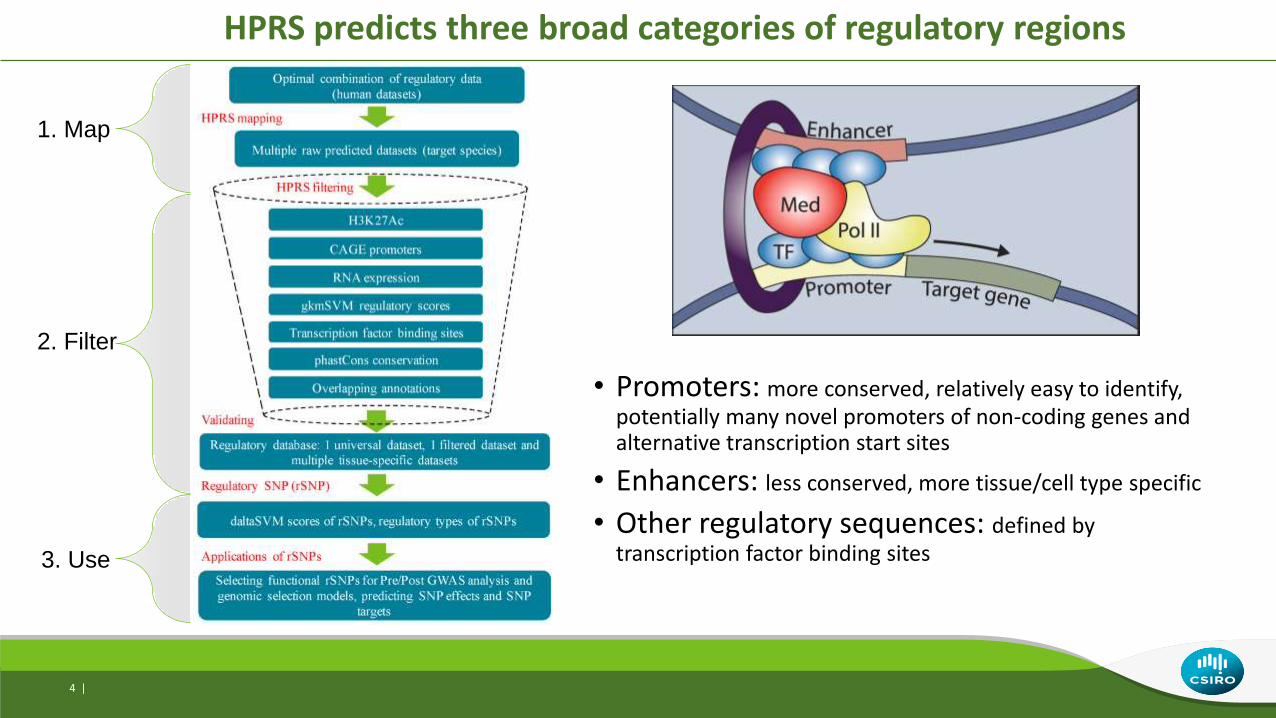
HPRS predicts three broad categories of regulatory regions
• Promoters: more conserved, relatively easy to identify, potentially many novel promoters of non-coding genes and alternative transcription start sites
• Enhancers: less conserved, more tissue/cell type specific
• Other regulatory sequences: defined by transcription factor binding sites
4 |
1. Map
2. Filter
3. Use
5 |
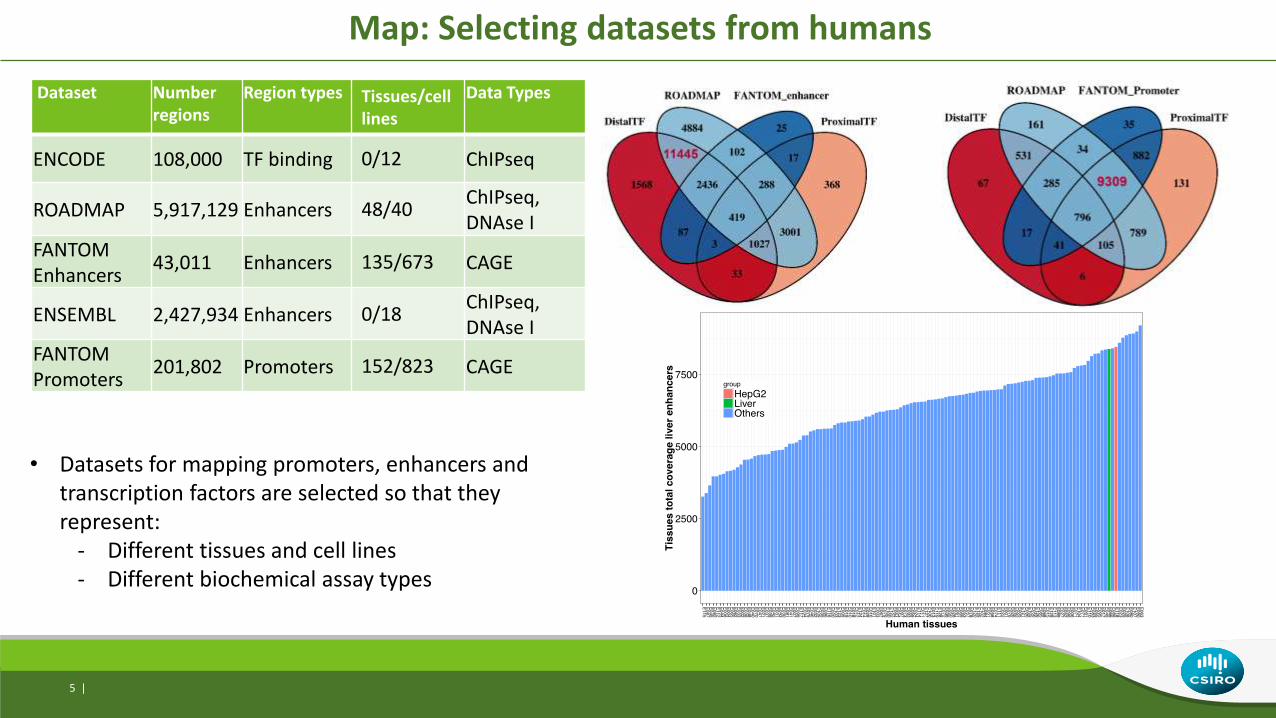
Dataset Number regions
Region types Tissues/cell lines
Data Types
ENCODE 108,000 TF binding 0/12 ChIPseq
ROADMAP 5,917,129 Enhancers 48/40ChIPseq, DNAse I
FANTOMEnhancers
43,011 Enhancers 135/673 CAGE
ENSEMBL 2,427,934 Enhancers 0/18ChIPseq, DNAse I
FANTOMPromoters
201,802 Promoters 152/823 CAGE
Map: Selecting datasets from humans
• Datasets for mapping promoters, enhancers and transcription factors are selected so that they represent:
- Different tissues and cell lines- Different biochemical assay types
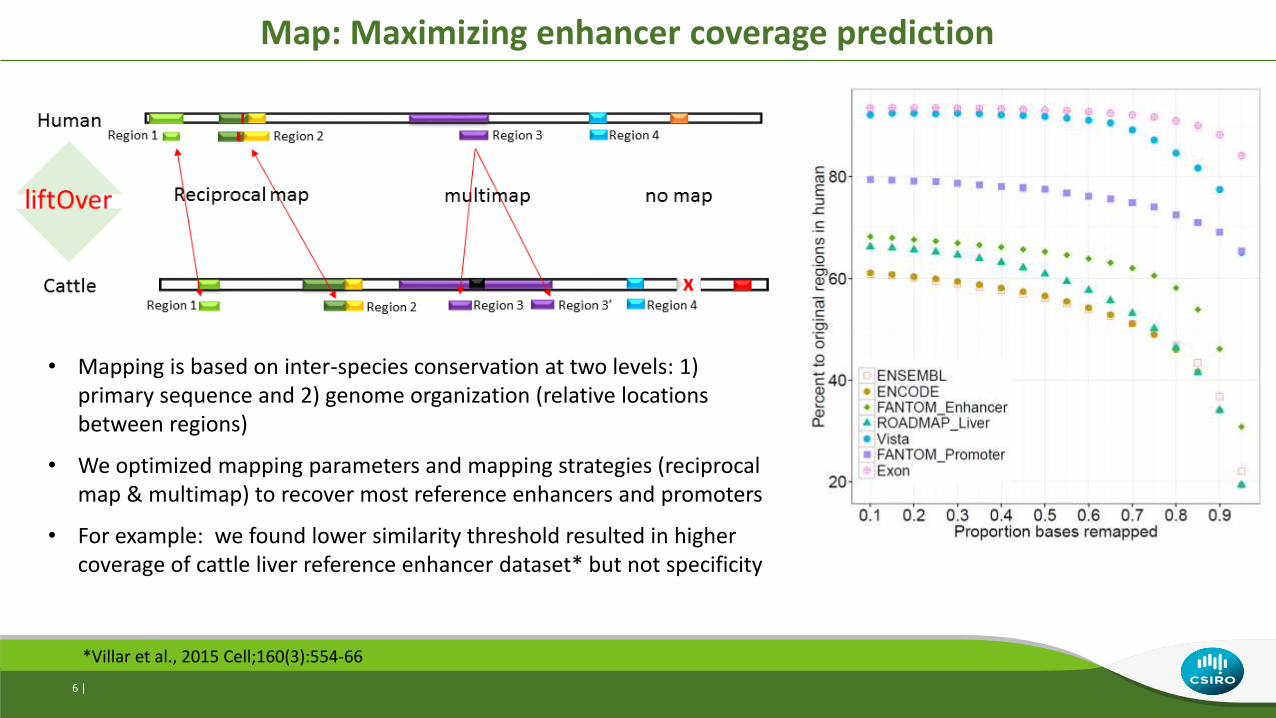
Map: Maximizing enhancer coverage prediction
*Villar et al., 2015 Cell;160(3):554-66
• Mapping is based on inter-species conservation at two levels: 1) primary sequence and 2) genome organization (relative locations between regions)
• We optimized mapping parameters and mapping strategies (reciprocal map & multimap) to recover most reference enhancers and promoters
• For example: we found lower similarity threshold resulted in higher coverage of cattle liver reference enhancer dataset* but not specificity
6 |
7 |
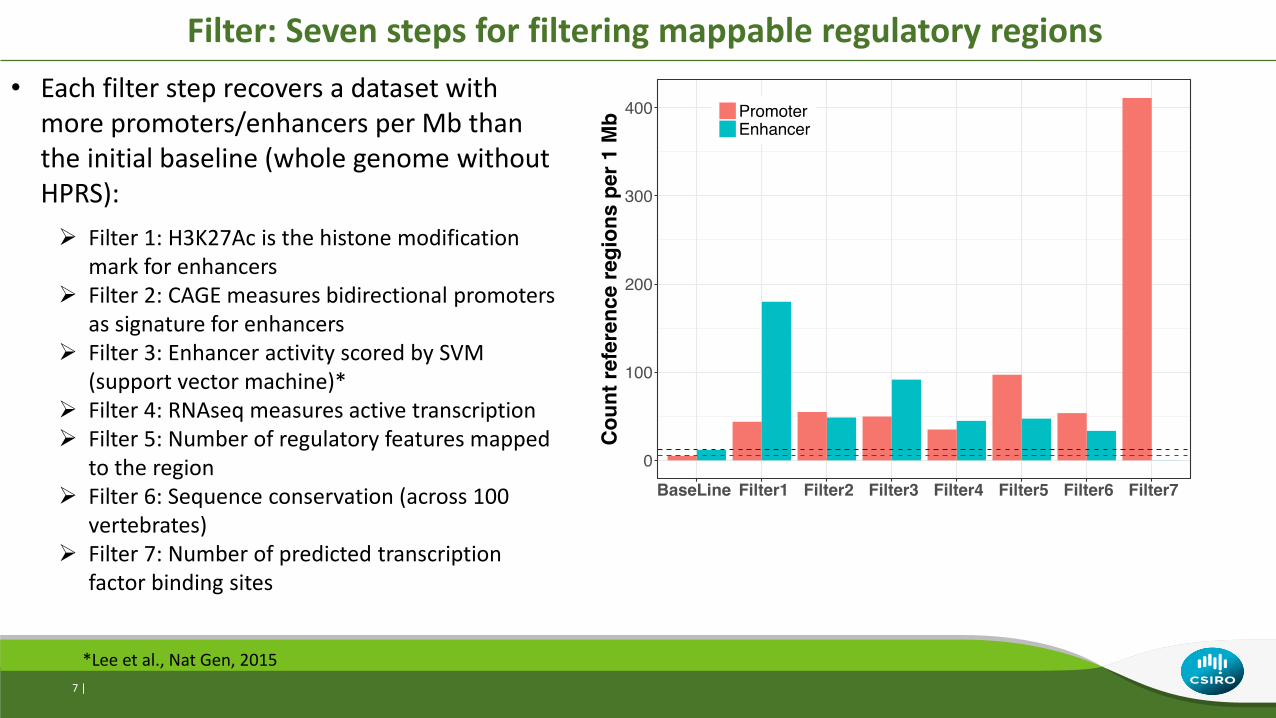
• Each filter step recovers a dataset with more promoters/enhancers per Mb than the initial baseline (whole genome without HPRS):
Filter 1: H3K27Ac is the histone modification mark for enhancers
Filter 2: CAGE measures bidirectional promoters as signature for enhancers
Filter 3: Enhancer activity scored by SVM (support vector machine)*
Filter 4: RNAseq measures active transcription Filter 5: Number of regulatory features mapped
to the region Filter 6: Sequence conservation (across 100
vertebrates) Filter 7: Number of predicted transcription
factor binding sites
Filter: Seven steps for filtering mappable regulatory regions
*Lee et al., Nat Gen, 2015
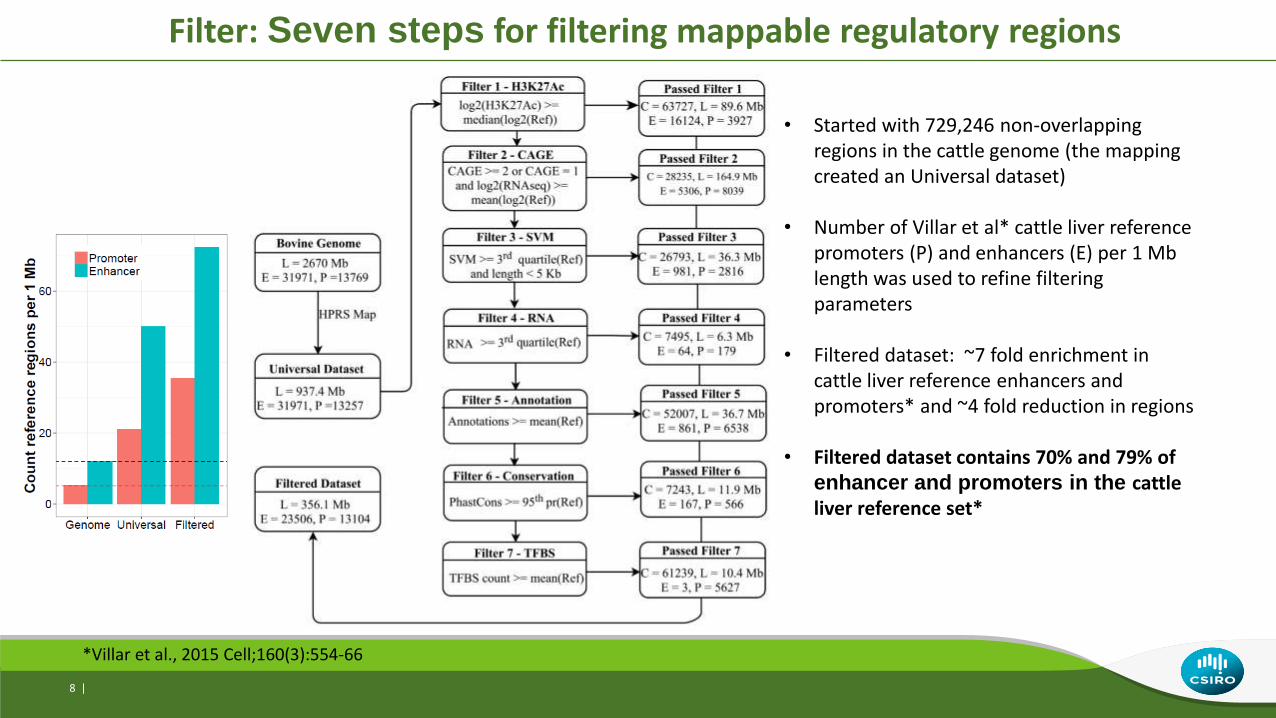
• Started with 729,246 non-overlapping regions in the cattle genome (the mapping created an Universal dataset)
• Number of Villar et al* cattle liver reference promoters (P) and enhancers (E) per 1 Mb length was used to refine filtering parameters
• Filtered dataset: ~7 fold enrichment in cattle liver reference enhancers and promoters* and ~4 fold reduction in regions
• Filtered dataset contains 70% and 79% of enhancer and promoters in the cattle liver reference set*
*Villar et al., 2015 Cell;160(3):554-66
8 |
Filter: Seven steps for filtering mappable regulatory regions
9 |
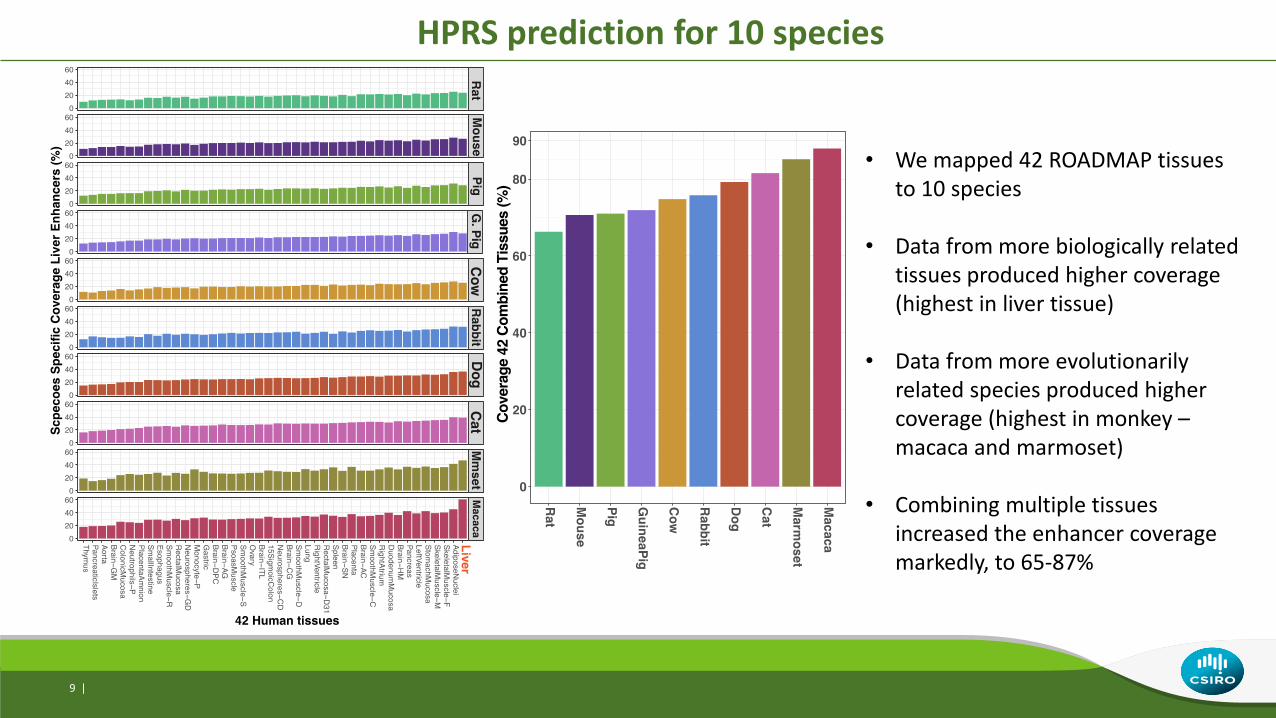
HPRS prediction for 10 species
• We mapped 42 ROADMAP tissues to 10 species
• Data from more biologically related tissues produced higher coverage (highest in liver tissue)
• Data from more evolutionarily related species produced higher coverage (highest in monkey –macaca and marmoset)
• Combining multiple tissues increased the enhancer coverage markedly, to 65-87%
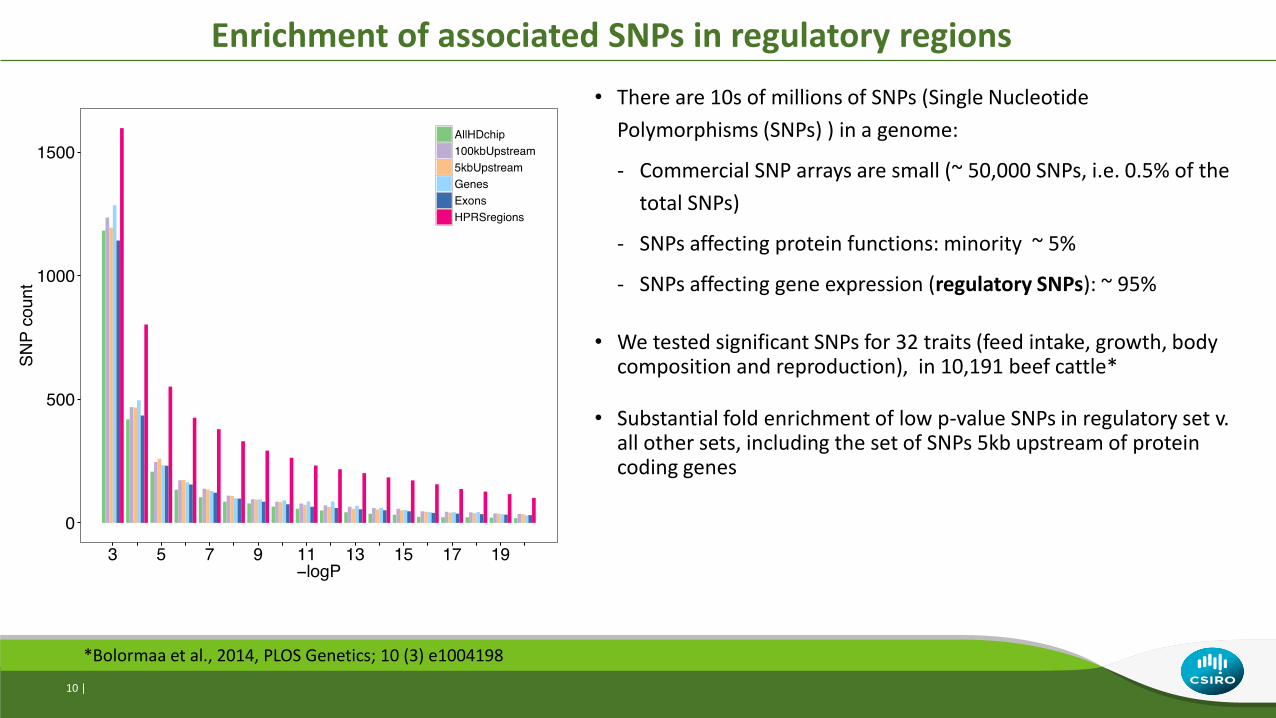
Enrichment of associated SNPs in regulatory regions
10 |
*Bolormaa et al., 2014, PLOS Genetics; 10 (3) e1004198
• There are 10s of millions of SNPs (Single Nucleotide
Polymorphisms (SNPs) ) in a genome:
- Commercial SNP arrays are small (~ 50,000 SNPs, i.e. 0.5% of the
total SNPs)
- SNPs affecting protein functions: minority ~ 5%
- SNPs affecting gene expression (regulatory SNPs): ~ 95%
• We tested significant SNPs for 32 traits (feed intake, growth, body composition and reproduction), in 10,191 beef cattle*
• Substantial fold enrichment of low p-value SNPs in regulatory set v. all other sets, including the set of SNPs 5kb upstream of protein coding genes
11 |
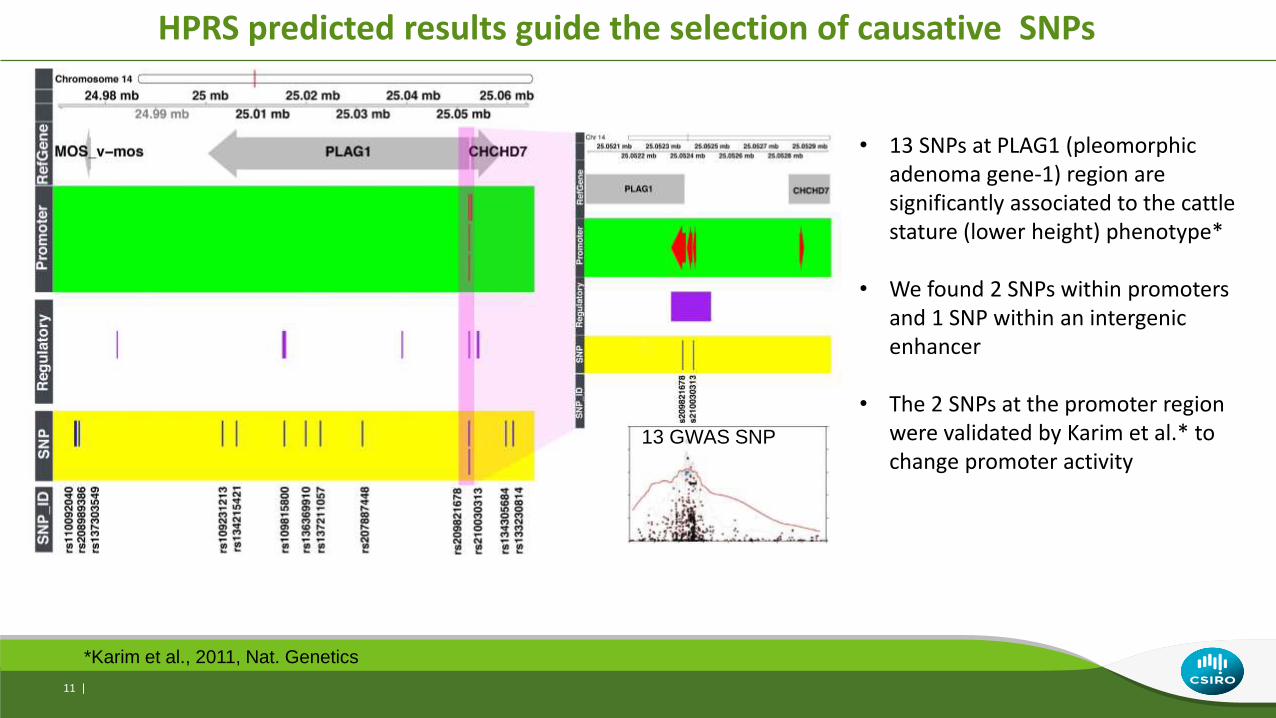
HPRS predicted results guide the selection of causative SNPs
13 GWAS SNP
*Karim et al., 2011, Nat. Genetics
• 13 SNPs at PLAG1 (pleomorphic adenoma gene-1) region are significantly associated to the cattle stature (lower height) phenotype*
• We found 2 SNPs within promoters and 1 SNP within an intergenic enhancer
• The 2 SNPs at the promoter region were validated by Karim et al.* to change promoter activity
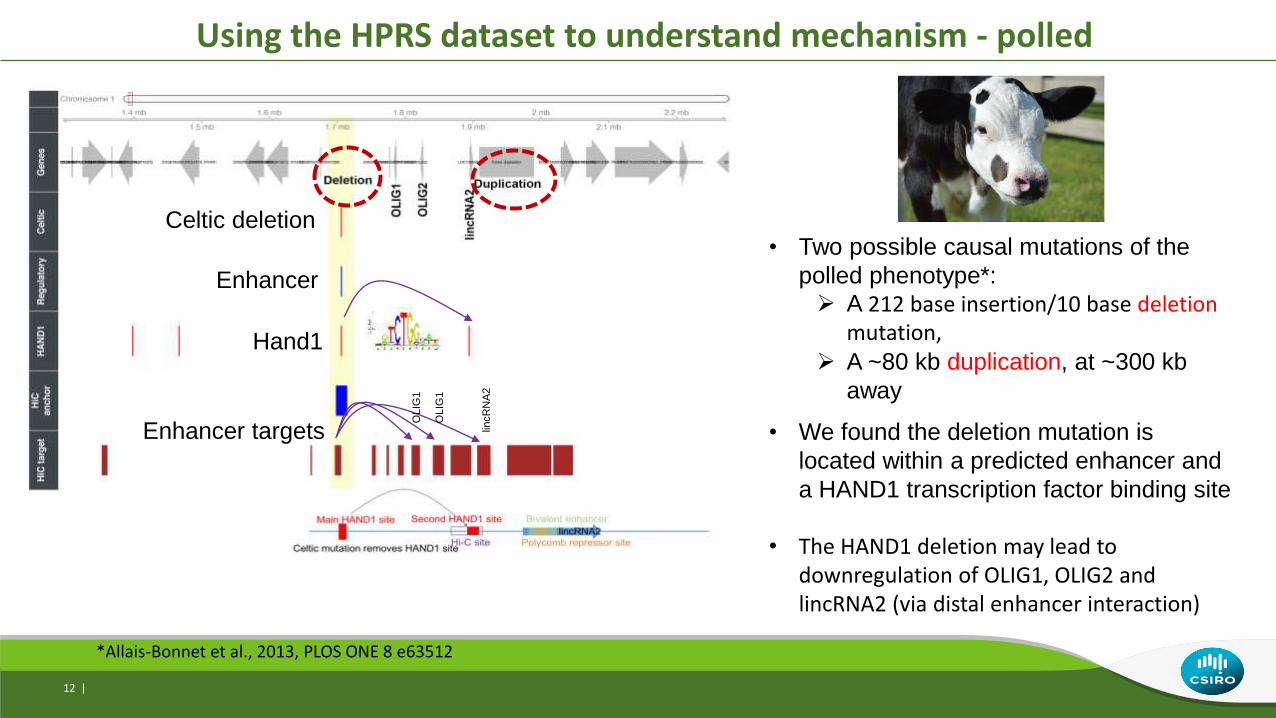
Using the HPRS dataset to understand mechanism - polled
12 |
• Two possible causal mutations of the
polled phenotype*:
A 212 base insertion/10 base deletion mutation,
A ~80 kb duplication, at ~300 kb
away
• We found the deletion mutation is
located within a predicted enhancer and
a HAND1 transcription factor binding site
• The HAND1 deletion may lead to downregulation of OLIG1, OLIG2 and lincRNA2 (via distal enhancer interaction)
Hand1
Celtic deletion
Enhancer
Enhancer targetsO
LIG
1
OLIG
1
lincR
NA
2
*Allais-Bonnet et al., 2013, PLOS ONE 8 e63512
Summary
1. The data in humans are useful to predict regulatory sequences in other species (by HPRS mapping and filtering pipelines)
2. HPRS is a fast and economical approach, applicable when most data in a target species are not available
3. SNPs significantly associated with phenotypes are enriched in the predicted regulatory sequences (more enriched than traditional SNP selection based on known coding regions)
4. HPRS results can contribute to genomics technology development, for instance: to design a new generation causative SNP chip for large-scale genotyping, or to predict regulatory targets as candidates for genome editing
13 |
Acknowledgements
• CSIRO:- Brian P. Dalrymple
- Juca Porto-Neto
- Ross L. Tellam
- James Kijas
- Bill Barendse
- Marina Naval-Sanchez
- Antonio Reverter
• QAFFI: Ben Hayes
• Funding: CSIRO OCE fellowship
14 |
St Lucia Campus, Brisbane, Australia
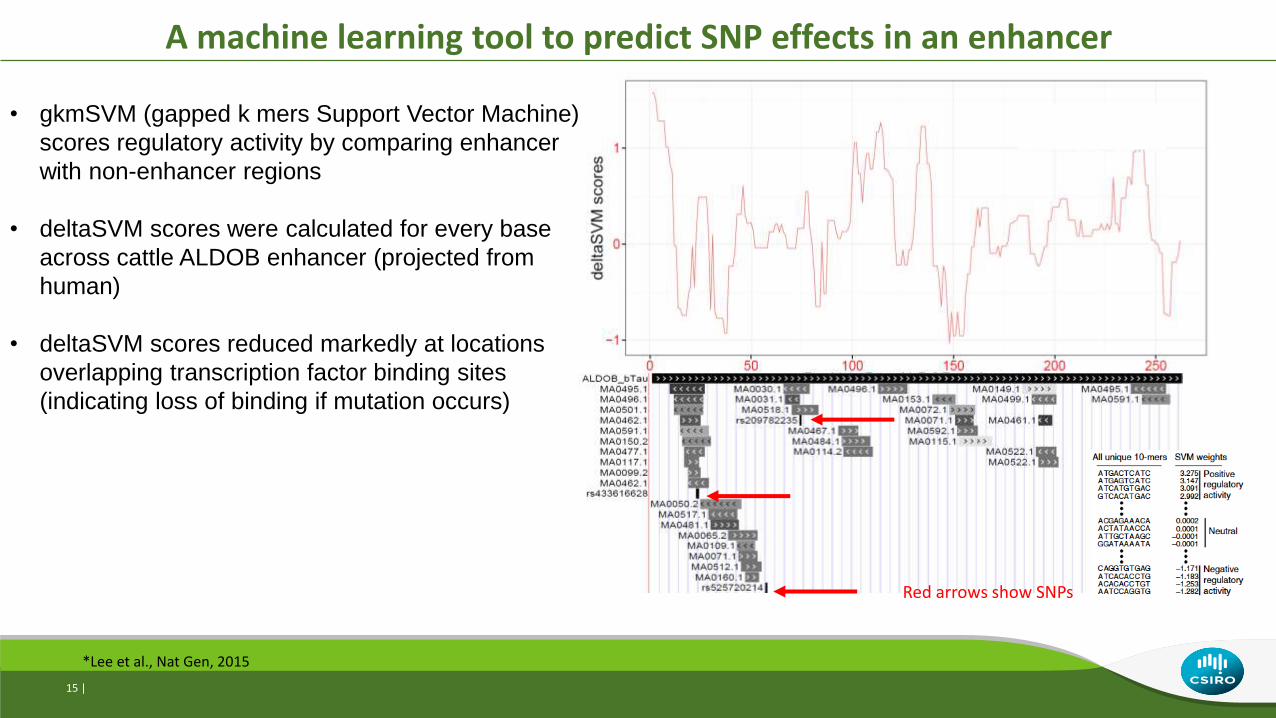
A machine learning tool to predict SNP effects in an enhancer
Red arrows show SNPs
• gkmSVM (gapped k mers Support Vector Machine)
scores regulatory activity by comparing enhancer
with non-enhancer regions
• deltaSVM scores were calculated for every base
across cattle ALDOB enhancer (projected from
human)
• deltaSVM scores reduced markedly at locations
overlapping transcription factor binding sites
(indicating loss of binding if mutation occurs)
15 |
*Lee et al., Nat Gen, 2015