Embed Size (px)
Citation preview
Patterns of political elite formation in Post Soviet
Armeniaresearch projectASCN Annual Conference 2012
June 30, Yerevan
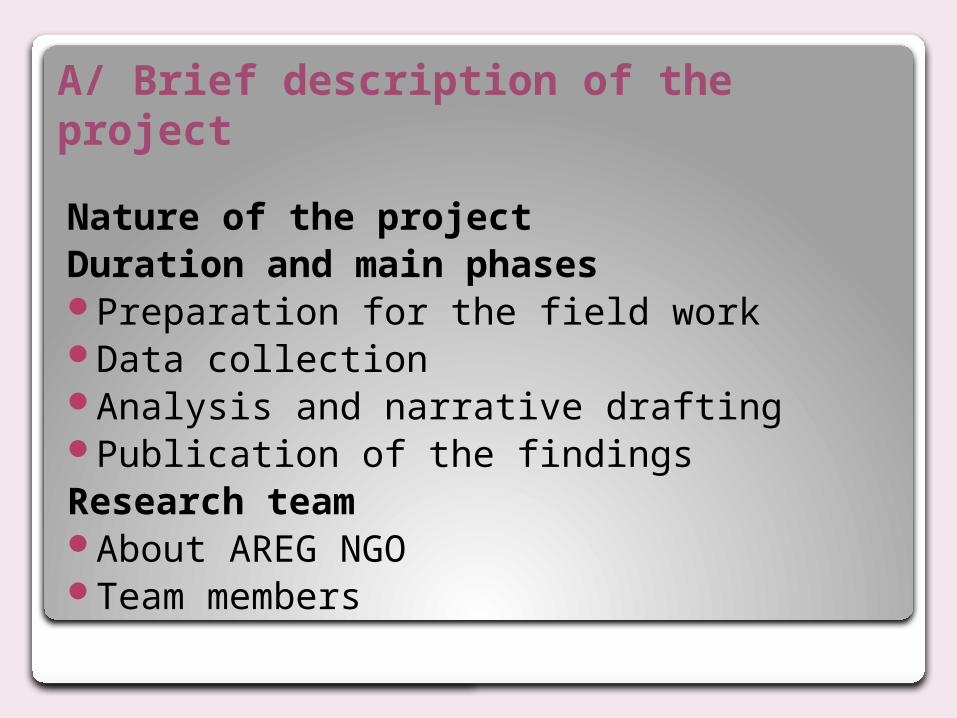
A/ Brief description of the project
Nature of the projectDuration and main phasesPreparation for the field workData collectionAnalysis and narrative draftingPublication of the findingsResearch teamAbout AREG NGOTeam members
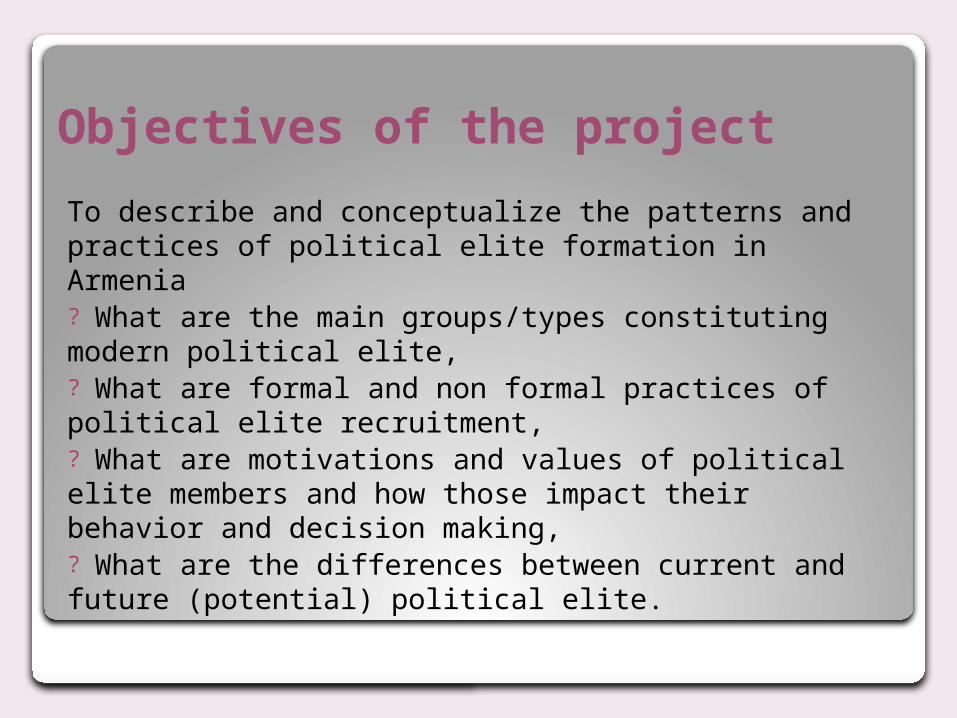
Objectives of the project
To describe and conceptualize the patterns and practices of political elite formation in Armenia? What are the main groups/types constituting modern political elite,? What are formal and non formal practices of political elite recruitment,? What are motivations and values of political elite members and how those impact their behavior and decision making,? What are the differences between current and future (potential) political elite.
Definition of political elite
Approaches to identify and analyze political elites:Decisional ReputationalPositional or institutional
Within our project political elite consists of elected and appointed officials both on the national and local levels.
MethodologyResearch was designed to utilize both qualitative and quantitative methods. Survey In depth interviews Analysis of biographies Content analysis
Data collection (first year)
Representative targeted survey implemented via standardized face-to-face interviews with 700 representatives of potential political elite, RA and NKR,
Beginning of biographical data collection of past and current officials (over 1000),
In-depth interviews with 65 representatives of political elite in Armenia and Karabakh.
Data collection (second year)
Biographical data collection of past and current officials,,
Analysis of legal-institutional framework of recruiting political elite members,
Analysis of speeches, interviews and other materials relevant for studying informal practices of political elite recruitment (besides information collected through in depth interviews).
Expected results
A separate book/collection of papers,
Rich data available both to scholars and public policy practitioners,
Improved research skills.
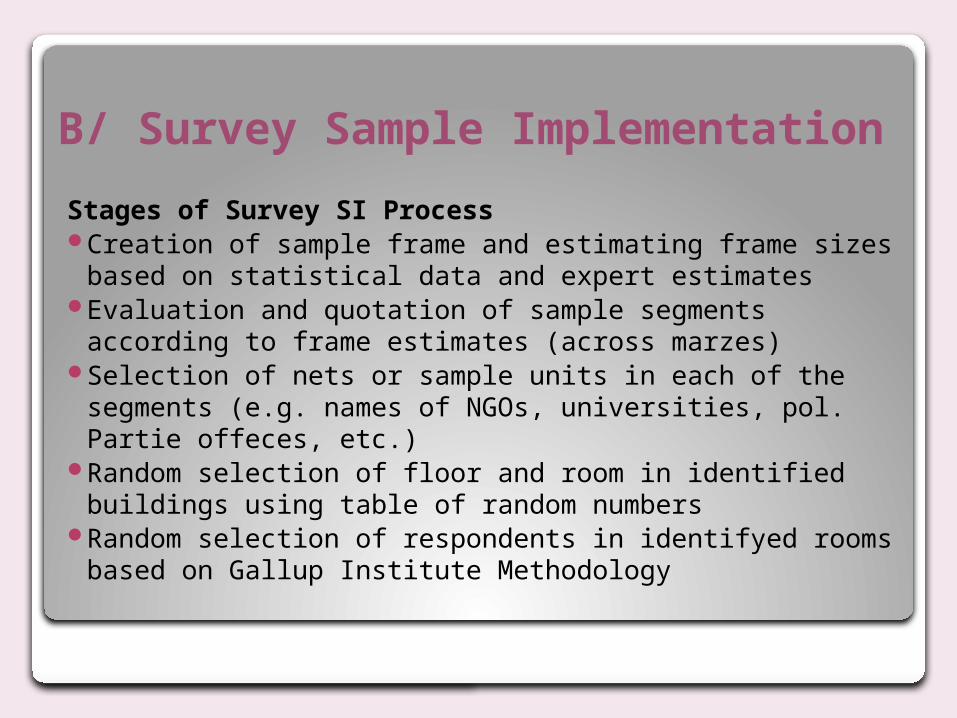
B/ Survey Sample Implementation
Stages of Survey SI Process Creation of sample frame and estimating frame sizes
based on statistical data and expert estimatesEvaluation and quotation of sample segments
according to frame estimates (across marzes)Selection of nets or sample units in each of the
segments (e.g. names of NGOs, universities, pol. Partie offeces, etc.)
Random selection of floor and room in identified buildings using table of random numbers
Random selection of respondents in identifyed rooms based on Gallup Institute Methodology
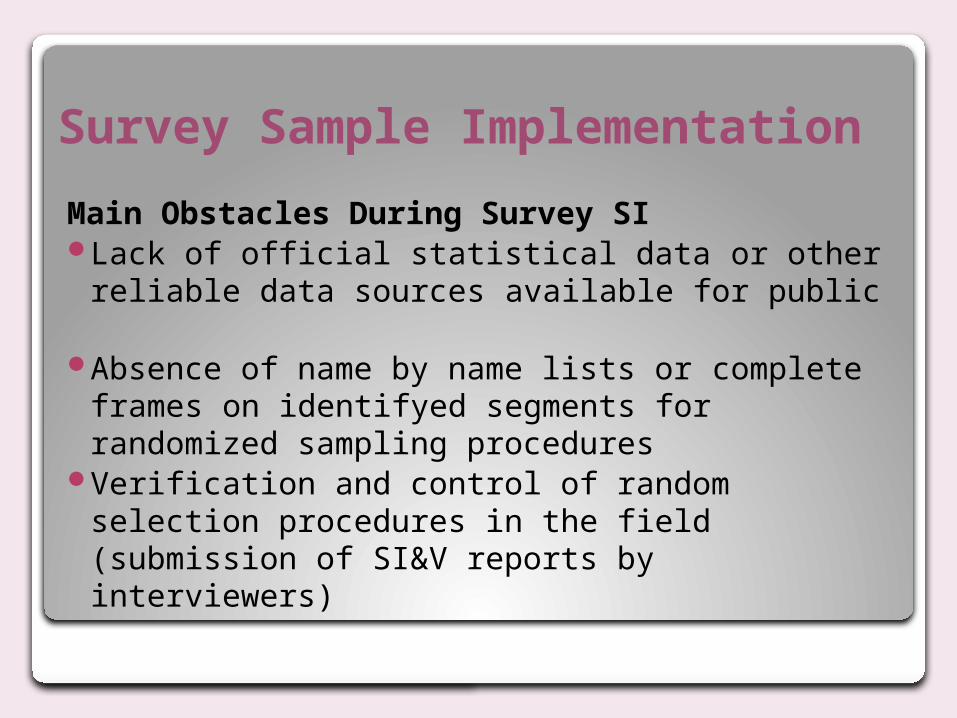
Survey Sample Implementation
Main Obstacles During Survey SI Lack of official statistical data or other
reliable data sources available for public Absence of name by name lists or complete
frames on identifyed segments for randomized sampling procedures
Verification and control of random selection procedures in the field (submission of SI&V reports by interviewers)
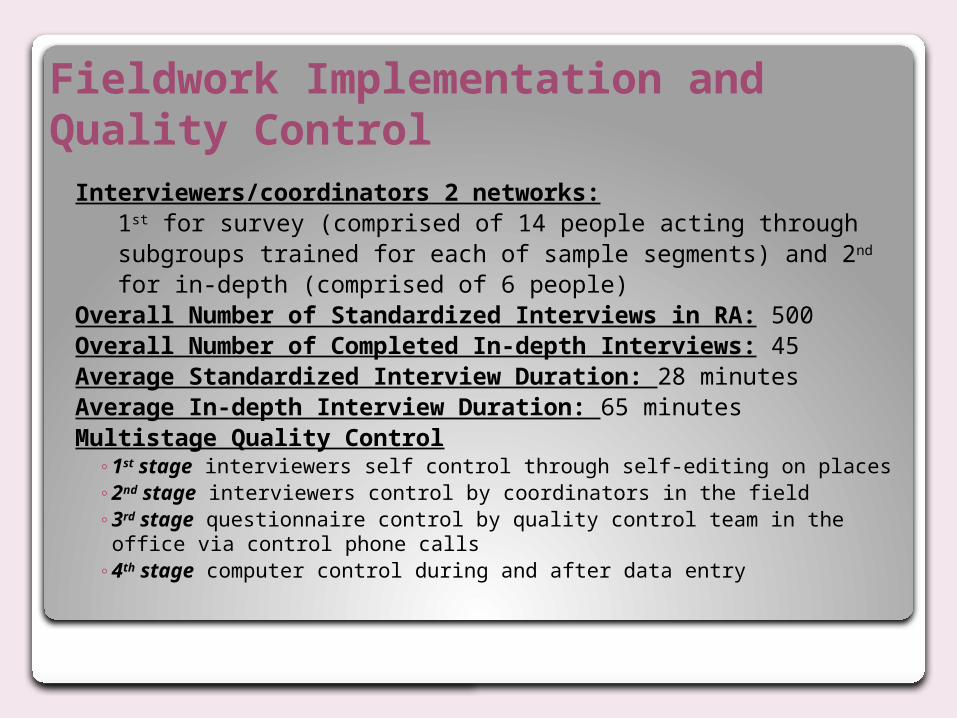
Fieldwork Implementation and Quality Control
Interviewers/coordinators 2 networks: 1st for survey (comprised of 14 people acting through subgroups trained for each of sample segments) and 2nd for in-depth (comprised of 6 people)Overall Number of Standardized Interviews in RA: 500Overall Number of Completed In-depth Interviews: 45Average Standardized Interview Duration: 28 minutesAverage In-depth Interview Duration: 65 minutesMultistage Quality Control
◦ 1st stage interviewers self control through self-editing on places◦ 2nd stage interviewers control by coordinators in the field◦ 3rd stage questionnaire control by quality control team in the office via
control phone calls◦ 4th stage computer control during and after data entry
Fieldwork Implementation and Quality Control
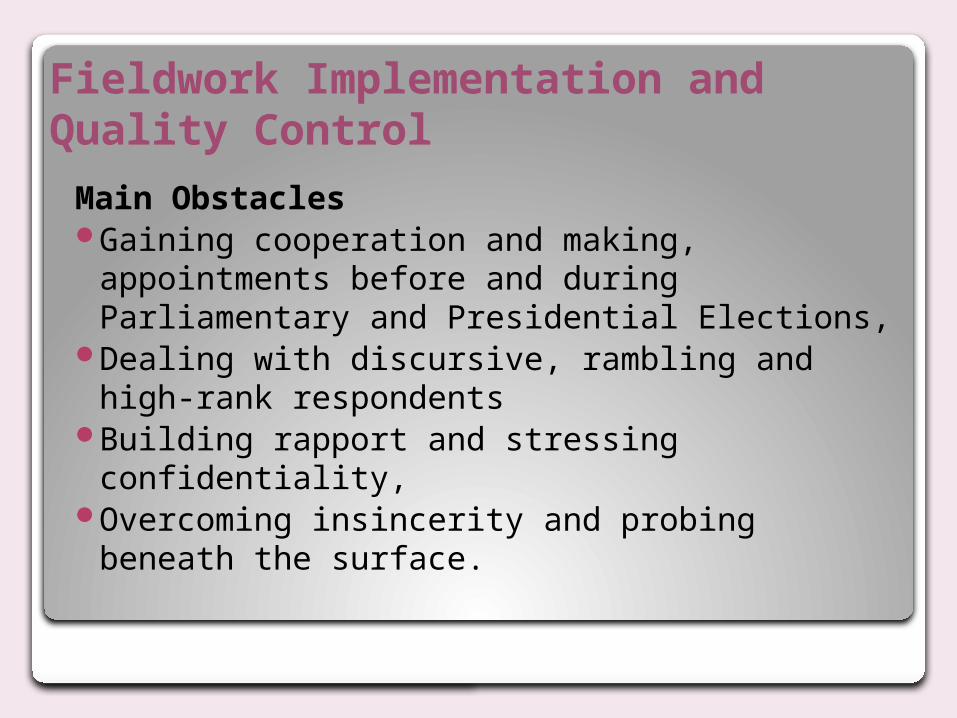
Main ObstaclesGaining cooperation and making,
appointments before and during Parliamentary and Presidential Elections,
Dealing with discursive, rambling and high-rank respondents
Building rapport and stressing confidentiality,
Overcoming insincerity and probing beneath the surface.
Fieldwork Implementation and Quality Control
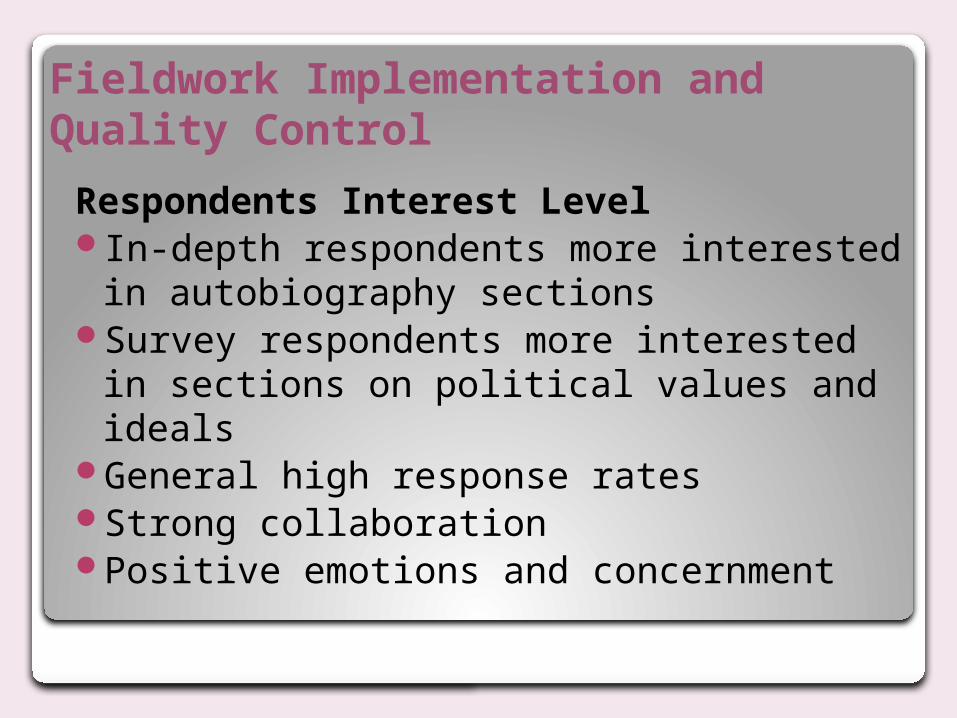
Respondents Interest Level In-depth respondents more interested in
autobiography sections Survey respondents more interested in
sections on political values and idealsGeneral high response rates Strong collaborationPositive emotions and concernment
C/ Findings of the Survey
“A good career is a long-lasting career. When you're there in every competition doing a good job you're a part of an elite, and that's the most important thing.”
Blanka Vlasic
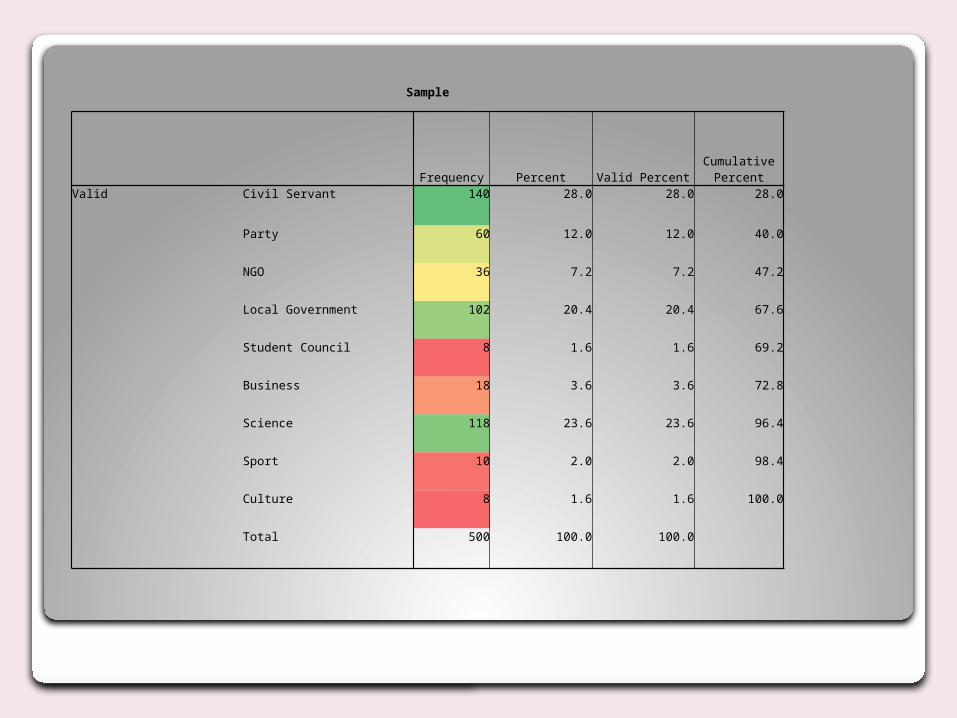
Sample
Frequency Percent Valid PercentCumulative
PercentValid Civil Servant 140 28.0 28.0 28.0
Party 60 12.0 12.0 40.0
NGO 36 7.2 7.2 47.2
Local Government 102 20.4 20.4 67.6
Student Council 8 1.6 1.6 69.2
Business 18 3.6 3.6 72.8
Science 118 23.6 23.6 96.4
Sport 10 2.0 2.0 98.4
Culture 8 1.6 1.6 100.0
Total 500 100.0 100.0
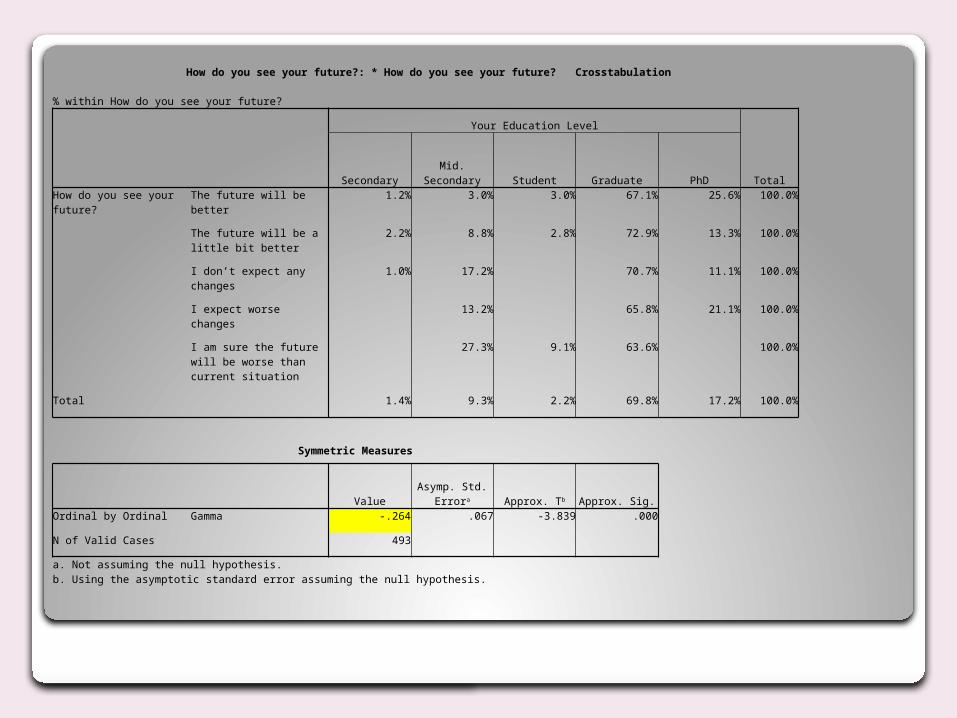
How do you see your future?: * How do you see your future? Crosstabulation
% within How do you see your future?
Your Education Level
TotalSecondary Mid. Secondary Student Graduate PhDHow do you see your future? The future will be better 1.2% 3.0% 3.0% 67.1% 25.6% 100.0%
The future will be a little bit better
2.2% 8.8% 2.8% 72.9% 13.3% 100.0%
I don’t expect any changes 1.0% 17.2%
70.7% 11.1% 100.0%
I expect worse changes
13.2%
65.8% 21.1% 100.0%
I am sure the future will be worse than current situation
27.3% 9.1% 63.6%
100.0%
Total 1.4% 9.3% 2.2% 69.8% 17.2% 100.0%
Symmetric Measures
Value
Asymp. Std. Errora Approx. Tb Approx. Sig.
Ordinal by Ordinal Gamma -.264 .067 -3.839 .000
N of Valid Cases 493
a. Not assuming the null hypothesis.b. Using the asymptotic standard error assuming the null hypothesis.
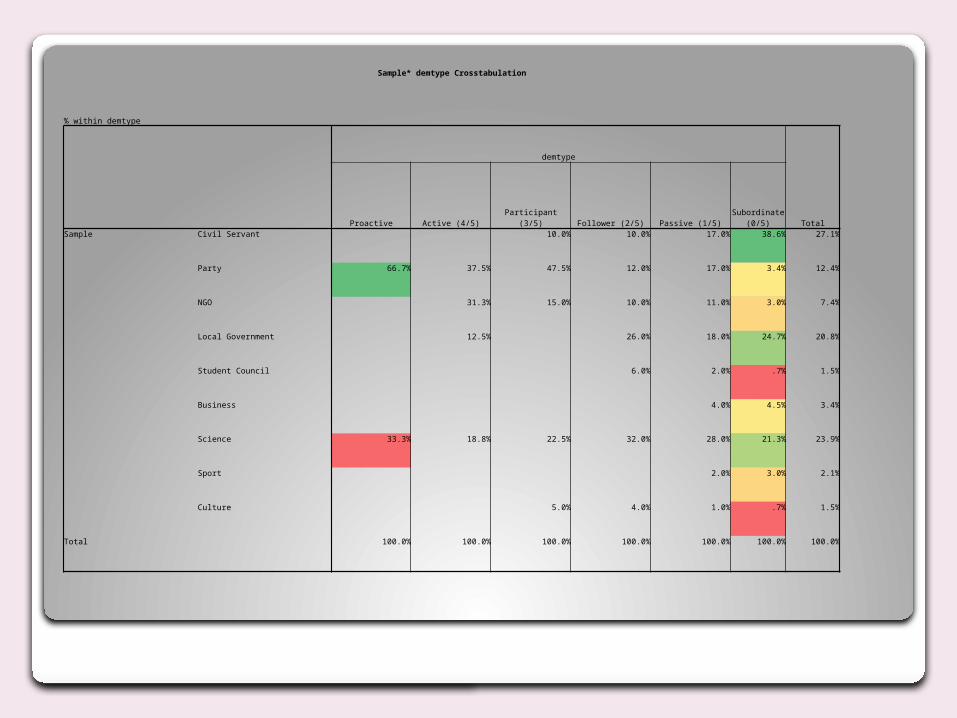
Sample* demtype Crosstabulation
% within demtype
demtype
TotalProactive Active (4/5) Participant (3/5) Follower (2/5) Passive (1/5)Subordinate
(0/5)Sample Civil Servant
10.0% 10.0% 17.0% 38.6% 27.1%
Party 66.7% 37.5% 47.5% 12.0% 17.0% 3.4% 12.4%
NGO
31.3% 15.0% 10.0% 11.0% 3.0% 7.4%
Local Government
12.5%
26.0% 18.0% 24.7% 20.8%
Student Council
6.0% 2.0% .7% 1.5%
Business
4.0% 4.5% 3.4%
Science 33.3% 18.8% 22.5% 32.0% 28.0% 21.3% 23.9%
Sport
2.0% 3.0% 2.1%
Culture
5.0% 4.0% 1.0% .7% 1.5%
Total 100.0% 100.0% 100.0% 100.0% 100.0% 100.0% 100.0%
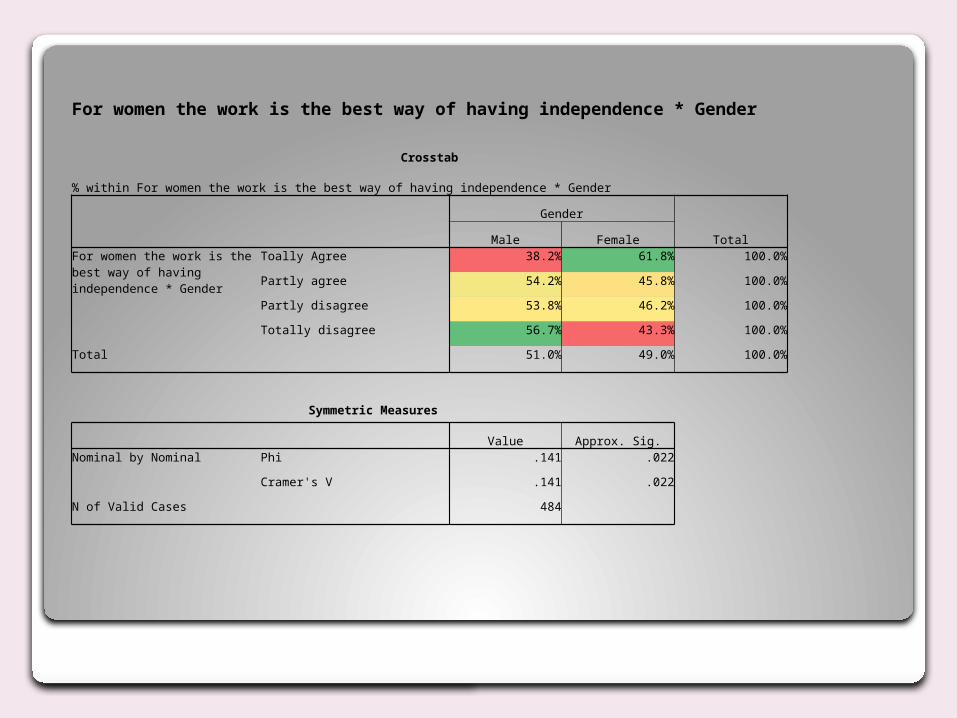
For women the work is the best way of having independence * Gender
Crosstab
% within For women the work is the best way of having independence * Gender
Gender
TotalMale FemaleFor women the work is the best way of having independence * Gender
Toally Agree 38.2% 61.8% 100.0%
Partly agree 54.2% 45.8% 100.0%
Partly disagree 53.8% 46.2% 100.0%
Totally disagree 56.7% 43.3% 100.0%
Total 51.0% 49.0% 100.0%
Symmetric Measures
Value Approx. Sig.Nominal by Nominal Phi .141 .022
Cramer's V .141 .022
N of Valid Cases 484
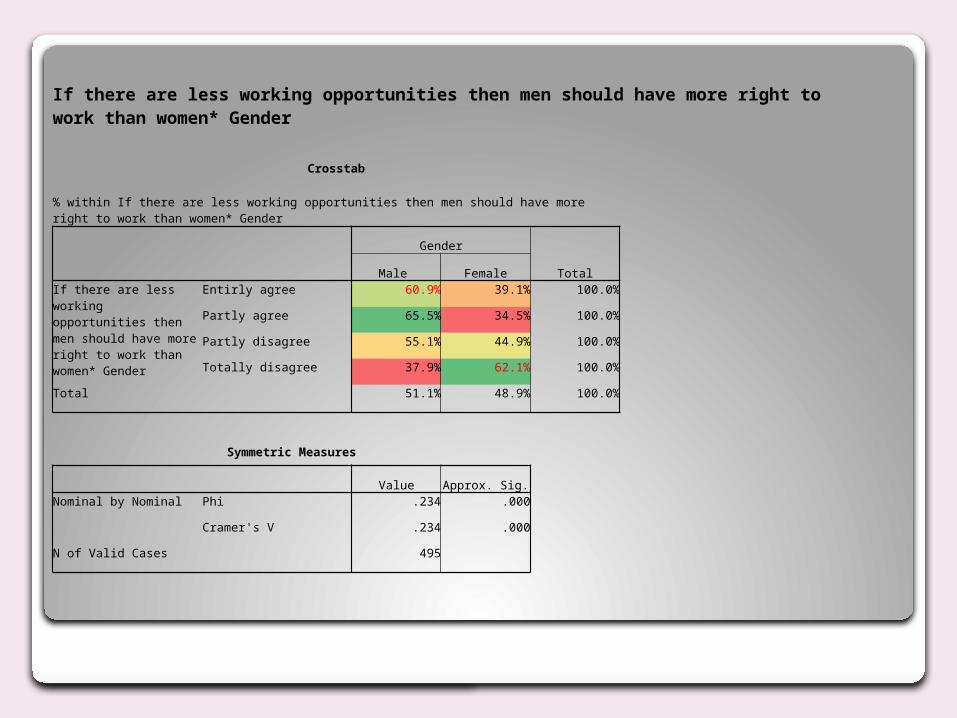
If there are less working opportunities then men should have more right to work than women* Gender
Crosstab
% within If there are less working opportunities then men should have more right to work than women* Gender
Gender
TotalMale FemaleIf there are less working opportunities then men should have more right to work than women* Gender
Entirly agree 60.9% 39.1% 100.0%
Partly agree 65.5% 34.5% 100.0%
Partly disagree 55.1% 44.9% 100.0%
Totally disagree 37.9% 62.1% 100.0%
Total 51.1% 48.9% 100.0%
Symmetric Measures
Value Approx. Sig.Nominal by Nominal Phi .234 .000
Cramer's V .234 .000
N of Valid Cases 495
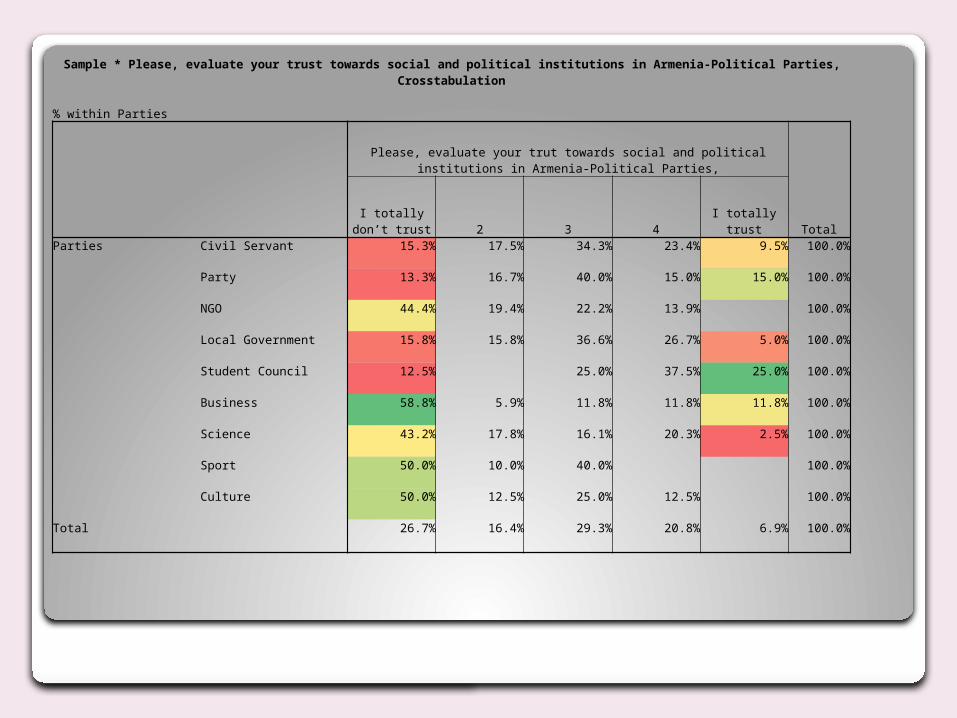
Sample * Please, evaluate your trust towards social and political institutions in Armenia-Political Parties, Crosstabulation
% within Parties
Please, evaluate your trut towards social and political institutions in Armenia-Political Parties,
TotalI totally don’t
trust 2 3 4 I totally trustParties Civil Servant 15.3% 17.5% 34.3% 23.4% 9.5% 100.0%
Party 13.3% 16.7% 40.0% 15.0% 15.0% 100.0%
NGO 44.4% 19.4% 22.2% 13.9%
100.0%
Local Government 15.8% 15.8% 36.6% 26.7% 5.0% 100.0%
Student Council 12.5%
25.0% 37.5% 25.0% 100.0%
Business 58.8% 5.9% 11.8% 11.8% 11.8% 100.0%
Science 43.2% 17.8% 16.1% 20.3% 2.5% 100.0%
Sport 50.0% 10.0% 40.0%
100.0%
Culture 50.0% 12.5% 25.0% 12.5%
100.0%
Total 26.7% 16.4% 29.3% 20.8% 6.9% 100.0%
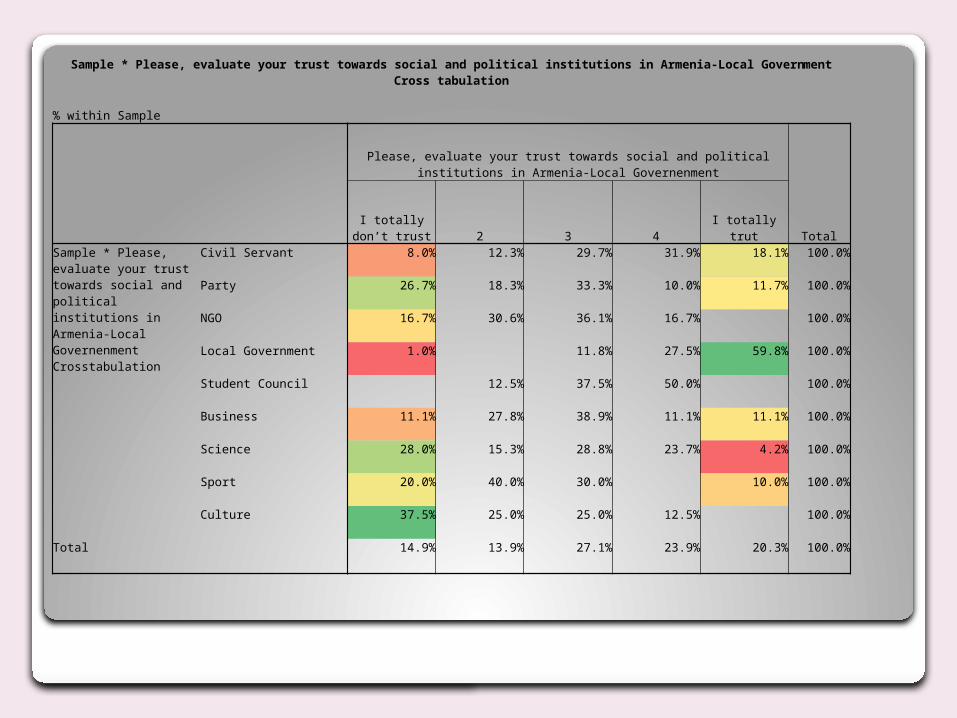
Sample * Please, evaluate your trust towards social and political institutions in Armenia-Local Government Cross tabulation
% within Sample
Please, evaluate your trust towards social and political institutions in Armenia-Local Governenment
TotalI totally don’t
trust 2 3 4 I totally trutSample * Please, evaluate your trust towards social and political institutions in Armenia-Local Governenment Crosstabulation
Civil Servant 8.0% 12.3% 29.7% 31.9% 18.1% 100.0%
Party 26.7% 18.3% 33.3% 10.0% 11.7% 100.0%
NGO 16.7% 30.6% 36.1% 16.7%
100.0%
Local Government 1.0%
11.8% 27.5% 59.8% 100.0%
Student Council
12.5% 37.5% 50.0%
100.0%
Business 11.1% 27.8% 38.9% 11.1% 11.1% 100.0%
Science 28.0% 15.3% 28.8% 23.7% 4.2% 100.0%
Sport 20.0% 40.0% 30.0%
10.0% 100.0%
Culture 37.5% 25.0% 25.0% 12.5%
100.0%
Total 14.9% 13.9% 27.1% 23.9% 20.3% 100.0%
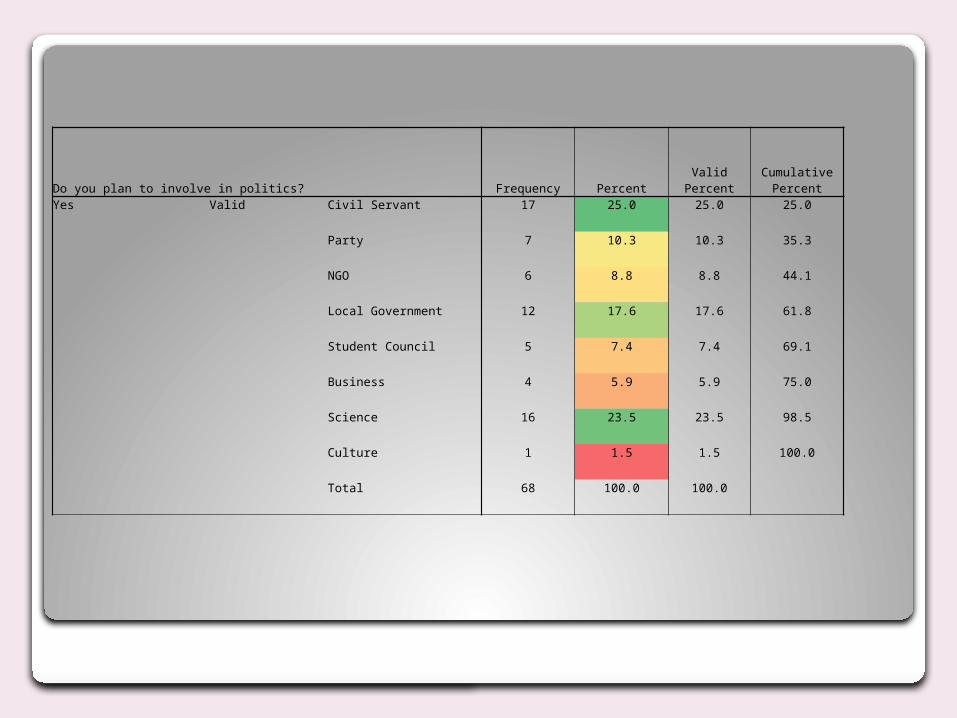
Do you plan to involve in politics? Frequency Percent Valid PercentCumulative
PercentYes Valid Civil Servant 17 25.0 25.0 25.0
Party 7 10.3 10.3 35.3
NGO 6 8.8 8.8 44.1
Local Government 12 17.6 17.6 61.8
Student Council 5 7.4 7.4 69.1
Business 4 5.9 5.9 75.0
Science 16 23.5 23.5 98.5
Culture 1 1.5 1.5 100.0
Total 68 100.0 100.0
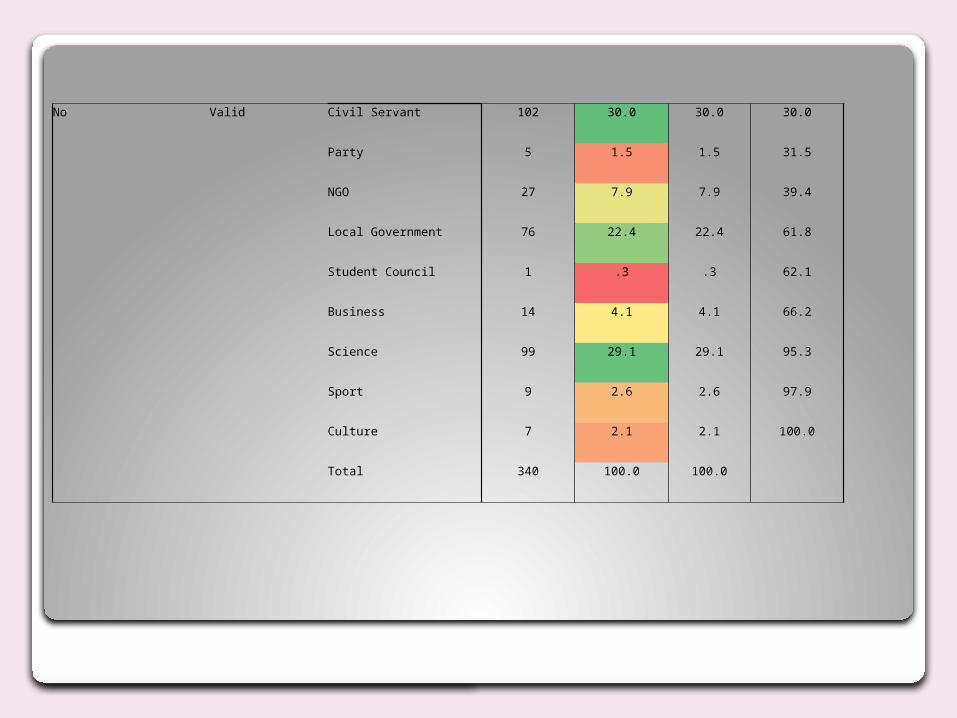
No Valid Civil Servant 102 30.0 30.0 30.0
Party 5 1.5 1.5 31.5
NGO 27 7.9 7.9 39.4
Local Government 76 22.4 22.4 61.8
Student Council 1 .3 .3 62.1
Business 14 4.1 4.1 66.2
Science 99 29.1 29.1 95.3
Sport 9 2.6 2.6 97.9
Culture 7 2.1 2.1 100.0
Total 340 100.0 100.0
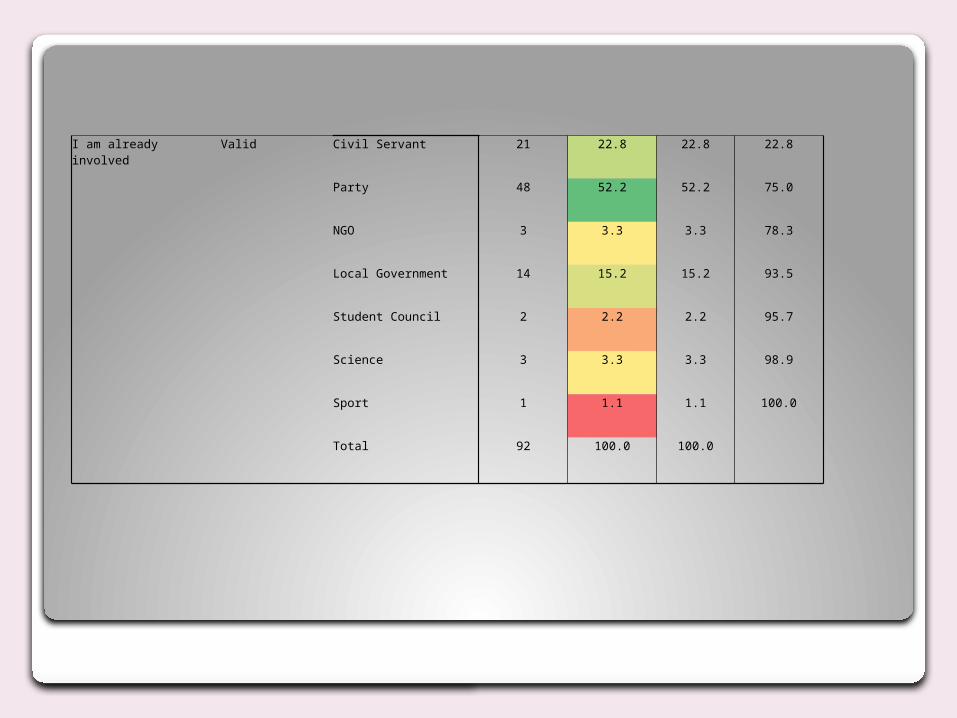
I am already involved Valid Civil Servant 21 22.8 22.8 22.8
Party 48 52.2 52.2 75.0
NGO 3 3.3 3.3 78.3
Local Government 14 15.2 15.2 93.5
Student Council 2 2.2 2.2 95.7
Science 3 3.3 3.3 98.9
Sport 1 1.1 1.1 100.0
Total 92 100.0 100.0
Who are the possible elite representatives?
Conclusion According to the research data, the
possible elite representative is a man, who has high degree of education, is a party member or civil servant, he has low degree of trust towards political and social institutions in Armenia, but at the same time he is not planning to change the situation.